Modeling, assessment, and optimization of urban sustainability using probabilistic system dynamics
Maozhi Wu
1
,
Jiaqi Wang
2

,
Yan Zhang
3,*
,
Limao Zhang
2
*Correspondence to:
Yan Zhang, School of Civil and Environmental Engineering, Nanyang Technological University, 50 Nanyang Avenue, Singapore 639798, Singapore.
E-mail: YAN007@e.ntu.edu.sg
J Build Des Environ. 2023;1:8993. 10.37155/2811-0730-0101-5
Received: August 24, 2023Accepted: September 21, 2023Published: November 10, 2023
Abstract
Urban sustainable development of cities could ameliorate many aspects such as population expansion, housing price increase, and ecological environment. For a better understanding of urban sustainability, many scholars have conducted different frameworks to make an accurate evaluation for urban planning. However, a myriad of existing research analyzes sustainable development based on separate and static indicts, which inevitably miss some important information related to interconnects between different indicators and timelines. This study, thus, proposes a comprehensive method that integrates the system dynamic and Monte Carlo sensitivity analysis to examine the interrelationships between different subsystems with a time series, in order to predict the feasibility of new policies for future development. A probabilistic system dynamics approach for policy optimization of sustainable urbanization is proposed with the consideration of dynamic changes and time flows. Several scenarios are simulated to perform and validate the proposed framework, where the comparisons from different results provide optimal strategies for urban sustainability. Some interesting findings can be drawn: (1) the social system is more sensitive to policy change, typically for transport connections and traffic saturation flow respects; (2) policies A1, B1, and B2 are encouraged to implement, as these regulations will boost the urban development; (3) the proposed hybrid method can be used to analyze the variables with a dynamic and long-term urban system.
Keywords
Policy implementation, urban sustainable development, system dynamic, Monte Carlo simulation, optimization.
1. Introduction
How to accomplish sustainable urbanization has been regarded as the main issue in the urban planning domain. To satisfy human activities, the extensive territorial growth of land space and the consumption of natural resources becomes a big challenge from both environmental and social perspectives. To improve inhabitants with better good quality of life, governments have to overcome great obstacles every time to balance the benefits and damages by enacting policies and regulations. Sustainable development as a multidimensional concept that involves social, economic, and environmental aspects attracts attention from both scientists and policymakers.
Owing to the complexity of the urban system, policy implementation is one of the central concepts that influence urban sustainability[1]. Numerous cities have made efforts to achieve urban sustainable development by enacting regulations or offering subsidies. Traditional methods normally analyze urban sustainability from three individual pillars, such as the social, economic, and environmental sectors. For example, Santoyo Castelazo and Azapagic[1] considered these three dimensions and proposed a decision-support framework to assess the outcomes of the informed decision or published policy. Wang and Peng[2] conducted a fuzzy multi-criteria decision analysis to quantify the safety, fairness, resources, and environmental aspects. However, the separation of environment, society, and economy often leads to a narrow result of the entire ecological urban system. These three major dimensions cannot be completely independent, and their interrelationships should be taken into consideration in terms of assessing the entire urban system. Fan et al.[3] developed two subsystems of social economy and ecological environment varied in 31 provincial capital cities for promoting ecological civilization construction and sustainable development. In addition, the economic section is often given priority in policy making and the environmental section is deemed as an important part of human’s daily life. Zhu et al.[4] stated they are connected, where the economy relies on the society and environment. Meanwhile, the environment is a cradle for human society and economic development.
Recent studies not only refine the basic three aspects but also discuss their interactions, including the socio-economic, economic-environmental, and socio-environmental issues. Hassan and Lee[5] summarized ten aspects that are highly relevant to sustainable development, including urban sprawl, transportation, mitigating greenhouse gases, vegetation area, etc. Turcu[6] presented the intersection between sustainability indicators and examined the priority of different characteristics. Nevertheless, few studies analyze the uncertainty of the policies in urban sustainability with predictive perspectives and dynamic circumstances. Liu et al.[7] developed an optimization method with several scenarios to handle watershed management under uncertainty techniques and policies. Zhou[8] proposed some strategies and policies based on the fuzzy sets theory to mitigate the conflicts under various environmental and socio-economic conditions. Although preliminary studies enlighten and provide some approaches for urban sustainable development, few researchers focus on the interaction between different policies and predict their effectiveness.
Monte Carlo (MC) technique, also known as multivariate sensitivity simulation, is used to simulate the input data by using probability distribution to describe and reduce uncertainties during the characterization and measurement of input factors. This study employs the MC method due to its two main advantages. The first is the MC technique performs accurate sensitivity indicators within a small sample size of the database. In addition, the simulation process acts as a black box to predict the output. However, the MC method is rarely employed in sustainability assessment. Though Peng et al.[9] proposed a conceptual model based on the fuzzy set theory and Monte Carlo simulation. The lack of prediction of the police implementation may face huge challenges for urban sustainability practices with the aim of global promotion.
To fill these gaps, this study establishes a system dynamic model to forecast the feasibility and influence of the potential policies under different situations. System dynamic (SD) modeling has been employed for interpreting relationships among the three different systems with its feedback loops. Besides, the optimized results provide some solutions to accelerate sustainable urban development and reduce or eliminate social, economic, and environmental problems by using SD. Furthermore, MC multivariate sensitivity is operated for identifying the greatest influence policies that can be defined as the most efficient strategies for implementing urban sustainable development. This study mainly contributes: (1) to perfect the model formulation by recognizing the most sensitive variables in the model; (2) to investigate how uncertainty affects the assessment under different policies; (3) to optimize the robust strategies that could be considered as sustainable policies implemented by local authorities.
The rest of the paper is organized as follows. Section 2 reviews the related studies about urban sustainability modeling and assessment. Section 3 elaborates on the flow work of the proposed method, from system dynamic model, and Monte Carlo simulation to Optimization. Section 4 breaks down the entire system and makes an in-depth review of each subsystem. Based on the sensitivity analysis, the optimization task is conducted to reflect how the policy would affect the three systems. Section 5 discusses the optimized result and identifies which policy should be encouraged. Section 6 concludes and suggests future works.
2. Related Studies
Modeling and assessment of urban sustainability is crucial for helping with target setting, performance reviews, and facilitating communication among the policymakers, experts, and general public[10]. As a result, many methods are proposed for urban sustainability indicator selection, which is an initial step and an essential part of determining the accuracy of the assessment result. A wide range of urban sustainability indicators is therefore in use across the diversity of different cities and regions, which vary according to their particular needs and goals[11]. Shen et al.[12] made a comprehensive list of sustainable urbanization indicators, namely the International Urban Sustainability Indicators List, where more than one hundred indicators are divided into six sets and 37 groups. Several frameworks and approaches used to analyze urban sustainability based on indicators have been developed. Ugwu and Haupt[13] examined available techniques for evaluating different aspects of sustainability through the use of indicators. Zhang et al.[14] used the methodological foundations of various assessment methods to propose a classification, which divided them into three different groups: system engineering, monetary evaluation, and biophysical. However, practical challenges have led to mixed results in applying sustainability indicators and various policies in different environments and sometimes with little gain in sustainability performance[15,16].
It has been argued that one of the main reasons for failing to attain the desired performance is the inadequate selection of indicators guiding and monitoring the sustainable urbanization process[16,17]. The lack of consensus on urban sustainability indicators between different practices has been confusing when selecting and relating them with the objectives defined or policies implemented. Others opined that there are still no pertinent standards and universal methods or criteria for selecting urban sustainability indicators[18,19]. Taking the environmental aspect as an example, traditional policies on urban environmental issues could be roughly divided into two categories, environmental protection and inhabitants’ healthy life. Sustainable urban development should be focused on parks, green fields, non-polluted air, and drinking water. Lu and Chen[20] emphasized what must be taken into consideration is not only the city’s relationship to its nearest hinterland, but also its ‘ecological footprints’ in an international and global context.
Previous works conducted to improve urban sustainability are mainly objective-led and principle-based approaches that have been criticized for their superficiality and lack of quantification[21]. The primary causes can be concluded as the insufficient provision of the benchmarks or difficulties in threshold setting and variables identification[22]. Yigitcanlar et al.[23] developed a multiscale approach to evaluate the sustainability performance at micro, mezzo, or macro levels, and they drew some experiences from the neighborhood case into a testbed case in Gold Coast, Australia. Xu and Coors[24] instigated ArcGIS and 3D visualization techniques to interpret urban residential development and to provide comprehensive plans of sustainability for decision-makers. Phillis et al.[25] employed fuzzy logic theory to examine the overall sustainability by two factors, ecological and well-being, and they ranked the sustainability performance among the 106 cities in total. However, these preliminary related studies are mainly based on the subjectiveness data or physical reality, they lack the quantitative method to identify the uncertainty and highest potential variables.
3. Methodology
To measure the influence of different policies and mitigate the disadvantages of existing studies on urban sustainable development, a sustainability dynamic model is established by three steps shown in Figure 1. To be specific, the integration of the SD and MC techniques is used to analyze the most robust policies and interactions between various indicators as well as to predict the influence of the proposed strategies for future development.

Figure 1. Flowchart of the proposed approach for performing urban sustainability analysis and optimization.
3.1 System dynamic model construct
Urban sustainable development is a dynamic and complex process since it is facing a great deal of internal and external relations between the variables and constants[26]. Dynamic modeling is considered a proper tool for developing mental models through systematic thoughts. The simulated results are presented by different scenarios, which will help monitor the current and future status[27].
SD simulation combines both qualitative and quantitative research methodology, proposed by Forrester[28], aiming to solve complicated dynamic and nonlinear problems by constructing proper structures and loops. In SD models, stocks and flows are two main structural principles. A stock is a term for any entity which accumulates or depletes over time and flow is the rate of change in stock. Converters and connectors are regarded as two other basic elements of this structure. The converters convert the inflow to the outflow, which represents the value or information. The connectors connect the stocks to the converters, the stocks to the regulative flows, and the converters to other converters[29]. The application of the system dynamics modeling approach could be beneficial in decision-making for sustainable urbanization, as it is able to conceptualize complex interrelationships and facilitate their understanding and monitoring[30,31]. It has been widely applied in various fields, such as project delay analysis[32], quality control[33], biding strategy[34], risk management[35], metro system[36], and sustainability assessment[37,38].
In the domain of urban sustainable development. Abdi-Dehkordi et al.[39] SD method for modeling of a complex system, including water management, water quantity, and quality allocation for urban’s social and economic system. Assuncao et al.[40] focused on the urban sustainability assessment based on environmental protection, social cohesion, and economic growth aspects by using fuzzy cognitive mapping and the SD model. Generally, the SD model is a systematical and appropriate technique that is warranted for effectively forecasting future changes and for validating those selected indicators and proposed policies for dealing with these changes[41,42].
However, most of the research only used SD to propose a conceptual framework to illustrate the relationship among different variables. Few studies focused on the policies’ application to urban sustainable development. Therefore, based on the evaluation model, this research compares several scenarios under different policies. Scenario analysis is considered useful in sustainable policy planning, which could be used to predict the uncertainties existing in the socioeconomic systems and the corresponding environmental problems.
3.2 Monte Carlo simulation
The traditional analytical approaches are particularly difficult to be applied due to the complexity of the sustainability evaluation and the requirement for realistic consideration for modeling their availability and reliability. The Monte Carlo simulation that allows to design the behavior of complex systems under realistic time-dependent operational conditions is developed in this study. This approach is the generation of specific random and discrete occurrences in a computer model to build a realistic simulation with time series.
Sensitivity analysis (SA) could be used to the assessment of how variations in the output of a model can be distributed according to different sources of variations and how the given model will change due to the input information[43]. SA is crucial for model development, uncertainty analysis, scenario analysis, and decision-making[44]. Based on the literature and factors’ attributes, SA techniques can be categorized into two types: local sensitivity analysis and global sensitivity analysis. Local sensitivity analysis is a common method, which focuses on the local affection of the factors from the model output. However, there is no guarantee for the reliability of the result, as the local sensitivity techniques based on the one-factor-at-a-time approach has limitation for non-linear system analysis. To avoid this downside, a global sensitivity analysis is proposed, which takes into account the whole variation range of the input with the lowest possible computing cost[45]. It quantifies the overall effect of the model input on the output by adjusting model input parameters within large ranges.
A number of different distributions are possible for the payoff variable, including the Normal, Poisson, Uniform, and Triangular distributions[46]. Usually, the uniform distribution is used if no additional information apart from the ranges in key variables is known[47]. Since additional information on the underlying distribution was not available, input parameters were described using the uniform distribution. The degree of variation reflecting the uncertainty of the parameter is quantified with a five-score scale to represent the influence of different policies. The distribution of each specified parameter is sampled in order to run a single multivariate test, and the obtained values are then used in a simulation. For instance, if the number of simulations is set to 200, this procedure will be carried out 200 times repeatedly. Since the standard deviation is lower than the mean, uncertainties in the output parameters are often lower than uncertainties in the input parameters (or the coefficient of variation is less than 1). It is also feasible to calculate the viability of implementing the policies and determining the different indicators from the results of the Monte Carlo simulations.
In this study, a total of several policies regarding three dimensions are selected as the input variables. The most and least sensitive parameters in this well-established model are tested by using the MC sensitivity analysis function in Vensim with a sample size of 200 runs. The sensitive index is calculated by Eq. (1) for the year period between 2000 and 2050 as followed:
where, Si,j stands for the sensitivity index of the target variable i related to the parameter j; OMi,t and Omi,t are the maximum and minimum values of the i the variable at time t; Bdi,t represents the default model value of the i th variable at time t; PMj and Pmj denote the maximum and minimum values of the j th parameter, and Pdj is the default model value of the j th parameter. Specifically, the parameter in this sensitivity index are divided into five categories, including insensitive (Si,j = 0%), low sensitivity (Si,j < 10%), moderate sensitivity (10% ≤ Si,j < 50%), high sensitivity (50% ≤ Si,j < 100%), and very high sensitivity (Si,j ≥ 100%).
In order to obtain the confidence intervals of the model output influenced by the change of the most responsive parameter, 12 target variables are simulated by the Vensim tool. The percentile bounds of the established model with 200 times simulation have four ranges, namely 50%, 75%, 95%, and 100%. The variation coefficient (VC) of the sustainability model is simulated by MC sensitivity analysis for the year period between 2000 and 2050, which can be represented as Eq. (2):
where, the VCi,t denotes the relative change of the target variable i with respect to its mean value within the 95% confidence bounds; BM95i,t and Bm95i,t are the maximum and minimum values of the i th target variable at time t, and
In this study, the continuous time simulation technique, the Vensim platform has special features to easy Monte Carlo type of simulation experiments and provide confidence interval estimations[48]. In order to determine the key indicators and the appropriate policies output from the SD result, hundreds or even thousands of simulations can be performed, with constants sampled over a range of values, and output stored for later analysis. Only such packages as COSMIC and Vensim make it possible to connect simulation and optimization. The SD models usually contain several parameters, which are capable to examine the effect of their variation on simulation output. Some parameters and assign maximum and minimum values along with a random distribution are set to examine and predict the impact on the model behavior. The present study discusses and compares several scenarios of implementing different policies and evaluates the effectiveness of changing rules. Key indicators and policies for urban sustainability could be optimally designed in the context of specific scenarios. Thus, the proposed model can be adapted to other cities and can be extracted and analyzed by applying the conditions of other cities too.
3.3 Optimization for policy selection
Optimization here involves minimizing a statistical function that expresses how well the model fits a time series of data pertaining to an important model variable. In other words, a vector of parameters is explored with a view to determining the particular parameter combination which offers the best fit between the chosen important model variable and a past time series data set of this variable. The Vensim software uses a derivative of the basic Powell algorithm. This algorithm works on the basis of a power hill climb. It can be used for policy optimization.
The method of Powell optimization finds a locally optimal solution, which is given by Eq. (3) and Eq. (4). In each iteration, one tries to find an improving point by performing a line search along n linearly independent search directions
where the method starts from an initial approximation of an optimal solution x0.
4. Case Study
To determine the robustness of different policies and interrelationships between three systems to the urban sustainability performance, a case study in the city of Wuhan, China is used for demonstration purposes. The MC simulation is applied in the probabilistic analysis of the sustainability framework, where the different variables and policies within a certain range are examined by different scenarios[49]. Several policies are tested to perform the proposed SD model and prove their applicability in reality.
4.1 Case background
The metro network in Wuhan is selected as a case study in this research, which has a total of 11 urban lines, 282 stations, and 435 operation kilometers length with an average annual capacity of 1.013 billion passengers by the end of 2021. The total timeline is from the year 2000 to 2050, including the historical data from 2000 to 2022 and the evaluating period after 2022. To explore the interrelationships among variables and make optimal strategies in an uncertain environment, an MC-based SD model is constructed with influential factors and potential policies. The model takes advantage of evaluating all possible results after applying the indicators and policies, as well as making better strategies in an uncertain environment[46,50].
The proposed structure for the SD model consists of 56 variables, including 4 stock variables, 5 rate variables, 20 lookup properties, and the rest of the 27 auxiliary variables. Specifically, seven policies are added to this model to investigate their effects on urban sustainable development. Table 1 describes the specific strategies for each policy. For the social system, the measurements for the tunneling-induced settlements and restrictions for traffic are proposed to improve social sustainability. Also, three suggested policies, such as the transport fares, property-purchasing limitations, and investment in metro lines, are expected to boost economic development. Meanwhile, heavy industry and urbanization will be considered to implement into the environmental perspective with the aim of urban sustainable development.
Table 1. Specific measurements and descriptions of the suggested policy.
| Subsystem | Policy |
| Social system | Policy A1: Implementation of settlement restrictions for a large city, such as reducing the number of settlement quotas and increasing settlement conditions; Policy A2: Traffic restrictions, such as traffic restrictions based on even- and odd-numbered license plates and lower highway tolls, and increased intercity trains. |
| Economic system | Policy B1: Public transport fares, such as reducing tariffs to encourage the use of public transport; Policy B2: House purchase restriction policy, such as interest rate adjustment; Policy B3: Investment in the construction of the metro to increase the construction of the metro. |
| Environmental system | Policy C1: Reduction of heavy industry, such as effluent or waste discharge, relocation of heavy industry; Policy C2: Urban expansion, such as the expansion of urbanization. |
4.2 Modeling of urban sustainability
The sensitivity of the results is analyzed by using uncertain parameters in each iteration. It is needed to understand the boundaries of a model and also test the robustness of the policies. The sensitivity of influenced factors and policies are tested by changing uncertain parameters with the Monte Carlo simulation. The result simulated by SD is evaluated and validated by historical data.
Considering the non-linear interactions and feedback between these factors, the assessment of sustainability should be conducted from a holistic perspective[51]. An entire ecological system, presented by the SD model shown in Figure 2, provides in-depth knowledge of the main components of three subsystems and their changes over time. The model is structured with three sectors, which integrate the 47 parameters, including the constants, coefficients, and lookup variables. A total of 7 policies are distributed among the three related subsystems. Each policy may influent the subsystem where it is applied, and these changes can help people to anticipate the implementation of the policy. A brief conceptual description of the model is summarized below.
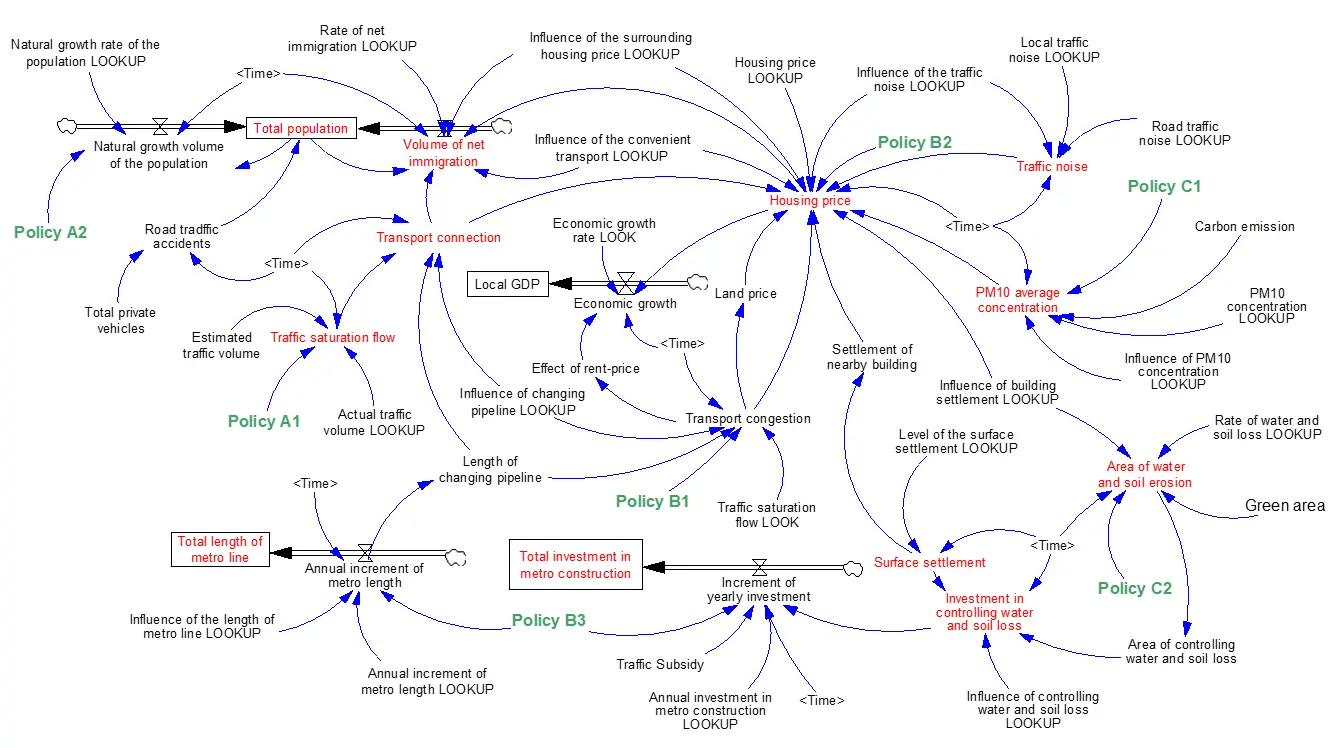
Figure 2. Built SD model for simulating the development of the entire ecological system over time. SD: system dynamic; GDP: gross domestic product.
(1) The social system presents the main driving forces, such as the population and transportation situations. The net immigration of the urban population has a great impact on the total population. The social development is strongly influenced by the traffic connection. Meanwhile, the connectivity of traffic is also affected by traffic accidents and road saturation.
(2) The housing price and investment in metro construction are the main influence factors in the economic system. The perfection of the published transport will make life more convenient, which is the reason for the rising in the property price. In this situation, economic growth will occur and it may result in an increasing GDP.
(3) The environmentally sustainable development is susceptible to the air quality and surrounding geological environment. Although the control in surface settlement and water-soil erosion has overcome this limitation, the green area and PM10 concentration are not enough to satisfy the ideal leave.
4.3 Assessment of urban sustainability
To identify the most influential variables and sub-systems in the entire ecological system, a sensitivity analysis of three sub-systems is discussed separately. A tolerance interval describes lower and upper bounds that enclose a specified proportion of a population with given confidence bounds[52]. Four color-coded intervals with the confidence bounds, such as 50%, 75%, 95%, and 100%, are demonstrated as red, green, blue, and yellow areas, respectively. The Random Uniform Distribution is suitable for most sensitivity testing and is selected by default. Another commonly-used distribution is the Normal Distribution (or Bell Curve) in which values near the mean or more likely to occur than values far from the mean[53].
4.3.1 Social system
Figure 3 shows the results of a sensitivity analysis of the sensitive parameter (Si,j ≥ 50%) for target variables, namely Policy A1 and Policy A2. Four responsive parameters, such as the total population, volume of net immigration, transport connection, and traffic saturation flow, show a moderate response of the model to changes in parameter values. The variables related to the population have a low response (Figure 3a,b), as the variation coefficient is below 50%, while the indicators associated with the transportation condition show a high response to the change of policy (Figure 3c,d). Taking the observation parameter total population as an example, the initial population is 7,500 in the year 2000, and the value may uniformly fluctuate from 6,875 to 8,125 within the sensitivity bound of 95% in the year 2013. Traffic flow is the most sensitive indicator when policies changed, which reflects that road traffic is more controllable than the local population.
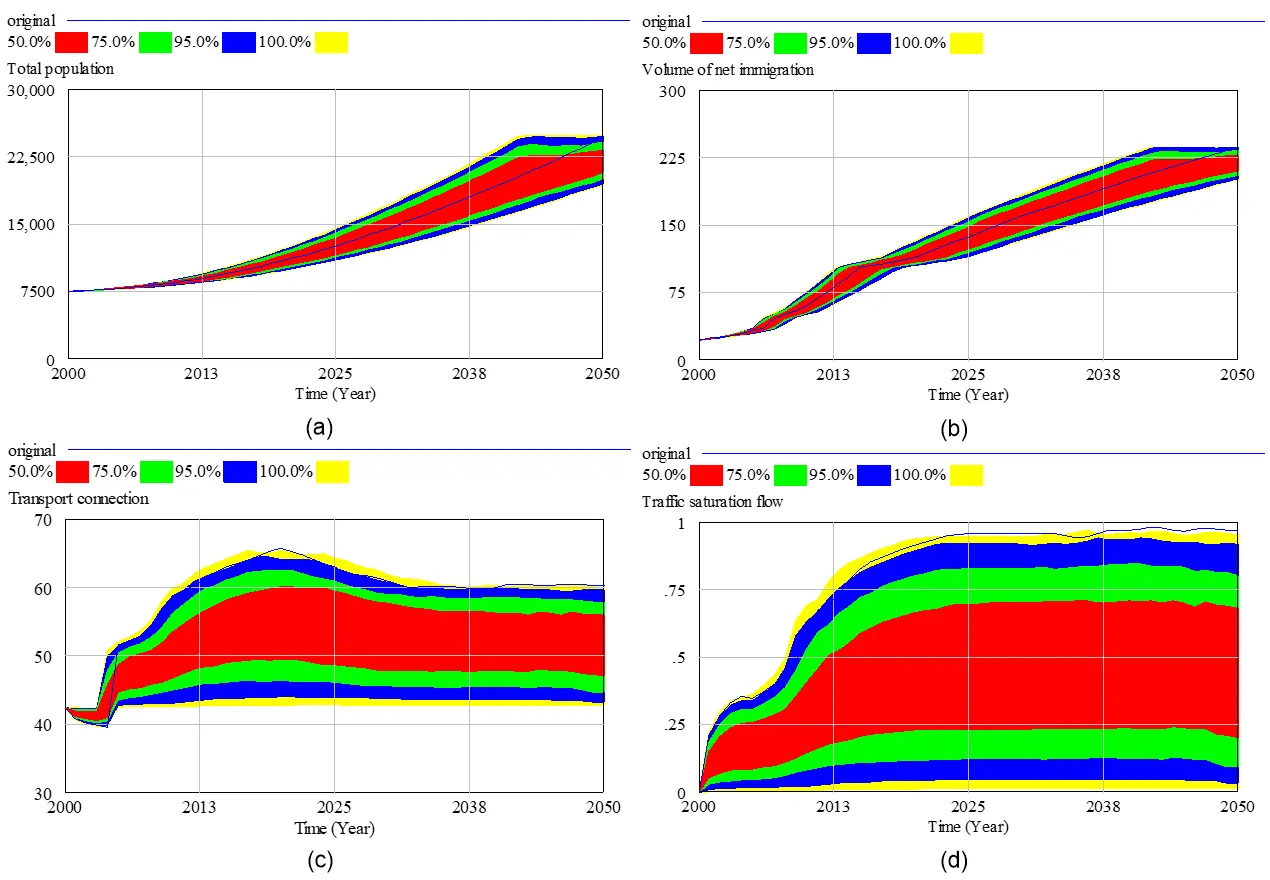
Figure 3. Monte Carlo SA results for changes in the values of sensitive parameters (local sensitivity over 50%) with 200 runs, for the following target model variables: (a) Total population; (b) Volume of net immigration; (c) Transport connection; (d) Traffic saturation flow. SA: sensitivity analysis.
4.3.2 Economic system
As the economy is always the core objective of urban development, more policies are implemented to accelerate economic development. Three policies, recorded as Police B1, B2, and B3, are added to the SD model to control the housing price, traffic congestion, and public transportation investment. A sensitivity analysis of the economic system is represented in Figure 4.
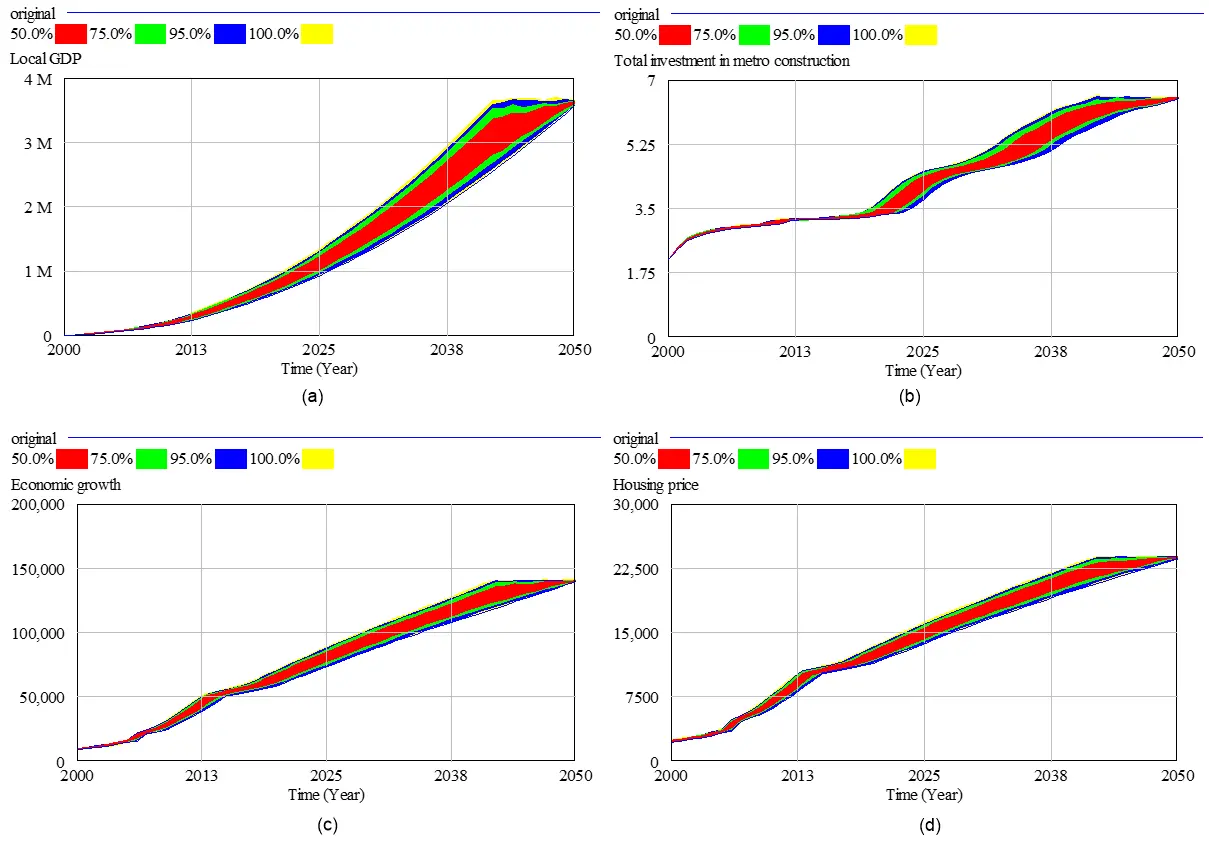
Figure 4. Monte Carlo SA results for changes in the values of sensitive parameters (local sensitivity over 50%) with 200 runs, for the following target model variables: (a) Local GDP; (b) Total investment in metro construction; (c) Economic growth; (d) Housing price. SA: sensitivity analysis; GDP: gross domestic product.
The change of these three policies has a middle-low response in parameter values (variation coefficient below 50%). From the result, the local GDP has a significant change in the future, which encourages the policy-maker or the government to adopt some economic strategies. The total investment in metro construction shows an interesting trend at the early period, where the value is not sensitive to the policy stimulus, but it becomes robust after the year 2018. Although the value of the economic growth and housing price is different, the tendency of the economic growth changes correspondingly in line with the housing price trend.
4.3.3 Environmental system
To explore how uncertainty affects the assessment of such policies, a set of sustainability indicators is displayed in Figure 5. Policies C1 and C2 are used to adjust the environmental indicators, where values of the parameters are restrained to degradation to some extent. Hence, the number of parameters should be kept within a certain range that achieves the best model performance. An important aim of the parameter SA is to allow a reduction in the number of parameters that must be estimated, thereby reducing the computational time required for model calibration.
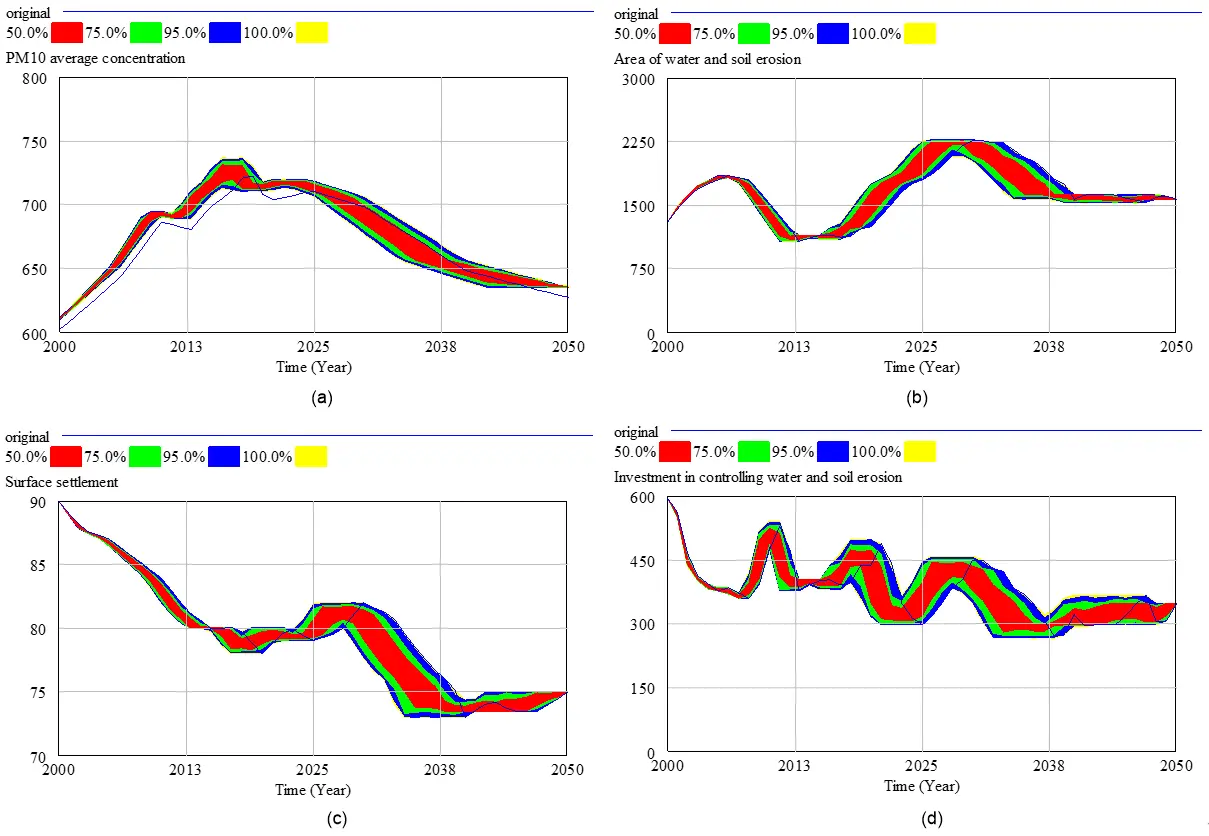
Figure 5. Monte Carlo SA results for changes in the values of sensitive parameters (local sensitivity over 50%) with 200 runs, for the following target model variables: (a) PM10 average concentration; (b) Area of water and soil erosion; (c) Surface settlement; (d) Investment in controlling water and soil erosion. SA: sensitivity analysis.
The results illustrate the air quality and the soil condition will be mitigated in the coming decades, which proves the effectiveness of implementing the environmental policy. All the indicators have a low to moderate response to the incentive policy. For instance, the surface settlement and investment in controlling water and soil erosion have a relatively high sensitivity to the change of parameters, and PM10 average concentration and area do water and soil erosion are in the low response. Unlike the other indicators, the factor area of water and soil erosion may become insensitive to the change of policy after the year 2035.
4.4 Optimization of urban sustainability
Sensitivity analysis is a critical tool in the evaluation of the reliability of model outputs[54]. The results of the detailed assessment of robustness showed that there is sufficient confidence in the model outcomes. Based on the Monte Carlo analysis, a total of 16 variables within three subsystems has low to moderate variation. The values of the parameters were determined directly when data were available (e.g., almanac data, statistics, local sources, and scientific literature). When no reliable information can be found, an automatic calibration process is carried out, which allowed the selection of the parameter values that maximized the adjustment of the simulation results of the model to the observed data[55]. During this process, the parameter ranges were constrained to realistic levels for the target system, since this increases the power of the calibration without compromising the resulting model structure[56]. All these parameters are subjected to a SA, the purpose of this work, as described in the following sections.
Calibration is one of the tests used for model verification. In calibration, the outputs of the model are compared to the observed data to examine the consistency of the data obtained from the model with the historical. Here, the mere adherence of the model behavior to the observed data is sufficient for the success of the model[57]. Moreover, in this study, the coefficient of determination and the relative Root Mean Square Error are used to investigate the significance of the behavior generated from the model with the observed behaviors.
To determine the influence of the suggested policies, four main different scenarios are performed to examine the degree of the impact. The impact of each policy is measured by a value with a range from 0 to 1, which the larger the value, the strong interference will be given from the governments. Taking the traffic restrictions (A2) as an example, the value of 0 means there is no regulation for traffic, while if the value is close to 1, which indicates the government will strictly control the traffic system. The proposed framework could be interpreted as a decision-making tool for understanding the uncertainties of the entire urban system and predicting with certainty the result of each management decision. Besides, the optimization results will provide a guideline for each subsystem. Table 2 displays the optimization result for the whole system and subsystems.
Table 2. Optimization result of the total seven policies.
| Sustainability policy | Target | Range | Original value | Optimized value |
| A1, A2, B1, B2, B3, C1, C2 | All evident | [0, 1] | A1 = 0.423, A2 = 0.440, B1 = 0.268, B2 = 0.363, B3 = 0.270, C1 = 0.670, C2 = 0.679 | A1 = 1, A2 = 1, B1 = 0, B2 = 1, B3 = 0, C1 = 1, C2 = 0.934 |
| A1, A2(social system) | Total population; Volume of the net immigration; Transport connection; Traffic saturation flow | [0, 1] | A1 = 0.44, A2 = 0.27 | A1 = 1, A2 = 0 |
| B1, B2, B3 (economic system) | Local GDP; Economic growth; Total investment in metro construction; Transport congestion; Housing price | [0, 1] | B1 = 0.423, B2 = 0.268, B3 = 0.670 | B1 = 0.340, B2 = 0, B3 = 1 |
| C1, C2 (environmental system) | PM 10 average concentration; Area of water and soil loss; Surface settlement; Investment in controlling water and soil loss | [0, 1] | C1 = 0.363, C2 = 0.679 | C1 = 0, C2 = 0.340 |
GDP: gross domestic product.
The proposed MC-based SD model not only tests the historical data from the year 2000 but forecasts the future development to the year 2050. We assume that the proposed policies are applied and explore the development trends within 50 years. According to the optimization result, the parameters in this SD model are updated and simulated as shown in Figure 6. Details are discussed as follows:
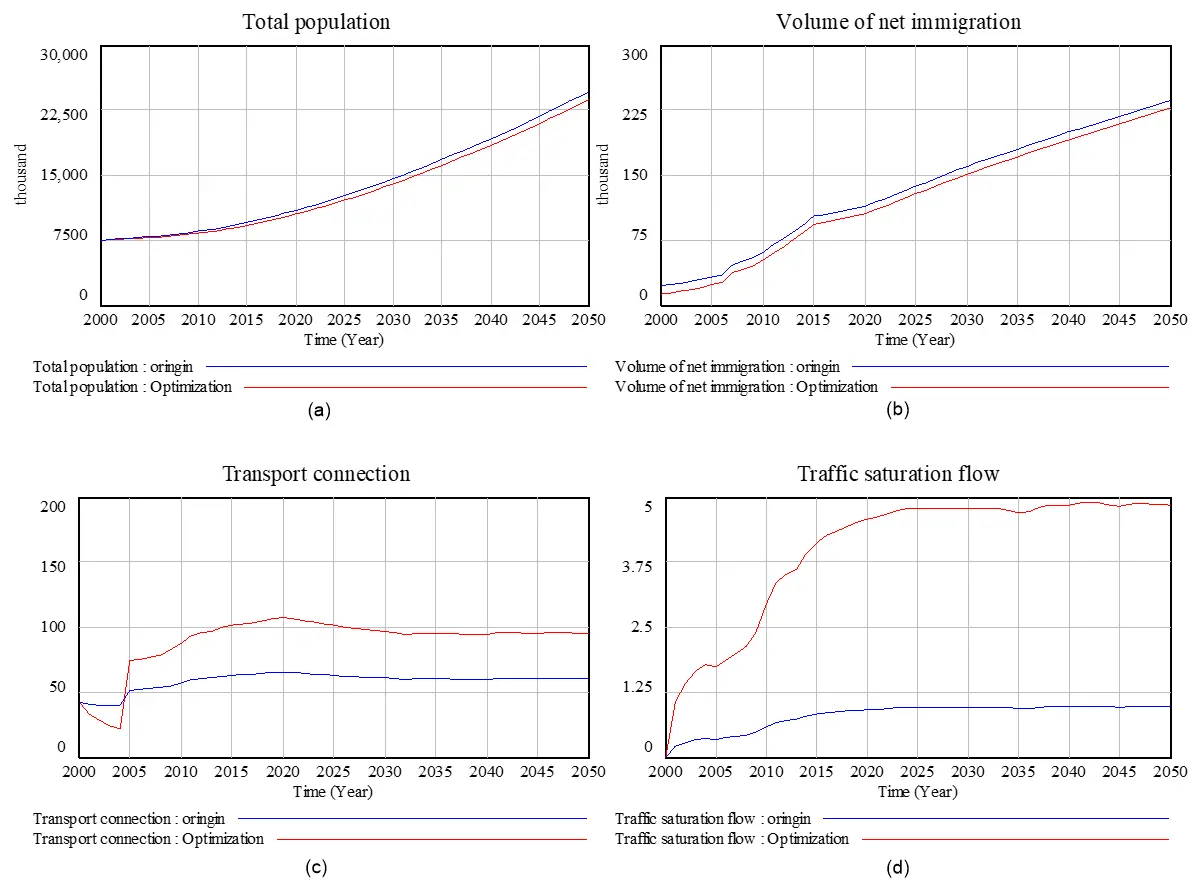
Figure 6. Comparison between the original and optimized trend in social system with indicators: (a) Total population; (b) Volume of net immigration; (c) Transport connection; and (d) Traffic saturation flow.
(1) In the social section, the change of policy may effectively control the population and benefit the transportation condition. The implementation of policies A1 and A2 has positive and negative effects on socially sustainable development, respectively. Remarkably, the optimization result for Policy A1 is more promising, where the value from 0.44 increases to a maximum 1. For the Policy A2, there is an opposite trend, where the value drops to 0. To be more specific, when the maximum value is given to policy A1 and the minimum value is given to the policy A2, the factor Traffic saturation flow is considered to be the most beneficial variable as shown in Figure 6d, where the value it triples or even quadruples the original value. Similarly, the transportation connection also has a moderate improvement after the implementation of policies, as it doubles the original situation as shown in Figure 6c. By contrast, the total population in Figure 6a and the volume of net immigration shown in Figure 6b have the opposite trend, which indicates policies may release the population pressure in the future.
(2) In the economic section, slight fluctuations occur in target parameters. Three policies are designed in the model with the aim of improving economic sustainable development. A lower value of policy B1 may boost economic development. In addition, policy B2 will restrict the urban economy, while policy B3 may have positive effects on it. Although the increase in Economic growth (Figure 7b) is the highest, the optimized result is not obvious. The optimized result of the factor local GDP is expected to exceed the original situation after 2020, represented in Figure 7a. For target variables increment of yearly investment and total investment in metro construction, it is observed that the differences between the original and optimized results are not distinct. From Figure 7c,d, the most of parts are overlapped, which represents policy changes have less influence on them.
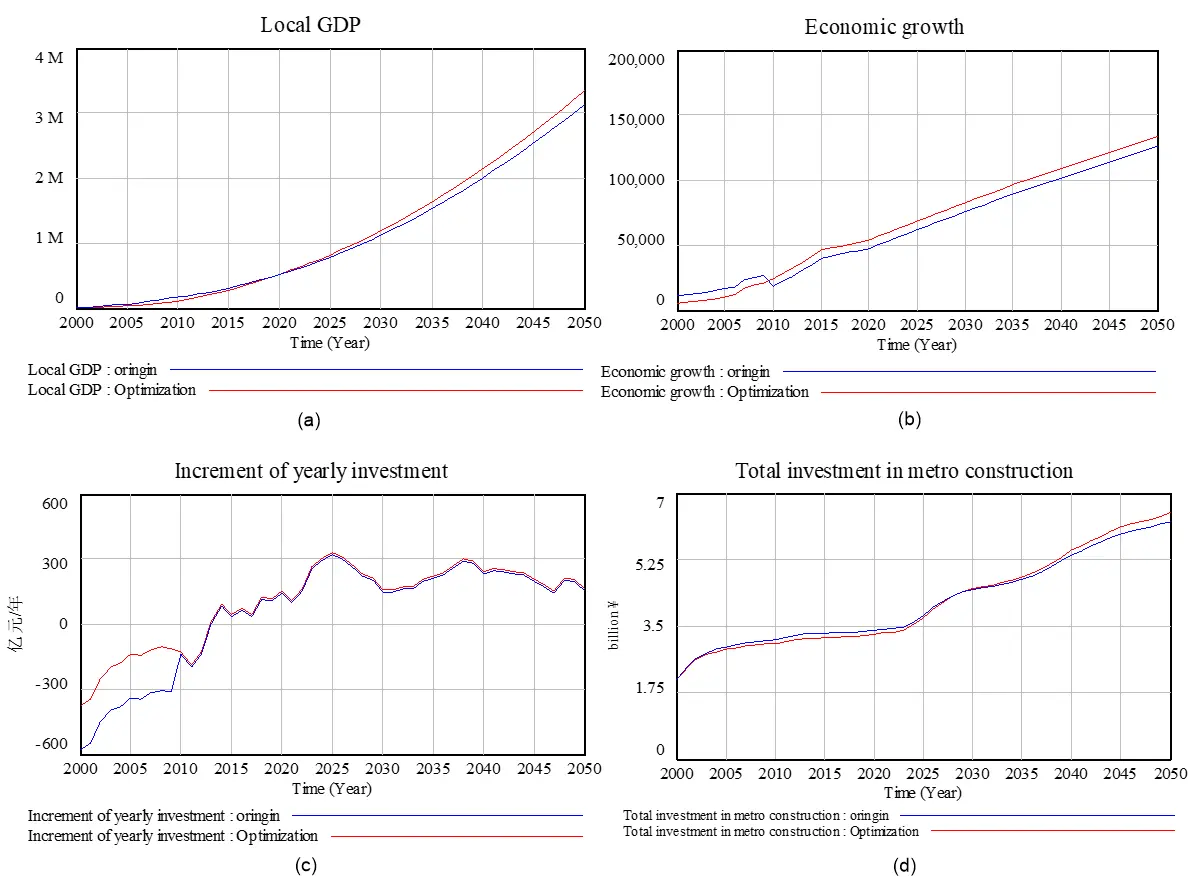
Figure 7. Comparison between the original and optimized trend in the economic system with indicators: (a) Local GDP; (b) Economic growth; (c) Increment of yearly investment; (d) Total investment in metro construction. GDP: gross domestic product.
(3) From Environmental sustainability perspective, where both indicators shown in Figure 8 have improved to a certain extent. After the optimization process, the result shows that two related policies are unlikely encouraged to apply. For instance, the value of PM10 average concentration and Area of water and soil erosion are decreased. The air quality had experienced a decline in recent years, where the pollution level increased from 600 µg/m3 (in 2000) to 735 µg/m3 (in 2018), however, it may get better and recover at the value of 630 µg/m3 until 2050. In terms of the soil condition, there are several ups and downs during the assessment period. The area of water and soil erosion peaked for the first time in 2006 at 1,850 m3, and then it reverted or exceeded the original level (1,000 m3) in 2013. The second peak is expected to reach 2,200 m3 in the year 2030.
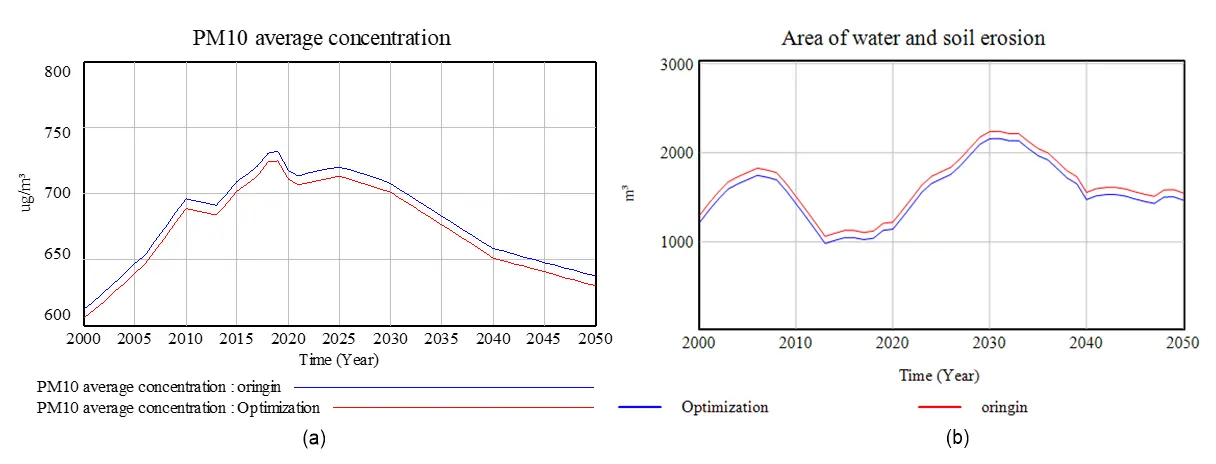
Figure 8. Comparison between the original and optimized trend in the environmental system with indicators: (a) PM10 average concentration; (b) Area of water and soil erosion.
5. Discussions
The optimization results indicate that the implemented strategies have positive effects on urban sustainability. Policies A1 and B3 are encouraged to apply, while A2, B2, and C1 are unlikely suitable for long-term development. Especially for the social system, where the transportation connection and traffic saturation flow may be doubled and quadrupled, respectively. Table 1 demonstrates different types of policy and their specific functions.
The implementation of policies A1 and A2 have positive and negative effects on the social development, respectively. From Figure 6, Policy A1 related to reducing the number of immigrants in a large city and adding additional conditions for the foreign population could be encouraged to implement for control the city’s population. Policy A2 may be interpreted as some traffic restriction regulations, such as reducing the number of settlement quotas and increasing settlement conditions. These policies could release the traffic saturation flow and strengths traffic connections, and even bring more benefits to economic growth.
Three Policies are added to the economic system for optimizing the local financial inputs and outputs. The performance of sustainability indicators Local GDP and economic growth will be improved in different periods, while the investment in transportation does not show significant changes. Table 2 and Figure 7 illustrate that both executive forces of policy B1 and B2 are reduced from 0.423 and 0.268 to 0.3403 and 0, respectively. To be specific, Policy B1 represents the statutes like transport fares and Policy B2 relates to housing purchases. Governments are suggested to reduce tariffs to encourage the use of public transport and adjust the interest rate to control the housing market. However, Policy B3 has an effect on the investment in metro construction, and the optimization result reflects that more investment should be poured into underground transport development. It is likely to strengthen the implementation of policy B3, which indicates that the perfection of public transport facilities will promote local economic growth[58].
For the environmental system, the result indicates that two environmental-related policies C1 and C2 are unlikely encouraged to implement. Policy C1 is related to the location of heavy industrial plants, this encourages people to reduce gas and sewage emissions from heavy industry, or to relocate polluting plants. Another policy, C2, deals with the urbanization of rural land, as urban expansion leads to soil erosion and loss of forest cover. For instance, the original value of policy C1 (C1 = 0.363) and C2 (C2 = 0.679) is optimized and decreases to 0 and 0.34, where two indicators, such as PM10 average concentration and Area of water and soil erosion, resulting in a better situation. The PM10 concentration could be decreased by 50 µg/m3 every year, and the damage of the erosion area releases with 10 m3 per year.
6. Conclusions and Future Studies
Evaluating urban sustainability in three dimensions is important to push the government or policy-makers to move toward the right direction with the consideration of the interactions between social, economic, and environmental aspects. Various studies have been conducted to assess urban sustainability and improve sustainable development. These preliminary studies, however, still have some limitations. Therefore, this research integrates the system dynamic and global sensitivity analysis to simulate how policy implementation will affect each sub-system. SD is simulated to investigate the interrelationships and time changes during the policy application, while the Monte Carlo sensitivity analysis is used to identify the most sensitive policies that could significantly affect urban sustainability.
The robustness of indicators in the system is elaborated as shown in the results. The Monte Carlo simulations showed a low (variation lower than 50% with respect to the mean value) to moderate (variation between 50% and 100%) response for 16 of the 27 target model variables to changes in the values of their most responsive. Seven policies in total are given to the entire urban system to optimize urban sustainable development. In light of experimental analysis, several conclusions are obtained.
(1) All the performances of three dimensions are improved by implementing relevant policies, where the maximum value is given to policy A1 (A1 = 1) and the minimum value is given to policy A2 (A2 = 2). The social system has the most sensitive response, where factors Transportation connection and Traffic saturation flow may be doubled and quadrupled in the next decades, respectively. It indicates transportation factors are subjected to policy interventions.
(2) Policies B1 and B2 are not encouraged to implement in this system, as the optimization result indicates the lower value of B1 (B1 = 0.3403) and minimum value of B2 (B2 = 0) will have negative effects on urban sustainability. By contrast, policy B3 is suitable for economic development, which can be seen after the year 2010, where the value of the factor Economic growth is increasing by 5% in the future. The result reflects that the stimulus from monetary and fiscal measures plays an important role in economic regulation and control.
(3) Environmental-related policies C1 (C1 = 0) and C2 (C2 = 0.34) may have a negative effect on future sustainable development, as the value of these two indicators is below 0.5. The implementation of policies may reduce the value of PM10 average concentration and Area of water and soil erosion.
The developed system as a decision-making framework provides some strategies about how to match relevant policies to improve urban sustainable development. Meanwhile, the decision-making framework could assist policy-makers to identify the most significant factors in a dynamic and long-term urban system.
Authors contribution
All authors contributed equally to this work.
Conflicts of interest
The authors declare that there are no conflicts of interest.
Ethical approval
Not applicable.
Consent to participate
Not applicable.
Consent for publication
Not applicable.
Availability of data and materials
Data supporting the findings of this study are available from the corresponding author upon reasonable request.
Funding
None.
Copyright
© The Author(s) 2022.
References
-
1. Santoyo-Castelazo E, Azapagic A. Sustainability assessment of energy systems: Integrating environmental, economic and social aspects. J Clean Prod. 2014;80(2):119-138.[DOI]
-
2. Wang WM, Peng HH. A fuzzy multi-criteria evaluation framework for urban sustainable development. Mathematics. 2020;8(3):330.[DOI]
-
3. Fan Y, Fang C, Zhang Q. Coupling coordinated development between social economy and ecological environment in Chinese provincial capital cities-assessment and policy implications. J Clean Prod. 2019;229(5972):289-298.[DOI]
-
4. Zhu J, Fan C, Shi H, Shi L. Efforts for a circular economy in China: a comprehensive review of policies. J Ind Ecol. 2019;23(1):110-118.[DOI]
-
5. Hassan AM, Lee H. Toward the sustainable development of urban areas: An overview of global trends in trials and policies. Land Use Policy. 2015;48:199-212.[DOI]
-
6. Turcu C. Re-thinking sustainability indicators: Local perspectives of urban sustainability. J Environ Plann Manage. 2013;56(5):695-719.[DOI]
-
7. Liu Y, Guo H, Zhang Z, Wang L, Dai Y, Fan Y. An optimization method based on scenario analysis for watershed management under uncertainty. Environ Manage. 2007;39(5):678-690.[DOI]
-
8. Zhou M. An interval fuzzy chance-constrained programming model for sustainable urban land-use planning and land use policy analysis. Land Use Policy. 2015;42:479-491.[DOI]
-
9. Peng Y, Lai Y, Li X, Zhang X. An alternative model for measuring the sustainability of urban regeneration: The way forward. J Clean Prod. 2015;109(6):76-83.[DOI]
-
10. Ameen RFM, Mourshed M. Urban sustainability assessment framework development: The ranking and weighting of sustainability indicators using analytic hierarchy process. Sustain Cities Soc. 2019;44:356-366.[DOI]
-
11. Brandon PS, Lombardi P. Evaluating sustainable development in the built environment. 2nd ed. Chichester: John Wiley & Sons; 2010.
-
12. Shen LY, Ochoa JJ, Shah MN, Zhang X. The application of urban sustainability indicators-A comparison between various practices. Habitat Int. 2011;35(1):17-29.[DOI]
-
13. Ugwu OO, Haupt TC. Key performance indicators and assessment methods for infrastructure sustainability-A South African construction industry perspective. Build Environ. 2007;42(2):665-680.[DOI]
-
14. Zhang K, Wen Z, Du B, Song G. A multiple-indicators approach to monitoring urban sustainable development. In: Carreiro MM., Song YC, Wu J, editors. Ecology, Planning, and Management of Urban Forests. New York: Springer; 2008. p. 35-52.[DOI]
-
15. Alshuwaikhat HM, Nkwenti DI. Visualizing decision-making: Perspectives on collaborative and participative approach to sustainable urban planning and management. Environ Plann B: Plan Des. 2002;29(4):513-531.[DOI]
-
16. Seabrooke W, Yeung SCW, Ma FMF, Li Y. Implementing sustainable urban development at the operational level (with special reference to Hong Kong and Guangzhou). Habitat Int. 2004;28(3):443-466.[DOI]
-
17. Briassoulis H. Sustainable development and its indicators: through a (planner’s) glass darkly. J Environ Plann Manage. 2001;44(3):409-427.[DOI]
-
18. Kahn ME. Green cities: Urban growth and the environment. Washington: Brookings Institution Press; 2013.
-
19. Michalina D, Mederly P, Diefenbacher H, Held B. Sustainable urban development: A review of urban sustainability indicator frameworks. Sustainability. 2021;13(16):9348.[DOI]
-
20. Lu Y, Chen B. Urban ecological footprint prediction based on the Markov chain. J Clean Prod. 2017;163:146-153.[DOI]
-
21. Colantonio A. Social sustainability: Linking research to policy and practice. In: Proceedings of Sustainable Development: A Challenge for European Research; 2009 May 26-28; Brussels, Belgium. Brussels: European Commission. Available from: http://eprints.lse.ac.uk/id/eprint/35865
-
22. Colantonio A. Urban social sustainability themes and assessment methods. Urban Des Plan. 2010;163(2):79-88.[DOI]
-
23. Yigitcanlar T, Dur F, Dizdaroglu D. Towards prosperous sustainable cities: A multiscalar urban sustainability assessment approach. Habitat Int. 2015;45(Pt 1):36-46.[DOI]
-
24. Xu Z, Coors V. Combining system dynamics model, GIS and 3D visualization in sustainability assessment of urban residential development. Build Environ. 2012;47(1):272-287.[DOI]
-
25. Phillis YA, Kouikoglou VS, Verdugo C. Urban sustainability assessment and ranking of cities. Comput Environ Urban Syst. 2017;64:254-265.[DOI]
-
26. Aronson J, Milton SJ, Blignaut JN. Restoring natural capital: Science, business, and practice. Washington: Island Press; 2007. Available from: https://www.mari-odu.org/academics/2018s_adaptation/commons/library/Restoring-natural-capital-science-business-and-practice.pdf
-
27. Fiksel J. Sustainability and resilience: toward a systems approach. Sustain Sci Pract Policy. 2006;2(2):14-21.[DOI]
-
28. Forrester AT. Photoelectric mixing as a spectroscopic tool. JOSA. 1961;51(3):253-259.[DOI]
-
29. Sterman JD. System dynamics modeling: Tools for learning in a complex world. Calif Manage Rev. 2001;43(4):8-25.[DOI]
-
30. Kelly RA, Jakeman AJ, Barreteau O, Borsuk ME, El-Sawah S, Hamilton SH, et al. Selecting among five common modelling approaches for integrated environmental assessment and management. Environ Modell Software. 2013;47:159-181.[DOI]
-
31. Martinez-Moyano IJ, Richardson GP. Best practices in system dynamics modeling. Syst Dyn Rev. 2013;29(2):102-123.[DOI]
-
32. Wang J, Yuan H. System dynamics approach for investigating the risk effects on schedule delay in infrastructure projects. J Manage Eng. 2017;33(1):04016029.[DOI]
-
33. Guo S, Zhang P, Yang J. System dynamics model based on evolutionary game theory for quality supervision among construction stakeholders. J Civ Eng Manage. 2018;24(4):318-330.[DOI]
-
34. Huang C, Han D, Yan Z, Li Y, Sun C, Jia Q. Bidding strategy of energy storage in imperfectly competitive flexible ramping market via system dynamics method. Int J Electr Power Energy Syst. 2022;136(4):107722.[DOI]
-
35. Wu Z, Yang K, Lai X, Antwi-Afari MF. A scientometric review of system dynamics applications in construction management research. Sustainability. 2020;12(18):7474.[DOI]
-
36. Chen H, Chen B, Zhang L, Li HX. Vulnerability modeling, assessment, and improvement in urban metro systems: A probabilistic system dynamics approach. Sustain Cities Soc. 2021;75(2):103329.[DOI]
-
37. Espinoza A, Bautista S, Narváez PC, Alfaro M, Camargo M. Sustainability assessment to support governmental biodiesel policy in Colombia: A system dynamics model. J Clean Prod. 2017;141:1145-1163.[DOI]
-
38. Zhang L, Zhang Y, Li HX, Lei Z. Estimating long-term impacts of tunnel infrastructure development on urban sustainability using granular computing. Appl Soft Comput. 2021;113(Pt A):107932.[DOI]
-
39. Abdi-Dehkordi M, Bozorg-Haddad O, Salavitabar A, Goharian E. Developing a sustainability assessment framework for integrated management of water resources systems using distributed zoning and system dynamics approaches. Environ Dev Sustain. 2021;23:16246-16282.[DOI]
-
40. Assuncao ERGTR, Ferreira FAF, Meidute-Kavaliauskiene I, Zopounidis C, Pereira LF, Correia RJC. Rethinking urban sustainability using fuzzy cognitive mapping and system dynamics. Int J Sustain Dev World Ecol. 2020;27(3):261-275.[DOI]
-
41. Forrester JW. World dynamics. 2nd ed. Cambridge (MA): Wright-Allen Press; 1971. Available from: https://monoskop.org/images/d/dc/Forrester_Jay_W_World_Dynamics_2nd_ed_1973.pdf
-
42. Kunc M, Mortenson MJ, Vidgen R. A computational literature review of the field of System Dynamics from 1974 to 2017. J Simul. 2018;12(2):115-127.[DOI]
-
43. Hekimoglu M, Barlas Y. Sensitivity analysis for models with multiple behavior modes: a method based on behavior pattern measures. Syst Dyn Rev. 2016;32(3-4):332-362.[DOI]
-
44. Xiang W, Yan S, Wu J, Niu W. Dynamic response and sensitivity analysis for mechanical systems with clearance joints and parameter uncertainties using Chebyshev polynomials method. Mech Syst Signal Process. 2020;138(4):106596.[DOI]
-
45. Iooss B, Lemaitre P. A review on global sensitivity analysis methods. In: Dellino G, Meloni C, editors. Uncertainty management in simulation-optimization of complex systems: Algorithms and applications. New York: Springer; 2015. p. 101-122.[DOI]
-
46. Landau D, Binder K. A guide to Monte Carlo simulations in statistical physics. 4th ed. Cambridge (UK): Cambridge University Press; 2021.[DOI]
-
47. Hewitt M, Ortmann J, Rei W. Decision-based scenario clustering for decision-making under uncertainty. Ann Oper Res. 2022;315(2):747-771.[DOI]
-
48. Marquez AC, Heguedas AS, Iung B. Monte Carlo-based assessment of system availability. A case study for cogeneration plants. Reliab Eng Syst Saf. 2005;88(3):273-289.[DOI]
-
49. Robert CP, Casella G, Casella G. Monte Carlo statistical methods. New York: Springer; 1999.[DOI]
-
50. Haroonabadi H, Haghifam MR. Generation reliability assessment in power markets using Monte Carlo simulation and soft computing. Appl Soft Comput. 2011;11(8):5292-5298.[DOI]
-
51. Hodbod J, Adger WN. Integrating social-ecological dynamics and resilience into energy systems research. Energy Res Soc Sci. 2014;1:226-231.[DOI]
-
52. Ford A, Flynn H. Statistical screening of system dynamics models. Syst Dyn Rev. 2005;21(4):273-303.[DOI]
-
53. Kasperska E, Kasperski A, Mateja-Losa E. Sensitivity analysis and optimization on some models of archetypes using Vensim-experimental issue. Studia Ekonomiczne. 2013;153:53-82. Available from: https://cejsh.icm.edu.pl/cejsh/element/bwmeta1.element.desklight-e6fdb83a-d813-4cfd-9b00-b1bb0bc06ff1/c/3_E.Kasperska_A.Kasperski_E.Mateja-Losa_Sensivity_analysis....pdf
-
54. Hekimoglu M, Barlas Y [Internet]. Sensitivity analysis of system dynamics models by behavior pattern measures. Available from: https://proceedings.systemdynamics.org/2010/proceed/papers/P1260.pdf
-
55. Parra JF, Jaramillo P, Arango-Aramburo S. Metaheuristic optimization methods for calibration of system dynamics models. J Simul. 2018;12(2):190-209.[DOI]
-
56. Makler-Pick V, Gal G, Gorfine M, Hipsey MR, Carmel Y. Sensitivity analysis for complex ecological models-A new approach. Environ Modell Softw. 2011;26(2):124-134.[DOI]
-
57. Nabavi E. Determining criteria and monitoring sustainability of Zayandeh-rud River Basin from water resources management point of view [dissertation]. Isfahan: Isfahan University of Technology; 2011.
-
58. Banister D, Berechman Y. Transport investment and the promotion of economic growth. J Transp Geogr. 2001;9(3):209-218.[DOI]
Copyright
© The Author(s) 2023. This is an Open Access article licensed under a Creative Commons Attribution 4.0 International License (https://creativecommons.org/licenses/by/4.0/), which permits unrestricted use, sharing, adaptation, distribution and reproduction in any medium or format, for any purpose, even commercially, as long as you give appropriate credit to the original author(s) and the source, provide a link to the Creative Commons license, and indicate if changes were made.
Publisher’s Note
Science Exploration remains a neutral stance on jurisdictional claims in published
maps
and institutional affiliations. The views expressed in this article are solely those
of
the author(s) and do not reflect the opinions of the Editors or the publisher.
Share And Cite


Science Exploration Style
Wu M, Wang J, Zhang Y, Zhang L. Modeling, assessment, and optimization of urban sustainability using probabilistic system dynamics. J Build Des Environ. 2023;1:8993. https://doi.org/10.37155/2811-0730-0101-5
Tips
Copy completed.
Submit a Manuscript
Author Instructions
Cite this Article
Article Metrics
0
View
0
Download
Cited
Article Updates

- Abstract
- Keywords
- 1. Introduction
- 2. Related Studies
- 3. Methodology
- 4. Case Study
- 5. Discussions
- 6. Conclusions and Future Studies
- Authors contribution
- Conflicts of interest
- Ethical approval
- Consent to participate
- Consent for publication
- Availability of data and materials
- Funding
- References
- Copyright
Science Exploration Style
Wu M, Wang J, Zhang Y, Zhang L. Modeling, assessment, and optimization of urban sustainability using probabilistic system dynamics. J Build Des Environ. 2023;1:8993. https://doi.org/10.37155/2811-0730-0101-5
copy
Share Link
copy