Abstract
Buildings are a huge carbon emitter. Efforts are being made to cut both embodied and operational carbon emissions to reduce the impact on the built environment. This study aims to compare the Life Cycle Carbon Footprint (LCCF) and Life Cycle Cost (LCC) of two alternatives: refurbishment and radical replacement of an existing community centre building in Liverpool to identify options that could achieve significant CO2 emission reductions in an economically viable way. The calculation methods are standardised by the United Kingdom’s Royal Institute of Chartered Surveyors to overcome the limitations of life cycle analysis undertaken in previous research. This refers to the Inventory of Carbon and Energy database from which embodied calculation factors were extracted to get the greenhouse gases. While the operational emissions data were obtained from a thermal simulation through Integrated Environmental Solutions software. The results of this study showed that the refurbishment scenario is the best option since it emits 50% less greenhouse gas and reaches 64% lower costs compared to the new build case throughout the building’s life cycle. Such that the LCCF of the refurbishment scenario was 215,084.36 kgCO2e/m2 and its LCC £ 88,135.32, while the replacement scenario achieved 429,397.44 kgCO2e/m2 and £ 246,213.59. It can be deducted that to reach significant reductions in carbon emissions rates with a lower economic impact, refurbishment is preferable to demolition and new construction, even if the building shows several damages and defects, which suggests that the UK government should incentivise and encourage re-use for faster environmental rehabilitation.
Keywords
1. Introduction
In 2019, the building sector emitted 9.95 GtCO2, accounting for 38% of total energy-related CO2 emissions when adding building and construction industry emissions. In the UK, according to the Technology Strategy Board, the built environment contributes about 45% of the total carbon footprint (27% from domestic buildings and 18% from non-domestic buildings). These emissions are directly associated with the entire building process which includes extraction, manufacturing, transportation, construction, operation, maintenance and disposal[1]. Hence, following the Paris Agreement’s 1.5 °C requirement, the Climate Change Act 2008 established a target to reduce UK CO2 emissions by at least 80%, relative to 1990 levels, by 2050[2]. As a predominant sector, the building industry, therefore, can contribute significantly to the success of this commitment.
For example, improving the energy efficiency of buildings plays a pertinent role in reducing the environmental impact of the built environment, which has been a positive step taken by the UK government through the introduction of a myriad of regulations, among which are the Energy Performance Certificates which enforce a minimum building energy performance rating of E on residential and a set of non-domestic buildings on 1 April 2018[3], aiming at enhancing energy performance to meet 2050’s target. However, as mentioned previously, emissions from buildings are not limited to their operation, i.e. energy consumption during their lifetime. Instead, they start with the extraction of building materials and extend to the disposal of demolition products, which constitute embodied emissions. In addition, energy efficiency measures taken to improve buildings’ energy performance and reduce operational emissions could also negatively affect embodied emissions. This is due to the manufacture of massive amounts of materials such as insulation, renewable energy, etc. Therefore, to promote this sector, embodied emissions must also be taken into account along with their operational counterparts throughout the building’s life cycle. This is to define and assess building performance fairly and clearly, and to better inform decision makers.
Furthermore, cost analysis must also be considered to support the final decision and demonstrate value for money and help identify the cost-effective alternative since the UK construction industry and the government aspire to reduce the initial cost of construction and the Life Cycle Cost (LCC) of assets by 33% in 2025. In this context, to accompany this change which concerns all states, and to participate in the evolution, several studies have been carried out to find the most effective mechanism of CO2 reduction: the renovation of existing buildings or their demolition and replacement by new buildings. This complex debate, which constitutes the present research problem, will be retaken in this report trying to have a clear answer to what can help the UK government achieve its CO2 reduction target cost-effectively.
This study aims to evaluate and compare the Life Cycle Carbon Footprint (LCCF) and LCC of refurbishment of an existing community centre building and its replacement (demolition and construction of a new one) to identify the performant and cost-effective alternative.
In a way to address the following research question: Is the renovation of existing buildings preferable to their replacement, from a LCCF and LCC perspective?
2. Case Study
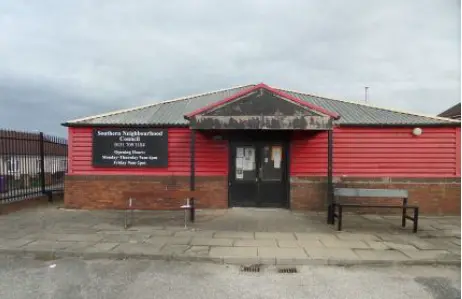
The existing structure is a single storey, 299 m2 building located in the north of UK. Its approximate age can be estimated at between 52 and 57 years based on the construction form and condition of the external fabric. The basic form of construction consists of brick/sheet cladding to the external walls with a sheet roof (Figure 1).
The external fabric is made of brickwork to the lower levels on all elevations with the upper sections formed using galvanised steel cladding. The internal fabric consists of plaster board finish to all walls and partitions with evidence of glass/mineral wool insulation. Regarding the roof, basic levels of thermal insulation are assumed based on the limited requirements of the Building Regulations at the time of construction. However, this building has several defects that make it non-compliant with current building regulations. Two potential alternatives are recommended to increase its efficiency and make it less energy-consuming: renovation and demolition with replacement construction. Furthermore, since the primary goal of this case study is to analyse the environmental impacts of the two scenarios of this building, the whole life cycle will be considered.
Prior to conducting this study, defects must be defined to know where refurbishment should occur.
External walls: At the lower level, the brickwork shows signs of weathering with localised damp areas due to defective rainwater goods and poor wastewater drainage below ground. This was confirmed by building managers and users. While the upper cladding sections are generally in acceptable condition and serviceable.
Roof: The sheeting to the roof has localised defects, and this could be confirmed through the internal condition of the ceiling.
Windows: The fenestration appears original and formed from softwood frames with single glazing units. However, timber exhibits extensive rotting due to exposure to ultraviolet (UV) light and elevated moisture content for a prolonged period of time (Figure 2).
Partitions: The plaster boarded walls to the external elevations are in good condition with the exception of one of the partitions that separate function room 1 from function room 2. There is extensive damage to the finishes and an exposed area of the insulation, because of the defective windows with water staining and mould growth evidence.
Ceiling: There is damage to the ceiling in the main function room of the building, which could cause air leakage into the building. Another water-damaged area is found in the toilets, where water stains the finish and causes localised defects in the plasterboard. It confirms the external observations regarding the defective roof sheeting.
Heating system: The lack of suitable heating and poor thermal comfort contribute to high levels of moisture retained by the building fabric; this is due to the electrical heaters distributed throughout the main open plan area of the main communal space.
3. Methodology
To conduct this study that aims to compare between the LCCF and Life Cycle Costing of two scenarios (refurbished and replacement with a new building) appropriately, first the European Standard EN 15978: 2011-Sustainability of construction works-Assessment of environmental performance of buildings-Calculation method under “RICS Professional Guidance” was used followed by the LCC to work out the financial performance of the building with respect to International Organization for Standardization (ISO) 15686-5 protocol.
• Life cycle carbon assessment: The environmental impact of the refurbished and newly constructed buildings in this research is evaluated based on the professional statement provided by[4] in line with the EN 15978 framework. This is because it is the most consistent method[5] as justified in the first paragraph of this section.
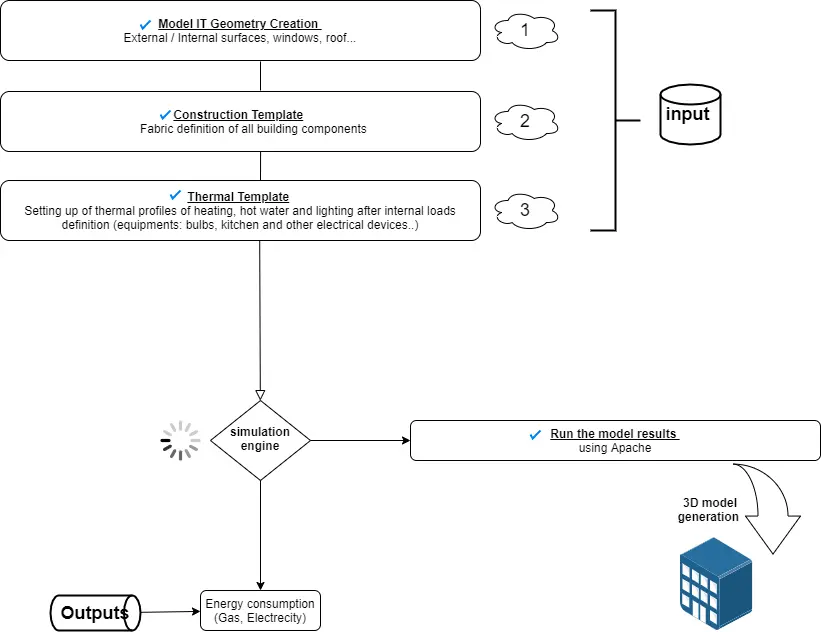
• Thermal simulation: To calculate LCCF values for both alternatives, operational energy use (for heating and lighting) should be calculated. To do so a thermal simulation tool Integrated Environmental Solutions-Virtual Environment (IES-VE) is used (Figure 3), first for the building’s generation and modelling, then the simulation comes later. IES was selected as it is easy to manipulate and gives accurate calculation results. In addition, it includes an extensive database and a wide selection of different structural building components with various energy consumption profiles.
• Life cycle cost: The financial performance of the building in this research was evaluated with respect to ISO 15686-5 protocol using the Net Present Value approach to estimate the overall cost of each alternative, since the minimum acquisition expense approach has been abandoned due to erroneous decisions, i.e., the project with the lowest investment cost does not always show the best value for money.
3.1 Life cycle carbon footprint
In fact, this method specifies the calculation process to assess the environmental performance of a building. It provides the means to report and communicate the assessment results[6]. It includes all upstream and downstream processes required to establish and maintain the building’s function, from the acquisition of raw materials to their disposal. However, EN 15978 methodology has been subject to various interpretations by authors using different scopes and assumptions. This has led to significant discrepancies in assessment results. Such limitations have restrained the reliability of this carbon measurement method. Therefore, a more consistent and harmonised approach relevant to the national context has been adopted to address the issue of inconsistent application of EN 15978 principles. This has been done to obtain reliable results. In this regard, the UK RICS have made a huge effort to standardise the whole life carbon assessment and enhance the consistency of the method. This is done by providing specific practical guidance for the implementation of EN 15978 methodology in carbon calculations[5]
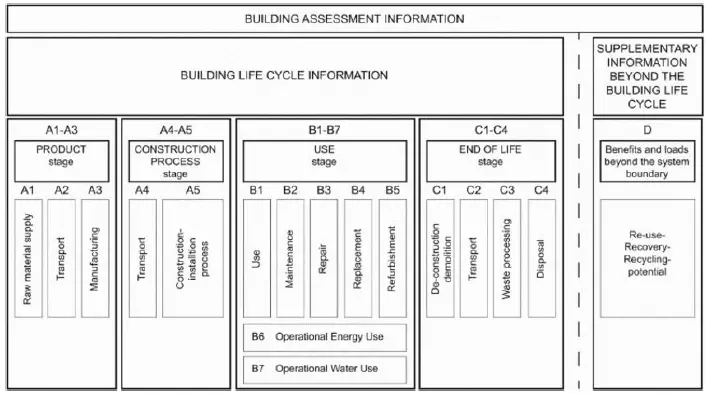
EN 15978 framework sets five main stages throughout building life cycles (Figure 4): product, construction, usage, end-of-life and recycling. They are further explained below, using CO2 emissions as a metric to assess life cycle performance.
3.2 Life cycle carbon footprint calculation formula
The environmental impact is calculated using equation (1) adding all the emissions occurring during building’s lifespan:
EP: Product stage emissions (kgCO2e/m2).
EC: Construction stage emissions (kgCO2e/m2).
EU: Use stage emissions (kgCO2e/m2).
EEOL: End-Of-Life stage emissions (kgCO2e/m2)
Where
a.Product stage emissions
[A1-A3] = Material quantity × Material embodied carbon
b.Construction stage emissions
Transport emissions are calculated as follows:
[A4] = Material system mass × transport distance × carbon conversion factor
• Construction & installation process emissions
[A5] = Construction equipment energy consumption × Energy carbon factor
c.Use stage emissions
• Replacement and Refurbishment
[B4-B5] = Material quantity × Material embodied carbon factor
• Energy mathend
[B6] = Energy consumption × Energy carbon factor
• Water
[B7] = Water consumption × Water carbon factor
d.End-of-Life
• Deconstruction and demolition
[C1] = Crane fuel consumption × Fuel carbon factor
• Transport
[C2] = Materialor system mass × transport distance × carbon conversion factor
• Recycled and wasted materials emissions
[C3] = Materialor quantity × waste or recycling carbon factor
3.3 Life cycle cost
Life Cycle Costing is a decision-making technique that helps users calculate both initial and future investment costs in construction projects. Regarding buildings and structures, LCC considers capital cost, costs in use including maintenance, replacement and other related services during a given period, and end-of-life costs[7] which facilitates budgeting, cashflow forecasting and option appraisal, at any specific point in time of a project[8].
By calculating the total costs during the building’s lifecycle from cradle to grave, LCC is carried out in this report in order to determine the most cost-effective option - refurbishment and new building. It was necessary to use the same stages as in LCCF, except for modules [C3] and [C4], since there is no certain information on waste processing and disposal, which increases the degree of uncertainty in the findings, if taken into account.
To evaluate the stream of future costs and discount them to present values, they should be converted to a net present value (NPV) using the following equation:
Where
C: The cost in year n;
d: The expected real discount rate per annum;
n: The number of years between the base date and the occurrence of the cost;
p: The period of analysis.
The study period begins with the base date. All expenditure up to that date is added to LCC and treated as capital expenditure involving no discounting[4]. As LCC in the present study is done in conjunction with environmental analysis, the analysis period is the same as the entire building life (30 years). This is to ensure consistency with the LCA of environmental impacts. Hence, all cashflows for the 30-year study period are discounted to their present value at the base date. This is the construction completion. In light of this, the value of money fluctuates over time. Therefore, to be able to compare cash flows incurred at different times during the life cycle of a project, BS ISO 15686-5 recommends that they be made time equivalent. In doing so, the LCC method brings all future costs to the current value of money called ‘present value’. This is done by discounting them using a ‘discount rate’ to a common point in time, which is usually the base date.
In this context, HM Treasury guidance suggests that within the next 30 years which represents the present study’s lifespan, 3.5% should be used for discounting cashflows. Finally, in LCC studies, it is common to use an assumed inflation rate to estimate future costs in actual pounds. The choice of an inflation rate for such estimations can strongly affect the calculated LCC. Hence, the average inflation rate for energy and water prices was around 2% according to the Office for National Statistics’ forecasts. This was to keep inflation stable and low in the long term[9]. The following equation (3) shows the inflation factor applied to energy and water costs. It is discounted afterwards to take into account the present value of future cashflows using equation (4).
e: Inflation rate in %;
n: The number of years between the base date and the occurrence of the cost.
d: Discount rate in %;
Multiplying equations (3) and (4) gives the formula (5) of Single Present Value (SPV) factor, that considers both inflation and discount simultaneously, used to calculate the NPV of operational gas and water costs.
a.LCC calculation formula
The following general LCC formula for buildings was used in the present case to summarise all costs that occur through the building lifetime from cradle-to-grave, applying the net present value formula:
C: Construction costs;
O: Operational energy and water costs;
M: Maintenance costs;
EOL: End-of-life costs.
After identifying the different properties (geometrical and thermal) of the selected existing case study building, research has been carried out in the reviewed articles and the web, for the best and lowest carbon materials to be introduced in both scenarios that will ultimately reduce CO2 emissions. Moving on to carbon life cycle calculation, emission factors are required. In this regard, based on the materials selected and on the existing plan of the building, the quantification of embodied carbon emissions has been carried out using embodied factors that were obtained through secondary data collection from ICE database[10] which is a robust and reliable meta-database based upon a large literature review to collect embodied carbon of construction materials, also it is the most recommended by RICS in their report of ‘Methodology to calculate embodied carbon of materials’ when more specific factors from manufacturers are not available, which is the case in this study. While operational emissions consist of primary data obtained through IES thermal modelling software running a simulation to collect energy use data which was hard to estimate, as replacement and refurbishment have not taken place yet in the real world to have pre-recorded data in bills, this data was then converted to operational carbon based on the most recent GHG conversion factors[11] that were issued by designated bodies and made available in the government website for UK company reporting and calculating the carbon equivalent (CO2e) impact of electricity, transport, fuel consumption, and water supply. There was no difference regarding setting parameters between refurbishment and radical replacement of a community centre building when using IES-VE for simulation, as the same construction materials were used in both cases and since the software does not consider embodied carbon of materials which is determined using the LCCF formula. It is worth noting that the majority of building fabric was extracted from[12] report, in which they carried out visual inspection that described fabric physical conditions to refurbish the present case study building. Regarding Life Cycle Costing of the project, costs of materials, labour work, transport, energy, and water are needed. Therefore, manufacturers’ websites were consulted to find material costs according to the project specifications and requirements, labour expenses were estimated using the UK labour market hourly wage according to the duration of the construction work, while transport costs were based on miles travelled. Concerning gas prices, it was derived from UK Power to calculate the cost of energy used per kWh[13], and the water cost per m3 provided by Thames Water the UK’s largest water and wastewater services company[14].
4. Royal Institute of Chartered Surveyors Requirements Considered to Conduct Life Cycle Carbon Footprint
RICS requirements that need to be considered for the complete whole life carbon assessment of a built project. To enable consistency of the selected method, there is first the Reference study period (RSP) which in the present case study is considered 30 years. This could be justified by the fact that the research aims to meet the UK’s 2050 carbon reduction target. Furthermore, the majority of components replaced in the refurbishment scenario have an expected lifetime of 30 years. Therefore, the use of an RSP of 30 years would avoid further emissions resulting from future refurbishments during the building’s lifespan. Furthermore, the whole life carbon assessment must consider all components and works related to a building’s site, including its foundation and superstructure (frame, roof, exterior walls, windows and doors, partitions, all finishes...). However, external works within the site boundary are not included as no information is available that mentions the amount or type of works installed at this site. Third, for transparent and credible carbon results, the boundaries of the whole life carbon assessment and the life cycle stage modules covered must be explicitly stated and justified. Therefore, it can be acknowledged that the present assessment covers the cradle-to-grave scope [A] to [C], while module [D] is excluded as RICS recommends it must be communicated separately and not aggregated with the cradle-to-grave carbon figures to avert its inherent future uncertainty. The modules included in each case are stated separately as follows:
For first-time builds, all life cycle stages are applicable. Regarding demolition works related to the existing building, they are often decoupled from the newly built asset as the latter is not responsible for any emissions arising from demolition of the old building. Therefore, all carbon emissions associated with demolition of the existing building should be reported individually and not aggregated with the rest of the project emissions.
When refurbishing an existing building, all life cycle stages apply to any new elements. While emissions related to existing items being retained are not accounted for, only emissions associated with modules [B], [C] should be considered over the life cycle, in other words, the emissions from the product and construction stages [A] linked with the existing building remain outside the scope of the project under study. Furthermore, to be consistent with the scope of whole-building LCA in a new construction scenario that does not include disposal of an existing building, any removal of building elements to get the structure to the ‘cleared flat site’ equivalent state should be considered demolition works and reported separately (Figure 5). Finally, the whole life carbon assessment results are reported using the following unit: kgCO2e.

Figure 5. Adopted scope for comparative LCCF of refurbishment scenario and new construction scenario. LCCF: life cycle carbon footprint.
5. Scenarios Analysed
As mentioned previously, two scenarios were considered to undertake this study, refurbishment, and complete demolition followed by new construction. Both scenarios are different from each other as presented below.
5.1 Refurbishment scenario
To upgrade the building fabric and eliminate defects detected, refurbishment should be implemented. In doing so, it is important to distinguish elements to be retained from those replaced, not to overestimate consequent emissions.
a.Retained elements
• All upper cladding sections of external walls are retained as they are generally in reasonable condition and therefore serviceable.
• All partitions are well maintained except the one indicated below.
• The substructure, floor, and doors are retained.
b.Refurbished elements
• The bricks of the left-hand side external wall of function room 1 under the damaged windows are changed as it showed signs of damp, besides insulation will be added to all external walls including the upper cladding section.
• The steel cladding roof is totally replaced by timber.
• All windows are replaced with a doubled glazed ones as there were some damaged and as all of them are a simple glazing contributing to more heat loss.
• One damaged partition that separates function room 1 from function room 2 is changed.
• Function room 1 and toilet ceilings are damaged, thus replaced and an insulation and a plasterboard are added to the whole ceiling.
• Glass wool insulation is added between timber floor joists topped with carpet is to limit heat loss through exposed floor.
5.2 New build scenario
The whole building was completely demolished and rebuilt to respect building regulation part L. The upper level of external walls and roof cladding was made of timber as it is a low carbon material. Timber has been shown to be a more valuable construction material to rebuild new structures in case of demolition[15] as its impact on the environment is 34% to 84% lower than that of reinforced concrete structures[16]. Furthermore, there is a second benefit from using timber as a construction material substitute, which is the sequestration and long-term storage of ‘biogenic’ carbon in the timber products themselves[17].
In fact, the same materials chosen for the refurbishment scenario were applied in this case to have a just comparison. For instance, insulation added to different constituents was mainly composed of glass wool, windows were double glazed, and doors made of wood, with plaster boards added to each of partitions, ceiling, and internally to external walls. Except, the exposed ground floor this time consisted of clay, concrete, screed, and insulation made of polyurethane. A study by[18] investigated eight types of insulation materials that are currently available on the market, namely: vacuum insulated panels, aerogel, phenolic foam, polyurethane, polyisocyanurate, expanded polystyrene, glass wool and wood fibre. In their useful study[18] concluded that glass wool has a carbon payback time of less than one year compared to other materials, which indicates that this insulation material is the most appropriate to be introduced in the present study building to improve its thermal conditions while reducing its carbon emissions.
This seems different from the refurbished building’s floor as construction standards in the 60s did not require higher levels of thermal performance as the actual regulation does.
6. Simulation: Geometry and Materials
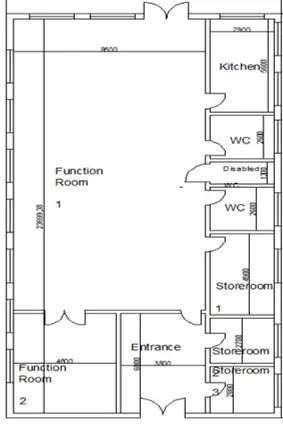
Building geometries were constructed using the IES-VE Model IT module based on Figure 6 plan dimensions. All components including partitions, ceiling, floor, external walls, doors, glazing, and roof were built based on observations made during inspection carried out[12]. In the refurbishment scenario, the elements identified as defective were replaced, upgrading their thermal properties. Then, a total reconstruction took place in case of demolition. However, in both scenarios low carbon materials were considered, in parallel with efficient measures and renewable energies. This was to meet current building regulations and compare fairly.
7. Calculation of Life Cycle Cost and Analysis
7.1 Actual costs without discount
In the study, specific building components to be replaced and accounted for maintenance costs have different service lives. These components are wall finishes, floor carpet and insulation. Energy systems (gas boiler and solar photovoltaic panels) applied in the case study are assumed to be serviceable during the study period of 30 years. Before applying discount and inflation rates to calculate the LCC, all actual costs of different components are calculated and illustrated in Table 1.
| Cost in £ | |||
| Refurbishment | New building | ||
| Construction | Material | 40,916.10 | 196,899.91 |
| Labour work | 5,335.5 | 15,072 | |
| Transport | 135.45 | 171.15 | |
| Operation | Gas | 21,015.12 | 11,467.8 |
| Water | 3,657.49 | 3,657.49 | |
| Maintenance | 7,388.58 | 7,388.58 | |
| End-oOf-Life | 20,025.5 | 20,025.5 | |
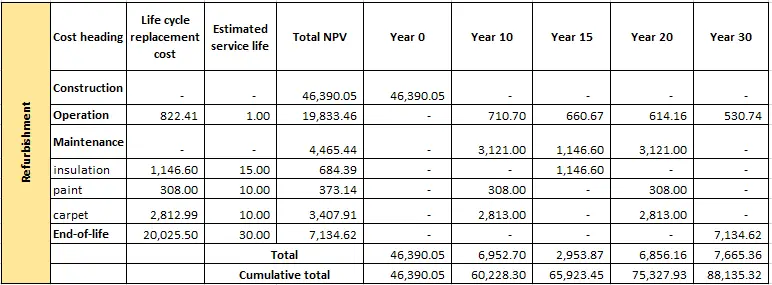
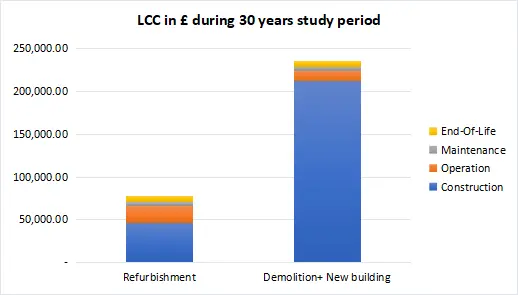
Figure 7 compares the costs of each phase during the building lifespan in both scenarios. It is clear that the construction costs of the newly constructed building are significantly higher than those of the refurbished. This can be explained by the quantity of purchased and transported material that a new building needs to be built. In addition, it has its related long hours of labour work. Furthermore, operational gas costs are lower in the new building due to the quality of construction that meets regulations and standards set to save fuel. In contrast, water, maintenance and end-of-life costs are the same in both cases, since water consumption was estimated to be similar as the number of people occupying the building has not changed. In addition, maintenance work, which included the replacement of wall finishes, insulation and floor carpeting, took place in both cases considering the same quantities of materials, and the same dimensions of the building. The same applies to the end-of-life phase, which only considers demolition and transport to landfill, excluding recycling and waste treatment, which, if added, will cause variations in costs in the different scenarios.
7.2 Life cycle cost results using net present value approach
When discounting future costs to present values, the time value of money should be considered. With NPV formula, the total LCC was calculated using 3.5% discount rate and 2% inflation rate for 30 years (Figure 8). It is worth reminding that construction costs were not discounted since the base date started after construction completion.
Figure 8 shows the total LCC for 30 years using a discount rate of 3.5% including inflation of 2%. Price changes are visible at the level of construction even discounted to the present value, which confirms the burden of material and labour work in each scenario such that in the new building case, construction costs account for 89% of the total LCC, while in refurbishment, a ratio of 60% is attained. The second highest cost is that related to operation (water and gas), which represents 5% in the newly constructed building option and 25.5% for retrofitting, which suggests the role the updated envelope material has played in saving energy since water consumption is similar in both cases. Maintenance and end-of-life costs constitute the tiniest part of the cost of replacement with another building or refurbishment with a total of 5%, 15% respectively.
7.3 Life cycle cost analysis over 30 years
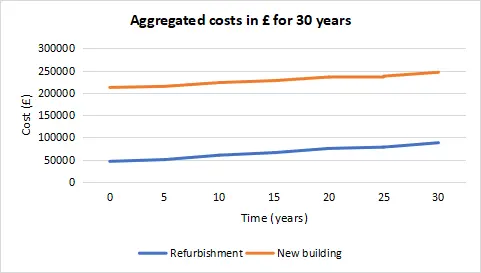
Figure 7 and Figure 9 depict refurbishment and newly constructed building’s total LCC model. It is worth noting that not all years were listed in the tables, however, cumulative totals over 30 years include costs in hidden years. It should be noted that the selection of the shown years was not arbitrary but based on the years where maintenance works (replacement of carpet, insulation, and wall finishes) incurred depending on their life expectancy. In year 0 only construction costs occur since it is considered as the base date. Concerning cumulative costs at the 30th year which is the last year of the present study period and that represent the total LCC, they were overwhelmingly higher in the new building case with a ratio of 64% as shown in Figure 10, which tips the balance in favour of refurbishment as a viable low-cost option.
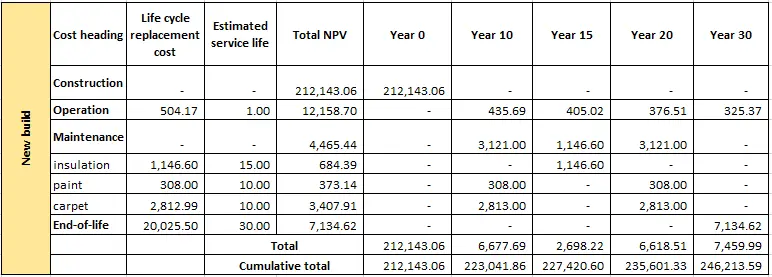
Figure 9. Demolition and new building LCC model for 30 years. LCC: life cycle cost.
8. Results
8.1 Life cycle carbon footprint
8.1.1 Carbon emissions from each life stage
In this section greenhouse gases emitted during each life stage of the building assuming the RSP estimated at 30 years are displayed. A comparison between the refurbishment option and its counterpart demolition and newly constructed building is carried out to find out which is environmentally better.
Figure 11 illustrates the amount of carbon emitted throughout 30 years by the building comparing refurbishment against new construction. Overall, it is apparent that new construction is the most problematic scenario as it generates double the amount of refurbishment. This accounts for more than 215,000 kgCO2, owing to the product stage that emits the largest share exceeding 78% of total emissions during the building’s life span. Nevertheless, energy consumption related emissions included in the use stage were lower only accounting for 12%. This shows the role the new material has played in reducing environmental impact during building occupancy. These asserted[19] findings which acknowledge that the environmental impact from additional energy saving measures (i.e. material additions) will be compensated by lower operational energy use. A refurbishment project is the largest emitter, reaching 60% of the entire LCCF, mainly due to energy (heating and hot water) and water consumption, as electricity is no longer drawn from the national grid. Furthermore, in refurbishment scenarios, most of the original building’s fabric (ground floor, partitions, roof, external walls, etc.) was retained and upgraded except for imperfections. This can be indicated by the lower impact of the product stage, representing less than 34% of total emissions. This reflects the smaller quantity of materials replaced compared to new construction where the whole building was rebuilt with massive materials in place. Regarding end-of-life stage it corresponds to a small part in refurbishment and new build scenario with 6% and less than 4% respectively, let alone construction stage which does not reach even seven-hundredths of one percent.
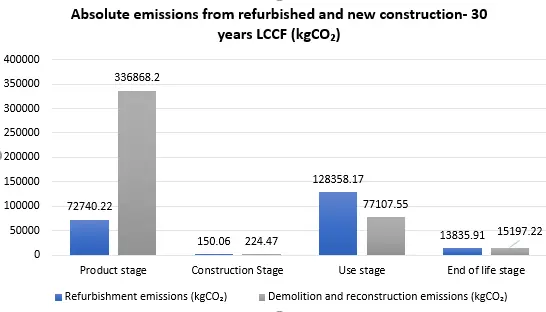
Figure 11. Absolute emissions from refurbished and new constructed building at each stage-30 years LCCF. LCCF: life cycle carbon footprint.
8.2 Life cycle cost
Discounting future costs to present values is important when considering the time value of money. A discount rate of 3.5% and inflation rate of 2% were used for 30 years to calculate the total LCC using the NPV formula. It is worth reminding that construction costs were not discounted since the base date started after construction completion. Figure 10 shows that the cumulative costs of the LCC were overwhelmingly higher in the new building case with a ratio of 64%. This tips the balance in favour of refurbishment as a viable low-cost option.
9. Discussion and Selection of the Best Scenario Rrefurbish or Demolish
In this section an answer to the present study’s question, “Is the renovation of existing buildings preferable to their replacement, from a LCCF and LCC perspective?” is given. When comparing new construction with the refurbishment option, this latter outperforms in all life cycle carbon stages except in use stage where maintenance related processes such as replacing insulation materials of different parts including external walls, ceiling, partitions to maintain a high thermal performance level during the building’s life span, is heavier due to the mass of insulation fabric applied. While in the new build scenario the floor insulation was not upgraded as a polyurethane board was contained from the first time the exposed ground floor was constructed, and since this matter is rigid and able to maintain its very low conductivity over time, through its closed cell structure that helps to withstand external impacts such as moisture (High Performance Insulation), its useful life could exceed 50 years, whereas in the current study only 30 years are considered, thus there is no need to change floor insulation in the new build case. Moreover, as use stage contains operational energy use as well, the resulting emissions are larger in refurbished buildings, floor thermal properties are slightly above regulations, which could be the main justification for the higher operational carbon emissions in comparison to new built operational emissions, this makes the new construction the best performing case in terms of use stage emissions—about 40% lower rates—however, under the analysis scope and constraints of the present study and considering the whole LCCF, it can be concluded that refurbishment scenario is the best option since it emits 50% less greenhouse gases than new build case (refurbishment and new build LCCF values: 719.34 and 1,436.11 kgCO2e/m2 respectively). This can be further justified from an LCC point of view where refurbishment accounts only for £ 88,135.32 of aggregated costs throughout a 30-year period compared to £ 246,213.59 expended on new building. This suggests that refurbishment is economically viable.
10. Significance of This Study
For the first time, this paper used an innovative method developed by the RICS to obtain credible results for a comparative analysis in parallel with cost performance evaluation. Such study could assist stakeholders and student researchers in the field of built environment to develop more understanding of environmental assessment and to evaluate the life cycle performance of their designs more confidently and indicate whether the analysis they carry is within a reasonable range of results. Moreover, this paper carries a significant finding that will help to meet the UK government’s commitment to reduce net carbon emissions to zero by 2050 and respond to the evolving needs of society and the economy cost-effectively and without harming the environment by showing to the building industry that has a big role to play that opting for refurbishment of a used building rather than demolishing it and rebuilding it again is the best solution. Through retaining the existing structure, refurbishment requires less materials and embodied carbon.
11. Conclusion
In line with a number of research with similar purpose which compared the environmental performance of refurbishment and total replacement scenarios despite the following:
• Undertaken in different locations.
• Different types of buildings (residential, hospital, university) are used.
• Divergence in evaluation methodologies, data sources and interpretation techniques used especially in terms of system boundary definition.
However, the vast majority supported renovation over demolition and new construction. The results of the present study’s investigation are similar to those of[20-23] who found that buildings’ renovation or rehabilitation reduce environmental impacts associated with building components’ lifecycle. Contrary to popular belief, new construction is heavily reliant on the production of carbon-intensive structural materials such as concrete, steel, and envelope materials[21], making it the most environmentally damaging option. This is from an environmental perspective. Regarding the economic evaluation the study by[20] theorised that refurbishment budgetary requirements are lower than those of demolition and new construction. This confirms the economic results of the present study withdrawn from the LCC analysis. Therefore, with regards to the main research objectives that were fully addressed to answer the outlined aim, and based on the assumptions considered, this study has shown that the refurbishment scenario is favourable in terms of an environmental and economical viewpoint, since it achieved a 50% smaller CO2 footprint and reached 64% lower costs throughout the building’s life cycle.
Authors contribution
All authors contributed equally to this work.
Conflicts of interest
Mawada Abdellatif is an Editorial Board member of Journal of Building Design and Environment. The other authors declared that there are no conflicts of interest.
Ethical approval
Not applicable.
Consent to participate
Not applicable.
Consent for publication
Not applicable.
Availability of data and materials
Not applicable.
Funding
None.
Copyright
© The Author(s) 2023.
References
-
1. Designing Buildings Wiki. Carbon dioxide in construction [Internet]. 2022 Mar [cited 2021 May 23]. Available from: https://www.designingbuildings.co.uk/wiki/Carbon_dioxide_in_construction#Uses_in_construction
-
2. UK Green Building Council. Climate change mitigation [Internet]. Available from: https://www.ukgbc.org/climate-change/
-
3. UK SHARED BUSINESS SERVICES LIMITED. Enforcing the enhancement of energy efficiency regulations in the English private rented sector [Internet]. 2019 Jun [cited 2021 May 24]. Available from: https://assets.publishing.service.gov.uk/attachment_data/file/825485.pdf
-
4. RICS. Life cycle costing. 1st ed; 2016 [cited 2021 Jul 25]. Available from: https://www.rics.org/globalassets/rics-website/media/upholding-professional-standards/sector-standards/construction/black-book/life-cycle-costing-1st-edition-rics.pdf
-
5. RICS. Whole life carbon assessment for the built environment. 1st ed; 2017 [cited 2021 Mar 14]. Available from: https://www.rics.org/globalassets/rics-website/media/news/whole-life-carbon-assessment-for-the--built-environment-november-2017.pdf
-
6. The European Committee for Standardization. Sustainability of construction works-ssessment of environmental performance of buildings-Calculation method [Internet]; 2011 [cited 2021 Mar 29]. Available from: https://standards.iteh.ai/62c22cef-5666-4719-91f9-c21cb6aa0ab3
-
7. BM TRADA Certification. TRADA technology addresses Life-cycle costing [Internet]; 2019. Available from: https://www.fenestration-news.com/News/Article/6167/TRADA-Technology-addresses-Life-Cycle
-
8. Schwartz Y. An integrated thermal simulation & generative design decision support framework for the refurbishment or replacement of buildings: A life cycle performance optimisation approach [dissertation]. Bloomsbury: University College London; 2018 [cited 2021 May 28]. Available from: https://discovery.ucl.ac.uk/id/eprint/10064687/1/Schwartz_10064687_thesis%20with%20abstract.pdf
-
9. Trading Economics. United Kingdom Inflation Rate; 2021 [cited 2021 Jul 25]. Available from: https://tradingeconomics.com/united-kingdom/inflation-cpi
-
10. Hammond G, Jones C. ICE-Inventrory of Carbon & Energy V3.0. Bath. 2019.
-
11. Department for Energy Security and Net Zero, Department for Business, Energy & Industrial Strategy (UK). Greenhouse gas reporting: Conversion factors 2021 [Internet]; 2021 [cited 2021 Aug 25]. Available from: https://www.gov.uk/government/publications/greenhouse-gas-reporting-conversion-factors-2021
-
12. Abdellatif M, Atherton W, Brady L, Farragher M. Liverpool: LJMU Report on initial findings for refurbishment of the Southern Neighbourhood Council Building, 2014.
-
13. UK Power. Compare energy prices per kWh [Internet]; 2021 [cited 2021 Jul 19]. Available from: https://www.ukpower.co.uk/home_energy
-
14. Thames Water. How we calculate your bill [Internet]; 2021 [cited 2021 Jul 19]. Available from: https://www.thameswater.co.uk/media-library/home/help/billing-and-account/understand-your-bill/metered-customers/how-we-calculate-metered-bills-2020-21.pdf
-
15. Pittau F, Amato C, Cuffari S, Iannaccone G, Malighetti LE. Environmental consequences of refurbishment vs. demolition and reconstruction: A comparative life cycle assessment of an Italian case study. IOP Conf Ser: Earth Environ Sci. 2019;296:012037.[DOI]
-
16. Huang L, Liu Y, Krigsvoll G, Johansen F. Life cycle assessment and life cycle cost of university dormitories in the southeast China: Case study of the university town of Fuzhou. J Cleaner Prod. 2018;173:151-159.[DOI]
-
17. Spear M, Hill C, Norton A, Price C. Wood in construction in the UK: An analysis of carbon abatement potential [Internet]; 2019 [cited 2021 Jun 6]. Available from: https://www.theccc.org.uk/wp-content/uploads/2019/07/Wood-in-Construction-in-the-UK-An-Analysis-of-Carbon-Abatement-Potential-BioComposites-Centre.pdf
-
18. Li X, Tingley DD. Solid wall insulation of the Victorian house stock in England: A whole life carbon perspective. Build Environ. 2021;191:107595.[DOI]
-
19. Van Gulck L, Van de Putte S, Delghust M, Van Den Bossche N, Steeman M. Environmental and financial assessment of façade renovations designed for change: Developing optimal scenarios for apartment buildings in Flanders. Build Environ. 2020;183:107178.[DOI]
-
20. Alba-Rodríguez MD, Martínez-Rocamora A, González-Vallejo P, Ferreira-Sánchez A, Marrero M. Building rehabilitation versus demolition and new construction: Economic and environmental assessment. Environ Impact Assess Rev. 2017;66:115-126.[DOI]
-
21. Hasik V, Escott E, Bates R, Carlisle S, Faircloth B, Bilec MM. Comparative whole-building life cycle assessment of renovation and new construction. Build Environ. 2019;161:106218.[DOI]
-
22. Palacios-Munoz B, López-Mesa B, Gracia-Villa L. Influence of refurbishment and service life of reinforced concrete buildings structures on the estimation of environmental impact. Int J Life Cycle Assess. 2019;24(11):1913-1924.[DOI]
-
23. Sanchez B, Esnaashary Esfahani M, Haas C. A methodology to analyze the net environmental impacts and building’s cost performance of an adaptive reuse project: A case study of the Waterloo County Courthouse renovations. Environ Syst Decis. 2019;39(4):419-438.[DOI]
Copyright
© The Author(s) 2023. This is an Open Access article licensed under a Creative Commons Attribution 4.0 International License (https://creativecommons.org/licenses/by/4.0/), which permits unrestricted use, sharing, adaptation, distribution and reproduction in any medium or format, for any purpose, even commercially, as long as you give appropriate credit to the original author(s) and the source, provide a link to the Creative Commons license, and indicate if changes were made.
Publisher’s Note
Share And Cite


