Abstract
The residential sector is responsible for the consumption of 46% of the building’s total primary energy consumption in Jordan. The Jordanian housing stock will need to be significantly improved to meet the government’s commitment to reduce national emissions by 2050. This research aims to examine the available statistical data on residential buildings, to help better understand the current state of housing stock in Jordan and pave the way to generate a national housing stock model, as well as to identify opportunities in improving the energy efficiency of these buildings. The study synthesized data from the Department of Statistics housing survey and the Jordan Green Building Council survey to investigate the Jordanian national housing stock. The aggregated data was examined using a descriptive statistical analysis method. The data was then merged to provide aggregated datasets with detailed building characteristics.The study successfully characterized residential buildings archetypes and identified a range of typical thermal performance-related building characteristics (e.g., envelope properties, heating, ventilation, and air conditioning systems, lighting systems, etc.). The findings of the statistical analysis can be useful for policymakers in Jordan to gain insights into the current state of the housing stock, identify trends and patterns, and make informed decisions and initiatives such as the improvement of regulatory building code requirements for energy efficiency.
Keywords
1. Introduction
Residential sector is the principal source of greenhouse emissions accounting for about 60% of the total sector emissions[1]. Buildings are responsible for 40% of global energy use and one-third of greenhouse gas emissions. Jordan’s dependence on imports makes energy one of the most significant security concerns it faces[2]. Jordan is one of the Middle East countries, and as its population has increased so has the demand for housing. The country is 89,318 square kilometers in size and has a varied geography with about 75% of that area being desert[3].
92% of Jordan’s primary energy requirements were imported in 2018, at a cost equivalent to nearly 10% of its GDP[4]. According to previous studies[5-7], the residential sector has one of the most substantial and cost-effective potentials for lowering energy-related greenhouse gas (GHG) emissions by employing housing stock improvements, such as the use of building’s envelope insulation, solar panels, and solar hot water system.
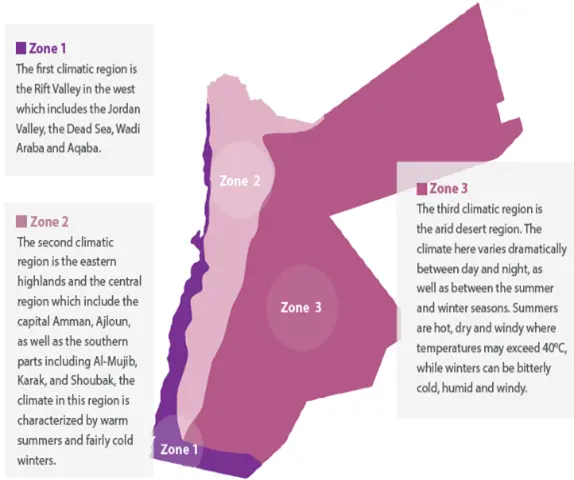
Local climate has a major impact on energy consumption patterns, and climate data are essential for modelling and simulating energy performance across different regions. The Jordanian climate is typically divided into three major climatic zones as shown in Figure 1[6]; the Jordan Valley ‘Zone 1’, the Desert or Badia region ‘Zone 3’ and the Mountain Heights Plateau ‘Zone 2’—where around 75% of Jordan’s inhabitants live[7]. As an important source of data, housing surveys help determine the demand for new housing developments, direct the creation of policies, and analyze the success of current housing programs.
The Jordan’s Department of Statistics (DOS) housing survey and the Jordan Green Building Council (JGBC) survey are two housing surveys that can help characterize the country’s housing stock. To create a thorough database of Jordan’s residential energy consumption, DOS housing survey was conducted in 2015. JGBC survey was conducted to find out the energy consumption of residential apartments after the 2000s in Amman to develop a benchmark[8].
While both surveys held important information about the Jordanian housing stock, they have not been explored in conjunction to improve the performance of the housing stock. A comprehensive and integrated source of data that addresses both building and system characteristics is, therefore, required.
The aims of this study are to:
• Enhance the understanding of the characteristics of the Jordanian residential sector and its energy use.
• Create a unified national database of building characteristics to support building energy efficiency research in Jordan.
• Identify effective solutions to reduce the energy use and carbon emissions, and provide useful insights and facilitate policy making in this field.
This study improves the understanding of the energy performance and building characteristics of dwellings in Jordan by integrating a DOS national on-site survey with other publicly available data sets such as the benchmark developed by JGBC for apartments in Amman.
2. Literature Review
Due to global concerns about climate change and sustainable development, energy efficiency and carbon emissions in residential buildings have drawn greater attention in recent years. Jordan’s residential sector faces several challenges in terms of energy consumption, such as high electricity demand, increasing costs, and environmental impacts. However, the research on this topic in Jordan has been limited, with only a few studies conducted to date. This lack of research poses a significant knowledge gap that needs to be addressed to support the country’s sustainable development goals. While a body of work exists on the energy performance of housing units in Jordan[9-11], most studies focused on the analysis of existing housing units or typical characteristics of one of many building typologies. Furthermore, most of the work was focused on specific climate regions (e.g., Amman area).
In Jordan, as in most developing countries, a large number of residential buildings have significant energy losses through the building envelope[9]. The reduction of such losses would considerably improve energy efficiency, resulting in lower CO2 emissions. Previous studies have demonstrated that a few suggested strategies for improving the stock performance, including the use of more energy-efficient HVAC systems and thermal insulation of buildings, could lower energy consumption and CO2 emissions in the residential sector[10-12].
Though several studies did evaluate the energy needs of Jordan’s residential buildings[10-12], stock models are still required to analyze the energy performance and overall carbon emitted from the residential sector as a whole, to support policy and provide future improvement strategies. One such crucial improvement strategy is the potential of refurbishments. By integrating refurbishment strategies and adopting energy-efficient technologies, the residential sector, that accounts for almost 43% of the total electricity consumption in Jordan[9], can make significant strides in reducing its environmental footprint.
Other studies explored insights toward the improvements of housing units in Jordan, reflecting on the country’s complex social, economic and environmental challenges. Al-Ghandoor et al.[13] indicated that according to available data and research objectives, the ‘general model approach’, which is based on multivariate regression analysis, can be used for analyzing and determining various factors that affect fuel and energy consumption in various building sectors. The study provided a chronological annual analysis of fuel and electricity consumption of the entire housing stock in the country, and concluded that the population growth in Jordan, income level, and fuel prices are the most significant factors affecting the consumption of electricity. The study emphasized that dwellings in Jordan do not employ efficient lighting and solar energy.
Bataineh and Alrabee examined the potential for energy-saving measures in typical house typology in Jordan[9]. The study identified several barriers to energy conservation, including lack of awareness, insufficient funding, and limited policy support. The authors suggested several policy interventions to promote energy conservation and reduce carbon emissions in residential buildings as this retrofit program will create thousands of job opportunities for engineers and technicians.
A study on buildings in the city of Aqaba evaluated the total energy performance of the Aqaba Residential Energy Efficiency (AREE) pilot project to reduce energy consumption and carbon emissions by implementing energy-efficient measures, such as passive design elements (orientation, appropriate sizing of windows and shading) and improved envelope construction (insulation and double glazed windows)[14]. The study showed that the AREE’s energy consumption is 27% lower than the average consumption of conventional buildings in Jordan after employing energy-efficient measures. The lack of locally based capability for the installation, maintenance, and operation of systems, such as a solar-powered absorption cooling system, exacerbates the challenge.
A study on the thermal and financial effects of using passive and active solar systems in a typical Jordanian house typology found that the building that was oriented towards the south had the best potential in achieving zero-heating residence (Jaber et al.[15]).
Ali et al. investigated improving the energy performance of a typical house model in Irbid as a case study for the near zero energy design by focusing on several parameters including orientation, layout, windows type, and shading system, to improve the energy performance of new-built. After applying thermal insulation as recommended by Jordanian building code on existing housings, the study showed that more than 18% of total energy saving can be achieved. It concluded that the optimum passive design strategy consists of a square layout, a south-facing entrance and a 15% window-to-wall ratio (WWR). This study recommended rewriting and redesigning Jordanian building codes.
Overall, the literature review highlights the need for further research on the housing stock in Jordan to address the challenges facing the sector and promote sustainable housing. The present study is constrained both in terms of geographical extent (limited to specific regions) and scale (investigating a relatively modest number of building attributes).
Furthermore, the review suggests that policy and regulatory reforms, along with targeted goals such as getting to zero carbon emissions by 2050, may be necessary to improve the housing stock in Jordan and meet the recommended targets. In spite of the valuable contributions, the research pertaining to energy performance and carbon emissions in residential constructions within Jordan remains rather limited and will benefit from an integrated and holistic approach at scale.
3. Methodology
The task of creating a reliable building energy model of existing buildings involves the following subtasks: simulation input organization (data input), the generation of thermal model (thermal modelling) as well as outcomes validation (validation)[16].
The data input of the available databases in Jordan was identified, as well as the characteristics and sample of each survey. An integrated dataset was generated from both general building characteristics and energy data and subsequently analyzed to define the final unified dataset of housing characteristics and energy demand. The study also outlined the method of using the aggregated dataset to generate a housing stock model for Jordan. Figure 2 identifies the three levels of proceeding toward developing a unified data set, from identifying data input to creating an integrated dataset to defining the output data following data aggregation.

Figure 2. Flowchart of the investigation of DOS and JGBC housing surveys. DOS: Department of Statistics; JGBC: Jordan Green Building Council.
3.1 Defining input data
Building stock survey data is the start of the methodology to model urban building stock using data-driven bottom-up energy modelling[17]. This study analyzes the available statistical data from the following two sources:
• DOS housing census.
• JGBC survey.
3.1.1 Deriving the department of statistics database
DOS housing survey was carried out in 2015 to provide a representative database of building characteristics and energy consumption in the domestic sector in Jordan, both in the countryside and urban areas. The sample of the survey involved households distributed over all governorates of the country[18].
It was based on a sample of approximately 2,500 randomly selected residential buildings in Jordan considering the number of flats when selecting the apartment units to ensure variant archetypes with different floor numbers and areas are included as shown in Figure 3.
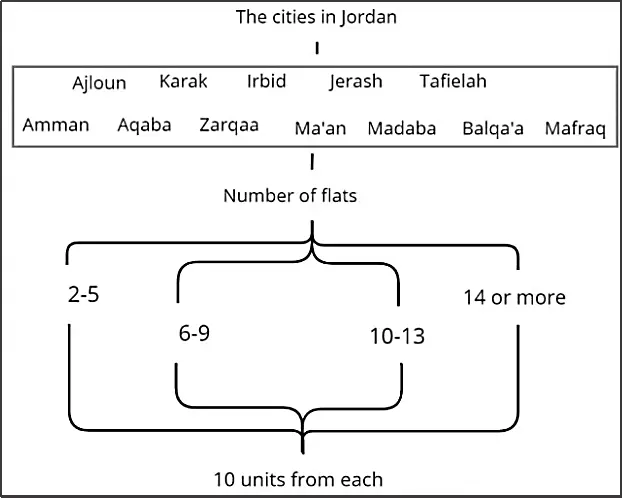
Figure 3. Flowchart of the method of deriving DOS housing survey. DOS: Department of Statistics.
3.1.2 Deriving the Jordan green building council database
The JGBC survey aimed to find out the energy consumption of urban residential apartments built after 2000 in the western part of Amman. It developed a benchmark by electronically distributing the survey through email and mobile applications.
The total number of respondents was 400, with a response rate of 90%. The survey collected relevant data regarding the building general characteristics, building fabric, heating and cooling methods, lighting, energy use from household appliances and usage patterns[19].
The data input for each survey is shown in Figure 4, together with the structure of the flow in DOS and JGBC to derive the outputs that describe the current state of housing in Jordan. The twelve cities of Jordan, typology, urban/rural classification, and the detailed characteristics of buildings are used to form the main structure of the DOS survey. The JGBC survey was undertaken for apartments in urban areas of Amman including common measures with the DOS survey.
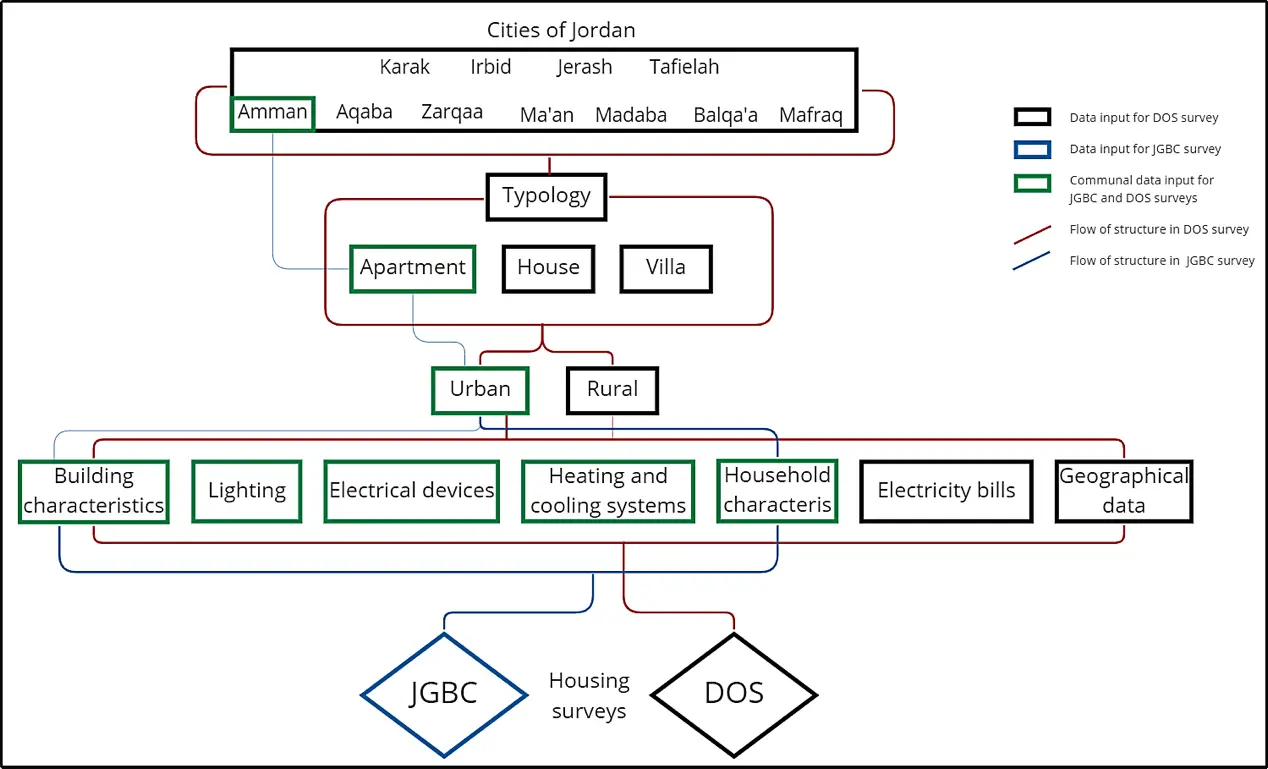
Figure 4. Flowchart of the structure of deriving DOS and JGBC housing surveys. DOS: Department of Statistics; JGBC: Jordan Green Building Council.
Table 1 illustrates the breakdown of the structure of the DOS housing survey and JGBC survey. While certain details in the DOS and JGBC surveys are generic and not applicable for evaluating the energy efficiency of buildings, several crucial factors could impact the energy consumption of housing units in Jordan. Generic data are used to classify the residential units into ‘archetypes’. Housing Archetype refers to a representative model of housing that shares similar characteristics, such as architectural design, construction materials, building age, and built form. The definition of housing archetype varies depending on the context and purpose of a study[20].
| Variable | DOS | JGBC | ||
| Data | Data | |||
| Identification data | The governorate, The district Block, plot and building number | ---- | ||
| Household characteristics | Number of family members Type of occupancy Monthly income | Age, Gender Number of occupants Occupancy hours | ||
| Building characteristics/Dwelling properties | Type of dwelling (House, Villa, Apartment). Area (Plot area, gross area, net area) The Age of Construction Insulation availability Building materials – naming the outer layer | General characteristics | Number of floors, Floor area Building ageNumber of bedrooms | |
| Construction characteristics | Materials and Thermal insulation (type, thickness, window properties, U-Values) | |||
| HVAC systems | Heating | System typeOperating months/hours Energy source | Heating | Type of system Duration of space heating |
| Cooling | Type of system Operating months/hours Type of energy used | Cooling | Type of system Duration of space cooling | |
| Water heating | Type of system Duration in summer and winter | Water heating | Type of system Duration in summer and winter | |
| Kitchen Appliances | ---- | The number of gas cylinders Number of refrigerators | ||
| Lighting | Type of lights used. Duration hours | Type of lights used. Duration hours | ||
| Other appliances | Kitchen appliances and others | TV, computer, laptop, vacuum, iron … | ||
DOS: Department of Statistics; JGBC: Jordan Green Building Council.
Archetypes are particularly helpful in stock aggregation, because they have the potential to support analyses of the existing stock[21]. Scenarios of possible future development for a housing stock through the use of archetypes models can be used by governments and other stakeholders as a basis for strategic planning[22]. For example, the distributions of key variables (such as built form, floor area, storey height, building age and fabric characteristics) of the English Housing Survey were statistically analyzed to identify representative parameters that were used to define the archetypes model of the English housing stock which relies on multiple sources of quantitative and qualitative evidence[23].
3.2 Synthesized dataset
The Jordanian Green Building Council have issued a report, summarizing the findings of a survey of the state of apartment buildings[19]. Following the review of the JGBC results and the analysis of the DOS output data[18], the consolidated dataset was produced for this study.
Referring to Section 3.1 of data input and as illustrated in Table 1, the available data from the two sources are categorized into generic input data and energy consumption data. To present the characteristics of housing stock in Jordan and its energy performance, the input data from these two sources are gathered to provide two main integrated datasets:
• A unified dataset of generic characteristics.
• A unified dataset of energy performance.
A unified dataset comprising generic characteristics represents the general housing stock attributes, such as the building typology (apartment, house, and villa), their distribution across cities in Jordan, the age of the buildings, the area of housing units, the number of floors, the number of units and the number of occupants. On the other hand, the energy performance dataset had a difference in sample size between the DOS and JGBC surveys. The JGBC provided additional information about apartment typology built after the 2000s in Amman.
The integrated housing stock dataset that was produced in this study includes both the general and energy characteristics of the three housing typologies, based on data from the DOS survey and the JGBC apartments surveys in Jordan.
The classification of the housing stock into archetypes was done in two major phases: Firstly, the generic characteristics database was analyzed to describe the overall housing stock of Jordan. This involved identifying key variables and examining the distinctions between the general characteristics of housing typologies (apartments, houses, and villas). The second phase entailed assessing variations in the energy performance and systems (e.g., heating and cooling systems, lighting systems, etc.,), of the different typologies.
Descriptive statistics involves taking a potentially sizeable number of data points in the sample data and reducing them to certain meaningful summary values and graphs[24]. In the case of the current analysis, statistical analysis is conducted on residential building typologies, apartments, houses, and villas, with a focus on energy performance.
4. Results
After the method of combining available data toward defining an integrated dataset for housing stock is developed, a statistical analysis of integrated data is employed to identify the general characteristics and energy performance datasets.
4.1 General characteristics dataset
In 2015 there were approximately 795,000 residential buildings in Jordan, Figure 5, reflects the classification of building typologies “Apartments, House and Villa” based on a DOS housing survey using two metrics: the number of buildings and the number of units. The number of units indicates the number of dwellings within each residential building. It is evident that housing is concentrated in urban areas, where the demand is higher than in rural areas, due to population growth and urbanization[25].
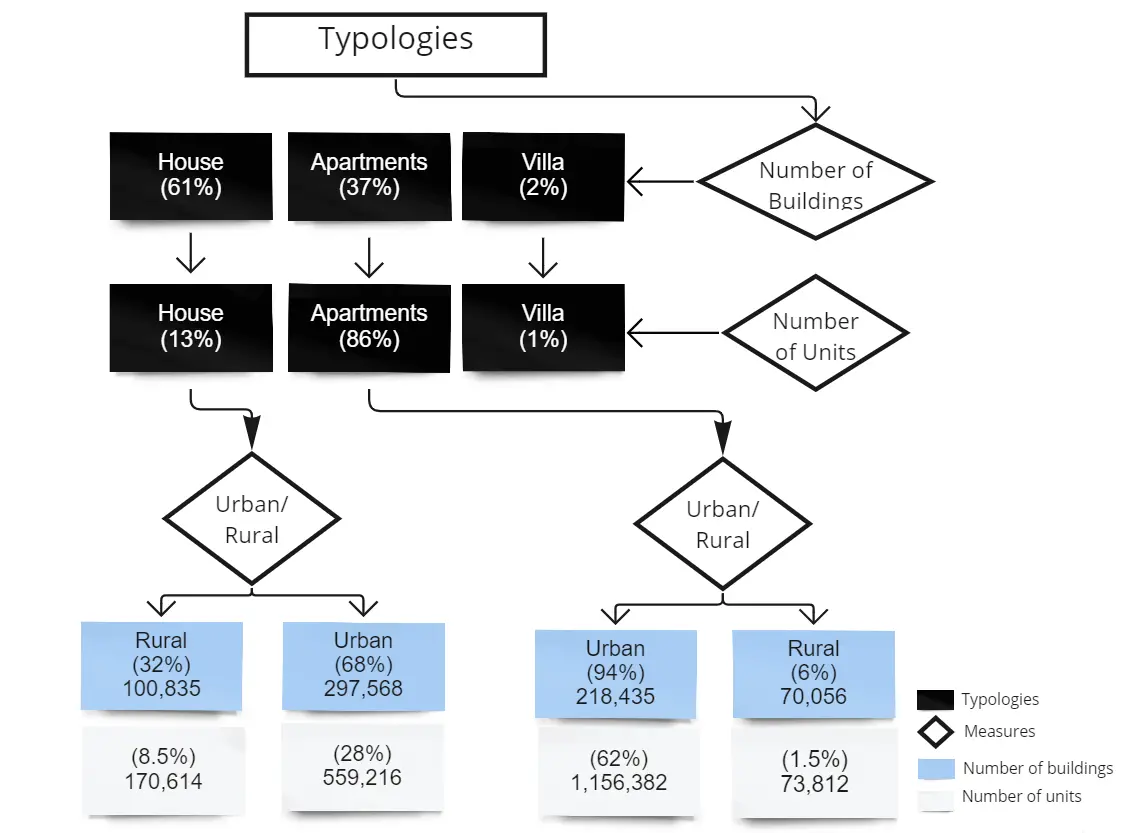
Figure 5. The classification of “apartment, house, and villa” relating to the number of buildings and housing units.
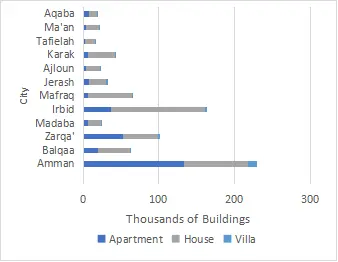
Figure 6 presents the locations of three typologies across the 12 cities of Jordan. Apartments in Amman typically comprise a range of 2 to 10 units in a single building.
Table 2 clarifies the number of building typologies in urban and rural zones, with the total number of buildings and number of units for each building typology in Jordan. It is noticed that the three typologies are more common in urban areas. Most of the rural buildings are houses “100,835 buildings”, while apartments are “70,056 buildings” and villas are “1,484 buildings” which constitute 1% of the total rural buildings.
| Apartment | House | Villa | Total | |
| Urban buildings | 218,435 | 297,568 | 13,733 | 529,736 |
| Rural buildings | 70,056 | 100,835 | 1,484 | 172,375 |
| Total number of units | 1,267,286 | 729,830 | 19,600 | 2,016,716 |
| Total number of buildings | 288,491 | 398,403 | 15,217 | 702,111 |
Results reveal a substantial gap between the number of apartment units “1,267,286” and apartment buildings “288,491”. This is since there are several ‘flats’ in each apartment building, which can range between 2 to 10.
Different measures are statically analyzed providing detailed insights into the entire housing stock and the characteristics of the buildings. The distribution of buildings within age-band from the units built before the 1950s to those built after the 2000s, the number of units within the building; including details such as materials, the number and area of units, and the heating system are analyzed.
-Number of Units
Figure 7 shows a comparison between building typologies in terms of the number of units in each building. 100% of villas and around 60% of houses in Jordan have one unit, while in apartments it represents 10%. The percentages for apartment buildings are distinguished based on the number of units; 20% of buildings are with each of the 2, 3, and 4 units, and 10% for every 5 and 6 units. The rest of the 20% of apartment buildings are distributed between 7, 8, 9, and 10 or more units in each building.
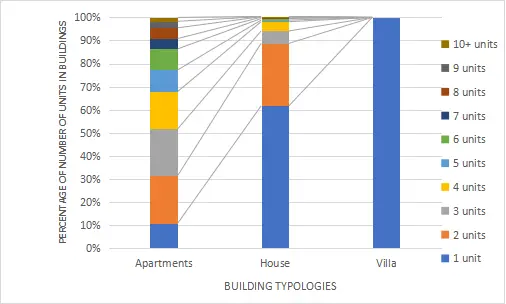
Figure 7. The percentage of the number of units across house, villa, and apartment building typologies in Jordan.
The horizontal axis of the stacked bar chart in Figure 8 represents the area of housing units to the number of units in the vertical axis for house, apartment and villa typologies in urban and rural areas in Jordan. The chart shows that in Jordan both for apartment units and houses, floor area of 100-149 m2 is the most common ‘around 40%’, while 200-300 m2 is the most prevalent area of villa typology ‘37%’.
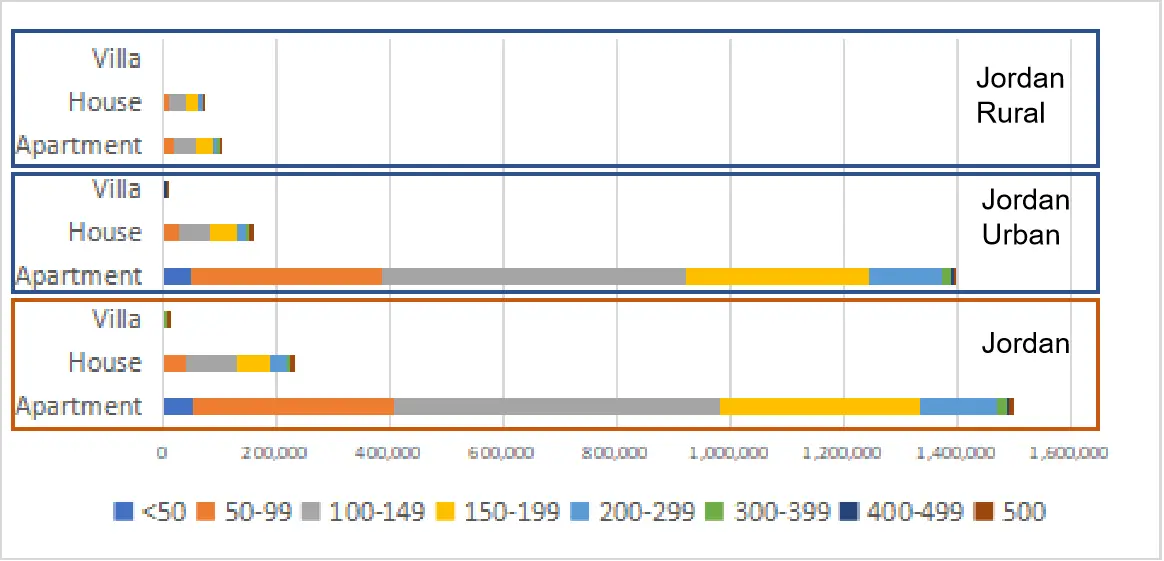
Figure 8. The number of units across urban and rural zones within the house, villa, and apartment building typologies by floor area.
The distribution of units across different areas within an urban zone in Jordan adheres to the same previous sequence of buildings distribution in the total zones of Jordan. Fewer apartment units are in rural zones with 7% of the number of units in urban areas. ‘Villa’ typology has a big floor area in comparison to other typologies—between 200 m2 to 500 m2.
-Number of floors
Figure 9 displays the number of buildings to their number of floors and age bands. The horizontal axis indicates the age of the buildings, ranging from newly constructed in ‘2015’ to ‘1950’. The chart shows the number of buildings in each corresponding floor number, from 1 floor building up to 6 floors. The chart reveals that there is a higher concentration of apartments starting from the 1960s upward with more floors, whereas older buildings tend to have fewer floors. Additionally, there is a clear trend of decreasing the number of floors in apartments after the 2000s.
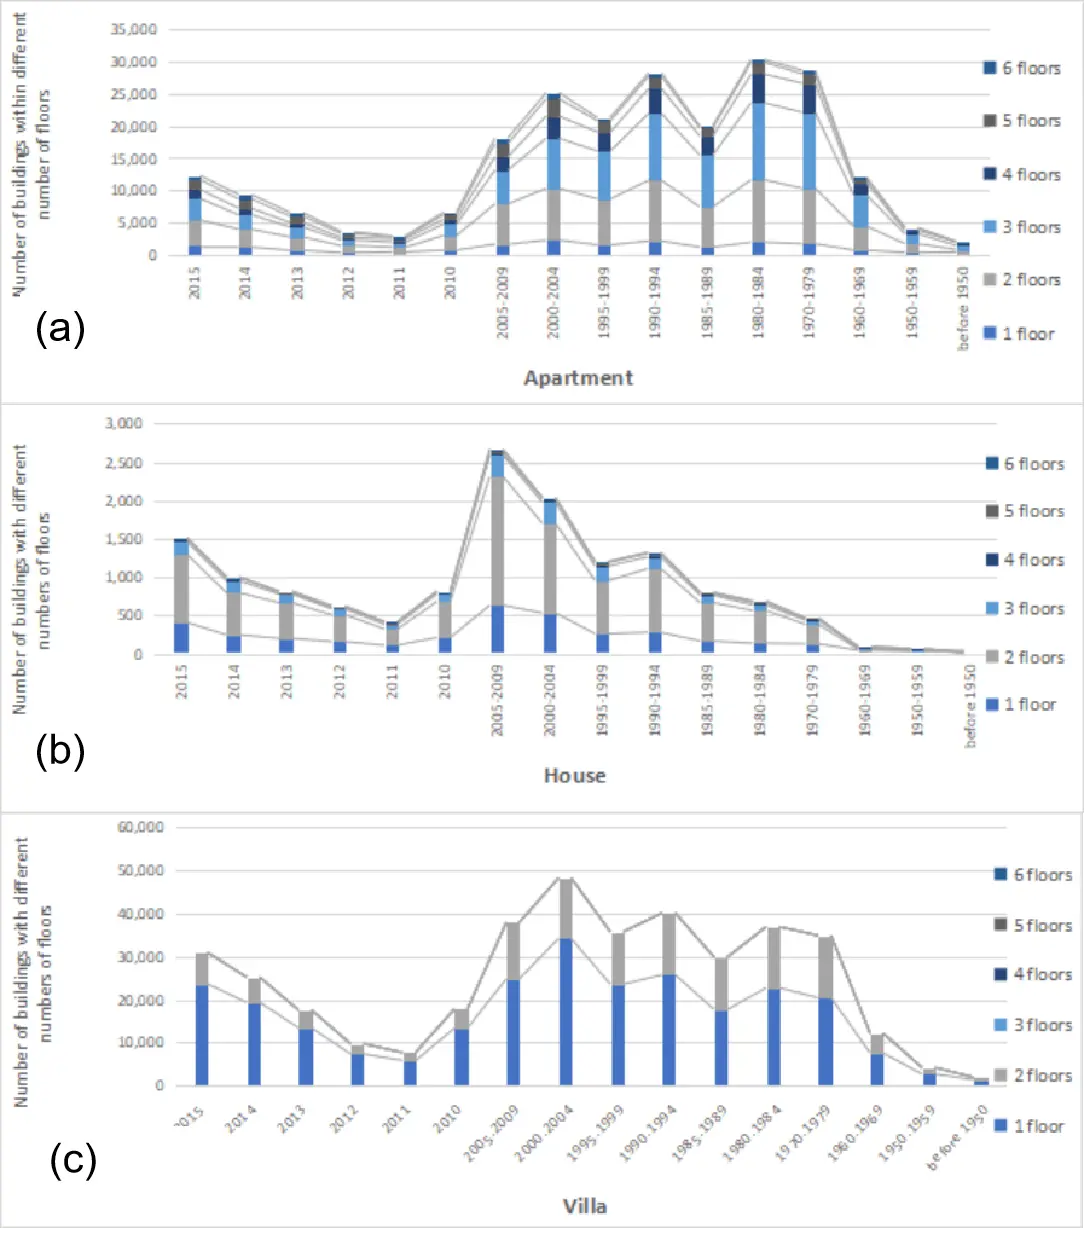
Figure 9. The classification of building typologies related to the number of floors within the age-band from before the 1950s to 2015. (a) The distribution of Apartments; (b) Houses; (c) Villas.
There is a gradual increase in the number of house buildings from 1950 until 2009, with a significant decrease from 2010 and upward. The most prevalent number of floors in house buildings is two floors along the age band of 1950 to 2015. Whereas villas mostly tend to have one floor, two-floor buildings represent the second most prevalent number of floors of the villa’s typology. Overall, the chart provides an insight into the evolution of building construction over time, showcasing how changes in population growth and construction techniques have impacted the number of floors in buildings.
-Number of Rooms and Residents
Table 3 shows that the distribution of the number of buildings based on the number of residents for each typology varies significantly.
| Number of residents | ||||||||||||
| Apartment | ||||||||||||
| Number of rooms | 1 | 2 | 3 | 4 | 5 | 6 | 7 | 8 | 9 | 10 | 11+ | |
| 1 | 12,911 | 6,053 | 4,292 | 4,313 | 3,325 | 4,045 | 3,398 | 2,503 | 503 | 496 | 2,397 | |
| 2 | 18,631 | 28,380 | 25,618 | 31,234 | 25,875 | 22,514 | 11,204 | 7,518 | 3,243 | 2,638 | 13,805 | |
| 3 | 24,596 | 56,113 | 57,797 | 72,778 | 69,003 | 60,721 | 32,639 | 20,214 | 8,518 | 6,433 | 25,067 | |
| 4 | 18,693 | 44,777 | 48,308 | 64,438 | 63,489 | 59,652 | 35,777 | 21,715 | 9,356 | 6,408 | 19,474 | |
| 5 | 15,316 | 32,028 | 35,519 | 46,670 | 49,005 | 46,635 | 28,292 | 17,170 | 6,879 | 5,196 | 13,498 | |
| 6 | 4,886 | 9,254 | 10,254 | 13,016 | 13,744 | 13,568 | 8,905 | 5,515 | 1,447 | 1,809 | 4,109 | |
| 7+ | 2,793 | 4,655 | 4,951 | 6,316 | 6,624 | 6,500 | 4,524 | 3,057 | 1,363 | 1,131 | 2,789 | |
| House | ||||||||||||
| 1 | 1 | 2 | 3 | 4 | 5 | 6 | 7 | 8 | 9 | 10 | 11+ | |
| 2 | 888 | 456 | 354 | 392 | 304 | 257 | 164 | 120 | 57 | 25 | 73 | |
| 3 | 2,455 | 2,791 | 2,312 | 2,725 | 2,816 | 2,561 | 1,661 | 1,018 | 499 | 241 | 334 | |
| 4 | 3,048 | 6,213 | 6,057 | 7,708 | 8,664 | 8,550 | 6,336 | 3,891 | 1,902 | 911 | 930 | |
| 5 | 2,261 | 6,306 | 7,050 | 9,824 | 12,087 | 12,800 | 9,927 | 6,203 | 3,148 | 1,560 | 1,628 | |
| 6 | 1,366 | 3,217 | 3,852 | 5,874 | 8,077 | 9,670 | 7,495 | 4,626 | 2,312 | 1,159 | 1,192 | |
| 7+ | 485 | 1,077 | 1,284 | 1,940 | 2,992 | 3,750 | 2,997 | 1,956 | 1,007 | 531 | 701 | |
| 584 | 668 | 679 | 967 | 1,323 | 1,657 | 1,525 | 1,052 | 538 | 366 | 790 | ||
| Villa | ||||||||||||
| 1 | 2 | 3 | 4 | 5 | 6 | 7 | 8 | 9 | 10 | 11+ | ||
| 1 | 0 | 0 | 0 | 0 | 0 | 0 | 0 | 0 | 0 | 0 | 0 | |
| 2 | 0 | 0 | 0 | 0 | 0 | 0 | 0 | 0 | 0 | 0 | 0 | |
| 3 | 14 | 25 | 29 | 19 | 31 | 27 | 14 | 6 | 1 | 0 | 1 | |
| 4 | 29 | 63 | 70 | 84 | 107 | 125 | 59 | 44 | 20 | 9 | 7 | |
| 5 | 80 | 192 | 211 | 258 | 374 | 426 | 296 | 152 | 72 | 26 | 31 | |
| 6 | 71 | 195 | 268 | 359 | 395 | 450 | 325 | 181 | 74 | 53 | 38 | |
| 7+ | 203 | 341 | 461 | 677 | 816 | 878 | 675 | 424 | 193 | 108 | 148 | |
| Number of buildings Min Max | ||||||||||||
-Envelope materials
According to the DOS[18] data on envelope materials, the outside layer determines the name of an envelope material. For example, cut-stone, concrete, and cement envelopes are all the exterior construction material. The detailed characteristics of the envelope construction materials used in the building are specified, together with their layering from outer to inner, thickness, and U-values.
Figure 10 indicates that the use of building materials has changed over time. Starting from the 1950s to the 1980s, it is noticed that there was an increase in the use of cement bricks and concrete envelope materials in both the apartments and house typologies. The use of cut stone construction envelopes has had a prominent increase in apartments from the 1980s to 2015. House typology had a consistent use of cement bricks and concrete up to 2015. Cut stone envelope is the most prevalent construction material for villa typology. Mud bricks are used before the year of 1950s in rural houses.
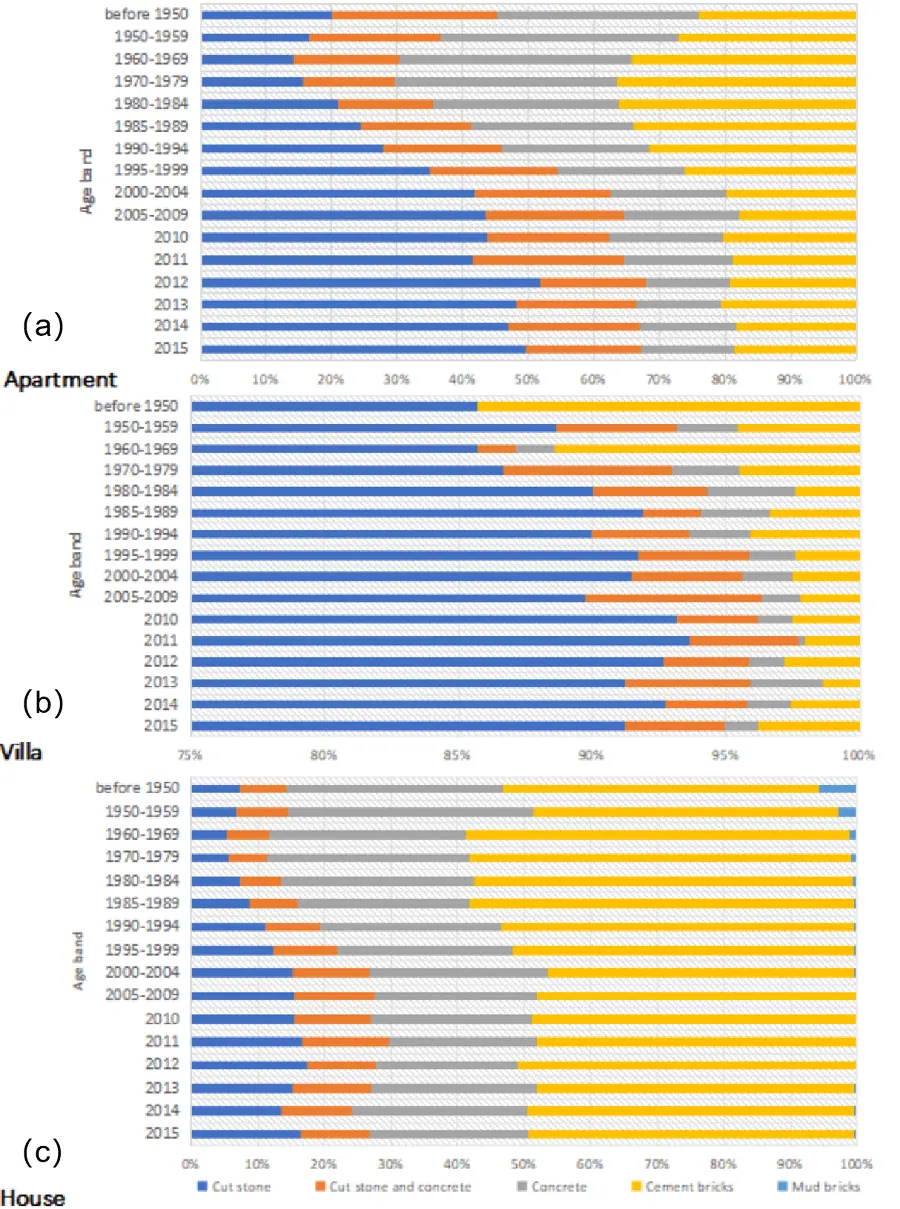
Figure 10. The distribution of building typologies; within age-band from before 1950s to 2015 with different building materials. (a) Apartments; (b) Villas; (c) Houses.
According to the JGBC survey[19], 25% of apartments in Amman have thermal insulation with cut-stone envelope, while 35.29% are not considering thermal insulation within their wall construction. 28% of roofs are constructed with thermal insulation. The JGBC survey didn’t consider the details of envelope materials and type of insulation material.
-Window Characteristics
The distribution of building typologies and their corresponding glazing and window frames can vary greatly depending on the age of the building as shown in Figure 11. Older houses tend to have single glazing with steel frames, while newer houses tend to have single or double glazing with aluminum frames. Villas, on the other hand, have an aluminum frame with single or double glazing depending on the age of the property. More apartments typically have double glazing with aluminum frames due to the increased need for energy efficiency and urban noise reduction in buildings. For example, a house built in the 1970s would likely have single glazing, while a villa built in the 2000s would likely have double glazing with aluminum frames.
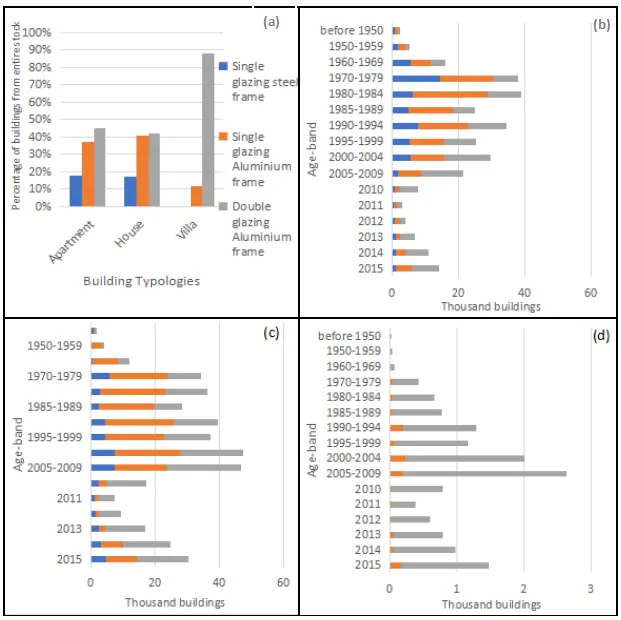
Figure 11. (a) The percentage of buildings from the entire stock regarding window glazing and frame characteristics. The distribution of building typologies; (b) The apartment; (c) The house; (d) Villa buildings within age-band from before 1950s to 2015 regarding their window glazing and frame characteristics.
4.2 Energy performance dataset
-Heating and Cooling systems
The selection of energy systems for buildings has become increasingly important as the Jordanian government strive towards sustainable living and reducing carbon footprint. The selection of a heating system is crucial due to the high number of different types of dwellings, such as houses, apartments, and villas, which may have different heating requirements that might be influenced by factors such as size, location, and building regulations.
The chart in Figure 12 shows the percentage of different heating systems used in each typology. It seems that most houses (40% of the total houses) use gas heating systems, followed by kerosene heaters (28%). In apartments, a gas heating system is the most popular choice (48% of the number of apartments), followed by a kerosene heater (30%) and an electric heater (7%). Finally, in villas, central heating systems are the most commonly used (49% of the total number of villas) as shown in Figure 13, followed by gas heating systems (24%) and kerosene heaters (14%). It is notable that the preferences for heating systems differ based on the type of dwelling, with gas heaters using liquefied petroleum gas (LPG) being more popular in apartments and houses, and central heating systems, using diesel fuel, being the most common for villas.
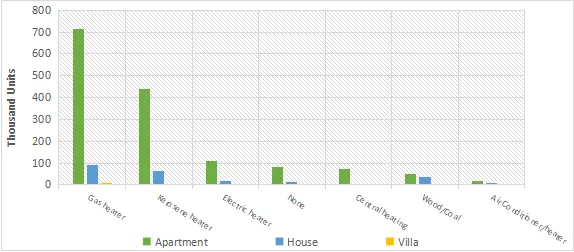
Figure 12. The distribution of building typologies; the house, apartment, and villa buildings with different heating systems.
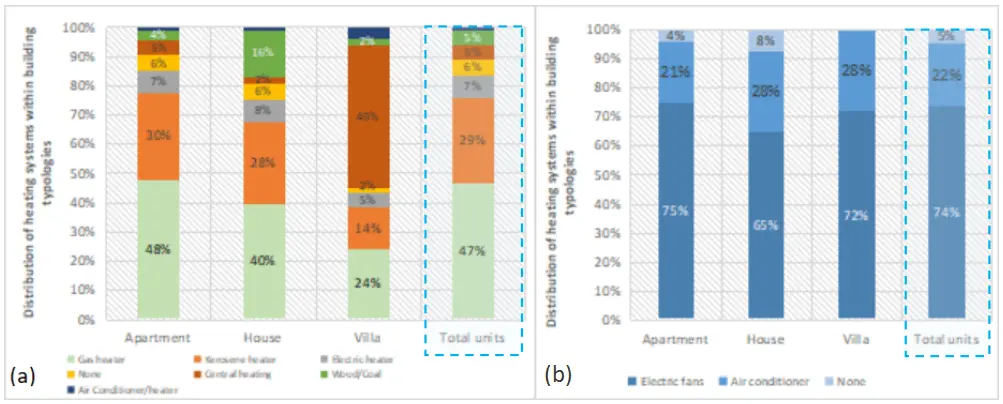
Figure 13. The percentage of building typologies; the house, apartment, and villa with different (a) heating and (b) cooling systems.
This analysis provides insights into the most popular heating systems used in each type of dwelling and the potential for transitioning towards more sustainable options.
Heating hours depend on the occupant’s thermal comfort and the building envelope properties. The main heating system is turned on in 48% of apartments in Amman according to the JGBC survey from 1 to 5 hours a day, and 36% from 5 to 10 hours[19]. The distribution of building units regarding the cooling system they use, shown in Figure 14, varies depending on factors such as geographic location, climate, and building type. In hotter climates, like Badia region, where air conditioning is a necessity, apartments and villas are more likely to have them installed. Houses, on the other hand, may rely on window units or portable air conditioning ones. In areas with milder climates, electric fans may be sufficient for all types of buildings. Additionally, some buildings may not have any cooling system installed, which is more common in older or historic buildings that were not designed with climate control. Overall, Figure 13 presents that the distribution of building units and their cooling systems is dependent on various factors and can vary widely across different regions and building types.
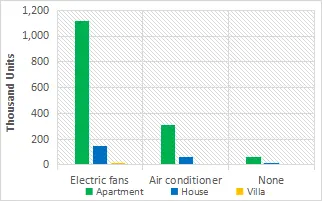
Figure 14. The distribution of building typologies; the house, apartment, and villa buildings with different cooling systems.
The hottest months of the year in Amman are July and August when the temperatures reach as high as 36 ˚C[28]. The JGBC survey found that half of all respondents use cooling during the summer for less than 5 hours a day while 32.8% use cooling for 5-10 hours a day[19].
Figure 14 shows the percentages of the buildings using different heating and cooling systems within each of the three building typologies. The percentage of total number of building units from the entire stock using the systems are illustrated.
Figure 15 presents the percentage of the energy mix for heating and cooling in residential units. Diesel is a fossil fuel used for central heating systems in Jordan, LPG is used for gas heaters, and electric heaters and air conditioner split units use electricity. For cooling, electric fans (23%) and split air conditioning units (73%) are powered using electricity. Carbon emissions of housing stock in Jordan are influenced by the energy source utilized to power each system that is used for operating buildings.
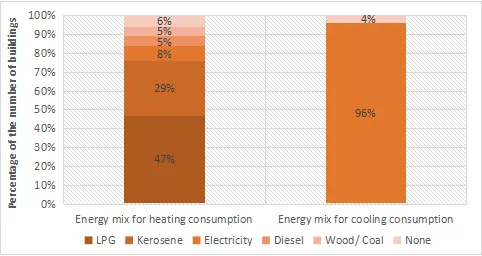
Figure 15. The percentage of energy mix for heating and cooling in residential units in Jordan. LPG: liquefied petroleum gas.
-Lighting
The use of lighting in residential buildings in Jordan has experienced significant changes over the years. Figure 16 presents the use of three different lighting types, namely incandescent, compact fluorescent (CFL) and Light Emitting Diode (LED), in three building typologies, apartments, houses, and villas, from before the 1950s to 2015. The purpose of this research is to analyze the evolution of lighting technology and its impact on residential buildings in Jordan.
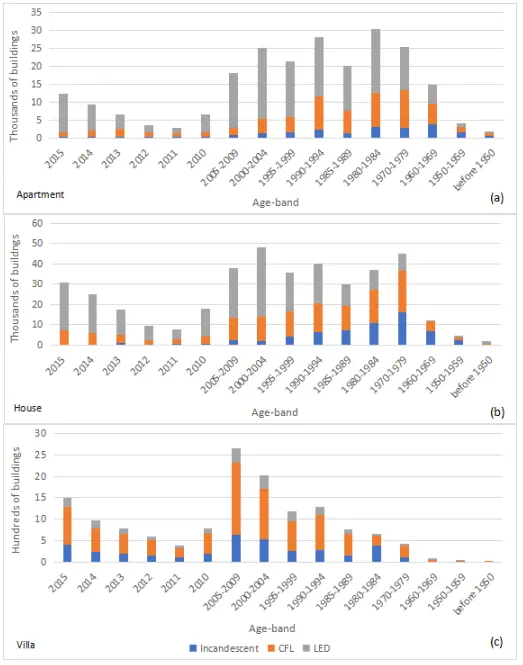
Figure 16. The distribution of building typologies: (a) The apartment; (b) House; (c) Villa buildings with different lighting systems. CFL: compact fluorescent; LED: light emitting diode.
Before the 1950s, apartment buildings in Jordan were primarily lit by kerosene lamps or candles. These lighting sources provided dim light and were not adequate for illuminating the entire room. However, between the 1950s and 2015, apartment buildings started using electricity for lighting. The use of incandescent bulbs was prevalent during this period due to their low cost and availability. Incandescent bulbs were not energy-efficient and had a shorter lifespan. With the advancement in technology, CFL and LED lights were introduced, which were energy-efficient and had a longer lifespan than incandescent bulbs. Therefore, the use of CFL and LED lights increased in apartment buildings towards the end of the 2015.
For houses in Jordan, the use of incandescent bulbs continued until the 2010, despite their disadvantages. With the rising energy costs and the need for energy-efficient lighting, CFL and LED lights were introduced in houses.
Villas in Jordan were primarily lit by chandeliers before the 1950s. However, between the 1950s and 2015, the use of chandeliers decreased, and lampshades on ceiling lights and wall sconces became prevalent. Incandescent bulbs were the primary source of lighting during this period. Over the past few years CFL and LED lights were introduced.
However, there is still significant room for improvement in energy efficiency in villas, a category that shows the least penetration of LED lighting technology.
-Domestic Hot Water
Domestic hot water (DHW) heaters are essential for providing hot water for daily use in residential buildings. Figure 17 presents the usage of different types of DHW systems in apartments in Amman during winter and summer according to the JGBC survey. During winter, 50% of apartments in Amman use electric water heaters to provide hot water. This is likely due to the convenience of the use of electric water heaters, which can be easily installed and do not require any additional infrastructure.

Figure 17. The distribution of water heater systems used in winter and summer among Amman apartments. LPG: liquefied petroleum gas.
However, it’s worth noting that electric water heaters can be quite expensive to operate, especially during the winter months when the demand for hot water is higher. Another popular option for providing hot water during the winter months is boiler heating system, when the heating system is already on in winter, which is used by 31% of apartments in Amman as opposed to 9% in summer. Boiler heating systems are typically less efficient than electric water heaters, but they can also require more complex installation and regular maintenance. Additionally, they require a certain amount of space and infrastructure to operate effectively. Finally, 11% of apartments in Amman use gas heaters during the winter months. LPG heaters are generally not expensive to operate, but they do require a certain amount of infrastructure to operate safely.
During the summer months, the most popular option for providing hot water is solar water heaters, which are used by 50% of apartments in Amman. Solar water heaters are an excellent choice for summer use because they are highly efficient and can be operated using only the power of the sun.
-The JGBC Energy Breakdown
The JGBC benchmark for annual energy consumption acts as a base case representing the current situation of energy consumption for residential apartments in Amman. Energy benchmarking is essential for designers, governmental institutions, and decision-makers to implement public awareness of energy efficiency measures to reduce energy consumption in households. An average household in Amman apartments consumes 94 kWh/m2 per annuam total energy for water heating, cooling, lighting, kitchen appliances, and electrical appliances. Table 4 presents the breakdown of energy used for the average (typical) apartment.
| Type of Energy use | Heating | Cooling | Lighting | DHW | Cooking | Other appliances |
| Quantity kWh/m2 | 48 | 4 | 5 | 10 | 15 | 12 |
DHW: domestic hot water.
According to a survey conducted by the JGBC, the predominant cooking fuel source in Amman’s apartments is an LPG cylinder. 37% of apartments use more than 7 cylinders per year. This data underscores the importance of safe storage and usage of gas cylinders in residential buildings. It also presents an opportunity to promote sustainable and energy-efficient cooking methods such as induction cooktops that rely on electricity instead of gas. There is no other data about cooking fuel sources for other typologies in the cities of Jordan from the DOS survey.
After conducting the statistical analysis of the residential building stock in Jordan, the data were combined based on age band into three categories: 1950s-1970s, 1980s-1990s, and after 2000s as shown in Table 5. This approach was taken to provide a more detailed understanding of characteristics and patterns across different generations of buildings. The general characteristics of the buildings in the integrated dataset were summarized and the predominant characteristics (e.g., envelope materials, glazing type, ...,) within three age bands in different typologies were identified.
| Area | Number of units | Envelope Material | Windows characteristics | Number of rooms | Number of residents | ||
| Apartment | 1950s-1970s | 100-150 m2 | 2-3 | Concrete, Cement bricks | Single glazingSteel frame | 3-4 | 4-6 |
| 1980s-1990s | 3 | Concrete, cut stones | Single glazingAluminum frame | ||||
| After 2000s | 3-5 | Cut stone | Double glazingAluminum frame | ||||
| House | 1950s-1970s | 100-200 m2 | 1 | Concrete, Cement bricks | Single glazingAluminum frame | 4 | 5-6 |
| 1980s-1990s | 2 | Concrete, Cement bricks | Double glazingAluminum frame | ||||
| After 2000s | 2 | Cut stone and concrete | Double glazingAluminum frame | ||||
| Villa | 1950s-1970s | 200-400 m2 | 1 | Cut stone | Double glazingAluminum frame | 7 | 5-7 |
| 1980s-1990s | 1 | Cut stone | Double glazingAluminum frame | ||||
| After 2000s | 1 | Cut stone | Double glazingAluminum frame | ||||
| Reference chart | Figure 6 | Figure 7 | Figure 8 | Figure 9 | Table 3 | ||
5. Discussion
The housing stock in Jordan has grown significantly over the past decade, driven by demographic and economic factors. According to the Department of Statistics, the total number of housing units in the country increased from 1.46 million in 2004 to 2.07 million in 2015, representing an annual growth rate of 3.6%[29]. Regarding the significant growth in the housing stock, Jordan faces several challenges with respect to the increase of energy consumption in the housing sector.
In 2018, Jordan recorded a per capita GHG emissions level of 3.6 tonnes, indicating a relatively moderate figure. However, the energy efficiency of buildings within the country is noticeably suboptimal. The process of urbanization has resulted in a substantial increase in CO2 emissions compared to the 1990s. Enhancing the efficiency of buildings holds considerable importance in addressing this issue and achieving improved environmental outcomes. To address these challenges, many applications of the integrated housing dataset could be developed.
5.1 The opportunities for improving the energy efficiency of housing stock
Minister of mineral and energy resources (MEMR) classified the opportunities for energy efficiency improvements in the building sector into three categories: strategies related to the occupant’s behavior, strategies related to building design and external envelope, and strategies related to the equipment and energy-consuming systems[30].
The integrated dataset generated in this study can be used as a baseline to improve both existing and new-builds ‘future constructions’ in terms of energy consumption and carbon intensity. This is in line with the recommendations from the national policy established by the MEMR to improve the energy efficiency of buildings given the lack of energy sources in Jordan. This dataset is useful to identify trends and patterns that may not have been apparent when analyzing the data as a whole.
5.1.1 Demand-side improvement opportunities
The methods for reducing energy consumption that pertain to the exterior envelope are primarily for new builds. Location, building characteristics, such as layout, height, and the number of floors, as well as orientation, WWR, shading, and insulation, are all examples of factors that might be considered.
Table 6 presents the high U-values of the building fabric used in residential buildings in Jordan, indicating a relatively poor thermal insulation. There is a significant discrepancy between actual U values and the recommended value by the JGBC. At the same time, up to 50% of dwellings use DHW solar systems as illustrated in Figure 17. This suggests while there is motivation to improve efficiency and reduce carbon emissions among the households, the lack of awareness or a tendency to adhere to traditional construction methods, rather than a disinterest in energy efficiency, may contribute to the limited adoption of improved fabric performance.
| Construction | Name | Characteristics | |||||
| Thickness (mm) | K-Value (W/mk) | R-Value (M2k/W) | U-Value (W/m2k) | References | |||
| Concrete | Outside layer | Cement plastering | 20 | 0.72 | 0.028 | 1.27 | [26] |
| Layer 2# | Hollow concrete | 100 | 1 | 0.1 | |||
| Layer 3# | Air gap | 50 | 0.11 | ||||
| Layer 4# | Hollow concrete | 100 | 1 | 0.1 | |||
| Layer 5# | Cement plastering | 20 | 0.72 | 0.028 | |||
| Cement Bricks | Outside layer | Hollow concrete | 100 | 1 | 0.1 | 1.71 | [27] |
| Layer 2# | Air gap | 50 | 0.11 | ||||
| Layer 3# | Hollow concrete | 100 | 1 | 0.1 | |||
| Layer 4# | Cement plastering | 20 | 0.72 | 0.028 | |||
| Cut stone 1 | Outside layer | Cut stone | 60 | 2.27 | 0.026 | 1.99 | [26] |
| Layer 2# | Cast in-site concrete | 80 | 1.17 | 0.068 | |||
| Layer 3# | Air gap | 50 | 0.11 | ||||
| Layer 4# | Hollow concrete | 100 | 0.72 | 0.1 | |||
| Layer 5# | Cement plastering | 20 | 0.72 | 0.028 | |||
| Cut stone 2 | Outside layer | Cut stone | 60 | 2.27 | 0.026 | 2.55 | [26] |
| Layer 2# | Cast in-site concrete | 80 | 1.17 | 0.068 | |||
| Layer 3# | Hollow concrete | 100 | 1 | 0.1 | |||
| Layer 4# | Cement plastering | 20 | 0.72 | 0.028 | |||
As shown in Figure 10, the characteristics of window glazing, and frame can be improved to increase the energy efficiency of buildings. Examples include using double glazing, LoE, Argon filled windows with lower U-value, as well as the use of shading elements.
It is imperative to raise awareness regarding the potential for enhancing the building envelope’s performance. Moreover, implementing mandatory building regulations for new builds moving forward and introducing obligatory provisions for retrofitting projects are necessary steps to be taken. These measures will ensure widespread adoption of energy-efficient practices in both new and existing buildings.
5.1.2 Supply-side improvement opportunities
Heating systems using traditional sources and methods (such as wood, gas-fired local heater, kerosene, and solar) are considered low-cost energy-consuming systems in comparison to other systems (such as central heating and electric heating). Figure 15 reveals that LPG and Kerosene account for the largest share of the energy mix utilized in Jordan. One of the key measures in optimizing energy consumption in traditional systems is to implement energy efficiency practices such as regular maintenance of the heating system that can reduce Diesel energy consumption by approximately 5% and using suitable control devices to regulate the operation of the heating system.
When it comes to upgrading heating systems, there is a potential to move towards alternative fuel sources. For instance, the adoption of electric heaters could be considered. Electric heaters provide higher efficiency and do not involve combustion process and therefore such a move could help improve the ambient air quality. Electric heat pumps could also be considered given the high coefficient of performances available with these systems and the relatively low carbon intensity of electricity which is currently estimated to be circa 0.4 Kg CO2/m2 per kWh in Jordan. The limitation of implementing such improvements is relatively higher cost compared to conventional heating systems.
Figure 16 depicts a notable prevalence of LED lighting systems in both house and apartment typologies, indicating a successful integration of this energy-efficient technology. However, in the case of villas, there seems to be a reluctance among residents to embrace LED lights, for reasons that require further investigation.
5.1.3 Renewables
In terms of renewable energy in Jordan, the Renewable Energy and Energy Conservation Law No. 13 of 2012[31] allows dwellings with renewable energy systems for electricity generation to sell electricity to licensed wholesale or retail suppliers. As a result, solar panels for dwellings can be installed to meet the building’s electricity needs by connecting these panels to the national grid.
Renewable technologies may be adopted at the building level or upstream to decarbonise the national electricity grid and reduce the carbon intensity of electricity generation.
Solar systems in Amman have demonstrated a notable level of adoption, indicating a positive penetration rate. However, it is crucial to promote and encourage the installation of solar systems not only in Amman but also in other regions across the country.
Based on these policy recommendations and the state of energy in Jordan, three levels of interventions for improving existing stock are illustrated in Table 7. The values set by local codes, such as Energy Efficient Building Code (EEBC), and JGBC for building components such as external walls, roof, and glazing are considered.
| Improvement Levels | Element | Proposed efficiency measures | Recommended Values | Interventions/Proposals |
| Building fabric components | External walls U-Value | insulation | 0.57 | Air Gap EPS 3 cm insulation or equivalent XPS Extruded polystyrene 3 cm or equivalent XPS Extruded polystyrene 5 cm or equivalent (addition) |
| Slabs U-Value | 1.20 | Add insulation | ||
| Window glazing | Glazing type efficient | Does not exceed 3.00 | Double glazing, LoE, Argon filled. | |
| Window frame | Frame material | - | UPVC | |
| Shading | Shading installation | - | Horizontal louvres: North and SouthVertical fin: East and west | |
| The technology used for Energy systems | Heating | Increasing COP | - | Heat pump (e.g. CoP of 3[32]) |
| Cooling | Increasing COP | - | AC split unit with higher energy efficiency, CoP of 4 is achievable[33] | |
| Lighting | A more efficient lighting system | LED lights | LED light bulbs (incentives & awareness campaigns recommended to maximise adoption) | |
| DHW | Water heating system | - | Electricity instead of LPGHeat pump | |
| Renewable | water heating system | Solar water heating system | - | FPCETC |
| PV system | Generating energy | - | 30˚ degrees facing south (preferably) |
COP: Department of Statistics; LED: light emitting diode; AC: air conditioning; PV: photovoltaic; DHW: domestic hot water; EPS: expanded polystyrene; XPS: X-ray photoelectron spectroscopy; UPVC: unplastisized polyvinyl chloride; FPC: flat plate collectors; ETC: evacuated tube collectors.
Jordan faces several barriers to improve the energy efficiency of buildings. These include limited energy sources, which complicate economic stability, and a deficiency in awareness and knowledge about energy-efficient building design and construction practices among building owners, developers, and contractors, insufficient implementation of building codes and standards[34,35], high initial costs of energy-efficient building design and construction practices, and limited enforcement of existing energy efficiency regulations and policies[36]. Addressing these barriers will require a comprehensive approach that involves policymakers, building owners, developers, contractors, and other stakeholders to promote energy-efficient building design and construction practices and improve the energy efficiency of buildings in Jordan.
5.2 Applications of the integrated housing dataset
The purpose of this analysis is to determine the overall characteristics, which can also be sourced using similar surveys in other national or regional contexts, to provide abasis for generating a housing stock model and informing policy and decision-making in the housing sector.
5.2.1 Policy
Statistical analysis and developing the integrated dataset can have several implications for policy decisions. Integrated data can reveal information about the availability and conditions of dwellings, such as the city and Urban/Rural zones, considering elements including occupancy rate, building age, infrastructure, and amenities. This information can inform policymakers of the need for new housing developments, renovations, or upgrade existing ones. Furthermore, this information can assist policymakers in formulating and enforcing building codes and regulations to improve the quality of housing such as EEBC, one of Jordan’s national building codes, that can be improved to include mandatory specifications for building envelope and HVAC systems used in buildings.
The data helps make informed decisions about urban planning, land use, and zoning by showing housing distribution and density in different areas, ensuring balanced development and resource use.
5.2.2 Housing energy stock model
Housing stock models are essential tools for evaluating the energy performance of residential buildings in a country. The housing stock models are used to improve the energy performance through evaluating the effect of several intervention measures to reduce the energy demand and carbon emissions.
The results of the housing stock survey reveal important information about the state of the housing stock in Jordan. Figure 8 illustrates the distribution of building typologies in Jordan regarding three metrics: number of buildings, number of units, and area of housing units, within urban and rural zones. It is noticed that the majority of housing units are concentrated in urban areas due to population growth and urbanization. Apartment and house typologies in urban areas constitute the highest number of buildings, number of units, and area of housing units with 81%, 89%, and 86.5% respectively. The third typology with high contribution is the house rural typology. Further and more detailed categorization of models could be improved in further future research to include the distribution of these typologies within the cities of Jordan that are classified into three climatic regions: Mountain region, Badia region and Jordan Valley. This categorization of data is crucial for generating housing stock models.
This study proposes an approach to enhance the classification of urban and rural zones encompassing different housing typologies such as Houses, Apartments, and Villas. The objective is to achieve a more refined classification by utilizing three distinct age bands, as presented in Table 5. This refinement leads to the creation of a comprehensive set of 18 archetypal representations, each possessing unique attributes related to both general and energy performance characteristics.
These dominant typologies are then subsumed into 9 representative archetypes. For instance, within Urban zones, Apartment buildings undergo a detailed categorization into three segments, aligned with the age-bands of the 1950s-1970s, 1980s-1990s, and after the 2000s. This approach of classifying according to age bands extends to other building typologies across diverse zones, ensuring a consistent methodology.
6. Research Limitations
• Survey data used for the JGBC analysis is based on a limited sample size and focuses on building apartments in Amman.
• A detailed accurate geometric model of urban area is not currently feasible in Jordan, for example, using of Light Detection and Ranging (LiDAR) technology that is a remote sensing method that uses light in the form of a pulsed laser to measure ranges (variable distances) to the earth[37]. The archetype-based models don’t provide a data about the impact from adjacent buildings.
7. Conclusion
The DOS housing survey reveals areas that require attention, such as the lack of access to the total energy consumption of housing units that may be addressed in future housing surveys. Overall, the survey provides a valuable source of information that can guide policy formulation and the allocation of resources to address the challenges facing the housing sector in Jordan such as the use of aggregated dataset to generate housing stock models. This research used statistical methods to analyze large data from the DOS and JGBC surveys to provide useful insights into general characteristics, summarized in Table 1, and energy performance determinants in the residential sector in Jordan. An integrated dataset was generated from both general and energy performance data and analyzed to produce a unified dataset of housing characteristics and energy systems. A descriptive statistic method was subsequently used to analyze residential building typologies, including apartments, houses, and villas, with a focus on energy demand.
The research findings presented in this paper can pave the way to develop a housing stock model in Jordan to assess the pathways for achieving significant carbon emissions reductions to contribute towards meeting the goals of the Paris agreement by 2050.
In summary, the research presented herein contributes to a systematic and comprehensive classification of urban and rural zones, particularly focused on various housing typologies. This methodological framework, utilizing age bands for enhanced classification, aligns with the architectural and urban design practice of employing typologies to group and analyze similar structures.
Authors contribution
All authors contributed equally to this work.
Conflicts of interest
Esfandiar Burman is an Editorial Board member of Journal of Building Design and Environment, and other authors declare no conflict of interest.
Ethical approval
Not applicable.
Consent to participate
Not applicable.
Consent to publication
Not applicable.
Availability of data and materials
The data and materials could be obtained from the corresponding author.
Funding
None.
Copyright
© The Author(s) 2023.
References
-
1. Santamouris M, Vasilakopoulou K. Present and future energy consumption of buildings: Challenges and opportunities towards decarbonisation. e-Prime. 2021;1:100002.[DOI]
-
2. Alrawashdeh SS. Energy sources assessment in Jordan. Results Eng. 2022;13:100329.[DOI]
-
3. Ministry of Environment [Internet]. Updated submission of Jordan’s 1st nationally determined contribution (NDC). Jordan: Ministry of Environment; [cited 2023 Sep 14]. Available from: https://unfccc.int/sites/default/files/NDC/2022-06/UPDATED%20SUBMISSION%20OF%20JORDANS.pdf
-
4. IRENA [Internet]. Renewable Readiness Assessment: The Hashemite Kingdom of Jordan. Abu Dhabi: International Renewable Energy Agency; [cited 2023 Sep 14]. Available from: https://www.irena.org/publications/2021/Feb/Renewables-Readiness-Assessment-The-Hashemite-Kingdom-of-Jordan
-
5. Moura MC, Smith SJ, Belzer DB. 120 Years of U.S. Residential housing stock and floor space. PLoS One.[DOI]
-
6. Ababsa M. Mediterranean sea [map]. 2010. Available from: https://books.openedition.org/ifpo/docannexe/image/4871/img-2.jpg
-
7. JNCCC [Internet]. Jordan’s third national communication on climate change. Jordan: NCCC Available from: https://unfccc.int/resource/docs/natc/jornc3.pdf
-
8. Sabbah EE [Internet]. Net Zero Buildings in Jordan. Amman: Jordan Green Building Council; 2020 Available from: https://library.fes.de/pdf-files/bueros/amman/16876.pdf
-
9. Bataineh K, Alrabee A. Improving the energy efficiency of the residential buildings in Jordan. Buildings. 2018;8(7):85.[DOI]
-
10. Jaber JO. Prospects of energy savings in residential space heating. Energy Build. 2002;34(4):311-319.[DOI]
-
11. Ali HH, Abu Al-Rub FA, Shboul B, AI Moumani H. Evaluation of near-net-zero-energy building strategies: a case study on residential buildings in jordan. Int J Energy Econ Policy. 2020;10(6):325-336.[DOI]
-
12. Abu Qadourah J, Al-Falahat AM, Alrwashdeh SS, Nytsch-Geusen C. Improving the energy performance of the typical multi-family buildings in Amman, Jordan. City Territ Archit. 2022;9(1):6.[DOI]
-
13. Al-Ghandoor A, Al-Hinti I, Akash B, Abu-Nada E. Analysis of energy and exergyuse in the Jordanian urban residential sector. Int J Exergy. 2008;5(4):413-428.[DOI]
-
14. Rosenlund H, EmtairahT, Visser F. Building green in Jordan? Performance evaluation of the Aqaba residential energy efficiency pilot project (AREE). In: The 2nd International Conference on Sustainable Architecture and Urban Development; 2010 July 12-14; Jordan: Lund University. 2010. Available from: https://www.lu.se/lup/publication/21c3f06b-f6c9-459e-8144-59e5f146ab54
-
15. Jaber SJ, AlZyood M, Harahsheh M, Hammad MA. Thermal economical analysis of renewable energy buildings, towards low energy house in Jordan. In: Int. Conf. on Advances in Renewable Energy; 2010 Oct 25-31; ; Tunisia: Tunisia. 2010. Available from: https://www.researchgate.net/publication/266265761_Thermal_and_Economic_Analysis_of_Renewable_Buildings_Towards_Low_Energy_Homes_in_Jordan
-
16. Reinhart CF, Davila CC. Urban building energy modelling-a review of a nascent field. Build Environ. 2016;97:196-202.[DOI]
-
17. Ali U, Shamsi MH, Hoare C, Mangina E, O’Donnell J. Review of urban building energy modeling (UBEM) approaches, methods and tools using qualitative and quantitative analysis. Energy Build. 2021;246(6).[DOI]
-
18. Department of statistics [Internet]. General results of census 2015. Jordan: Department of statistics; [cited 2023 Sep 14]. Available from: http://dosweb.dos.gov.jo/censuses/population_housing/census2015/census2015_tables/
-
19. Nazer H. Developing an energy benchmark for residential apartments in Amman [Internet]. Jordan: Jordan greeen building council; 2019. Available from: https://library.fes.de/pdf-files/bueros/amman/15926.pdf
-
20. Lavagna M, Baldassarri C, Campioli A, Giorgi S, Dalla Valle A, Castellani V, et al. Benchmarks for environmental impact of housing in Europe: Definition of archetypes and LCA of the residential building stock. Build Environ. 2018;145:260-275.[DOI]
-
21. De Carli M, Carnieletto L, Bella AD, Graci S, Emmi G, Zarrella A, et al. Archetype definition for analysing retrofit solutions in urban areas in Europe. E3S Web of Conferences; CLIMA; 2019;111:03027.[DOI]
-
22. Natarajan S, Levermore GJ. Predicting future UK housing stock and carbon emissions. Energy Policy. 2007;35(11):5719-5727.[DOI]
-
23. UCL Energy institute models [Internet]. English Archetypes. London: UCL Energy institute models; [cited 2023 May]. Available from: https://www.ucl.ac.uk/energy-models/models/english-archetypes
-
24. Kumar A. Comprehensive guide to descriptive vs inferential statistics [Internet]. Simplilearn. 2024 Nov 12. Available from: https://www.simplilearn.com/difference-between-descriptive-inferential-statistics-article
-
25. World bank group. Demographic trends and urbanization [Internet]. 2021 May 19. Available from: https://www.worldbank.org/en/topic/urbandevelopment/publication/demographic-trends-and-urbanization
-
26. Shamout S, Melis A. Energy retrofit of the existing building envelope in Jordan: A study on mixed-use buildings (Retail and office) in Amman [dissertation]. New Zealand: University of Auckland; 2016.Available form: https://www.researchgate.net/publication/344043646_Energy_retrofit_of_the_existing_building_envelope_in_Jordan_A_study_on_mixed-use_buildings_Retail_and_office_in_Amman
-
27. Shamout S, Al-khuraissat M [Internet]. Your guide to building envelope retrofits for optimising energy efficiency & thermal comfort in Jordan. Amman: Jordan Green Building Council; Available from: https://meddialogue.eu/e-library/your-guide-to-building-envelop-retrofits-for-optimising-energy-efficiency-and-thermal-comfort-in-jordan/#:~:text=The%20four%20main%20building%20envelope,with%20enhanced%20thermal%20performance%20for
-
28. Weather Spark. Climate and average weather year round in Amman [Interent].. Minneapolis area: Weather Spark; [cited 2023 Sep 14]. Available from: https://weatherspark.com/y/98906/Average-Weather-in-Amman-Jordan-Year-Round
-
29. The Official Site of the Jordanian e-Government [Internet]., Jordan: The Official Site of the Jordanian e-Government; [cited 2023 Sep 14]. Available from: https://form.jordan.gov.jo/wps/portal/Home/OpenDataMain/OpenDataUser/#/manageDataSets
-
30. Ministry of Energy and Mineral Resources [Internet]. Studies and Statistics. Jordan: Ministry of Energy and Mineral Resources; [cited 2023 Sep 14]. Available from: https://memr.gov.jo/En/List/Studies_and_Statistics
-
31. International Labour Organization [Internet]. Switzerland: The Organization [cited 2016 Apr 16]. Available from: https://www.ilo.org/
-
32. Kawkabuna energy [Internet]. Jordan: The Company [cited 2023 Sep 14]. Available from: https://www.energy-xprt.com/companies/kawkabuna-energy-76938
-
33. Samsung [Internet].Korea: Samsung Electronics; [cited 2023 Sep 14]. Available from: https://www.samsung.com/levant/air-conditioners/wall-mount/ar9500t-wind-free-ar24asfzjwk-jo/
-
34. Tashtoush GM, Freewan A, Dallu AI. Retrofit measures evaluation considering thermal comfort and energy efficiency in school buildings using design of experiments. Scholars J Eng Technol. 2022;10(6):91-101.[DOI]
-
35. Albdour MS, Shalby M, Salah AA, Alhomaidat F. Evaluating and enhancing the energy efficiency of representative residential buildings by applying national and international standards using BIM. Energies. 2022;15(20):7763.[DOI]
-
36. Dar-Mousa RN, Z . Makhamreh Z. Analysis of the pattern of energy consumptions and its impact on urban environmental sustainability in Jordan: Amman city as a case study. Energy, Sustain Soc. 2019;9(15):1-12.[DOI]
-
37. NOAA. Historical Maps and Charts [Internet]. Washington: National Oceanic and Atmospheric Administration [cited 2023 Sep 14]. Available from: https://oceanservice.noaa.gov/podcast/july17/nop08-historical-maps-charts.html
Copyright
© The Author(s) 2023. This is an Open Access article licensed under a Creative Commons Attribution 4.0 International License (https://creativecommons.org/licenses/by/4.0/), which permits unrestricted use, sharing, adaptation, distribution and reproduction in any medium or format, for any purpose, even commercially, as long as you give appropriate credit to the original author(s) and the source, provide a link to the Creative Commons license, and indicate if changes were made.
Publisher’s Note
Share And Cite


