Regional difference of US residential building energy usage and carbon footprint: state-level analysis
*Correspondence to:
Jianli Chen, Department of Civil and Environmental Engineering, The University of Utah, Salt Lake City, UT 84112, USA.
E-mail: jianli.chen@utah.edu
J Build Des Environ. 2024;2:28501. 10.37155/2811-0730-0301-7
Received: January 21, 2024Accepted: March 26, 2024Published: April 07, 2024
Abstract
United States (US) residential buildings demonstrate great decarbonization and energy-saving potential. However, research on the carbon footprint of residential buildings at the state level, especially consumption-based emissions, is limited. Therefore, this paper aims to quantify and compare the state-level carbon emissions and energy consumption of residential buildings in the US. Specifically, state carbon emission factors of electricity are estimated using area and population-based interpolations of Emissions & Generation Resource Integrated Database (eGRID) regional carbon factors. Total carbon emissions and carbon intensity (e.g., carbon emission per household/capita) of each state are then calculated based on the 2020 Residential Energy Consumption Survey dataset. Results of state carbon footprints demonstrate regional differences and spatial patterns: Texas and California stand out as the top energy consumers and contribute to the largest amount of carbon emissions, while Missouri has the highest carbon intensity on a household/capita/housing area basis. Also, west and east coastal states (e.g., California) exhibit lower carbon intensities than central states. Sensitivity analysis concludes that highly electrified states (e.g., Florida and Hawaii) are more sensitive to the carbon emission factor of electricity generation, with sensitivity degrees over 0.97. Furthermore, correlation analysis indicates that total carbon emission and its sensitivity to electricity carbon emission factor, as well as emission intensity positively correlate with state energy profile (e.g., gas ratio). Therefore, to achieve residential building decarbonization, besides energy-conservative measures, high gas-penetration states (e.g., Illinois) need to reduce direct fossil fuel use in residential energy services; states with high carbon emission factors and electrifications, e.g., Hawaii and Missouri, need to decarbonize electricity generation by adopting renewable energy as sources. The research findings contribute to understanding the regional variations in carbon footprints and energy usage of residential buildings, facilitating the development of tailored decarbonization and energy-saving measures for targeting states in the US.
Keywords
Carbon footprint, energy usage, residential building, regional difference, consumption-based emissions
1. Introduction
Increasing greenhouse gas emissions, mainly carbon dioxide (CO2), is the primary driver of global warming[1]. Decarbonization, therefore, is an imperative theme when addressing the issues of climate change and global warming. While the total carbon emission in the United States (US) is gradually decreasing, the US still releases around 5 billion tons of carbon annually, accounting for ~14% of total global emissions[2,3]. In the US, the residential sector contributes to ~20% of annual total energy usage and ~19% of carbon emissions (including direct consumption of fossil fuels and indirect emission by electricity generation), showing great potential in decarbonization and energy-saving[4-6]. Carbon footprints demonstrate great regional differences due to the diversity of population density, economic activities, and energy sources[7,8]. Analyzing the regional differences promotes developing tailored mitigation efforts to reduce residential building carbon emissions.
Previous studies have analyzed the state-level carbon emissions in the US, combining all sectors; however, the comparison and analysis of the carbon footprints of residential buildings in different states is limited. In the US, the "State Energy CO2 Emissions" database regulated by the Environmental Protection Agency (EPA) is the predominant data source used to analyze regional differences of carbon emissions[7,9]. Although this database has separated the carbon emissions by sectors, including direct fossil fuel usage by transportation, industrial, and residential, as well as the fuels consumed for electricity generation, state-level residential carbon emissions are still unavailable in that carbon emissions related to electricity generation fail to be further assigned to residential, commercial, and other sectors[10]. In addition, the carbon emissions estimated in this database are production-based, which attributes the emissions to where the products (e.g., electricity generation) are produced rather than where they are consumed[10,11]. Considering electricity transmissions across states, that is, electricity generated in one state but consumed in another, this database ignores the carbon leakages from electricity-consuming states to electricity-generating states[12,13]. Therefore, it is required to quantify the carbon emissions of residential buildings based on real energy usage, i.e., consumption-based emissions.
Consumption-based carbon emission calculations require energy consumption data and corresponding carbon factors of the energy source. Compared with other energy fuels such as gas and propane, the carbon factor of electricity, depending on the energy sources used for power generation, is not always directly available[14]. Some studies used a fixed carbon factor for electricity consumption to simplify carbon emission accounting, as exemplified by Ji et al. and Hong et al.[15,16]. EPA has published the Emissions & Generation Resource Integrated Database (GRID) about the environmental characteristics of electric power generated in the US, including the carbon emission factors of electricity and fuel mix[17], which are the main references for existing studies in this field. Goldstein et al. adopted eGRID as the electricity carbon emission factor to estimate the greenhouse gas but did not consider the electricity trade across states[8]. Similarly, Berrill et al. calculated the carbon emission based on the electricity generation fuel mix and ignored electricity transmission[18]. In other words, the carbon factor of each state in eGRID is production-based rather than consumption-based[14]. Although eGRID has divided the United States into multiple subregions, within which there is no import and export of electricity and carbon leakage of electricity can be ignored[19], each state is difficult to map with an individual eGRID subregion due to the intersecting boundaries of subregions and states. Consequently, a suitable way to estimate the state carbon emission factor of electricity consumption is necessary to calculate and compare the state carbon footprints.
However, the estimation of the state carbon emission factor of electricity and the assessment of the consumption-based carbon footprints of residential buildings at the state level are lacking. Therefore, this paper aims to introduce a population and area-based interpolation method to estimate the state carbon emission factor of electricity consumption. Then, the state carbon emissions and intensities of residential buildings (consumption-based emissions) in the US are quantified based on a national-scale household energy usage dataset, i.e., Residential Energy Consumption Survey (RECS), to analyze regional differences and spatial patterns of carbon footprints and energy usage across states. Additionally, the impact of the carbon emission factor of electricity on carbon emissions is quantified through sensitivity analysis. This paper critically examines the carbon emission and intensity of the residential sector, focusing on consumption-based emissions. It enhances the accuracy of carbon emission accounting by incorporating interpolated carbon emission factors of electricity, rather than relying on fixed factors or neglecting carbon leakage caused by interstate electricity transmission. Additionally, it conducts a comparative analysis of regional disparities in carbon and energy consumption, aiming to identify states with high usage and emissions in residential buildings. The research findings provide valuable insights to inform the development and implementation of different decarbonization measures specific to states, while advocating sustainable and low-carbon development.
2. Methodology
2.1 Data
RECS is a periodic nationwide survey, administrated and regulated by the Energy Information Administration (EIA). RECS 2020 is the latest release dataset on household-level energy usage, including household demographics, housing characteristics, and energy consumption. Household demographics, housing characteristics, and energy use patterns are collected by a household survey, while energy consumption data such as the usage of electricity, gas, and propane are collected from energy suppliers directly via a mandatory Energy Supplier Survey for energy bills of the surveyed households during the reference period.
RECS 2020 is the first time to collect all 50 states and the District of Columbia[20]. RECS 2020 collected 18496 representative households, considering the sampling adjustment and population, which represents the total housing unit population in the US by assigning a weight (NWEIGHT) to each sampled household[21]. Therefore, state carbon emissions and energy usage are the weighted sum of households in the state based on Eq. (1) and Eq. (2). Likewise, carbon and energy intensity (e.g., carbon emission per capita and per household) are the weighted average of household intensity.
Where Carbon_Householdi and Usage_Householdi are the carbon emission and energy usage of the Householdi. NWEIGHTi is the weight assigned to Householdi to represent the number of housing units.
2.2 Estimation of carbon emission factor of electricity
The carbon emission factor of electricity depends on the energy sources, including wind, solar, and fossil fuels, that are used to generate electricity. In the US, however, different states or regions use different fuel mixes for electricity generation and, therefore, have varying carbon emission factors of electricity. Considering 7.3% transmission and distribution losses[22], the national average carbon emission rate of electricity in 2020 is 818.29/(1 - 0.073) = 882.73 lbs CO2/MWh (i.e., 4.00 × 10⁻⁴ metric tons CO2/kWh [t/kWh])[17]. EPA has published the annual averaging carbon emission factor of electricity generation for each state; however, the state electricity factor of eGRID 2020 is production-based, which is calculated based on the electricity generated in the state instead of electricity consumed in the state; therefore, eGRID does not consider the electricity transmission across states. Therefore, in general, there is no direct available data for the state carbon emission factor of electricity on the consumption side.
To overcome this issue of carbon leakage due to state electricity trades, EPA has divided the United States into 27 eGRID subregions to ensure emission factors of consumption most accurately match the generation and emissions from the plants in the aggregated area, where there is no import and export of electricity[19]. Therefore, based on the eGRID subregions, this study adopts population and area-based interpolations to calculate the electricity carbon factor of each state, following the procedure of Figure 1. First, the geographic information system (GIS) maps of eGRID and county-level population are geometrically intersected. County-level population data and GIS shapefiles of eGRID and county are acquired from Esri and eGRID[17,23]. For each county, then, if there are intersections with two or more eGRID regions, the carbon emission factor is the area-based interpolations of the intersected eGRID regions (Eq. 3); otherwise, the carbon emission factor of the county equals that of the corresponding eGRID. Finally, at the state level, the carbon emission factor equals the population-based interpolation of each county (Eq. 4).
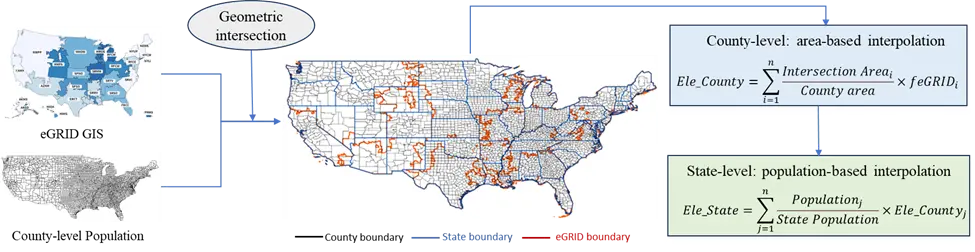
Figure 1. Procedure of interpolating carbon factor of electricity for each state. The county-level and intersection maps are only exemplified by the continental United States. eGRID: Emissions & Generation Resource Integrated Database; GIS: geographic information system.
Where Intersection Areai is the area of eGRIDi intersected with the county; County areas the total area of the county; feGRIDi is the carbon emission factor of electricity of the eGRIDi; Populationj is the number of population in the Countyj; State Population is the total number of population of the state; Ele_Countyj and Ele_State are the carbon emission factor of electricity of the Countyj and state, respectively.
2.3 Carbon emission accounting
In the US, electricity, natural gas, propane, fuel oil, and wood are consumed to provide energy services for residential households. Similar to existing studies[24,8], wood is considered carbon neutral. The carbon emission of each household is calculated based on Eq. 5.
Where Carbon is the total carbon emissions of each household consuming different energy sources; Ei is the usage of energy source (i); fi is carbon emission factor of energy source (i). The carbon emission factors of each energy source are summarized in Table 1.
Table 1. Carbon emission factors of each energy source[17].
| Energy Source | Carbon Emission Factor | Energy Source | Carbon Emission Factor |
| Electricity | Vary by state | Natural gas | 0.55 × 10⁻⁴ t/ft3 (0.16 × 10⁻⁴ t/m3) |
| Propane | 5.60 × 10⁻³ t/gallon (0.02 × 10⁻³ t/m3) | Fuel oil | 10.15 × 10⁻³ t/gallon (0.04 × 10⁻³ t/m3) |
2.4 Research framework
The research framework of this paper is demonstrated in Figure 2. First, based on the estimated state carbon factor of electricity (Section 2.2) and household energy use (Section 2.1), household-level carbon emissions are calculated (Section 2.3). Carbon emissions of individual households are then summed to state-level carbon emissions and used to calculate the carbon intensity of each state, i.e., carbon emission per household, per capita, and per square meter. Similarly, state-level energy usages of each fuel are obtained, which are further used to calculate the electricity-gas ratio, the total amount of energy usage, and energy use intensity (energy usage per household, per capita, and per square meter). Subsequently, state differences and spatial patterns of carbon emission and energy use are compared and analyzed. Furthermore, considering the uncertainty of carbon factors of electricity, we perform a sensitivity analysis to analyze how state-level carbon emissions are affected by the state carbon emission factor of electricity. The sensitivity of carbon emissions to the electricity carbon factor is quantified by measuring the changes in carbon emissions resulting from a given change in the electricity carbon emission factor (Eq. 6). Finally, the Pearson correlation is adopted to analyze the relationship between carbon emission, emission intensity, sensitivity to carbon emission factor, and state energy profile (e.g., electricity-gas ratio).
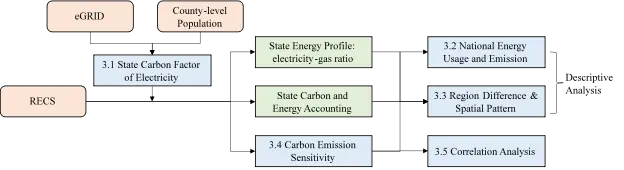
Figure 2. Research framework of study. eGRID: Emissions & Generation Resource Integrated Database; RECS: residential energy consumption survey.
3. Results and Discussions
3.1 State carbon factors of electricity
Following the procedure of carbon emission factor interpolations, state carbon emission factors of electricity are calculated and shown in Figure 3. Hawaii has the largest carbon emission factor, with 0.73 kg CO2/kWh, followed by Missouri (0.64 kg CO2/kWh), while some northeastern states (e.g., Vermont, Connecticut, and Rhode Island) are the lowest, ~0.26 kg CO2/kWh. The carbon factors also demonstrate spatial patterns. The central states, including Illinois, Michigan, and Iowa, have larger electricity carbon factors compared to the east and west coastal states, such as California, New York, and Maine.
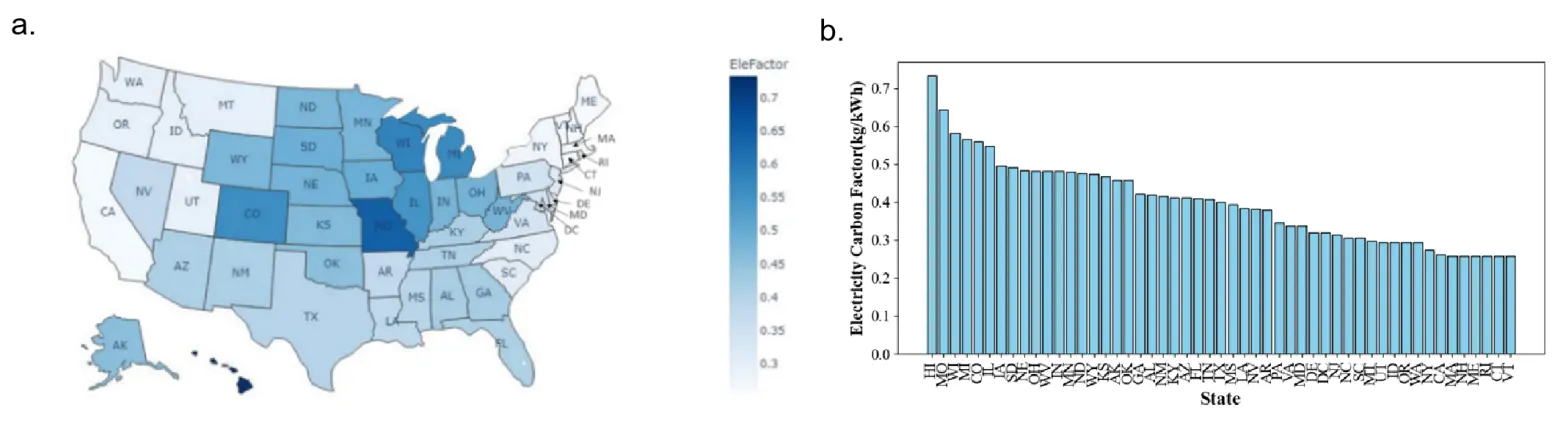
Figure 3. Carbon emission factor of electricity (kg CO2/kWh) in each state. (a) Distribution of state carbon factor of electricity; (b) Rank of state carbon factor of electricity. AK: Alaska; AL: Alabama; AR: Arkansas; AZ: Arizona; CA: California; CO: Colorado; CT: Connecticut; DC: District of Columbia; DE: Delaware; FL: Florida; GA: Georgia; HI: Hawaii; IA: Iowa; ID: Idaho; IL: Illinois; IN: Indiana; KS: Kansas; KY: Kentucky; LA: Louisiana; MA: Massachusetts; MD: Maryland; ME: Maine; MI: Michigan; MN: Minnesota; MO: Missouri; MS: Mississippi; MT: Montana; NC: North Carolina; ND: North Dakota; NE: Nebraska; NH: New Hampshire; NJ: New Jersey; NM: New Mexico; NV: Nevada; NY: New York; OH: Ohio; OK: Oklahoma; OR: Oregon; PA: Pennsylvania; RI: Rhode Island; SC: South Carolina; SD: South Dakota; TN: Tennessee; TX: Texas; UT: Utah; VA: Virginia; VT: Vermont; WA: Washington; WI: Wisconsin; WV: West Virginia; WY: Wyoming.
Further analysis of the fuel mix used for electricity generation of each eGRID region[17] indicates that these states with high carbon factor of electricity consume more fossil fuels than renewable sources in power generation. For example, most counties of Missouri are within the SRMW region, which consumes the highest proportion of coal (67.43%) for generating electricity. Similarly, the Midwest Reliability Organization East region, mainly including Wisconsin, has the second highest ratio of coal, 54.38%.
3.2 National energy usage and carbon emission of residential buildings
In the US, residential buildings consume 2.78 × 10¹² kWh, including 1.31 × 10¹² kWh of electricity and 4.22 × 1012 ft3 (11.95 × 10¹⁰ m3) of natural gas, and emit 7.87 × 10⁸ t carbon annually in total. Distributions of carbon emissions and energy usage per household, per capita, and per square meter of residential buildings are demonstrated in Figure 4 and Table 2. Specifically, a household consumes 22,493 kWh (Standard Deviation [S.D.] = 14.77) of energy and emits 6.37 t (S.D. = 3.92) of carbon on average, with a median of 21,740 kWh and 6.13 t, respectively. In terms of per capita, 11,156 kWh are consumed, with 3.15 tons of carbon emissions on average. The average energy use and carbon emission per square meter are 160.73 kWh and 0.05 t, respectively.

Figure 4. Distribution of carbon emissions and energy usage. (a) Distribution of energy usage; (b) Distribution of carbon emission.
Table 2. Descriptive analysis of energy usage and carbon emissions of residential buildings.
| Min | Max | Median | Mean | S.D. | ||
| Energy Use (kWh) | Household | 346.47 | 400,788.99 | 21,740.05 | 22,493.99 | 14,773.87 |
| Per Person | 69.29 | 200,394.49 | 9,615.74 | 11,155.79 | 8,632.16 | |
| Per Square Meter | 1.10 | 1,119.91 | 144.59 | 160.73 | 92.09 | |
| Carbon (t) | Household | 0.14 | 88.14 | 6.13 | 6.37 | 3.92 |
| Per Person | 0.03 | 41.21 | 2.73 | 3.15 | 2.25 | |
| Per Square Meter | < 0.01 | 0.29 | 0.04 | 0.05 | 0.03 |
S.D.: Standard Deviation.
3.3 Region differences of residential carbon emissions
The total energy usage and carbon emission of residential buildings are summarized by the state, as shown in Figure 5. The state ranking of carbon emission and energy consumption are similar. Residential buildings in Texas and California are the top consumers of energy annually, with an approximate consumption of 2,000 × 108 kWh, and Texas emits the most carbon, around 67 × 106 t, followed by Florida (47 × 106 t) and California (45 × 106 t), while Washington DC, Wyoming, Vermont, and Hawaii consume the least energy in total and have the least carbon emissions, with less than 70 × 108 kWh and around 1 × 10⁶ t, respectively.
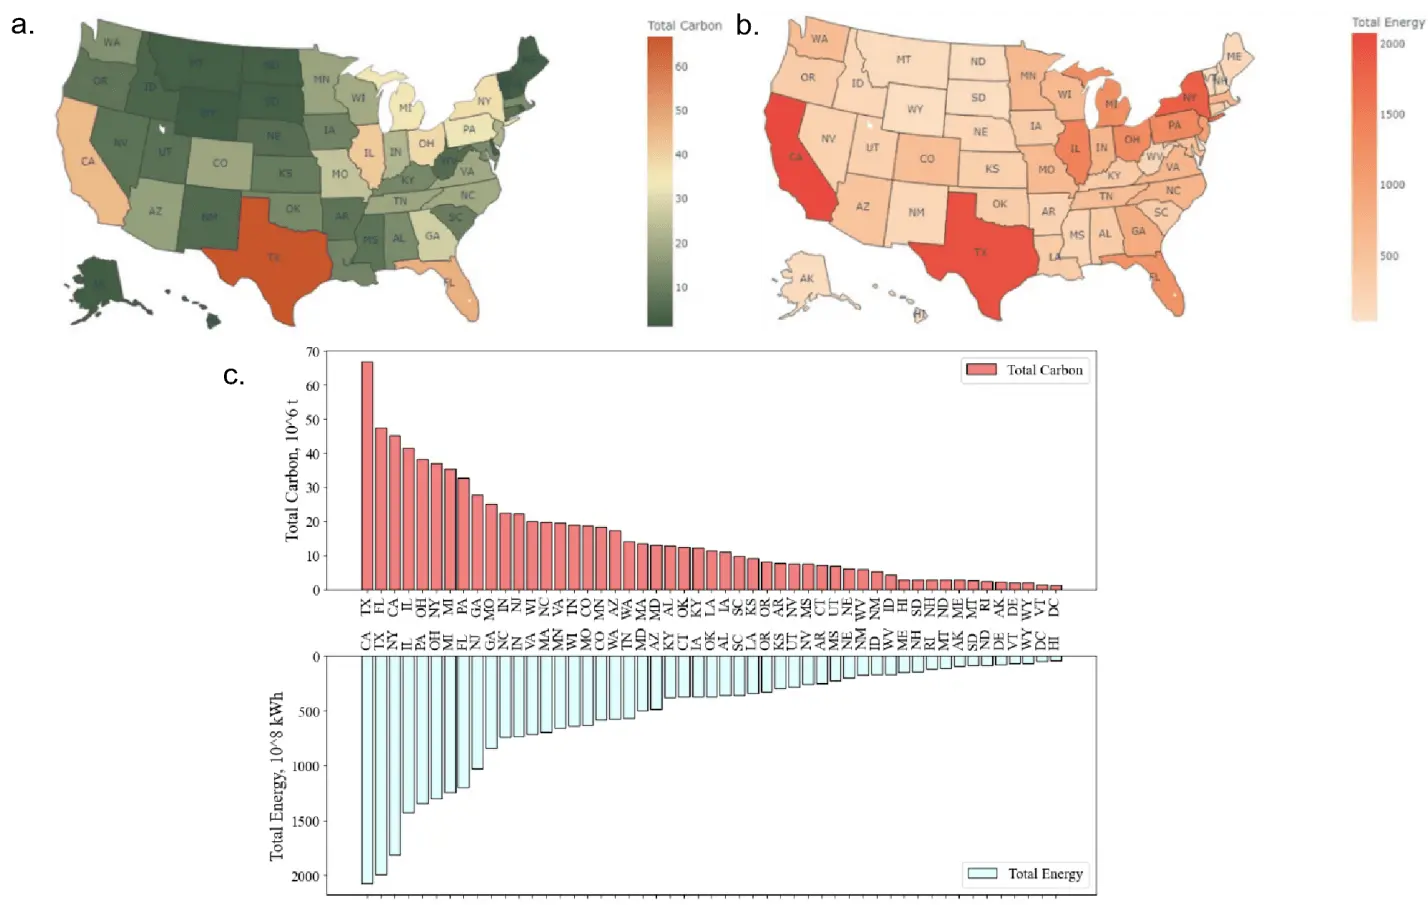
Figure 5. Distribution of residential carbon emissions and energy usage in total. (a) Distribution of total carbon emission (106 t); (b) Distribution of total energy usage (108 kWh); (c) Rank of total energy usage and carbon emission.
The intensity of carbon emission and energy usage at the household, capita, and housing area (m2) level are also analyzed, which are shown in Figure 6, Figure 7 and Figure 8. Missouri stands out for emitting the highest amount of carbon per household (10.36 t), per person (5.46 t), and per square meter (75.78 kg), despite not having the highest energy usage intensities, which can be attributed, in part, to Missouri's second-highest carbon emission factor of electricity. Similarly, Michigan, Iowa, Wyoming, Illinois, Indiana, Alaska, and North Dakota have larger carbon emission intensities, with over 8 t/household, 4 t/person, and 60 kg/m2. Noteworthily, Alaska has the largest energy usage intensity, with 36.67 × 10³ kWh per household, 17.54 × 10³ kWh per person, 0.26 × 10³ kWh per square meter, followed by Michigan. Furthermore, resident buildings in Illinois, Iowa, and Wyoming have high energy usage intensities, with approximately 30 × 103 kWh/household, 15 × 103 kWh/person, 0.20 × 10³ kWh/m2.
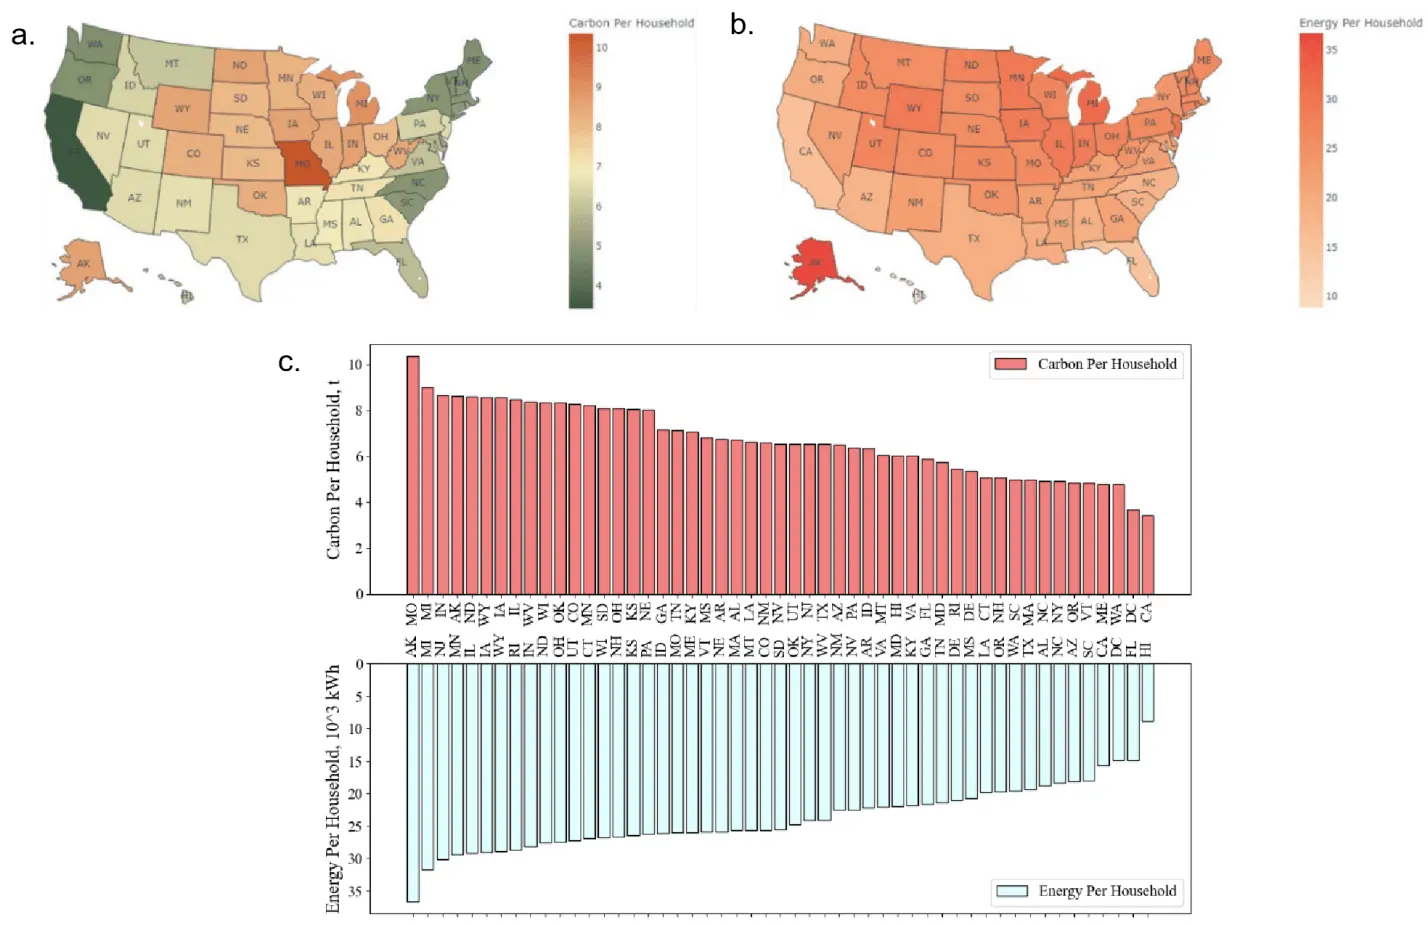
Figure 6. Distribution of residential carbon emissions and energy usage per household. (a) Distribution of carbon emission per household (t); (b) Distribution of energy use per household (103 kWh); (c) Rank of total energy usage and carbon emission per household.
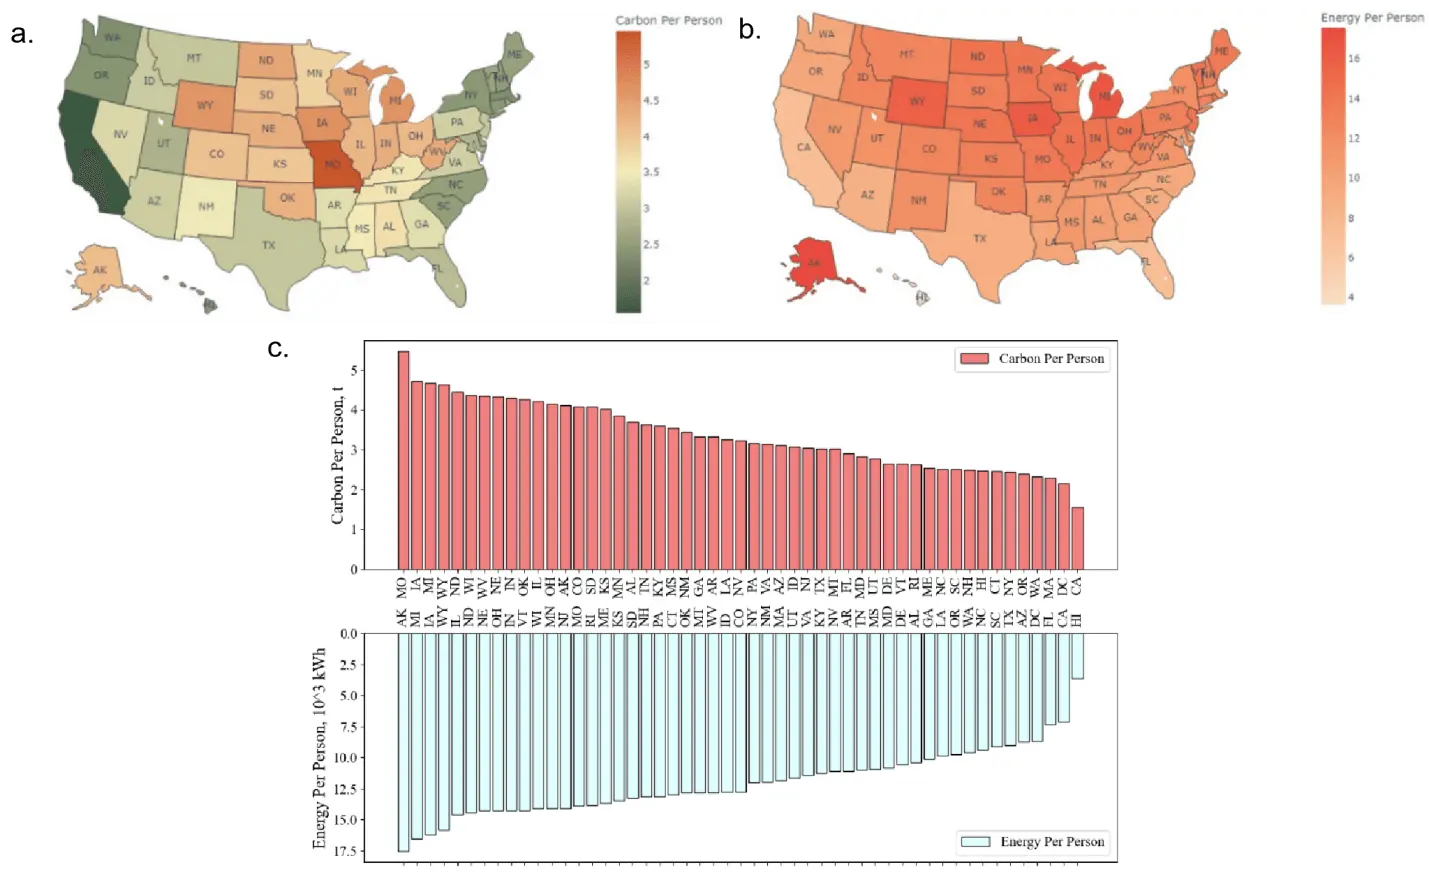
Figure 7. Distribution of residential carbon emissions and energy usage per person. (a) Distribution of carbon emission per person (t); (b) Distribution of energy usage per person (103 kWh); (c) Rank of total energy usage and carbon emission per person.
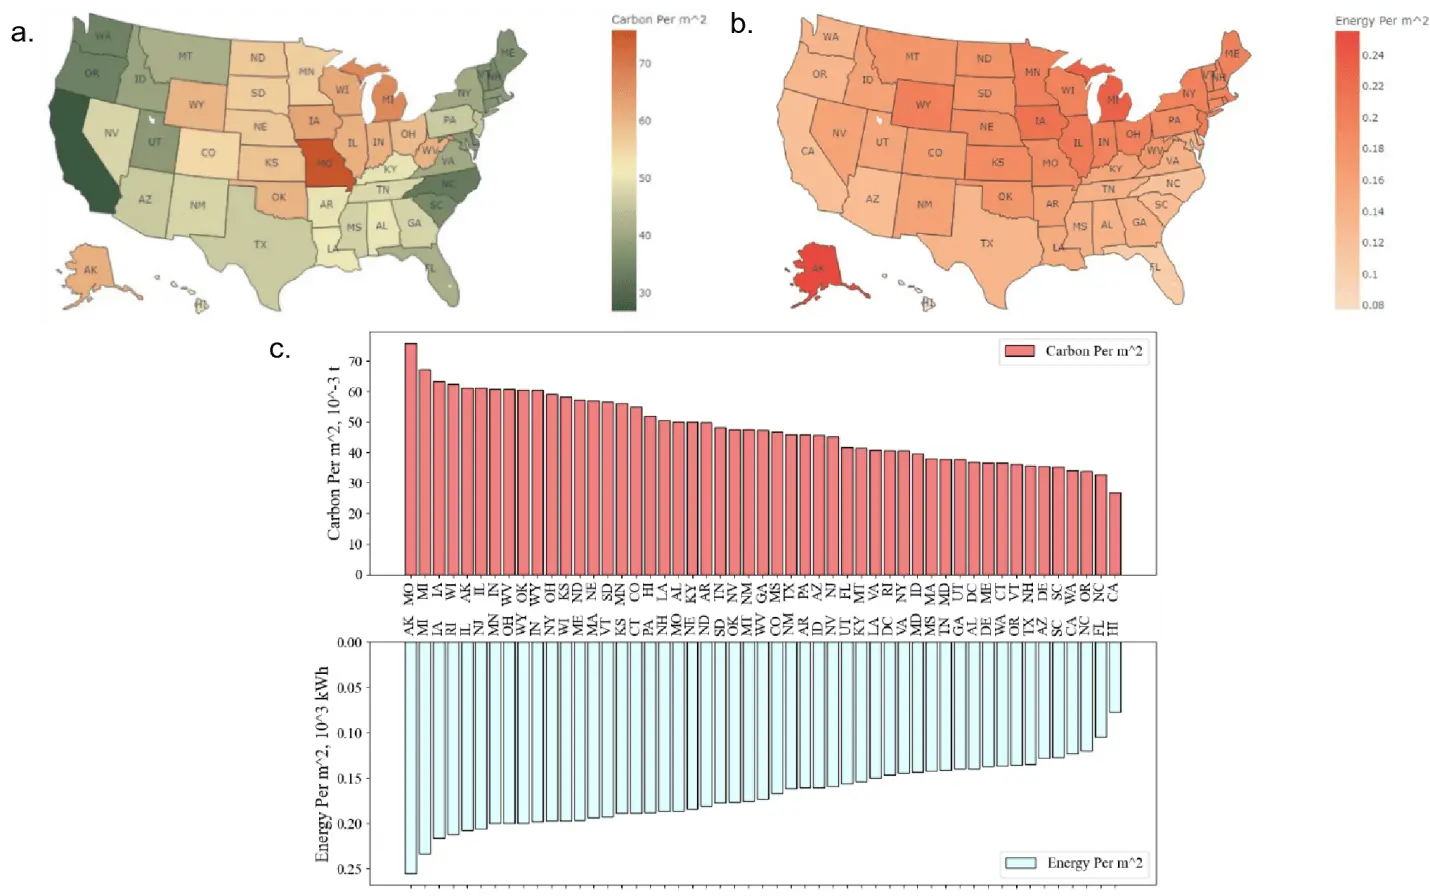
Figure 8. Distribution of residential carbon emissions and energy usage per square meter. (a) Distribution of carbon emission per m2 (10-3 t); (b) Distribution of energy usage per m2 (103 kWh); (c) Rank of total energy usage and carbon emission per m2.
On the contrary, California has the lowest carbon intensity (3.42 t per household, 1.55 t per person, and 26.80 kg per square meter), although it has relatively higher total carbon emissions. The carbon emissions per household in Washington DC, Washington, Maine, Vermont, Oregon, New York, North Carolina, Massachusetts, and South Carolina are below 5.0 t, which is less than half of the top-emitter (i.e., Missouri: 10.36 t). The carbon intensities (per person and per square meter) in these states are also approximately less than half of those in Missouri. In terms of energy usage, residential buildings in Hawaii have the lowest average consumption intensity, with 8.88 × 10³ kWh per household, 3.64 × 10³ kWh per person, 0.08 × 10³ kWh per square meter. Florida, Washington DC, and California consume less energy per household (averaging around 15 × 103 kWh) compared to other states as well. Additionally, both California and Florida exhibit energy consumption levels of less than 7.5 × 10³ kWh/person and around 0.10 × 10³ kWh/m2, which are far lower than most states.
In addition, it is worth noting that state carbon and energy intensities exhibit distinct spatial patterns, which differ from the total carbon emissions and energy usage. For the spatial pattern of total energy consumption and carbon emissions, California, Texas, Florida, and New York consume more energy and have higher carbon emissions than midwestern and northwestern states (e.g., North Dakota, South Dakota, Montana, and Wyoming). Conversely, western and eastern coastal states (such as California, Oregon, and Washington) exhibit lower energy consumption per household, per capita, and per square meter, while central states (including Missouri, Illinois, and Michigan) have relatively higher intensities of carbon emission and energy consumption.
3.4 Sensitivity analysis of carbon emissions
Carbon emission accounting depends on the energy usage of different energy sources (e.g., electricity, natural gas, and propane) and the corresponding carbon emission factor, among which the electricity carbon emission factor is estimated and varies by state. The uncertainty of state carbon emission estimation mainly originates from the carbon emission factors of electricity. Hence, sensitivity analysis is conducted to examine the impact of the state carbon factor of electricity on carbon emissions (Eq. 6). The results are shown in Figure 9.
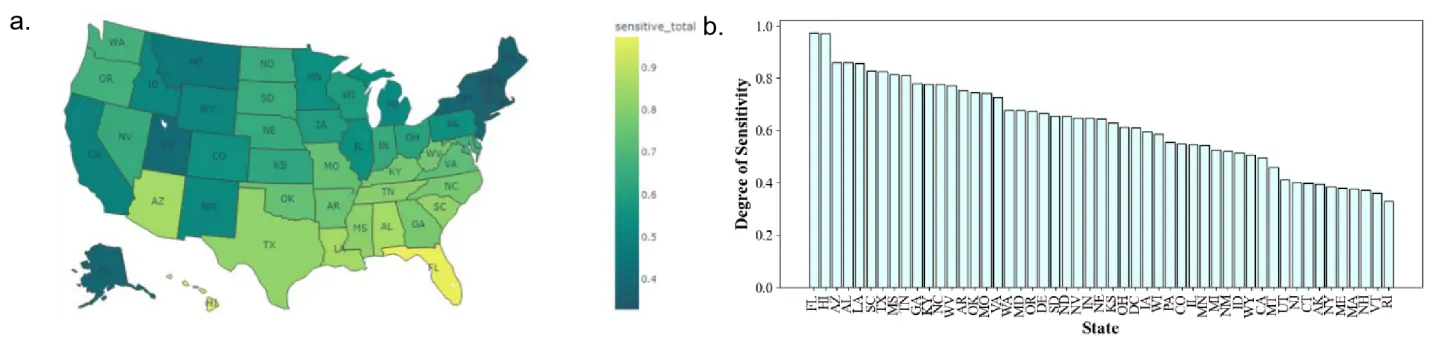
Figure 9. Sensitivity analysis of electricity carbon emission factor on carbon emissions. (a) Distribution of sensitivity; (b) Rank of sensitivity.
The carbon emissions of Florida and Hawaii are the most sensitive to the carbon factors of electricity, with sensitivity degrees around 0.97. This indicates that every 10% increase in the carbon emission factor of electricity in Florida or Hawaii will contribute to a corresponding 9.7% increase in total carbon emission. In fact, the carbon factors of carbon generation in these two states are higher than the national average (4.00 × 10⁻⁴ t/ kWh), especially in Hawaii, around 7.32 × 10⁻⁴ t/ kWh. In contrast, Rhode Island is the least sensitive to the electricity carbon emission factor, with 0.33 for total carbon emissions. The sensitivity analysis results emphasize the importance of correctly estimating the emission factors of electricity to quantify and compare regional carbon emissions, especially considering the electricity transmission across states. Additionally, the spatial pattern indicates northeast coastal states (e.g., New York, Massachusetts, New Hampshire, New Jersey, and Rhode Island) have relatively lower sensitivity to carbon factors of electricity, less than 0.4, while southern states (e.g., Florida, Louisiana, and Texas) are more sensitive to the electricity carbon factor, with the degree of sensitivity over 0.7.
3.5 Correlation analysis of carbon emission, intensity, and sensitivity
Pearson correlation is adopted to analyze the relationship between total carbon emission, emission intensity, sensitivity to carbon emission factors, and state energy profile (e.g., electricity and gas ratio), as shown in Figure 10. Carbon intensity (per person, per household, and per square meter) has moderate correlations (correlation coefficient [r] < 0.7) with corresponding energy use intensity. Also, carbon intensity positively correlates with gas ratio (r ≈ 0.4) and negatively correlates with electricity ratio (r ≈ -0.2). Hence, besides energy-conservation measures, states consuming larger proportions of gas directly tend to emit more carbon. Therefore, reducing direct fossil fuel use for residential energy services, especially space heating, as concluded in our recent study[25], is effective for building decarbonization for low-electrification and high-gas penetration states, such as Illinois, New Jersey, and Utah, as demonstrated in Figure 11a.
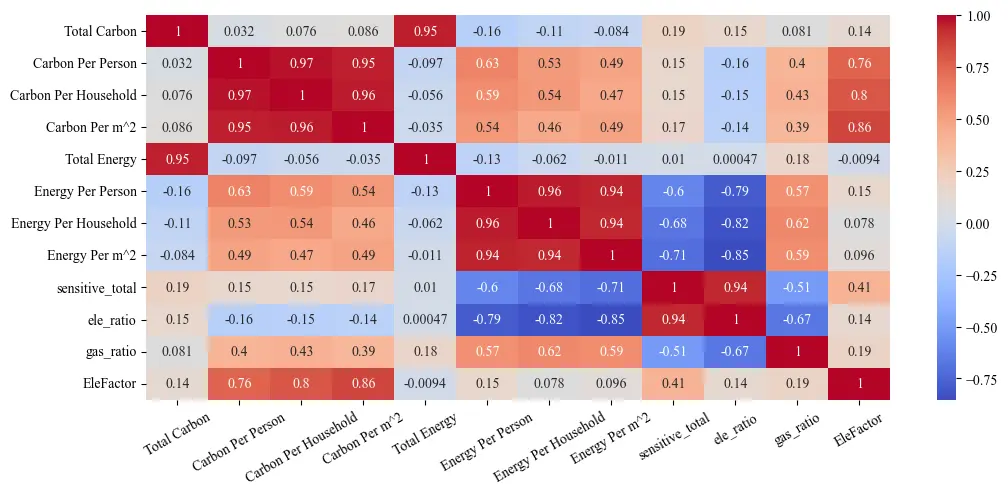
Figure 10. Correlation heatmap of carbon emission, intensity, sensitivity, and energy profile. Sensitive_total: sensitivity factor of total carbon emission to electricity carbon emission factor; ele_ratio: electricity ratio; gas_ratio: gas ratio; EleFactor: electricity carbon emission factor.
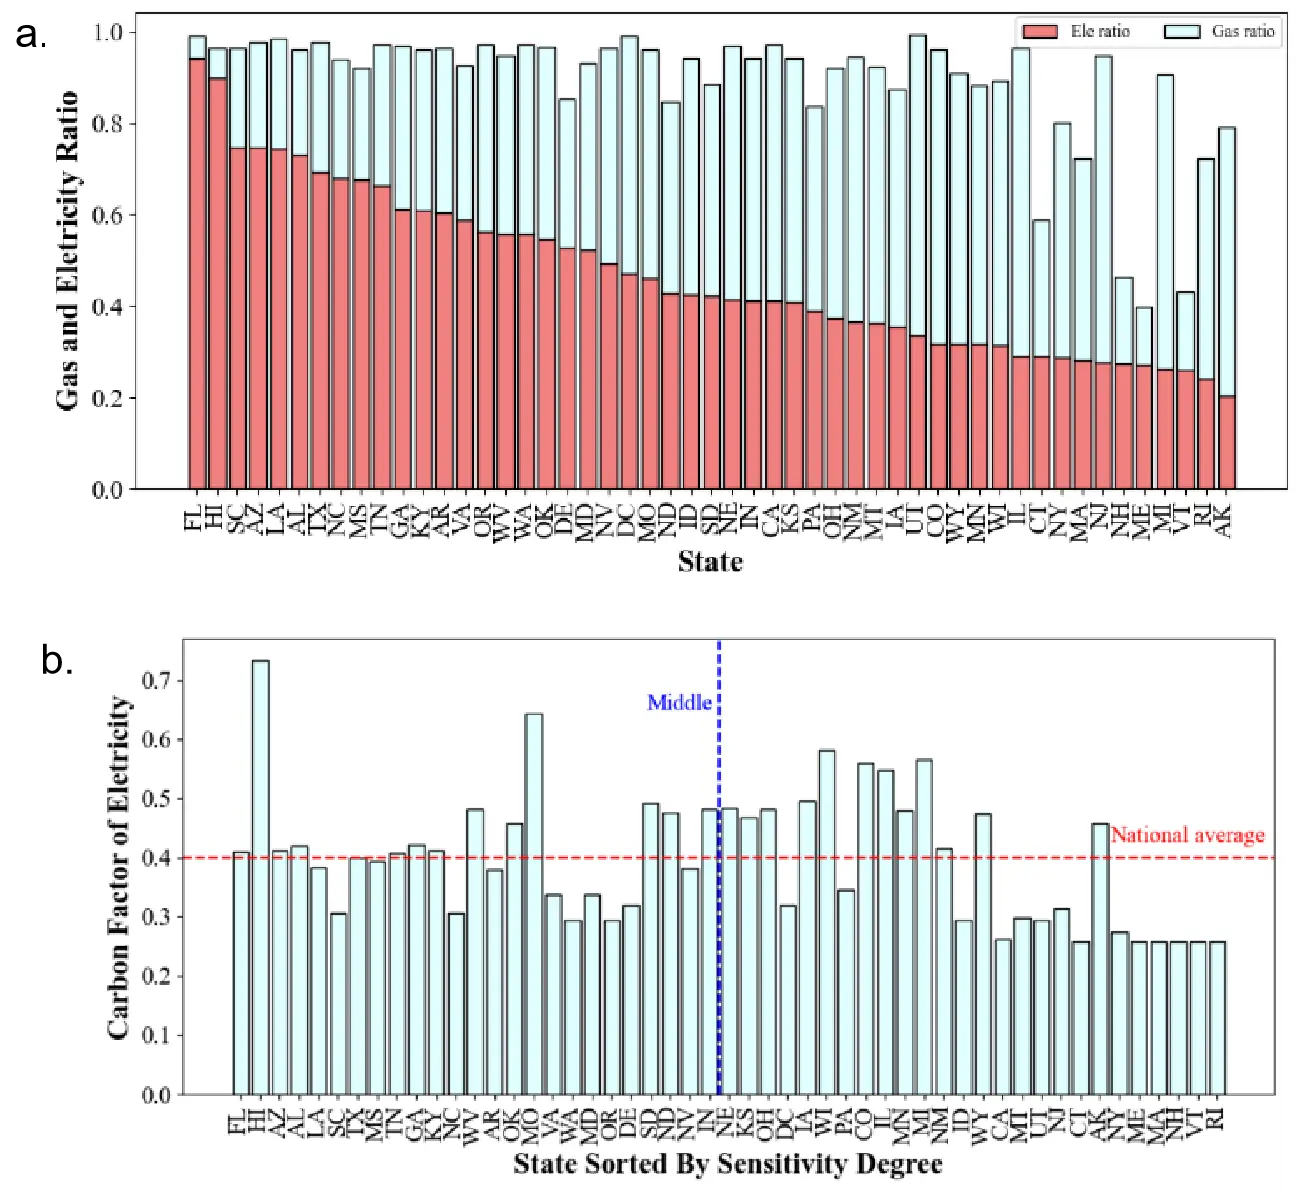
Figure 11. State energy profile: gas and electricity ratio, carbon factor. (a) Gas and electricity ratio; (b) Carbon factor sorted by sensitivity.
Also, the sensitivity of carbon emissions strongly correlates with the electricity ratio (r = 0.94) and has a negative correlation with the gas ratio (r = -0.51), which indicates that higher-electrification states (e.g., Florida and Hawaii) tend to be more sensitive to the carbon factors of electricity. Additionally, it is observed that carbon intensity has strongly positive correlations with the electricity carbon factor (r ≈ 0.8). Therefore, in those states with high electricity carbon emission factors and high electrification rates (i.e., high sensitivity), decarbonizing their electricity generation by reducing the reliance on fossil fuels for electricity generation is essential to reduce the carbon emissions of buildings. Examples of such states include Hawaii, West Virginia, Missouri, and South Dakota, which have electricity carbon emission factors over the national average and rank above the median in sensitivity, as shown in Figure 11b. Similarly, Berrill et al. proposed that decarbonizing the electricity grid is the most effective pathway for reducing greenhouse gases in the residential sector[26]. Additionally, it is worth noting that the carbon emission rates of power plants in some states extremely exceed the national average. For example, Wyoming's carbon output emission rate of electricity generation is the highest, 9.67 × 10⁻⁴ t/kWh (over double the national average)[17]. Such a high carbon emission rate is due to the high penetration of fossil fuels, with around 76% coal and 5% natural gas in the electrical generation mix[27]. Similar issues exist in West Virginia, Kentucky, and Missouri.
4. Conclusions
This study first interpolates the eGRID regional carbon emission factor to the state level, and then compares total amounts and intensities of carbon emissions and energy usage across states in a consumption-based approach. In total, residential buildings consume 2.78 × 10¹² kWh energy and emit 7.87 × 10⁸ t carbon annually in the US, among which Texas and California consume the most energy and emit the largest amount of carbon. Specific to region differences, state carbon footprint and energy usage demonstrate spatial patterns: the central states (e.g., Missouri, Michigan, and Wisconsin) use higher proportions of fossil fuels, such as coal and gas, to generate electricity and, therefore, have higher carbon emission factors than the west and east coastal states. Similar patterns are observed in the carbon intensity at household, capita, and housing area levels. West and east coastal states (e.g., California, Oregon, and Washington) have lower carbon and energy intensities than central states (e.g., Missouri, Illinois, and Michigan).
Sensitivity analysis of the impact of state carbon emission factor of electricity on carbon emissions shows that highly electrified states are more sensitive to the increases in the carbon emission factor of electricity. Therefore, we propose that besides energy conservation, substituting direct fossil fuels use in residential energy services for high-gas penetration states (e.g., Illinois, New Jersey, and Utah) is effective for building decarbonization. Also, for highly electrified states with high carbon emission factor of electricity generation (e.g., Hawaii, West Virginia, Missouri, and South Dakota), decarbonization of electricity generation by transitioning to more renewable sources in power generation is essential.
However, this study has certain limitations. First, the carbon emission factor of electricity, a critical determinant of carbon emissions, is based on population and area interpolation at the state level. Yet, we need to acknowledge that the carbon emission factors of electricity may vary within each state. Finer-scale estimations (e.g., zip code level) of carbon emission factors and energy usage are necessary to get more accurate results. Second, this study uses cross-sectional data to analyze the spatial distribution and patterns of carbon emissions. The panel data of state-level carbon emission and energy use are expected to comprehensively explore the spatio-temporal evolution of carbon emissions in the US. Also, we do not develop models to examine and quantify the influencing factors of carbon emissions, for example, regional socioeconomic indicators (e.g., gross domestic product, population) and climate factors (e.g., heating and cooling degree days), which should be addressed in future work. Finally, commercial buildings are another significant energy consumer and carbon emitter. Future research needs to explore the spatial patterns of energy usage and carbon emissions across states to gain a comprehensive understanding of these dynamics and differences.
Nevertheless, this study still provides insights for policymakers and planners to understand the regional differences and spatial patterns of carbon emissions and energy usage, which informs the development and implementation of tailored decarbonization strategies and, ultimately, achieves sustainable and low-carbon goals.
Authors contribution
All authors contributed equally to this work.
Conflicts of interest
The authors declare no conflicts of interest.
Ethical approval
Not applicable.
Consent to participate
Not applicable.
Consent to publication
Not applicable.
Availability of data and materials
Not applicable.
Funding
None.
Copyright
© The Author(s) 2024.
References
-
1. Al-Ghussain L. Global warming: review on driving forces and mitigation. Environ Prog Sustain Energy. 2019;38:13-21.[DOI]
-
2. United Nations Environment Programme. Emissions Gap Report 2022: The Closing Window - Climate Crisis Calls for Rapid Transformation of Societies. Kenya: UNEP; 2022 [cited 2023 Nov 16].[DOI]
-
3. Wu Z, Huang X, Chen R, Mao X, Qi X. The United States and China on the paths and policies to carbon neutrality. J Environ Manage. 2022;320:115785.[DOI]
-
4. U.S. Energy Information Administration. Monthly Energy Review-November 2022. Washington: U.S. EIA; 2022. Available from: http://large.stanford.edu/courses/2022/ph240/tidd2/docs/mer-nov22.pdf
-
5. International Energy Agency. Global Energy Review: CO2 Emissions in 2021; Paris: IEA; 2021 [cited 2023 Oct 29]. Available from: https://iea.blob.core.windows.net/assets/c3086240-732b-4f6a-89d7-db01be018f5e/GlobalEnergyReviewCO2Emissionsin2021.pdf
-
6. Kuang B, Schelly C, Ou G, Sahraei-Ardakani M, Tiwari S, Chen J. Data-driven analysis of influential factors on residential energy end-use in the US. J Build Eng. 2023;75:106947.[DOI]
-
7. Dehdar F, Fuinhas JA, Karimi Alavijeh N, Nazeer N, Zangoei S. Investigating the determinants of carbon emissions in the USA: a state-level analysis. Environ Sci Pollut Res. 2023;30(9):23023-23034.[DOI]
-
8. Goldstein B, Gounaridis D, Newell JP. The carbon footprint of household energy use in the United States. Proc Natl Acad Sci USA. 2020;117(32):19122-19130.[DOI]
-
9. Keerthana KB, Wu SW, Wu ME, Kokulnathan T. The United States energy consumption and carbon dioxide emissions: a comprehensive forecast using a regression model. Sustainability. 2023;15(10):7932.[DOI]
-
10. U.S. Energy Information Administration . Energy-related carbon dioxide emissions by state, 2005-2016. Washington: UA EIA; 2019 [cited 2023 Oct 27]. Available from: https://www.eia.gov/environment/emissions/state/analysis/pdf/stateanalysis.pdf
-
11. Jorgenson A, Schor J, Huang X. Income inequality and carbon emissions in the United States: a state-level analysis, 1997-2012. Ecol Econ. 2017;134:40-48.[DOI]
-
12. Chen Y. Does a regional greenhouse gas policy make sense? A case study of carbon leakage and emissions spillover. Energy Econ. 2009;31(5):667-675.[DOI]
-
13. Zhang Q, Fang K. Comment on "consumption-based versus production-based accounting of CO2 emissions: is there evidence for carbon leakage?" Environ Sci Policy. 2019;101:94-96. [DOI:10.1016/j.envsci.2019.08.002].[DOI]
-
14. Chen L, Wemhoff AP. Predicting embodied carbon emissions from purchased electricity for United States counties. Appl Energy. 2021;292:116898.[DOI]
-
15. Ji C, Hong T, Kim H. Statistical analysis of greenhouse gas emissions of South Korean residential buildings. Renew Sustain Energy Rev. 2022;156:111981.[DOI]
-
16. Hong J, Shen GQ, Feng Y, Lau WS, Mao C. Greenhouse gas emissions during the construction phase of a building: a case study in China. J Clean Prod. 2015;103:249-259.[DOI]
-
17. U.S. Environmental Protection Agency. eGrid Data 2022. Washington : U.S. EPA; 2022 [cited 2023 Nov 08]. Available from: https://www.epa.gov/egrid/download-data
-
18. Berrill P, Gillingham KT, Hertwich EG. Drivers of change in US residential energy consumption and greenhouse gas emissions, 1990-2015. Environ Res Lett. 2021;16(3):034045.[DOI]
-
19. United States Environmental Protectiom Agency. eGRID2021 Technical Guide. Washington: U.S. EPA; 2021 [cited 2023 Nov 07]. Available from: https://www.epa.gov/system/files/documents/2023-01/eGRID2021_technical_guide.pdf
-
20. U.S. Energy Information Administration. Comparing the 2020 RECS with Previous RECS and Other Studies. Washington: U.S. EIA; 2023 [cited 2023 Nov 16]. Available from: https://www.eia.gov/consumption/residential/data/2020/pdf/Comparing_2020_with_previous_RECS.pdf
-
21. U.S. Energy Information Administration. 2020 Residential Energy Consumption Survey: Household Characteristics Technical Documentation Summary United States Environmental Protectiom Agency. Washington: U.S. EIA; 2023 [cited 2023 Nov 16]. Available from: https://www.eia.gov/consumption/residential/data/2020/pdf/2020%20RECS_Methodology%20Report.pdf
-
22. United States Environmental Protectiom Agency. Greenhouse Gases Equivalencies Calculator-Calculations and References. Washington: U.S. EPA; 2023 [cited 2023 Oct 23]. Available from: https://www.epa.gov/energy/greenhouse-gases-equivalencies-calculator-calculations-and-references
-
23. ArcGIS. USA Counties Generalized Boundaries [map]. Washington: Esri; 2022 cited 2023 Nov 17]. Available from: https://www.arcgis.com/home/item.html?id=3c164274a80748dda926a046525da610
-
24. Timmons D, Zirogiannis N, Lutz M. Location matters: Population density and carbon emissions from residential building energy use in the United States. Energy Res Soc Sci. 2016;22:137-146.[DOI]
-
25. Kuang B, Liu Z, Shi Y, Chen J. Characteristics and Influencing Factors of HVAC Energy Consumption in US Residential Buildings. In: Construction Research Congress 2024; 2024 Mar 24-26; Des Moines, United States. Washington: American Society of Civil Engineers; 2024. p. 106-116.[DOI]
-
26. Berrill P, Wilson EJH, Reyna JL, Fontanini AD, Hertwich EG. Decarbonization pathways for the residential sector in the United States. Nature Clim Change. 2022;12:712-718.[DOI]
-
27. U.S. Energy Information Administration. State Energy Data System. Washington: U.S. EIA; 2023 [cited 2023 Nov 08]. Available from: https://www.eia.gov/state/seds/
Copyright
© The Author(s) 2024. This is an Open Access article licensed under a Creative Commons Attribution 4.0 International License (https://creativecommons.org/licenses/by/4.0/), which permits unrestricted use, sharing, adaptation, distribution and reproduction in any medium or format, for any purpose, even commercially, as long as you give appropriate credit to the original author(s) and the source, provide a link to the Creative Commons license, and indicate if changes were made.
Publisher’s Note
Science Exploration remains a neutral stance on jurisdictional claims in published
maps
and institutional affiliations. The views expressed in this article are solely those
of
the author(s) and do not reflect the opinions of the Editors or the publisher.
Share And Cite


Science Exploration Style
Kuang B, Chen J. Regional difference of US residential building energy usage and carbon footprint: state-level analysis. J Build Des Environ. 2024;2:28501. https://doi.org/10.37155/2811-0730-0301-7
Tips
Copy completed.
Submit a Manuscript
Author Instructions
Cite this Article
Article Metrics
0
View
0
Download
Cited
Article Updates

Science Exploration Style
Kuang B, Chen J. Regional difference of US residential building energy usage and carbon footprint: state-level analysis. J Build Des Environ. 2024;2:28501. https://doi.org/10.37155/2811-0730-0301-7
copy
Share Link
copy