Abstract
Where previously the thermal indoor climate in a Dutch office was mainly assessed on the basis of sedentary activities, one must now also take into account activities associated with a higher metabolic rate to improve health by reducing sitting. This subject is receiving attention in the Netherlands; so in the context of the Well certification of buildings for instance. Several studies show that the deviation between the Predicted Mean Vote (PMV) and the experimental results increases as the temperature and/or the activity increases. This technical note is a proposal to modify the calculation of the PMV for metabolisms up to 2.1 met, on the warm side of the thermal sensation scale, in the same way as Fanger describes in his thesis, using research results as they are currently available in the literature, excluding the adaptive thermal comfort aspect.
Keywords
1. Introduction
The Netherlands is ‘European sitting champion’. In no other country does such a large part of the population spend so much time sitting. Namely, 26% of the population aged 15 years and older spends more than 8.5 hours sitting on an average day. In the rest of the European Union that is 11%.
Sitting too much is unhealthy. People who sit for more than eight hours a day and exercise little have a 74% greater risk of cardiovascular disease. The financial consequences for the Netherlands are now estimated at 1.2 billion euros per year. The number of people who die from it is estimated at 21,000 per year. This subject is receiving attention in the Netherlands[1,2]; so also in the context of the Well certification of buildings for instance[3]. Today, working standing or on a treadmill is used in Dutch offices as a way to improve health by reducing sitting, as for instance promoted by the Well Building Standard[3]. Where previously the thermal indoor climate in an office building was mainly assessed on the basis of sedentary activities, one must now also take into account activities associated with a higher metabolic rate. For sedentary activities the prediction of the thermal sensation, in accordance with the Predicted Mean Vote (PMV) in the Fanger model[4], standardized in (NEN-)EN-ISO-7730[5],comes closely to experimental results, when we disregard adaptive thermal comfort[6]. In that respect, the current PMV equation is accurate enough, up to temperatures of approximately 27 °C, according to Humpreys et al.[7]. For the record, in some countries, such as Japan[8], it is legally prohibited to cool office buildings lower than an indoor temperature of 28 °C during the warm period of the year[9]. Could this also be the case in Dutch offices in the near future? After all, weather extremes put pressure on major heat and energy transition solutions and possibly also on capacity limits. Peak cold demand is becoming increasingly important on hot days. Several studies show that the deviation between the PMV and the experimental results increases as the temperature and/or the activity increases[6,7,9,10]. In other words, it is time for the calculation of the PMV to be examined and modified if possible, if it is to make sense to continue to use the standardized model for sizing and assessing the indoor thermal climate in a modern office building with moderate activities. The (NEN-)EN-ISO-7730 model has its origin in 1970, when Fanger obtained his doctorate. After 54 years, the model may well be modified. This technical note is intended to spark that discussion on the basis of a proposal to modify the calculation of the PMV for a metabolism up to 2.1 met, in the same way as Fanger describes in his thesis[4] using research results as they are currently available in the literature, excluding the adaptive thermal comfort aspect. Netherland has a temperate maritime climate, with relatively mild winters, mild summers and rain all year round. Moreover most of the Dutch offices have visible mechanical cooling and mechanical ventilation, where adaptive thermal comfort hardly has any influence[11,12]. It should be emphasized here that the paper is not meant to be a research paper but a technical note. A technical note is used for a brief description of a technical problem, with the aim of informing others to subsequently examine the problem in more detail, as a field of expertise.
2. Method
The modification of the calculation of the PMV, for metabolisms up to 2.1 met, on the warm side of the thermal sensation scale, is done in the same way as Fanger describes in his thesis (1), using research results as they are currently available in the literature (2), excluding the adaptive thermal comfort aspect (3).
2.1 Predicted mean vote
The PMV equation in the (NEN-)EN-ISO-7730 model stands among the most recognized thermal comfort models. It was developed using principles of heat balance and experimental data collected in a controlled climate chamber under steady state conditions.
It predicts the average thermal sensation of a large group of healthy people on the commonly used seven points psycho-physical ASHRAE scale:
+3 = hot
+2 = warm
+1 = slightly warm
0 = neutral
-1 = slightly cool
-2 = cool
-3 = cold
The PMV index is expressed as:
PMV = TS*U
Where:
PMV = Predicted Mean Vote[-]
TS = Thermal Sensation coefficient = 0.303*Exp(-0.036M) + 0.028 [m2/W]
M = Metabolic rate [W/m2]
U = External thermal load—defined as the difference between the internal heat production and the heat loss to the actual environment—for a person at comfort skin temperature and evaporative heat loss by sweating at the actual activity level [W/m2].
The PMV equation in the model is mainly based on the research of Nevins et al.[13] (seated activity of 1 met) and the research of McNall et al.[14] (moderate activity up to 2.7 met). To date, with the exception of the research by Rohles et al.[15] and Yang et al.[10], the research by Nevins et al. and McNall et al. has not been completely updated. This means that we cannot simply replace the aforementioned datasets of Nevins et al. and McNall et al. with new and better ones, on the basis of which we could derive a new and better PMV equation, in accordance with the method described by Fanger in his thesis.
2.2 Deviation with the experiments
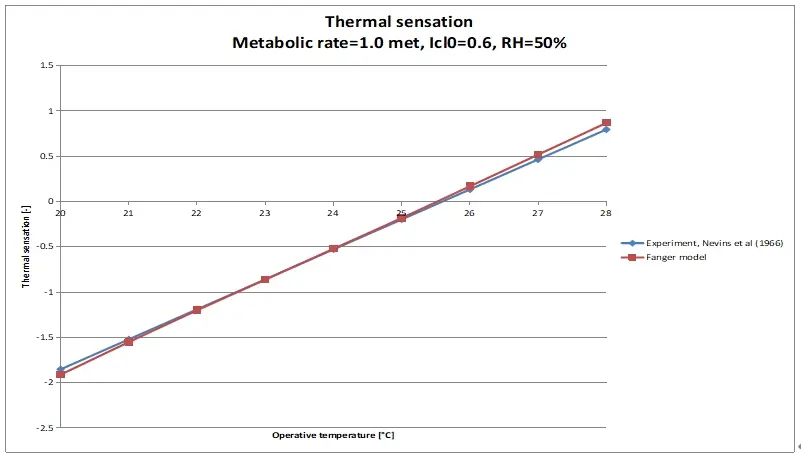
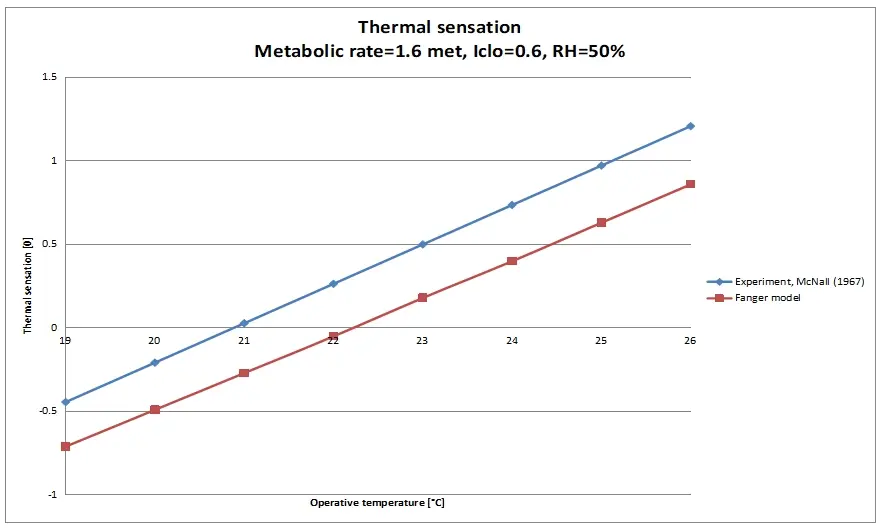
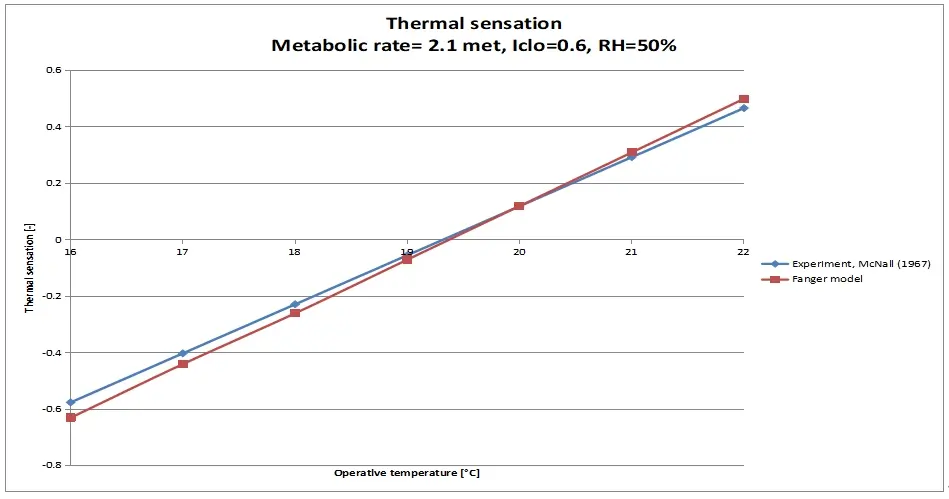
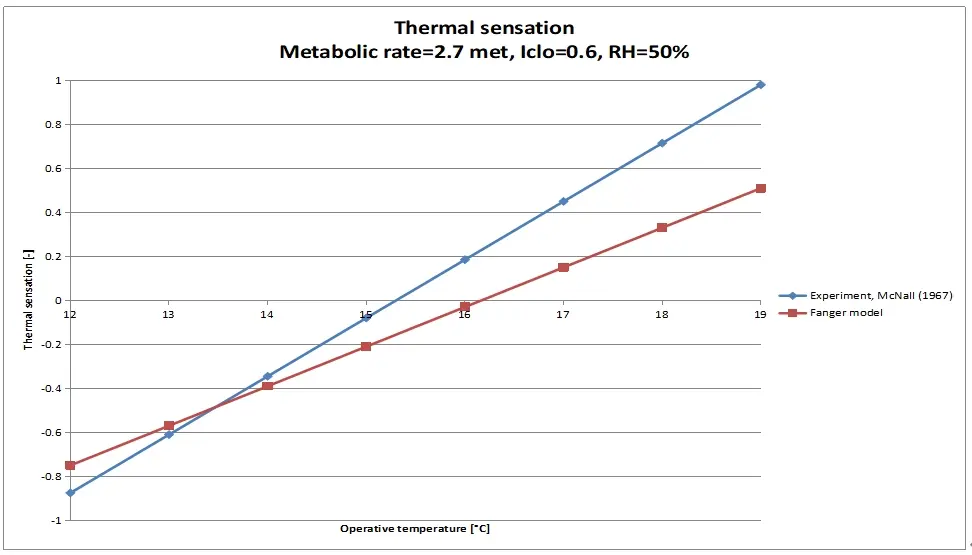
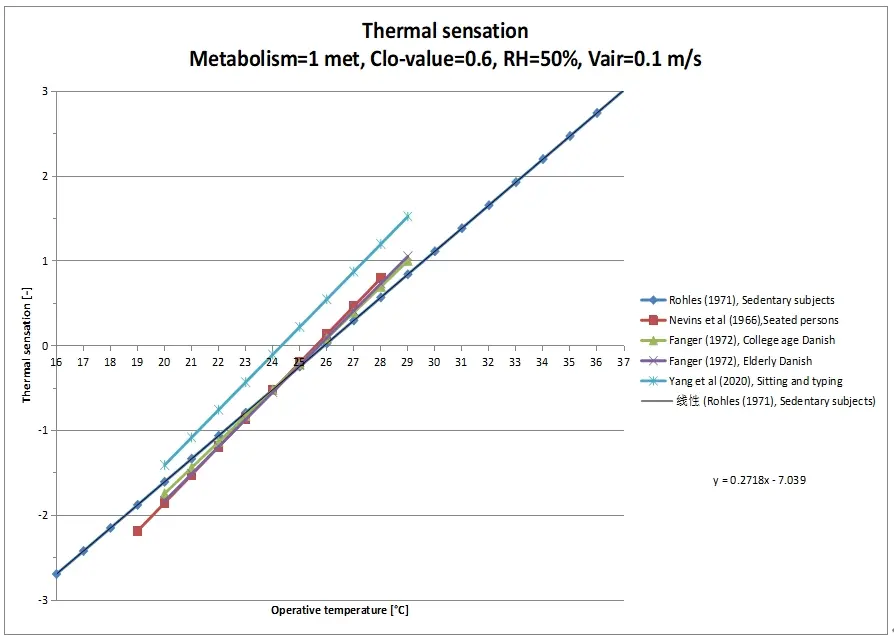
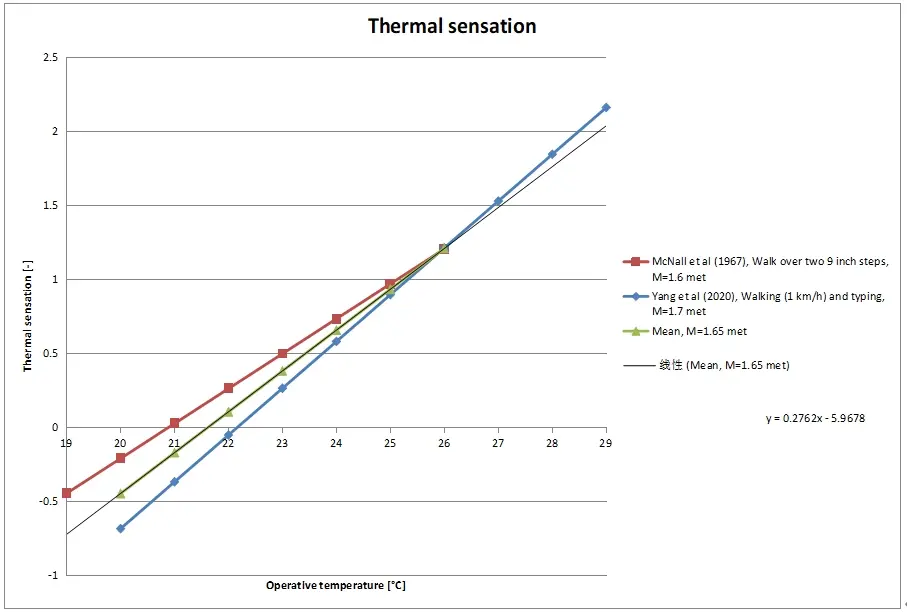
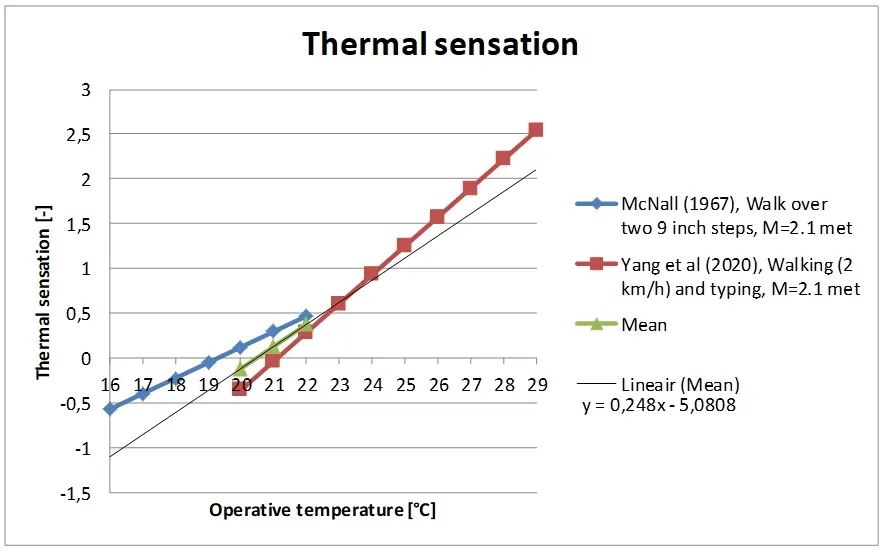
That the calculation results of the PMV deviate from reality and that the model underestimates the thermal sensation, at certain metabolic rates, can be seen at a glance when the calculation results are compared with the results of the experiments on the basis of which the PMV equation is developed (Figure 1, Figure 2, Figure 3, and Figure 4).
Therefore, the current PMV is suitable for use at a metabolic rate of approximately 1 met and 2.1 met it seems, and underestimates the thermal sensation at the other metabolic rates, on which the model is based.
2.3 Thermal sensation at sedentary activity
As for the activity with a metabolic rate of 1 met, we can be brief. In principle, the PMV equation is accurate enough in that situation (Figure 1), up to temperatures of approximately 27 °C, according to Humpreys and Nicol[7]. The only modification that could be made here is the validity of the PMV equation in a wider temperature range than it was developed for, i.e. 18.9-27.8 °C; in accordance with the experiments of Nevins et al.[13]. In practice it appears that the PMV equation is regularly used outside the aforementioned temperature limits[16-20]. Practice shows that there is apparently a need for a PMV equation with a broader field of application than currently applies to the equation. For this reason, Roelofsen et al.[21] proposed to base the PMV equation, at a metabolic rate of 1 met, not on the research of Nevins et al.[13], but on the later published research of Rohles[15]. Rohles has explored a wider temperature range, i.e. 15.6-36.7 °C instead of 18.9-27.8 °C, and surveyed more subjects, i.e. 1,600 instead of 720. Therefore, for the modification of the PMV, at a metabolic rate of 1 met, the research results of Rohles are proposed instead of the research results of Nevins et al. In Figure 5, it can be seen that the slope of the thermal sensation regression lines based on Fanger’s own experiments (each line applies to 128 test subjects) (4) are, like Rohles’ thermal sensation regression line, smaller than the slope of Nevins’ thermal sensation regression line. This is also consistent with research by Cheung et al.[22], Du et al.[23], as well as Humpreys and Nicol[7], who found that the (NEN-)EN-ISO-7730 model would calculate the PMV too high at temperatures from approximately 27 °C; ergo, outside the area considered by Nevins et al.[13]. The slope of the thermal sensation regression line of Yang et al.[10] (28 test subjects) seems to correspond to that of Nevins et al., only the position vector differs markedly from that of the other regression lines. Why this is the case cannot be immediately explained.
2.4 Thermal sensation at moderate activity
The PMV has been compared countless times in the literature with all kinds of practical situations, predominantly with sedentary activities[24]; in everyday situations always at the risk that different circumstances have also influenced the perception of the test subjects. The number of times in the literature that the PMV has been compared, under well-monitored conditions, at moderate activities is significantly less[6,9,10].
The limitations mentioned in these researches are often the same. The subjects were young, healthy undergraduates who may not be as discerning about comfort conditions as a general cross-section of the population. The studies consist of a small sample size of various age groups, ethnic backgrounds, and geographic locations. Additionally, some of the subjects were not familiar with the test equipment used (e.g. treadmill), which may have influenced subjects’ evaluations. Conducting the tests in an actual office environment for longer periods in future research is advised[10]. The research results cannot be directly compared, for example, because a different sensation scale was chosen (e.g. a nine-point scale instead of a seven-point scale)[6,9].
Finally, it turns out that the research results are at odds with each other. While one study concludes that the PMV equation underestimates the thermal sensation[9], the other study concludes that the PMV equation overestimates the thermal sensation[6], on the warm side of the thermal sensation scale, at rising metabolic rates. It should be noted that the last mentioned research[6] investigated metabolisms that were outside the scope of the Fanger model.
In short, there are not many useful studies to find in the literature comparable to the experiments of McNall et al.[14], on which the PMV is based at moderate metabolic rates. At the moment, the research of Yang et al.[10] seems to be the most appropriate. The study is comparable to the experiments of McNall et al., thoroughly performed and the results can be compared directly, without transformation, with the starting points and calculation results of the Fanger model. Unfortunately, the research was limited to 28 test subjects (i.e.14 males and 14 females) and moderate activities with a metabolic rate of 1.7 and 2.1 met instead of 1.6, 2.1 and 2.7 met, in accordance with the study of McNall et al.
A major advantage, however, is that Yang et al. has maintained a wider temperature range in their experiments (i.e. 20-29 °C at 1.7 and 2.1 met), in comparison with the study of McNall et al., especially on the warm side of the thermal sensation scale. The temperature range maintained by McNall et al. is quite limited, at each of the metabolic rates (i.e. 12.2-18.9 °C at 2.7 met; 15.6 -22.2 °C at 2.1 met; 18.9-25.6 °C at 1.6 met). In that aspect, the study by Yang et al. is a good complement to the study by McNall et al.
Yang et al.’s study used a variable walking speed treadmill in combination with reading and typing, corresponding to a standing activity as may occur in a modern office environment, in order to reduce sitting. McNall et al. used a modified step test for each activity level, a stand walk cycle was developed by varying the stand period and using a five minutes walk over two nine inch steps; an activity that is not easily expected in a workplace in a modern office environment.
It is suggested that 1.6, 1.7 and 2.1 met be based on both research results. For a metabolic rate of 2.7 met, the study by McNall et al. is used. There is currently no new comparable research available for metabolisms above 2.1 met. By making use of the research of McNall et al. and Yang et al. in modifying the PMV equation, the temperature range within which the model can be reliably applied increases, especially on the warm side of the thermal sensation scale, as can be seen in the Figure 6 and Figure 7.
The PMV underestimation, on the warm side of the thermal sensation scale, at a metabolic rate of 2.3 met, as first demonstrated by Jones et al.[9], is also demonstrated by Yang et al.[7] (Figure 3 and Figure 7). Here the ISO-7730 model could be improved, it turns out.
2.5 Convective heat transfer as a function of metabolic rate
In the (NEN-)EN-ISO-7730 model, the convective heat transfer coefficient is not a function of metabolic rate, as is the case in the Gagge model[25]. This is relevant for metabolic rates higher than 1 met. For this reason, it is proposed to use the formula as used in the Gagge model, in addition to the formulas already in use in the (NEN-)EN-ISO-7730 model, namely:
- CHC=5.66*(M-0.85)^0.39
In this is:
- CHC = Convective heat transfer coefficient [W/m2·K]
- M = Metabolic rate [met].
3. Result
3.1 Thermal sensation as a function of external load
Table 1 below shows, per metabolic rate, the equations of the thermal sensation as a function of the external load as well as the temperature range within which the equation applies, in accordance with the method described in Fanger’s thesis[4].
| Model | Metabolic Rate | Reference | Number of subjects | Equation | Applicable temperature range | Applicable PMVrange |
| [met] | [-] | [-] | [°C] | [-] | ||
| Current PMV | 1.0 | [13] | 720 | Y = 0.0623.U - 0.0303 | 18.9/27.8 | -2.1/1.0 |
| 1.6 | [14] | 420 | Y = 0.0303.U + 0.239 | 18.9/25.6 | -0.3/1.2 | |
| 2.1 | [14] | 420 | Y = 0.0295U - 0.0029 | 15.6/22.2 | -0.7/0.5 | |
| 2.7 | [14] | 420 | Y = 0.0435.U + 0.071 | 12.2/18.9 | -0.8/1.0 | |
| Total test subjects | 1140 | |||||
| ModifiedPMV | 1.0 | [15] | 1600 | Y = 0.0501.U - 0.1239 | 15.6/36.7 | -2.8/2.9 |
| 1.65 | [10,14] | 448 | Y = 0.0481.U + 0.037 | 18.9/29.0 | -0.7/2.1 | |
| 2.1 | [10,14] | 448 | Y = 0.0407.U + 0.2711 | 15.6/29.0 | -1.2/2.1 | |
| 2.7 | [14] | 420 | Y = 0.0429.U + 0.2315 | 12.2/18.9 | -0.8/1.0 | |
| Total test subjects | 2048 | |||||
Y: Thermal sensation; U: external load [W/m2]; PMV: predicted mean vote.
Table 1 shows that the slope in the Thermal sensation equations (Y) for the PMV model differ more from each other than is the case in the modified model. This means that in the modified PMV model the subjects have more similar sensitivity to changes in the external load at the metabolic rates than in the current PMV model. Contrary to the study by Yang et al., the area on the warm side of the thermal sensation scale, up to a PMV of about 2, has not actually been extensively investigated by McNall et al. It is therefore obvious to use the results of Yang et al. to supplement the research by McNall et al.
Intermediate values for the thermal sensation (Y), as a function of the external load (U) can be determined by means of linear interpolation, between the metabolic rates.
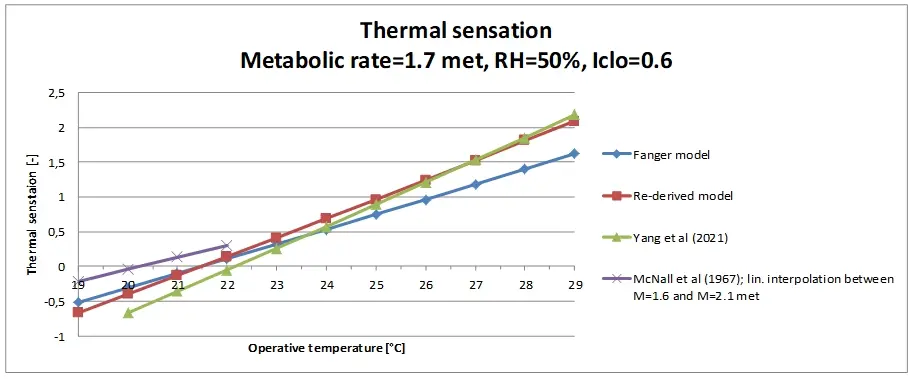
To get an idea of how the modified model relates to the current (NEN-)EN-ISO 7730/Fanger model and the experimental results, a variant calculation was made for the situation with a metabolic rate of 1.7 met. The calculation results are graphically presented in Figure 8.
As can be seen in Figure 8, for moderate activities, the modified PMV model is a midway between the experimental results of McNall et al. and Yang et al. in the region where both experiments overlap, in operative temperature. As a result, especially on the discomfort warm side of the thermal sensation scale (PMV > 0.5), the temperature range not really considered by McNall et al., the modified PMV model follows Yang’s experimental results more than is the case with the current PMV equation in the (NEN-)EN-ISO-7730 model. On the neutral and cold side of the thermal sensation scale, the results still correspond well with those of the (NEN-)EN-ISO-7730 model.
3.2 Discrepancy calculation results (NEN-)EN-ISO-7730 model with the experimental results
The discrepancy between the calculation results of the PMV equation in the (NEN-)EN-ISO-7730 model and the experimental results of McNall et al. (Figure 2, Figure 3 and Figure 4) is caused by the way in which the thermal sensation coefficient (TS = 0.303*Exp(-0.036M) + 0.028 [m2/W]) in the PMV equation is derived. Two assumptions are made in the derivation, namely:
1.If the external load (L) is zero then the thermal sensation is zero.
2.The slope in the equation of the thermal sensation as a function of the external load decreases monotonically with increasing metabolic rate.
Both assumptions are not really supported by the experimental results (Table 1). The assumptions are attractive to introduce, as it allows an analytical solution of the PMV equation, only introducing a deviation from the experimental results (Figure 2, Figure 3 and Figure 4). Since the use of the model requires a computer anyway, it is obvious to omit the analytical solution and to perform the interpolation, between the modified equations for the thermal sensation as a function of the external load, numerically. In this way, the discrepancy between the calculation results and the experimental results (Figure 2, Figure 3 and Figure 4) has at least disappeared.
4. Discussion
Nowadays, working standing or on a treadmill is used in Dutch offices as a way to improve health by reducing sitting, as, for instance, promoted by the Well Building Standard. Where previously the thermal indoor climate in an office was mainly assessed on the basis of sedentary activities, activities that are associated with a higher metabolism must now also be taken into account. At a metabolic rate of 1 met, the current PMV equation is accurate enough, up to temperatures of approximately 27 °C. In the Netherlands however, the indoor climate in office buildings is currently designed based on temperature exceedance calculations, where a temperature above 27 °C is also permitted. Besides that the Cool Biz campaign, as conducted in Japan, could also take place in the Netherlands; where an indoor temperature lower than 28 °C, achieved by mechanical cooling, is not permitted, for example during a heat wave. After all, weather extremes put pressure on major heat and energy transition solutions and possibly also on capacity limits. Peak cold demand is becoming increasingly important on hot days. In that situation one must be fully aware that the (NEN-)EN-ISO-7730 model for evaluating the thermal indoor climate appears to estimate the thermal sensation too low, on the warm side of the seven points psycho-physical ASHRAE scale and higher metabolisms than 1 met.
According to Fanger’s thesis the (NEN-)EN-ISO 7730 model is mainly tailored to sedentary activity, because most research data was available for this. The model is reliable, especially in the case of higher metabolisms, in the neutral area (- 0.5 < PMV < 0.5). Particularly on the warm side, deviations appear to occur compared to other more extensive research into ambient temperature. This technical note has attempted to overcome the above mentioned shortcomings by using existing research on the warm side of the seven point psycho-physical ASHRAE scale and the same methodology as described in Fanger’s thesis.
5. Conclusion
A proposal has been made to indicate how the (NEN-)EN-ISO-7730 model, for sedentary and moderate metabolisms, could be modified so that the model is more applicable in a wider temperature range; especially on the warm side of the thermal sensation scale, excluding the adaptive thermal comfort aspect.
With this modified PMV model (the bolded equations in Table 1), the applicability, up to a metabolism of 2.1, is increased and substantiated with more test subjects (2,048 test subjects) than is the case with the current PMV equation (1,396 test subjects), as shown in (NEN-)EN-ISO 7730, thanks to the research of Rohles and Yang et al. (Table 1). In order to be able to include the influence of metabolism in the calculation of the convective heat transfer coefficient, a formula in the Gagge model was used, in addition to the heat transfer equations already used in the (NEN-)EN-ISO-7730 model (please note: the largest applies). Since the use of the model requires a computer anyway, it is obvious to omit the analytical solution of the thermal sensation coefficient in the (NEN-)EN-ISO-7730 model (Namely: TS = 0.303*Exp(-0.036M) + 0.028 [m2/W]) and to perform the interpolation numerically, between the modified equations for the thermal sensation as a function of the external load, also in view of the almost equal slope of the lines.
In this way, the discrepancy between the calculation results and the experimental results (Figure 2, Figure 3 and Figure 4) has at least disappeared. For moderate activities, the modified PMV model is a midway between the experimental results of McNall et al. and Yang et al. in the region where both experiments overlap, in operative temperature. As a result, especially on the discomfort warm side of the thermal sensation scale (PMV > 0.5), the temperature range not really considered by McNall et al., the modified PMV model follows Yang’s experimental results more than is the case with the current PMV equation in the (NEN-)EN-ISO-7730 model. On the neutral and cold side of the thermal sensation scale, the results still correspond well with those of the (NEN-)EN-ISO-7730 model. It is recommended to extend future experiments, like Yang’s et al., with regard to the:
• number of test subjects with a metabolic rate larger than 1 met.
• temperature range.
Authors contribution
All authors contributed equally to this work.
Conflicts of interest
The authors declare there is no conflicts of interest.
Ethical approval
Not applicable.
Consent to participate
Not applicable.
Consent to publication
Not applicable.
Availability of data and material
Not applicable.
Funding
None.
Copyright
© The Author(s) 2024.
References
-
1. Werk gezondheid. The Netherlands leads Europe in sitting [Internet]. TNO; 2024. Available from: https://www.tno.nl/nl/newsroom/2024/02/nederland-europees-kampioen-zitten/
-
2. Discover [Internet]. Netherlands: “Sitting culture” leads to premature death and costs €1.2 billion per year in healthcare; 2024. Available from: https://nltimes.nl/2024/03/17/sitting-culture-leads-premature-death-costs-eu12-billion-per-year-healthcare
-
3. International Well Building Institute. Well v2, Q4 2021 Features/Movement; 2021. Available from: https://v2.wellcertified.com/en/wellv2/overview
-
4. Fanger PO. Thermal comfort: analysis and applications in environmental engineering. Copenhagen: Danish Technical Press; 1970.
-
5. ISO. Ergonomics of the thermal environment-Analytical determination and interpretation of thermal comfort using calculation of the PMV and PPD indices and local thermal comfort criteria. Geneva: ISO; 2005.
-
6. Wang H, Hu S. Experimental study on thermal sensation of people in moderate activities. Build Environ. 2016;100:127-134.[DOI]
-
7. Humphreys MA, Nicol JF. The validity of ISO-PMV for predicting comfort votes in every-day thermal environments. Energy Build. 2002;34(6):667-684.[DOI]
-
8. Wikipedia. Cool Biz campaign [Internet]. 2023. Available from: https://en.wikipedia.org/wiki/Cool_Biz_campaign
-
9. Jones BW, Hsieh K, Hashinaga M. The effect of air velocity on thermal comfort at moderate activity levels. Ashrae Trans. 1986(92):761-769. Available from: https://www.aivc.org/sites/default/files/airbase_2025.pdf
-
10. Yang L, Gao S, Zhao S, Zhang H, Arens E, Zhai Y. Thermal comfort and physiological responses with standing and treadmill workstations in summer. Build Environ. 2020;185:107238.[DOI]
-
11. de Dear R, Brager GS. Developing an adaptive model of thermal comfort and preference. UC Berkeley. 1998. Available from: https://escholarship.org/uc/item/4qq2p9c6
-
12. Hensen JLM, Centnerova L. Is adaptieve thermische behaaglijkheid relevant voor de Nederlandse situatie? VV: Verwarm Vent. 2002;59(6):491-499. Available from: https://research.tue.nl/en/publications/is-adaptieve-thermische-behaaglijkheid-relevant-voor-de-nederland
-
13. Nevins RG. Temperature-humidity chart for themal comfort of seated persons. Ashrae Trans. 1966;72: 283-291. Available from: https://www.semanticscholar.org/paper/Temperature-Humidity-Chart-for-Themal-Comfort-of-Nevins/23de933c1d1b85494a5880ffbeccdd5bf90e5c35
-
14. McNall PE, Jaax J, Rohles FH, Nevins RG, Springer W. Thermal comfort (Thermally neutral) conditions for three levels of activity. ASHRAE Trans. 1967;73:1-14.
-
15. Rohles FH Jr. Thermal sensations of sedentary man in moderate temperatures. Human Factors. 1971;13(6):553-560.[DOI]
-
16. Mohamed S, Srinavin K. Thermal environment effects on construction workers’ productivity. Work Study. 2002;51(6):297-302.[DOI]
-
17. Srinavin K, Mohamed S. Thermal environment and construction workers’ productivity: some evidence from Thailand. Build Environ. 2003;38(2):339-345.[DOI]
-
18. Feriadi H, Wong NH. Thermal comfort for naturally ventilated houses in Indonesia. Energy Build. 2004;36(7):614-626.[DOI]
-
19. Backes D, Trenktrog M, Eckstein L. Smart heating panels to increase thermal comfort and efficiency. Work. 2021;68(s1):S29-S35.[DOI]
-
20. Zhang S, Lin Z. Predicted Mean Vote with skin wettedness from standard effective temperature model. Build Environ. 2021;187:107412.[DOI]
-
21. Roelofsen P, Jansen K, Vink P. A larger statistical basis and a wider application area of the PMV equation in the Fanger model: application area of the PMV equation. Intell Build Int. 2022;14(4):517-524.[DOI]
-
22. Cheung T, Schiavon S, Parkinson T, Li P, Brager G. Analysis of the accuracy on PMV-PPD model using the ASHRAE Global Thermal Comfort Database II. Build Environ. 2019;153:205-217.[DOI]
-
23. Du H, Lian Z, Lai D, Duanmu L, Zhai Y, Cao B, et al. Evaluation of the accuracy of PMV and its several revised models using the Chinese thermal comfort Database. Energy Build. 2022;271:112334.[DOI]
-
24. van Hoof J. Forty years of Fanger’s model of thermal comfort: comfort for all?. Indoor Air. 2008;18(3):182-201.[DOI]
-
25. Gagge AP, Fobelets AP, Berglund LG. A standard predictive index of human response to the thermal environment. Ashrae Trans 1986;92:709-731. Available from: https://www.semanticscholar.org/paper/A-standard-predictive-index-of-human-response-to-Gagge-Fobelets/af4d93cb49790780a30c758d7af92dc8daa72b9e
Copyright
© The Author(s) 2024. This is an Open Access article licensed under a Creative Commons Attribution 4.0 International License (https://creativecommons.org/licenses/by/4.0/), which permits unrestricted use, sharing, adaptation, distribution and reproduction in any medium or format, for any purpose, even commercially, as long as you give appropriate credit to the original author(s) and the source, provide a link to the Creative Commons license, and indicate if changes were made.
Publisher’s Note
Share And Cite


