Bond strength between receptor binding domain of spike protein and human angiotensin converting enzyme-2 using machine learning
Abdulmateen Adebiyi
1
,
Puja Adhikari
2
,
Praveen Rao
1

,
Wai-Yim Ching
2,*
*Correspondence to:
Wai-Yim Ching, Department of Physics and Astronomy, University of Missouri-Kansas City, Kansas City MO 64110, USA.
E-mail: chingw@umkc.edu
BME Horiz. 2024;2:110. 10.37155/2972-449X-vol2(1)-110
Received: April 16, 2024Accepted: June 07, 2024Published: June 15, 2024
Abstract
The spike protein of SARS-CoV-2 plays an important role in binding, fusion, and host entry. In this study, we have predicted interatomic bond strength between receptor binding domain (RBD) and angiotensin converting enzyme-2 (ACE2) using machine learning (ML), that matches with expensive ab initio calculation result. We collected bond order result from ab initio calculations. We selected a total of 18 variables such as bond type, bond length, elements and their coordinates, and others, to train ML models. We then trained five well-known regression models, namely, Decision Tree regression, KNN Regression, XGBoost, Lasso Regression, and Ridge Regression. We tested these models on two different datasets, namely, Wild type (WT) and Omicron variant (OV). In the first setting, we used 90% of each dataset for training and 10% for testing to predict the bond order. XGBoost model outperformed all the other models in the prediction of the WT dataset. It achieved an R2 Score of 0.997. XGBoost also outperformed all the other models with an R2 score of 0.9998 in the prediction of the OV dataset. In the second setting, we trained all the models on the WT (or OV) dataset and predicted the bond order on the OV (or WT) dataset. Interestingly, Decision Tree outperformed all the other models in both cases. It achieved an R2 score of 0.997.
Keywords
Machine learning, spike protein, RBD-ACE2 interface, interatomic bonding, Ab initio calculations, XGBoost, decision trees, linear regression
1. Introduction
The COVID-19 pandemic started in November 2019, taking millions of lives globally. The severe acute respiratory syndrome coronavirus-2 (SARS-CoV-2) has several variants of concerns (VOC) such as Alpha[1], Beta[2], Delta[3], Gamma[4], and Omicron[5] and variants of interest (VOI) such as Eta[6], Iota[7], Kappa[8], Lambda[9], and Mu[10]. These VOC and VOI have shown the nature of rapidly mutating SARS-CoV-2. With overwhelming effort of the scientific community, the development of vaccines has saved billions of lives. In addition to ongoing research in medicine and biology, scientists from various discipline have collaborated in an effort to enhance prepardness of such a situation in the future.
SARS-CoV-2 is composed of four proteins: spike (S), envelope (E), membrane (M), and nucleocapsid (N) proteins (Figure 1a). Among these four proteins, spike protein (S-protein) plays an important role and initiates the infection by binding with human angiotensin converting enzyme 2 (ACE2). S-protein has two subunits S1 and S2. S1 consists of signal peptide, n-terminal domain, receptor binding domain (RBD), subdomain 1, and subdomain 2. Similary, S2 consists of fusion peptide, heptad repeat 1, central helix, connecting domain, heptad repeat 2, transmembrane domain, and cytoplasmic tail. Among these domains of S-protein, RBD binds with ACE2 in Figure 1b.
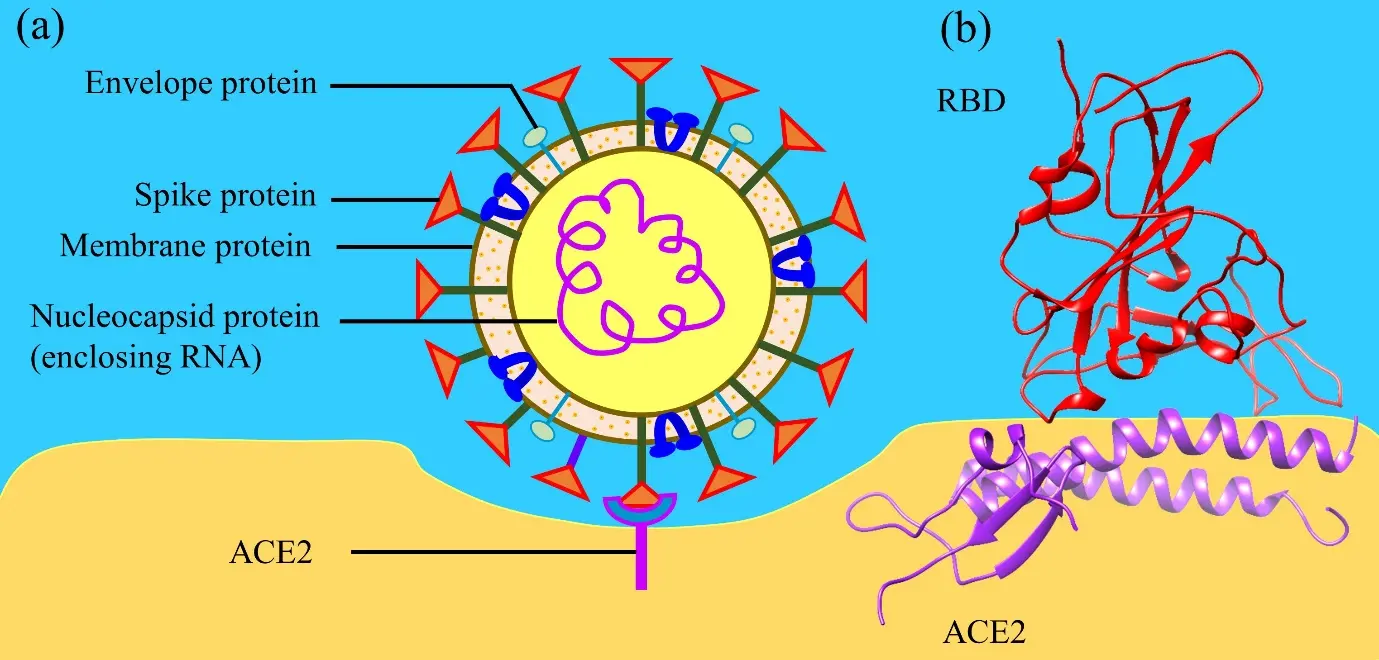
Figure 1. (a) Structure of SARS-CoV-2, highlighting its four key proteins and their interaction with ACE2; (b) Ribbon structure of interface between RBD and ACE2. ACE2: angiotensin converting enzyme 2; RBD: receptor binding domain.
There has been a lot of research including experimental[11-13] and computational[14-18] study focused on RBD-ACE2 interaction. In the computational research, most of the calculations are performed utilizing molecular dynamics[15,19-21], with a few employing ab initio method. Ab initio calculations are known for their accuracy however, they are difficult and expensive especially for such large and complex biomolecules. In our past studies, we have conducted ab initio calculations for around 4,999 atoms[18], which is very large but not sufficient to calculate biomolecules with several thousands of atoms. Hence, we have utilized ab initio methods on such biomolecules using the divide-and-conquer strategy. Using this strategy, we divide the complex biomolecules in small sections and calculate their properties such as electronic structure, interatomic bonding, and partial charge. Among these properties interatomic bonding is a crucial one as it reflects the types of bonds involved, and their corresponding strength. Investigating the interatomic bonding within the RBD-ACE2 interface identifies key interacting amino acids. This information can be used to target specific amino acids. Given that RBD-ACE2 is the initial point of contact between the SARS-CoV-2 and human cells, the strategic targeting of these interacting amino acids can disrupt their interaction and stop virus attack. However, ab initio calculations can be costly. Therefore, finding ways to achieve comparable accuracy at a reduced expense is essential, and this is where machine learning (ML) steps in.
ML represents a sub-field within artificial intelligence (AI), employing algorithms to discern significant patterns and correlations within complex datasets, facilitating the prediction of specific properties[22]. Using ML, computers can excel in several tasks that humans can perform using their knowledge and wisdom. ML delves into how computer system mimic human learning processes and explores methods for self-improvement to acquire new knowledge[23]. Widely utilized across diverse domains such as healthcare, finance, marketing, and telecommunications, ML models have become indispensable in today’s real-world applications[23].
ML models have also been applied in physics and chemistry. For instance, Hansen et al. applied ML techniques to predict molecular properties[24]. The precise and efficient prediction of such properties is crucial for rational computer design in chemical and pharmaceutical industries. Du et al. proposed a method for learning the relativistic continuum mass table by using the kernel ridge regression[25]. They used it to learn the nuclear mass table obtained by the relativistic continuum Hartree-Boogoliubov theory. Recently, Adhikari et al. suggested the use of ML techniques for predicting potential unknown COVID-19 mutations[26].
In this study, we employed interatomic bonding result obtained through ab initio calculations and tested ML to predict these already obtained bonding outcomes. Our objective is to replicate results obtained via ab initio methods, with the eventual aim of overcoming the cost limitations associated with such calculations.
2. Method
2.1 Modelling RBD-ACE2 interface
The interface structures were extracted from the PDB ID 6M0J[13] for the WT and PDB ID 7WBP[27] for the OV. Amino acids within the sequence S19-I88 and G319-T365 were incorporated from ACE2, while the sequence T333-G526 was included from the RBD. The entire model consists of 311 amino acids. Hydrogen atoms were added using the Leap module with ff14SB force field in the AMBER package[28] resulting into a total of 4817 and 4873 atoms for WT and OV, respectively. The RBD-ACE2 of the OV contains 15 mutations.
2.2 Ab initio packages
For the ab initio calculations, we have used two density functional theory packages–Vienna ab initio simulation package (VASP)[29] and orthogonalized linear combination of atomic orbital[30]. VASP was used for interface model optimization. In VASP, we used projector augmented wave[31,32] method with Perdew-Burke-Ernzerhof[31] exchange correlation functional within the generalized gradient approximation. We used the energy cut off 500 eV with electronic convergence of 10-4 eV, force convergence for ionic relaxation to -10-2 eV, and a single kpoint.
The optimized structure from VASP is used as an input for the OLCAO package. The combination of VASP with OLCAO is very effective for complex biomolecules[14,16,18,30,33,34]. OLCAO uses atomic orbitals for basis function expansion. It is used to calculate the interatomic bonding in terms of bond order (BO). BO determines the strength of the bond. OLCAO uses Mulliken’s population analysis to calculate BO. BO is the overlap population ραβ between pair of atoms (α, β), defined as:
where Siα,jβ are the overlap integrals between the ith orbital in αth atom and the orbital in atom, and are the eigen vector coefficients of the band, jth orbital in the atom. For the ab initio calculations using OLCAO method, the total wall clock time and CPU time utilized for RBD-ACE2 OV are approximately 617.89 hours and 617.75 hours, respectively, resulting in a CPU efficiency of 99.98%. For RBD-ACE2 WT, the total wall clock time and CPU time are approximately 619.07 hours, and 617.16 hours respectively, with a CPU efficiency of 99.69%. The dataset for WT and OV obtained from OLCAO were further used as described in Section 2.3 below.
2.3 Dataset
The BO result obtained from OLCAO calculation served as the source data. The BO prediction was conducted on both interfaces: RBD-ACE2 WT and RBD-ACE2 OV datasets. Note that the RDB-ACE2 WT and RDB-ACE2 OV datasets contained 25,356 rows and 25, 753 rows, respectively. Each dataset had 21 variables. The datasets contained the X, Y and Z coordinates of the bond between the Atom 1 and Atom 2. The variables in the datasets are briefly explained in the table below. We used these datasets to predict the bond strength also known as the BO (Table 1).
Table 1. Brief description of the variables.
| # | Variable | Brief Description |
| 1 | Bond | Shows the bond |
| 2 | BL | Shows the bond length |
| 3 | Ele1 | Element Participating in the bond |
| 4 | X1 | Position Coordinates |
| 5 | Y1 | Position Coordinates |
| 6 | Z1 | Position Coordinates |
| 7 | Ele2 | Element Participating in the bond |
| 8 | X2 | Position Coordinates |
| 9 | Y2 | Position Coordinates |
| 10 | Z2 | Position Coordinates |
| 11 | PDBele1 | Identifier for PDB |
| 12 | AA1 | Amino acid participating in the bond |
| 13 | SeqNo1 | Sequence number of the amino acid participating in the bond |
| 14 | ChainN1 | Chain of the amino acids |
| 15 | PDBele2 | Identifier for PDB |
| 16 | AA2 | Amino acid participating in the bond |
| 17 | SeqNo2 | Sequence number of the amino acid participating in the bond |
| 18 | ChainN2 | Chain of the amino acids |
PDB: Python Debugger.
2.4 Data pre-processing
In the original dataset, the total number of variables were 21. We dropped Atom1 and Atom2 as they are both identifiers of the OLCAO package. Eighteen of them were used for training the models, and BO was the target variable for prediction. We used the variables bond, bond length, Ele1, x1, y1, z1, PDBele1, AA1, SeqNo1, ChainN1, Ele2, x2, y2, z2, PDBele2, AA2, SeqNo2 and ChainN2 as input features for our regression models. Label encoding was used to convert the categorical variables to numerical ones before passing them to the ML models. Label encoding is an efficient way to transform categorical data to numerical ones. It is simple, efficient and helps with memory efficiency.
2.5 Machine learning
In our work, five well-known ML models were used for the BO prediction. The models were XGBoost Regression, K-Nearest Neighbor (KNN) Regression, Decision Trees Regression, Lasso Regression, and Ridge Regression. The overall approach of ML for this work is shown in Figure 2. The ML models ran on average for 4 hours using grid-search hyperparameter tuning and 10-fold cross validation. These ML models have performed well on different datasets and are commonly used in research projects. XGBoost has outperformed so many models in literature via extreme gradient boosting[35]. Linear regression is used for its simplicity before using other complex models. Decision Trees are often used for many problems because of its interpretability. It can learn complex relationship between features. Next, we briefly describe each model and its unique characteristics for learning on data.
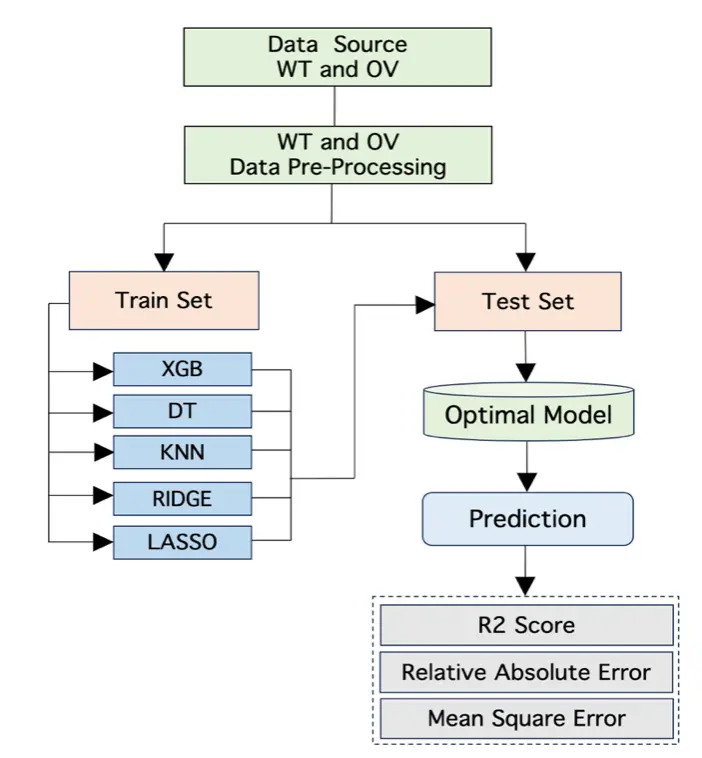
Figure 2. Overall approach for BO prediction. WT: wild type; OV: omicron variant; XGB: extreme gradient boosting; DT: decision tree; KNN: K-Nearest Neighbor; BO: bayesian optimization.
Lasso Regression: It is a type of linear regression that combines both linear regression and lasso hyperparameter tuning. It helps to pick the best regression model by discarding less relevant features[36]. The predicted BO is calculated as the product of the input features with the learned coefficients, and then adding the regularization term to penalize the absolute values of the coefficient.
Ridge Regression: It is a type of linear regression that uses Ridge Optimization and includes a regularization term to the regression function. The term penalizes the sum of the squared coefficients[37]. The predicted BO is calculated by multiplying the input features with the learned coefficients and then adding the regularization term that penalizes the squared magnitudes of the coefficients.
Decision Tree Regression: This regression type uses a tree-like model of decisions to predict the target value. The tree structure has the root node, decision nodes, and leaf nodes. The root node is the initial node of the decision tree. The predicted BO value is computed as the average numerical value for the training data that is stored in the selected leaf node. The optimal structure for the tree is learned during the training process.
KNN Regression: It is a supervised learning regression model in which the model predicts a continuous target variable based on the average or weighted average of the values of its K- Nearest Neighbors. The predicted BO is computed by estimating the weighted average of the target values of the K-Nearest Neighbors.
XGBoost: It is a machine learning models that combines decision trees, ensemble learning, and gradient boosting. It is scalable and can be used to train on large datasets. The predicted BO is the sum of individual tree predictions multiplied by the learning rate, which is a hyperparameter used during training. Hyperparameters are the type of parameters that are used to control and manage an ML model during training.
In our experiments, we used the grid search approach to identify the best hyperparameters for the models. We also performed a 10-fold cross validation on our datasets. Cross validation is a technique that is used to evaluate a model by dividing the dataset into two segments[38,39]. The first segment is used to train the model, and the other segment is used to test the model performance[39]. This process is repeated a number of times so that every data sample is used in the test set leading to a more robust evaluation of the model.
2.6 Bond order regression
Before the regression process, we first pre-processed our datasets so that it can be easily passed to the ML models. We converted the data that are not in numerical form to numerical form using label encoding. We then split our datasets into the training set and the testing set. We used four different settings in our work:
A. Train on 90% of the RBD-ACE2 WT dataset and evaluate the models on the remaining 10% of the dataset to predict the BO.
B. Train on 90% of the RBD-ACE2 OV dataset and evaluate the models on the remaining 10% of the dataset to predict the BO.
C. Train on the entire RBD-ACE2 WT dataset and evaluate the models on the entire RBD-ACE2 OV dataset to predict the BO.
D. Train on the entire RBD-ACE2 OV dataset and evaluate the models on the entire RBD-ACE2 WT dataset to predict the BO.
3. Result
In this section, we present the performance of the aforementioned ML models on the RBD-ACE2 WT and RBD-ACE2 OV datasets. We implemented all the models in Python using Scikit Learn[40], Numpy[41], Matplotlib, and XGBoost libraries[42]. We used the best model after the hyperparameter tuning for each approach for the BO prediction.
3.1 Performance metrics
Next, we will discuss the different performance metrics that were used in this work to evaluate our models. Our regression models aimed to predict the BO in the chosen datasets. We evaluated the models based on the R2 Score, Root Mean Square Error (RMSE), and the Relative Absolute Error metrics (RAE), which are explained below.
R2: This metric is referred to as the goodness of fit or the coefficient of determination. It shows how the regression line approximates the actual data. The values are between 0 to 1 with 1 being the value when the model fits the data perfectly.
RAE: The RAE is the ratio of the mean error (residuals) to the errors by the naïve model.
RMSE: This is calculated by computing the square root of the Mean Squared Error (MSE). MSE is the average of the squared differences between the predicted and expected target values. If all the predicted BO values are the same as the true BO values, RSME will be 0. RMSE is a good metric for regression analysis because it penalizes large error. The RMSE measures the standard deviation of the errors when the regression model makes a prediction.
First, we present the results for Settings (A) and (B). Table 2 shows the performance metrics of the various ML models for Setting (A). XGBoost outperformed all the other models. It achieved an R2 score of 0.997, RAE of 0.029, and RMSE of 0.008. Table 3 shows the performance metrics of the various ML models for Setting (B). Once again, XGBoost outperformed other models and achieved an R2 score of 0.998, RAE of 0.028, and RMSE of 0.006.
Table 2. Performance metrics of the ML models for Setting (A) (best value is shown in bold).
| Models | R2 | RAE | RMSE |
| XGBoost | 0.997 | 0.029 | 0.008 |
| Decision Trees | 0.996 | 0.025 | 0.009 |
| KNN | 0.320 | 0.800 | 0.130 |
| Ridge Regression | 0.830 | 0.392 | 0.065 |
| Lasso Regression | 0.442 | 0.696 | 0.118 |
ML: machine learning; RAE: relative absolute error; RMSE: root mean square error; KNN: K-Nearest Neighbor.
Table 3. Performance metrics of the ML models for Setting (B) (best value is shown in bold).
| Models | R2 | RAE | RMSE |
| XGBoost | 0.998 | 0.028 | 0.006 |
| Decision Trees | 0.996 | 0.025 | 0.009 |
| KNN | 0.339 | 0.726 | 0.126 |
| Ridge Regression | 0.826 | 0.405 | 0.065 |
| Lasso Regression | 0.444 | 0.712 | 0.116 |
ML: machine learning; RAE: relative absolute error metrics; RMSE: root mean square error; KNN: K-Nearest Neighbor.
Next, we present the results for Settings (C) and (D). Table 4 and Table 5 show the performance results of our various ML models for Setting (C) and Setting (D), respectively. In both cases, Decision Trees outperformed other models.
Table 4. Performance metrics of the ML models for Setting (C) (best value is shown in bold).
| Models | R2 | RAE | RMSE |
| XGBoost | 0.995 | 0.049 | 0.011 |
| Decision Tress | 0.997 | 0.028 | 0.008 |
| KNN | 0.386 | 0.708 | 0.121 |
| Ridge Regression | 0.824 | 0.406 | 0.065 |
| Lasso Regression | 0.386 | 0.710 | 0.115 |
ML: machine learning; RAE: relative absolute error metrics; RMSE: root mean square error; KNN: K-Nearest Neighbor.
Table 5. Performance metrics of the ML models for Setting (D) (best value is shown in bold).
| Models | R2 | RAE | RMSE |
| XGBoost | 0.991 | 0.064 | 0.015 |
| Decision Tress | 0.997 | 0.024 | 0.007 |
| KNN | 0.385 | 0.702 | 0.121 |
| Ridge Regression | 0.822 | 0.410 | 0.065 |
| Lasso Regression | 0.445 | 0.712 | 0.115 |
ML: machine learning; RAE: relative absolute error metrics; RMSE: root mean square error; KNN: K-Nearest Neighbor.
We additionally plotted the R2 values for the various models in Settings (A) and (B). These are illustrated in Figure 3 and Figure 4, where the x-axis represents the actual BO and the y-axis denotes the predicted BO. For models that achieved high R2 score, we observed that the predictions were clustered around the 45-degree line (shown as a dotted line). Decision Trees and XGBoost models performed very well. For models with low R2 score, we observed that the predicted values were scattered differently. Clearly, the linear regression models were unable to capture the underlying distribution of the BO values. KNN regression also performed poorly on the tested datasets. Similar trends were observed for Settings (C) and (D) where Decision Trees and XGBoost achieved high R2 scores. In the interest of space, the plots are shown in the supplementary information as Figure S1 and Figure S2, respectively.
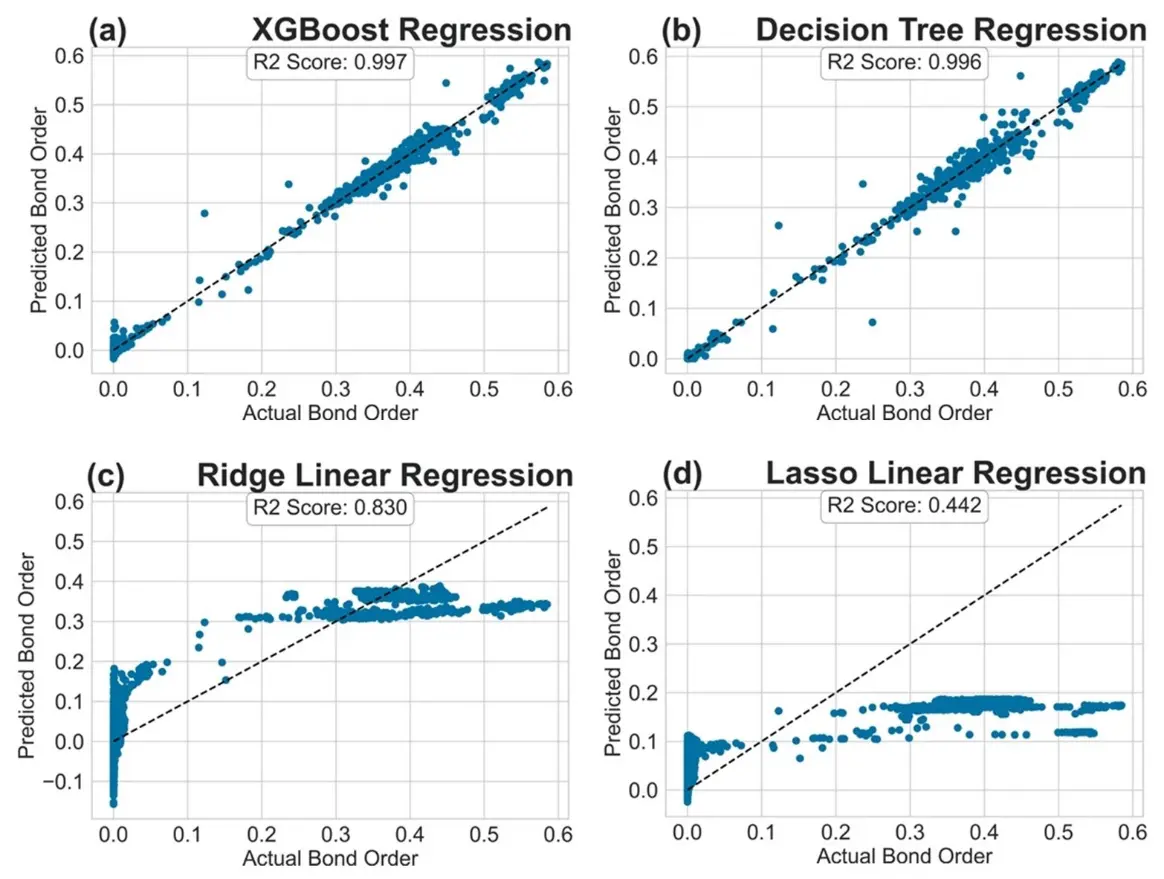
Figure 3. R2 plot for the regression models tested: (a) XGBoost Regression; (b) Decision Tree Regression; (c) Ridge Linear Regression; (d) Lasso Linear Regression in Setting (A).
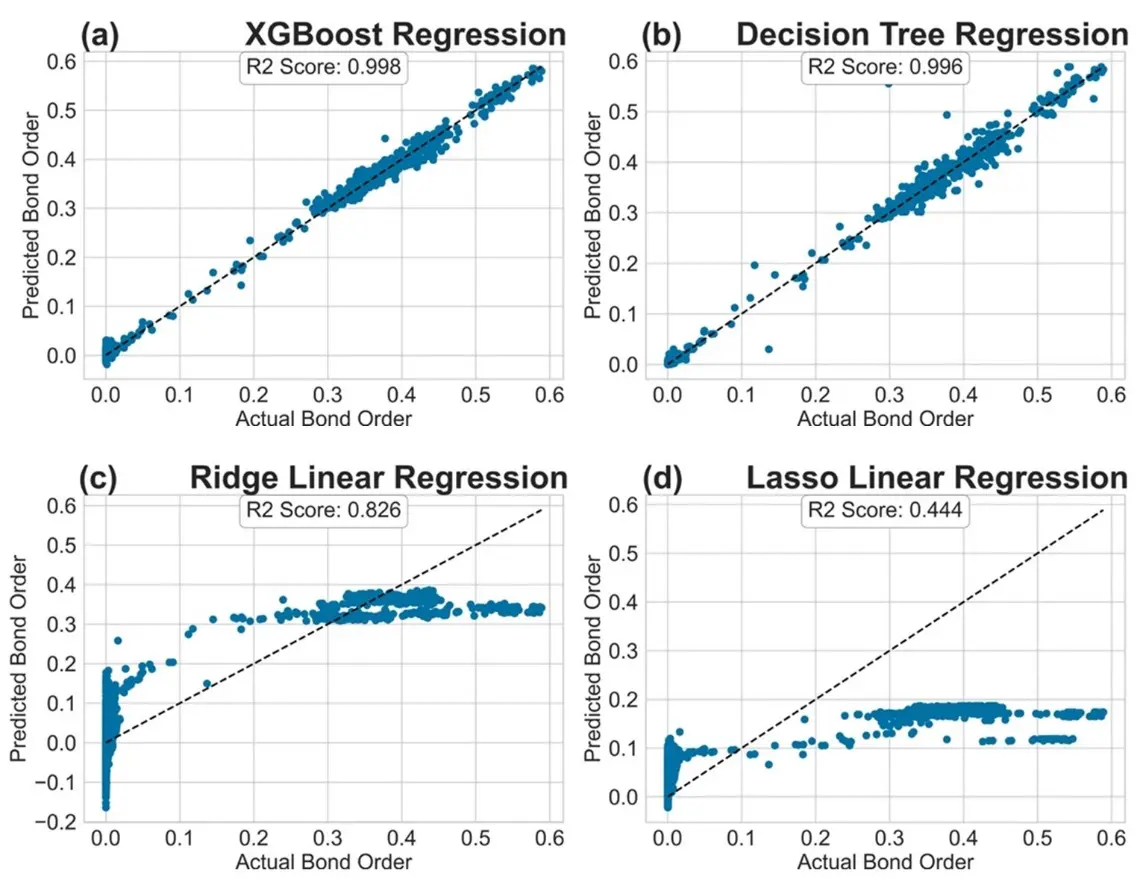
Figure 4. R2 Plot for regression models tested: (a) XGBoost Regression; (b) Decision Tree Regression; (c) Ridge Linear Regression; (d) Lasso Linear Regression in Setting (B).
4. Discussion
ML is a subset of AI that employs algorithms to detect important patterns and relationships within intricate data sets, aiding in forecasting specific characteristics. The use of ML models to predict various aspects of COVID-19 mutations has gained attraction in recent years[43]. Huang et al. identified COVID-19 severity-related SARS-CoV-2 mutation using a machine learning method. They collected genome-wide mutation of virulent strains and the severity of COVID-19 pneumonia in patients. They used 1513 viral genomes from the Global Initiative on Sharing All Influenza Data database. They employed Decision Tree, K-Nearest Neighbor, Random Forest, and Support Vector machine in their work. They evaluated the performance of their models using sensitivity, specificity, accuracy, Matthew’s correlation coefficient, and G-Mean. Their result showed a set of mutations associated with SARS-CoV-2 severity, which can be used to quickly recognize SARS-COV-2 infections associated with severe outcomes and guide the development of SARS-CoV-2 vaccines[44].
Burukanli et al. predicted COVID-19 virus mutation using Long Short-Term Memory and attention mechanisms. Their proposed HyperAttCov model outperforms many state-of-the-art methods. Their method achieved an accuracy of 70%, precision of 92%, and a Mathew’s correlation coefficient of 46.5% on the COVID-19 test dataset. Their proposed method was able to successfully predict mutations in the COVID-19 dataset in 2022[45].
Han et al. worked on the predicting the binding affinity between SARS-CoV-2 spike RBD with multiple amino acid mutations and human ACE2. Their models were based on CNN and CNN-RNN. Their methods achieved a concordance index of around 0.8. They developed a free online platform named D3A1-spike to efficiently predict the binding affinity between spike RBD mutants and ACE2. Their predicted results closely matched their experimental results[46].
Adhikari et al. suggested the use of ML techniques for predicting COVID-19 mutations[26]. In our study, we leveraged the efficacy of ML models for the prediction of BO from ab initio calculations. We demonstrated that regression models can predict BO with a very high performance. We used XGBoost Regression, Decision Tree Regression, KNN Regression, Lasso Regression, and Ridge Regression in our BO prediction. Our BO prediction task was done on the RBD-ACE2 WT and RBD-ACE2 OV datasets. We first preprocessed the variables before training the machine learning models using label encoding. We trained the machine learning models by splitting the training and testing set into four different settings. In Settings (A) and (B), the training and testing samples were from the same dataset. In Settings (C) and (D), the training and testing samples were from different dataset. In the first two settings, the training set comprised 90% of the total dataset, while the test set contains 10% of the dataset. In Settings (C) and (D), we trained the model on the entire WT (or OV) dataset and predicted the BO on the entire OV (or WT) dataset. We evaluated our different machine learning models by using R2 Score, Root Mean Square Error and Relative Absolute Error Metrics. Using ML, we predicted the BO or bond strength calculated by ab initio study. This is a first step in this direction, as accurately predicting ab initio results will significantly reduce the computational costs and enable the quantification of such properties for larger systems.
5. Conclusion
In this work, we explored the efficacy of well-known ML models in predicting BO values derived from ab initio calculations, which are computationally demanding to simulate on high performance computing platforms. Specifically, we employed XGBoost Regression, Decision Tree Regression, KNN Regression, Lasso Regression, and Ridge Regression for BO prediction. The XGBoost model outperformed all other models when the training and testing samples were from the same dataset (i.e., Settings (A) and (B)). However, Decision Trees outperformed all other models when the training and testing samples were from different datasets (i.e., Settings (C) and (D)). Linear regression models and KNN regression performed poorly in all settings. Our investigation shows that ML models such as Decision Trees and XGBoost can be used to accurately predict the BO values without expensive simulation-based computations.
Supplementary materials
The supplementary material for this article is available at: Supplementary materials.
Authors contribution
Adebiyi A: Visualization, writing-original draft, editing.
Adhikari P: Data curation, visualization, analysis, writing-original draft, editing, supervision.
Rao P, Ching WY: Writing, editing, supervision, conceptualization.
Conflicts of interest
All authors declare that they are bound by confidentiality agreements preventing disclosure of conflicts of interest in this work.
Ethical approval
Not applicable.
Consent to participate
Not applicable.
Consent for publication
Not applicable.
Availability of data and materials
The data and materials could be obtained from the corresponding author.
Funding
This research used the resources of the National Energy Research Scientific Computing Center (NERSC), a DOE office of Science User Facility supported by the Office of Science of the U.S. Department of Energy by U.S. Department of Energy under the contract number DE-AC03-76SF00098, DE-AC02-05CH11231 using NERSC award NERSC DDR-ERCAP0023727, and the Research Computing Support Services (RCSS) of the University of Missouri System. The third author (Rao P) would like to acknowledge the support of the National Science Foundation (NSF) Grant No. 2201583.
Copyright
© The Author(s) 2024.
References
-
1. Rambaut A, Loman N, Pybus O, Barclay W, Barrett J, Carabelli A, et al. Preliminary genomic characterisation of an emergent SARS-CoV-2 lineage in the UK defined by a novel set of spike mutations [Internet]. 2020. Available from: https://virological.org/t/preliminary-genomic-characterisation-of-an-emergent-sars-cov-2-lineage-in-the-uk-defined-by-a-novel-set-of-spike-mutations/563
-
4. Faria NR, Claro IM, Candido D, Franco LAM, Andrade PS, Coletti TM, et al. Genomic characterisation of an emergent SARS-CoV-2 lineage in Manaus: preliminary findings. Virological [Internet]. 2021 Jan. Available from: https://virological.org/t/genomic-characterisation-of-an-emergent-sars-cov-2-lineage-in-manaus-preliminary-findings/586
-
6. Ozer EA, Simons LM, Adewumi OM, Fowotade AA, Omoruyi EC, Adeniji JA, et al. High prevalence of SARS-CoV-2 B. 1.1. 7 (UK variant) and the novel B. 1.5. 2.5 lineage in Oyo State, Nigeria. MedRxiv [Preprint]. 2021.[DOI]
-
9. Kimura I, Kosugi Y, Wu J, Yamasoba D, Butlertanaka EP, Tanaka YL, et al. The SARS-CoV-2 Lambda variant exhibits enhanced infectivity and immune resistance. Cell Rep. 2022;38(2):110218.[DOI]
-
22. Bishop CM. Pattern recognition and machine learning.1st ed. New York: Springer; 2006.
-
23. Wang H, Ma C, Zhou L. A brief review of machine learning and its application. In: Proceeding of the 2009 international conference on information engineering and computer science; 2009 Dec 19-20; Wuhan, China. New York: IEEE; 2009. p. 1-4.
-
25. Du XK, Guo P, Wu XH, Zhang SQ. Examination of machine learning for assessing physical effects: Learning the relativistic continuum mass table with kernel ridge regression. Chin Phys C. 2023;47(7):074108.[DOI]
-
28. Pearlman DA, Case DA, Caldwell JW, Ross WS, Cheatham III TE, DeBolt S, et al. AMBER, a package of computer programs for applying molecular mechanics, normal mode analysis, molecular dynamics and free energy calculations to simulate the structural and energetic properties of molecules. Comput Phys Commun. 1995;91(1-3):1-41.[DOI]
-
29. VASP [Internet]. The Vienna Ab initio Simulation Package: atomic scale materials modelling from first principles [cited 2023 Jun 1]. Available from: https://www.vasp.at/
-
30. Ching WY, Rulis P. Electronic Structure Methods for Complex Materials: The orthogonalized linear combination of atomic orbitals. London: Oxford University Press; 2012.
-
32. Kresse G, Joubert D. From ultrasoft pseudopotentials to the projector augmented-wave method. Phys Rev B. 1999;59(3):1758-1775.[DOI]
-
36. Tibshirani R. Regression shrinkage and selection via the lasso. J R Stat Soc Series B Stat Methodol. 1996;58(1):267-288.[DOI]
-
37. Hoerl AE, Kennard RW. Ridge regression: Biased estimation for nonorthogonal problems. Technometrics. 1970;12(1):55-67.[DOI]
-
38. Abu-Mostafa YS, Magdon-Ismail M, Lin HT. Learning from data. New York: AMLBook; 2012.
-
39. Refaeilzadeh P, Tang L, Liu H. Cross-validation. In: Liu L, Özsu MT, editors. Encyclopedia of database systems. Boston: Springer; 2009. p. 532-538.[DOI]
-
40. Pedregosa F, Varoquaux G, Gramfort A, Michel V, Thirion B, Grisel O, et al. Scikit-learn: Machine learning in Python. J Mach Learn Res. 2011;12:2825-2830.[DOI]
-
42. Chen T, Guestrin C. Xgboost: A scalable tree boosting system. In: Proceedings of the 22nd acm sigkdd international conference on knowledge discovery and data mining; 2016 Aug 13-17; San Francisco, USA. New York: ACM; 2016. p. 785-794.[DOI]
-
43. Roberts M, Driggs M, Thorpe M, Gilbey J, Yeung M, Ursprung S, et al. Common pitfalls and recommendations for using machine learning to detect and prognosticate for COVID-19 using chest radiographs and CT scans. Nat Mach Intell. 2021;3(3):199-217.[DOI]
-
45. Burukanli M, Yumuşak N. COVID-19 virus mutation prediction with LSTM and attention mechanisms. Comput J. 2024;67(10):2934-2944.[DOI]
-
46. Han J, Liu T, Zhang X, Yang Y, Shi Y, Li J, et al. D3AI-Spike: A deep learning platform for predicting binding affinity between SARS-CoV-2 spike receptor binding domain with multiple amino acid mutations and human angiotensin-converting enzyme 2. Comput Biol Med. 2022;151(Pt A):106212.
Copyright
© The Author(s) 2024. This is an Open Access article licensed under a Creative Commons Attribution 4.0 International License (https://creativecommons.org/licenses/by/4.0/), which permits unrestricted use, sharing, adaptation, distribution and reproduction in any medium or format, for any purpose, even commercially, as long as you give appropriate credit to the original author(s) and the source, provide a link to the Creative Commons license, and indicate if changes were made.
Publisher’s Note
Science Exploration remains a neutral stance on jurisdictional claims in published
maps
and institutional affiliations. The views expressed in this article are solely those
of
the author(s) and do not reflect the opinions of the Editors or the publisher.
Share And Cite


Science Exploration Style
Adebiyi A, Adhikari P, Rao P, Ching W. Bond strength between receptor binding domain of spike protein and human angiotensin converting enzyme-2 using machine learning. BME Horiz. 2024;2:110. https://doi.org/10.37155/2972-449X-vol2(1)-110
Tips
Copy completed.
Submit a Manuscript
Author Instructions
Cite this Article
Article Metrics
0
View
0
Download
Cited
Article Updates

Science Exploration Style
Adebiyi A, Adhikari P, Rao P, Ching W. Bond strength between receptor binding domain of spike protein and human angiotensin converting enzyme-2 using machine learning. BME Horiz. 2024;2:110. https://doi.org/10.37155/2972-449X-vol2(1)-110
copy
Share Link
copy