SpanAttNet: A hybrid SpanConv SPDConv architecture with residual self attention for viral protein subcellular localization
*Correspondence to:
Hao Lin, School of Life Science and Technology and Centre for Informational Biology, University of Electronic Science and Technology of China, Chengdu 610054, Sichuan, China.
E-mail: hlin@uestc.edu.cn
Ye-Chen Qi, School of Life Science and Technology and Centre for Informational Biology, University of Electronic Science and Technology of China, Chengdu 610054, Sichuan, China. E-mail: ycqi@uestc.edu.cn
Ye-Chen Qi, School of Life Science and Technology and Centre for Informational Biology, University of Electronic Science and Technology of China, Chengdu 610054, Sichuan, China. E-mail: ycqi@uestc.edu.cn
Comput Biomed. 2026;1:202508. 10.70401/cbm.2025.0006
Received: September 07, 2025Accepted: December 24, 2025Published: December 31, 2025
Abstract
Aims: The subcellular localization of viral proteins can give insight into virus replication, immune evasion, and the development of therapeutic targets. Traditional experimental methods for determining localization are time-consuming and costly to perform, which calls for robust computational approaches. In this paper, we propose designing a computational method for identifying the subcellular localization of viral proteins.
Methods: In the effort to improve feature extraction for viral protein subcellular localization, a novel hybrid deep learning architecture, SpanAttNet, was proposed by incorporating span-based convolution with spatial pyramid dilated convolution and a residual self-attention mechanism. Three commonly used sequence descriptors, AAC, PseAAC, and DDE, each combined with PCA for feature dimension reduction, were systematically used to benchmark SpanAttNet.
Results: Among the individual descriptors, the best performance was yielded by PseAAC (accuracy 93.95%, MCC 91.18% at ρ = 0.8 PCA reduction), while optimal performance from DDE was at minimum reduction (accuracy 87.00% at ρ = 0.2). Moreover, ensemble feature fusion across the various descriptors elevated SpanAttNet to its top performance, reaching an MCC of 93.79% and an F1-score of 92.91%, hence achieving the best balance between sensitivity and specificity. Compared to state-of-the-art models, SpanAttNet managed to consistently match or surpass predictive accuracy, demonstrating strong generalizability.
Conclusion: We establish SpanAttNet as a robust and biologically informed predictor for viral protein subcellular localization, with strong potential for extension to multi-label classification and broader proteomic applications.
Keywords
Viral protein localization, deep learning, self-attention, dimensionality reduction, bioinformatics
1. Introduction
Subcellular localization is a fundamental problem in virology, and this characteristic affects viral replication, immune evasion, and pathogenicity[1,2]. Similarly, understanding where viral proteins reside in the host cells, whether it be in the nucleus, cytoplasm, membranes, or secreted vesicles[3], provides important insights into infection mechanisms and potential therapeutic targets[4]. The traditional experimental approaches to determining the subcellular localization of proteins, which involve techniques such as fluorescence microscopy[5], mass spectrometry and biochemical fractionation[6], are time-consuming and costly. Thus, computational methods have recently been gaining importance due to their potential to easily predict protein localization from sequence and structural information.
Early computational methods for protein subcellular localization relied heavily on handcrafted features, such as amino acid composition (AAC), pseudo-amino acid composition (PseAAC), and position-specific scoring matrices (PSSMs)[7,8]. These feature extraction approaches attempted to capture key sequence characteristics that might determine cellular localization patterns[9]. Support vector machines (SVMs) and random forests[10] emerged as the most commonly used classifiers during this period, achieving moderate prediction accuracy (typically 70-80% for eukaryotic proteins) but demonstrating significant limitations. While effective for simple localization patterns, these methods struggled with complex sequence-structure relationships and often failed to generalize across diverse protein families[11]. The performance gap became particularly evident when these methods were applied to viral proteins, which frequently exhibit rapid evolutionary changes and unique host interaction motifs[12,13]. Additionally, these traditional machine learning approaches were inherently limited by their dependence on manually curated features[14], which could not fully capture the hierarchical nature of protein localization signals[15].
However, this was the scenario until the mid-2010s when, with the advent of deep learning approaches[16], a paradigm shift occurred, and neural networks became capable to learn relevant features[17] directly from the sequence data in an automated way, overcoming many of these limitations[18]. Popularized through deep learning, convolutional neural networks (CNNs) have been widely used for automatically extracting hierarchical features from the input[19]. DeepLoc combined CNNs with bidirectional long short-term memory (LSTMs) to predict eukaryotic protein localizations, which was later extended to viral proteins in Virus-mPLoc[20]. However, CNNs alone often fail to capture long-range dependencies due to their limited receptive fields[21]. Recurrent neural networks (RNNs) were introduced to model sequential dependencies, especially LSTM and gated recurrent units (GRUs), and were used extensively during the early days of deep learning[22,23]. However, even though effective in some scenarios, they incur a much higher computational cost and are difficult to parallelize. The introduction of attention mechanisms, particularly self-attention in Transformer models[24-26], had a revolutionary effect on sequence modeling by allowing distant residues to interact with each other directly. ProtTrans[27] and ProteinBERT[28] have successfully demonstrated the power of transformer-based pretraining for protein-related tasks[29]. However, pure attention models have high computational costs and may miss out on important local structural patterns that are determinant for localization[26]. Since then, several works have focused on hybrid models with a tradeoff between efficiency and accuracy[30]. Light Attention combined depth-wise separable convolutions with attention to enable efficient protein function predictions[31,32]. Similarly, SPD-Conv utilized spatial pyramid dilated convolution for capturing multi-scale features without excessive parameters[33].
Despite these advances, none of these existing models optimally integrate multiscale convolutions together with attention for viral protein localization. These challenges motivated us to propose SpanAttNet, a novel hybrid architecture that incorporates SpanConv and Spatial Pyramid Dilated Convolution with a residual self-attention mechanism, enhancing the feature extraction process for viral protein subcellular localization. The proposed SpanConv harnesses multiscale receptive fields to capture local or global patterns in sequences, while spatial pyramid dilated convolution (SPDConv) applies dilated convolutions at multiple rates to efficiently model spatial hierarchies without significantly increasing computational overhead. Additionally, the residual self-attention mechanism further refines the feature representations via enhancements in global dependency modeling and adaptive feature weighting, leading to an improvement in predictive performance. As such, all these design choices lead to a computationally efficient model that excels on viral protein benchmarks and generalizes easily to multilabel and pan-proteomic applications.
Although hybrid CNN-attention architectures have been explored, SpanAttNet introduces two distinctive innovations: (i) the tight integration of span-based convolution (explicitly modeling variable-length sequence motifs) with spatial-pyramid dilated convolution within the same residual block, enabling highly efficient multi-scale feature extraction, and (ii) descriptor-specific parallel encoders that allow AAC, PseAAC, and dipeptide deviation from the expected mean (DDE) to develop specialized multi-scale representations before late fusion, rather than forcing a shared convolutional trunk.
2. Materials and Methods
2.1 Dataset
Protein sequences were collected from UniProt and preprocessed to ensure data quality. Sequences containing non-standard amino acids were removed, and redundancy was reduced using CD-HIT with a 40% sequence identity threshold. The final dataset contained 5,303 non-redundant viral proteins categorized into six subcellular locations: Secreted (97), Host Plasmodesma (48), Host Nucleus (1,959), Host Membrane (1,922), Host Endoplasmic Reticulum (91), and Host Cytoplasm (1,186).
The dataset was split into training (80%) and independent test (20%) sets. Five-fold cross-validation was applied to the training set for model selection, after which the optimal configuration was retrained on the full training data and evaluated on the held-out test set.
2.2 Data transformation and feature extraction
Protein sequences were transformed into numerical representations using iFeature, generating three widely used descriptors: AAC, PseAAC, and DDE.
2.2.1 Amino acid composition
AAC encodes the normalized frequency of each of the 20 standard amino acids in a protein sequence, defined as:
where the frequency f(t) describes the frequency of amino acid t occurring in a protein sequence with length N, while N(t) represents the total number of amino acids in the protein sequence.
2.2.2 Pseudo-amino acid composition
PseAAC extends AAC by incorporating sequence-order information through physicochemical correlation factors. Physicochemical properties were normalized and correlation factors were computed following standard formulations.
The same formulation can be used to standardize hydrophilicity and side chain masses. The correlation function of the three properties between two residues, Ri and Rj can be defined as shown in Equation (3). At the same time, the sequence order-correlated factor is formulated as shown in Equation (4).
where λ is the integer parameter chosen to describe the order of association of amino acids. If fi is the normalized occurrence frequency of amino acid i in a protein sequence, the PseAAC can be defined as described in Equation (5).
Where y is the weighting factor for the sequence-order effect. Here, we selected y = 0.05 in iFeature.
2.2.3 Dipeptide deviation from expected mean
DDE encodes deviations of observed dipeptide frequencies from their expected theoretical means based on codon usage. The descriptor is computed using dipeptide composition, theoretical mean, and theoretical variance as defined below:
where Dc(r,s) is the dipeptide composition of dipeptide ’rs’. N is the length of the protein or peptide, and Nrs is the number of dipeptides ’rs’. Tm(r,s) is the theoretical mean, defined in Equation (7).
where the first and second amino acids in the given dipeptide ’rs’ are encoded by Cr and Cs, respectively. CN is the number of possible codons, excluding the three-stop codons. As a final step, DDE(r,s) is calculated as shown in Equation (8).
where Tv(r,s) is defined as the theoretical variance of the dipeptide ‘rs’.
2.2.4 Rationale for descriptor selection
AAC captures global compositional information, PseAAC encodes long-range physicochemical correlations relevant to translocation signals, and DDE emphasizes local dipeptide preferences. Their complementary nature has been demonstrated in viral and eukaryotic protein localization tasks, motivating their use in ensemble modeling.
2.3 Principal component analysis
Dimensionality reduction was performed using principal component analysis (PCA) to mitigate feature redundancy and noise[13]. For each descriptor, a fraction ρ of principal components was retained, where the reduced dimensionality is given by E′ = ρ × E, where E is the number of features depending on the descriptor used AAC, PseAAC, or DDE, and ρ is the reduced rate.
2.4 Proposed model
SpanAttNet is a hybrid architecture designed to capture both local and long-range sequence patterns through the integration of SpanConv, SPDConv, and residual self-attention. Descriptor-specific encoders independently process AAC, PseAAC, and DDE features before late fusion.
To build the SpanAttNet framework, we designed a descriptor encoder that independently processes the three biochemical feature representations: AAC, PseAAC, and DDE. Each descriptor d ∈ {AAC, PseAAC, DDE} goes through an encoder function f(·) to produce a 64-dimensional output vector, written as zd = f(d)where fits into
where n is the number of descriptors.
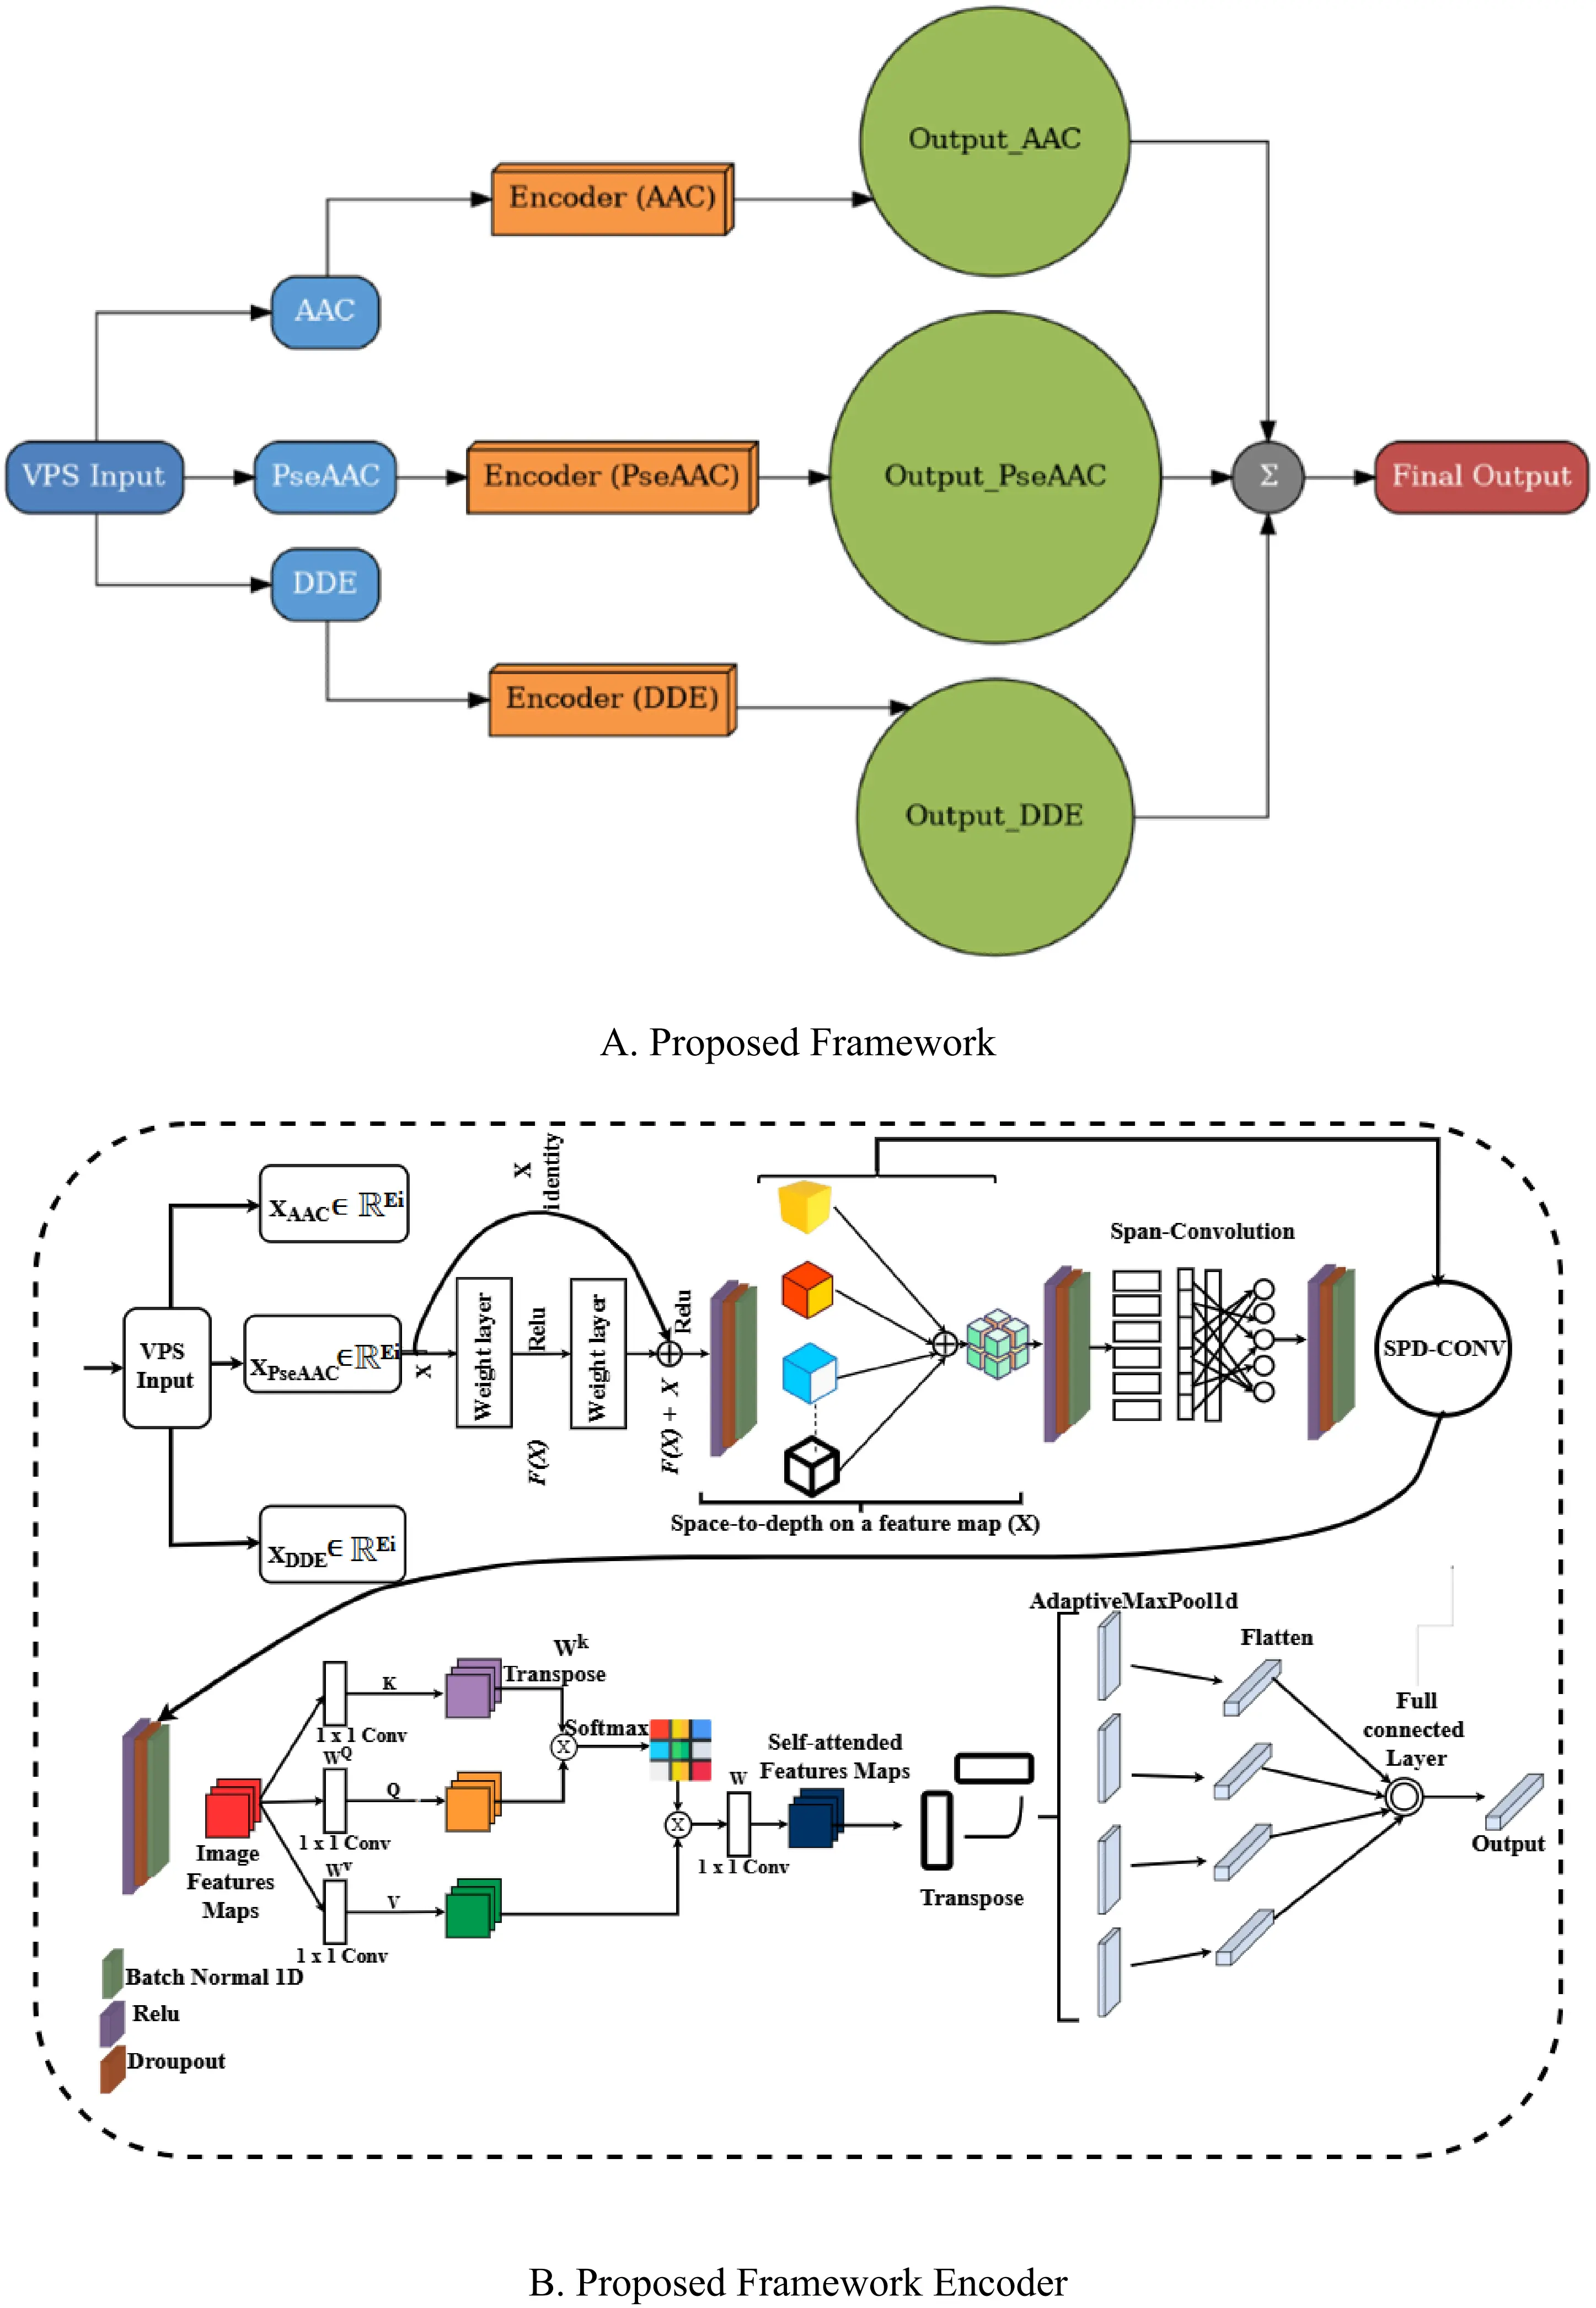
In Figure 1, Block A represents the general architecture of our proposed model, SpanAttNet, which integrates multiple biochemical descriptors (AAC, PseAAC, and DDE). Each descriptor is first processed independently through its dedicated encoder before the outputs are fused using three different operators, concatenation (Equation 9), the maximum (Equation 10), and summation (Equation 11), to enhance the learning capacity of the framework. In contrast, Block B details the workflow of a single descriptor encoder. This block illustrates how a specific descriptor is transformed, starting from feature embedding, passing through the span-based attention mechanism, and ultimately being mapped to a compact representation. Thus, Block A illustrates the global model design (descriptor fusion across encoders), while Block B explains the internal processing pipeline of an individual encoder. This distinction highlights how the proposed architecture leverages both feature-specific learning and integrated descriptor fusion to achieve improved performance.
Figure 1 illustrates the structure of our SpanAttNet model. Block A shows the big picture, combining three biochemical descriptors (AAC, PseAAC, and DDE). Each descriptor is processed separately by its own encoder, and then their outputs are merged using techniques like concatenation, maximum, or summation to boost the model’s learning power. Block B, on the other hand, focuses on the workings of a single encoder, illustrating how one descriptor is transformed, beginning with feature embedding, proceeding through a span-based attention mechanism, and culminating in a compact form. Essentially, Block A outlines the full model with its focus on blending descriptors, while Block B breaks down the step-by-step process within a single encoder, showing how the model balances individual feature learning with combined descriptor integration for better results.
Given an input feature matrix
Where f0 is our hybrid convolutional-attention network. This design ensures that descriptor-specific patterns are learned before final aggregation. The model employs a multi-stage feature extraction pipeline to capture both fine-grained and high-level sequence patterns.
The SpanConv layer updates the local sequence motifs with a standard 1D convolution, further followed by batch normalization and ReLU activation.
where W_conv is a learnable kernel and * denotes convolution. This operation strengthens the local discriminative power while maintaining spatial coherence. In order to capture longer-range dependencies, we introduce a SPDConv layer that reshapes the input into blocks before convolution. Channel adjustment reduces dimensionality for computational efficiency, block-wise reshaping groups adjacent features, and transpose and flatten restructure the tensor for convolution.
It enables the model to learn hierarchical representations by increasing the receptive field progressively. Deep networks are often subject to vanishing gradients. To circumvent this, we employ residual blocks that enable the determination of mappings:
where f(x) is a two-layer convolutional transformation and g(x) is the shortcut connection (identity or 1 × 1 convolution for channel matching). This ensures stable gradient flow during backpropagation. Although convolutional layers excel in exploiting local feature information, they may be limited in capturing long-range dependencies. To complement this, we add a self-attention mechanism to project input features into query, key, and value spaces and compute attention weights via scaled dot-product:
This mechanism dynamically reweights the features of the sequences to enhance the modeling of global dependencies, hence improving predictive performance. Since AAC, PseAAC, and DDE are complementary descriptors, we combine their predictions by logit summation followed by Softmax normalization. In this way, it takes advantage of the merits of each descriptor and reduces their individual bias.
2.4.1 Residual self-attention module
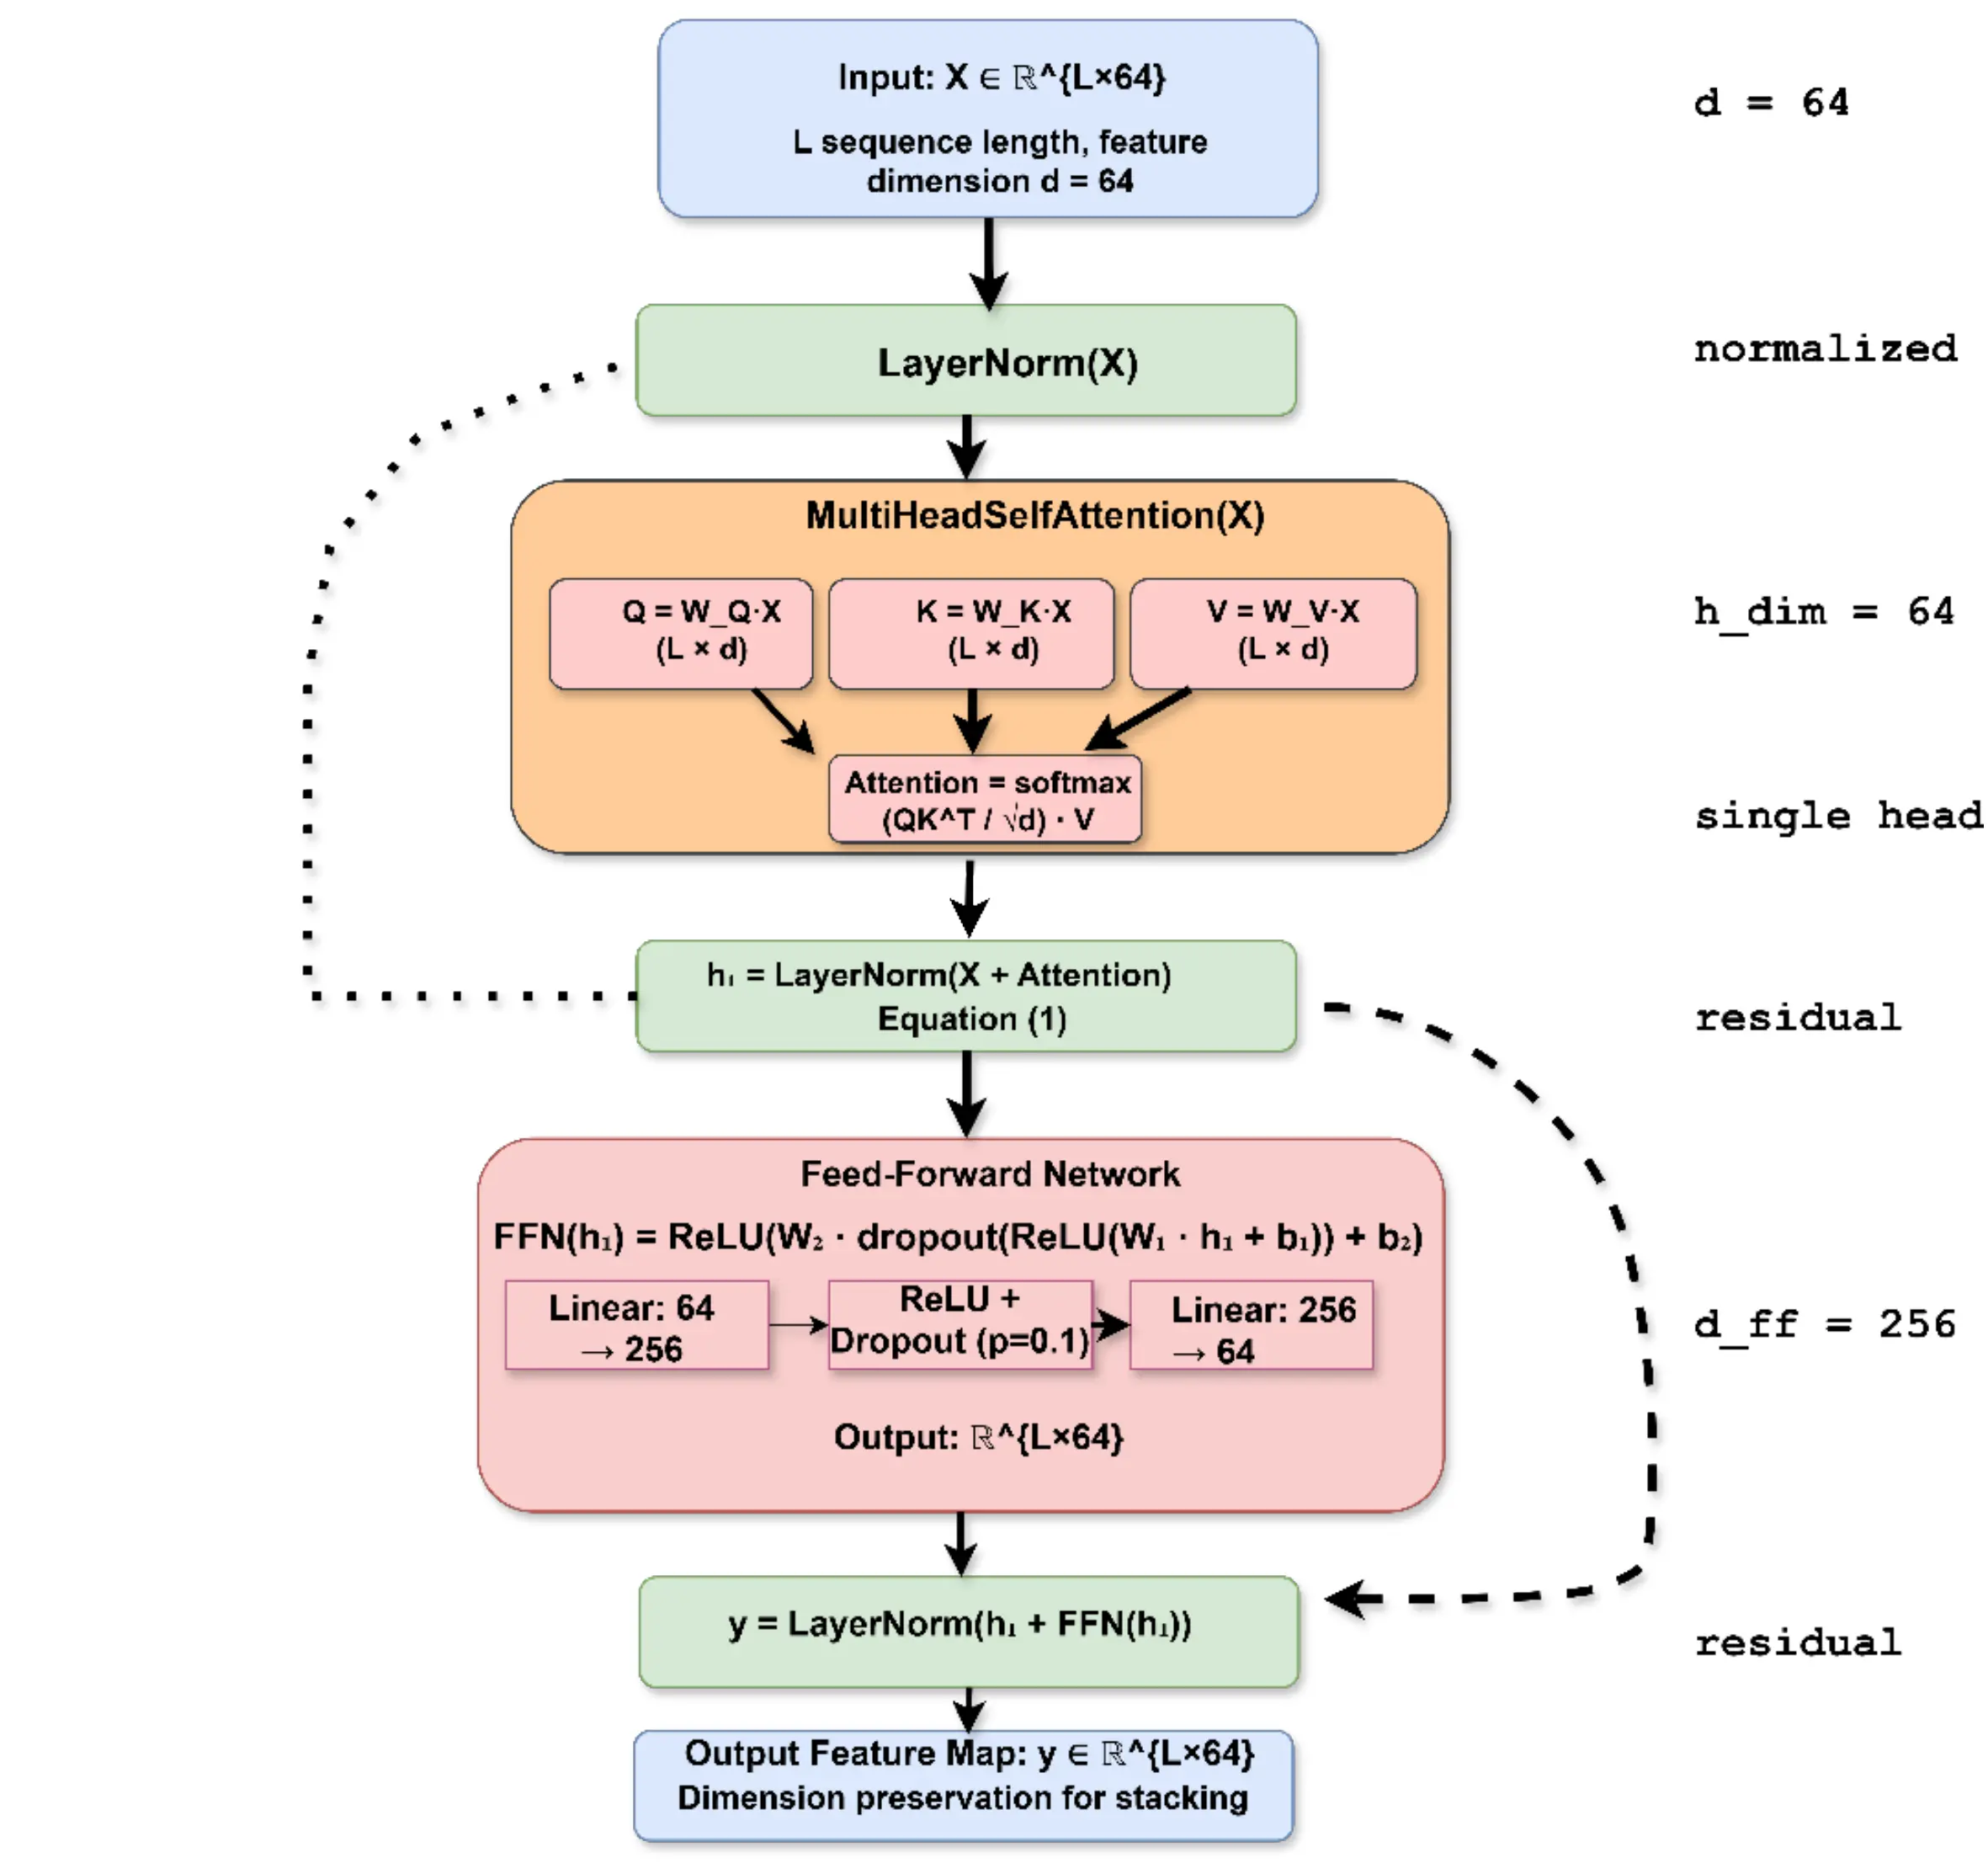
Residual self-attention follows a standard add-and-norm design with a single attention head and a feed-forward network. In this study, residual self-attention is employed as a representation-learning mechanism to enhance robustness and predictive performance rather than for residue-level biological interpretation.
In our implementation, we use a single attention head (instead of multi-head) with a hidden dimension of 64, followed by a two-layer feed-forward network (64 → 256 → 64) with ReLU activation and dropout (p = 0.1). Both the attention sub-layer and the feed-forward sub-layer are wrapped in residual connections and layer normalization, as illustrated in Figure 2. In this study, residual self-attention is primarily employed as a representation-learning mechanism to enhance robustness and performance, rather than as an explicit tool for residue-level biological interpretation.
2.5 Baseline algorithms
Baseline methods were implemented using published configurations for fair comparison. The AdaBoost Classifier[34], Decision Trees (DTs)[35], K-Nearest Neighbors (KNNs), stochastic gradient descent (SGD) Classifier, Gaussian Process Classifier (GPC)[36], Linear Support Vector Machine (LSVM), LSTM Classifier[37], and CNN Classifier[38] were used as baseline algorithms. The conventional machine learning models were imported directly from the scikit library. For the LSTM design, we constructed a three-layer LSTM network with 32, 64, and 128 output feature dimensions. Following the LSTM layers, we added a fully connected layer with input features of size 128 × 16 to classify the data samples into distinct classes, while for the CNN, we designed a network consisting of three 1D convolutional layers, each followed by a ReLU activation function. The final component of the network is a fully-connected layer that assigns class labels to the input data samples. The output channels for the three convolutional layers were set to 32, 64, and 128, respectively. The
For fair comparison with MuLA[13], we strictly reproduced the model using the authors’ official code with the identical 80/20 train-test split, the same 5-fold CV indices on the training set, identical random seed (42), and the same PCA-reduced features (ρ = 0.8 for AAC and PseAAC; ρ = 0.2 for DDE). MuLA was retrained from scratch using AdamW optimizer (lr = 0.001) and default hyperparameters.
2.6 Training details and imbalanced learning strategy
Additionally, we compared our method with other methods to evaluate its performance. Equation (19) presents the formulation of Precision, Recall, Accuracy, F1, and MCC, which are utilized in this work as evaluation metrics. These evaluation metrics play a crucial role in assessing the efficiency and effectiveness of machine learning models. In Equation (22), TP represents the number of true positive predictions (correctly predicted positive subcellular localizations), FP represents the number of false positive predictions (incorrectly predicted positive subcellular localizations), TN represents the number of true negative predictions (correctly predicted negative subcellular localizations), FN represents the number of false negative predictions (incorrectly predicted negative subcellular localizations), and MCC represents Matthews correlation coefficient . These metrics provide valuable insights into the accuracy and performance of the subcellular localization predictions.
During model testing, we employed 5-fold cross-validation, meaning that 4 out of 5 of the data were used for training, and 1 out of 5 for testing, repeated five times. A fixed random seed was set for K-fold splitting. To train the classifier model, a batch of training data (Train_k) was fed into the classifier. The error (loss) was computed and used for backpropagation to fine-tune the model's weights. After passing through the entire training data with updates to classifier weights, we tested the learned classifier on Test_k data (inference) and measured model performance based on metrics such as accuracy, F1 score, and sensitivity.
2.6.1 Prediction decision method
Predictions were made by taking the argmax of the softmax probabilities, selecting the class with the highest predicted probability in top-1 classification. No further threshold tuning or post-hoc probability calibration was done on the test set. Preliminary experiments showed that probability calibration resulted in less than 0.2% improvement in MCC, which was considered negligible compared to the additional computational cost and overfitting to the validation set. Raw softmax probabilities with argmax selection were therefore used as the final decision rule in all experiments.
2.7 Training details and handling of class imbalance
Class imbalance was addressed using a combination of loss reweighting and sampling strategies. Given the severe class imbalance only 48 Plasmodesma and 97 Secreted samples compared to over 1,900 Host Nucleus and Host Membrane samples we used two strategies to address this issue: (1) applying a weighted cross-entropy loss where class weights were inversely proportional to their frequencies in the training data, and (2) performing mild oversampling of the minority classes (Secreted, Plasmodesma, and Endoplasmic Reticulum) through random duplication until each class reached at least 200 samples during final retraining on the full dataset. These adjustments notably improved recall for the underrepresented classes without reducing performance on the majority classes. All models were trained using the AdamW optimizer (learning rate = 0.001, batch size = 64) with early stopping based on validation MCC.
3. Results and Discussion
3.1 PCA dimensionality reduction analysis
To optimize feature efficiency, we systematically evaluated PCA reduction rates (ρ) from 0.2 to 1.0 using 5-fold cross-validation. Key findings are summarized in Figure 3. The DDE descriptor showed the highest discriminatory power at minimal dimensionality reduction (ρ = 0.2), achieving peak performance metrics (accuracy: 87.00; MCC: 80.92). In contrast, both AAC and PseAAC descriptors performed best at ρ = 0.8, with PseAAC achieving superior classification metrics (accuracy: 93.95; MCC: 91.18) and AAC following closely (accuracy: 87.80; MCC: 82.10). The PseAAC descriptor also proved to be the most stable across all reduction levels (accuracy range: 83.23-93.95).
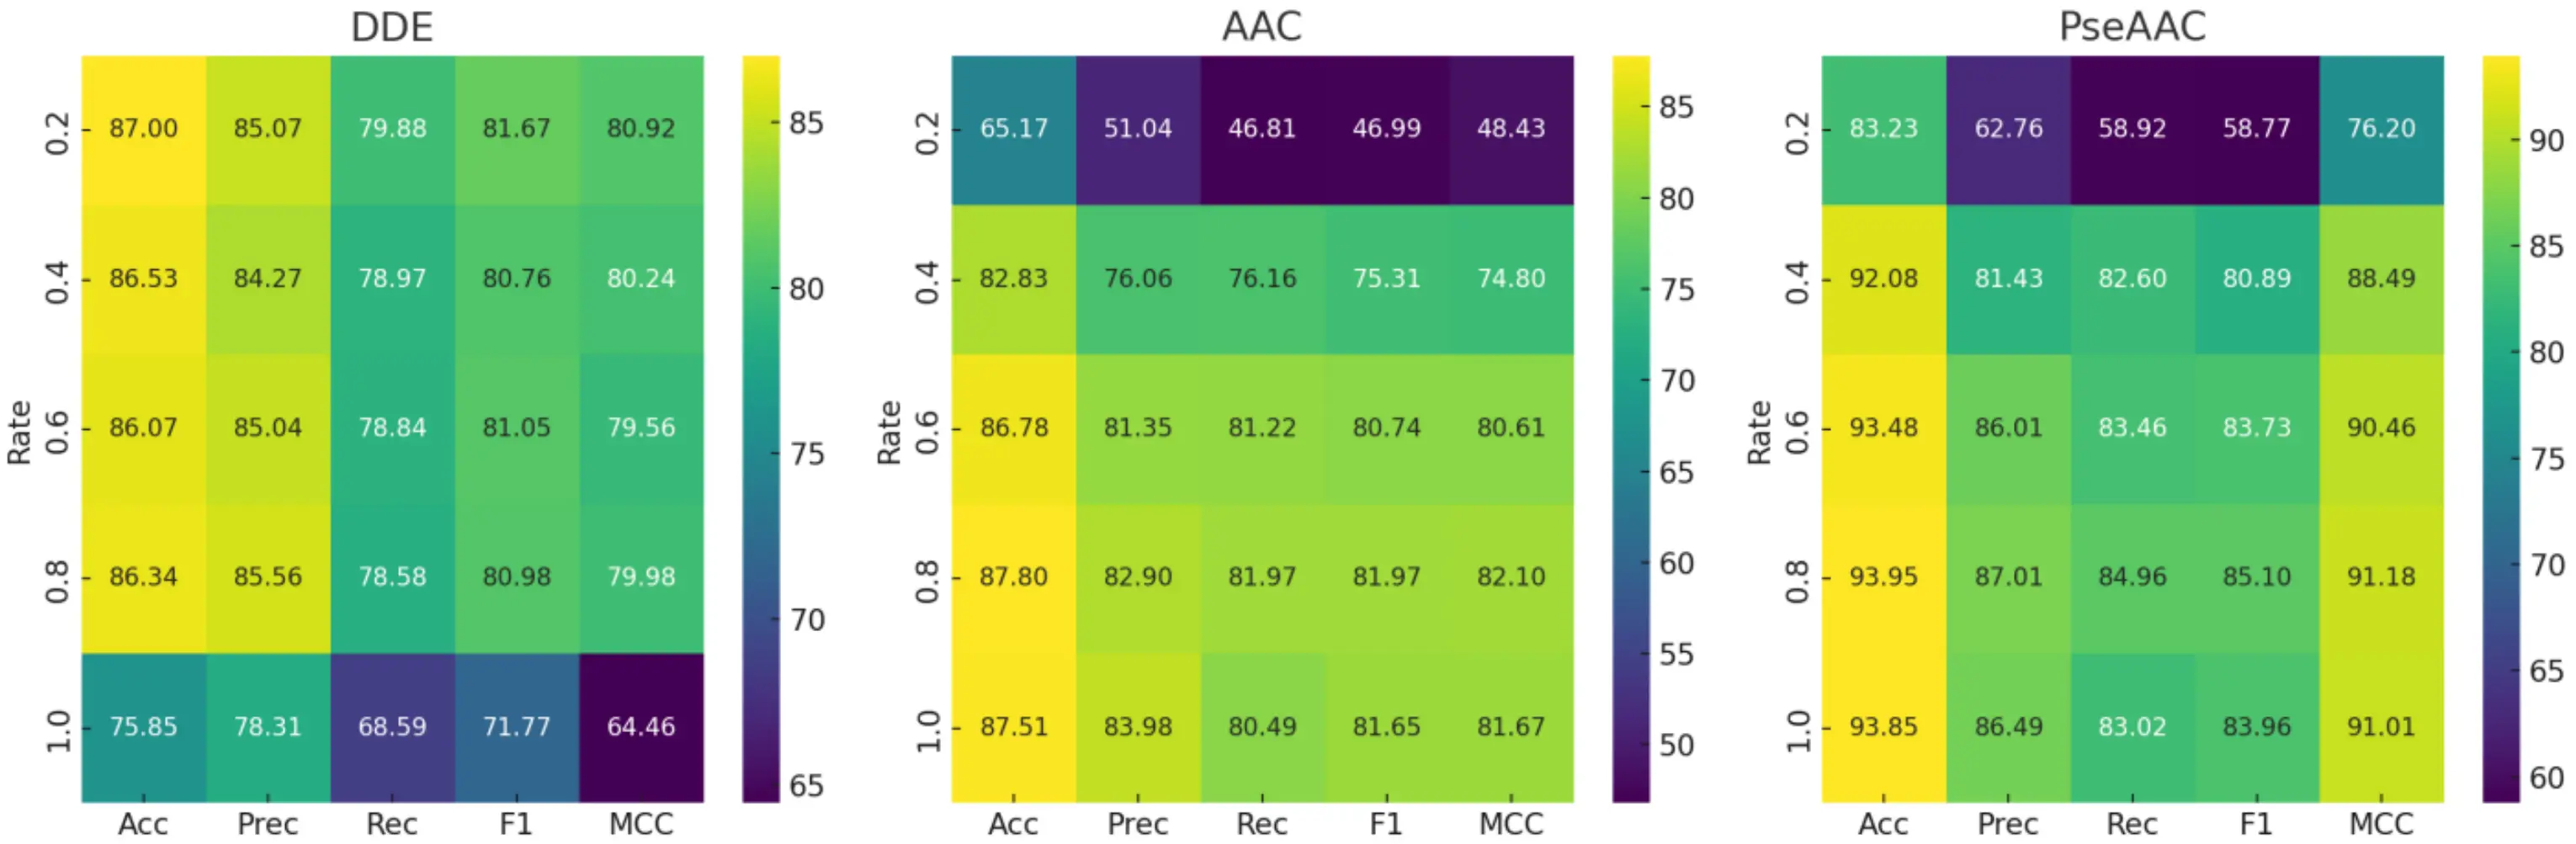
Figure 3. Performance metrics of feature descriptors at varying PCA reduction rates (ρ). PCA: principal component analysis; DDE: dipeptide deviation from expected mean; AAC: amino acid composition; PseAAC: pseudo-amino acid composition.
From these results, three main methodological insights can be drawn: (1) DDE performs best with a reduction rate of ρ ≤ 0.2; (2) AAC and PseAAC benefit from moderate reduction (ρ = 0.8) to effectively filter noise; and (3) PseAAC stands out as the most reliable option for applications requiring consistent performance, even when reduction parameters vary. These optimal PCA settings were applied in all subsequent analyses.
The difference in optimal ρ values probably comes from how much redundant or overlapping information each feature set contains. The DDE descriptor produces 400-dimensional vectors, many of which include repetitive or only weakly useful dipeptide information. By applying stronger dimensionality reduction (ρ = 0.2), this excess noise is removed, leaving a cleaner and more compact set of meaningful features. On the other hand, PseAAC already captures key physicochemical relationships within the data, so a moderate level of reduction (ρ = 0.8) is enough to smooth out noise while keeping the important biological variations intact. This balance is reflected in its highest MCC score and smallest standard deviation at that setting.
3.2 Comparison performance of feature descriptors
Under the optimal PCA settings established in Section 3.1, we trained SpanAttNet on each descriptor and evaluated its performance on independent test and validation sets via 5-fold cross-validation (Table 1). For DDE, the model achieved 85.00% accuracy on the test set and an MCC of 82.32%, with validation accuracy averaging 86.80% (± 0.68). While slightly lower in raw accuracy compared to AAC and Pse + AAC, DDE maintained competitive MCC values, reflecting balanced classification across compartments. For AAC, the model attained 86.62% accuracy (MCC: 84.29%) on the test set and a validation mean accuracy of 87.80% (± 0.58), indicating stable generalization. For PseAAC, SpanAttNet demonstrated the highest performance, achieving 91.67% accuracy, 93.00% precision, 91.67% recall, and an MCC of 90.23% on the test set. On the validation set, PseAAC maintained a mean accuracy of 93.95% (± 0.17) and an MCC of 91.35% (± 0.23), outperforming the other descriptors in both stability and absolute predictive power.
Table 1. Performance of SpanAttNet model across feature descriptors on the Test and Validation sets.
| Feature Descriptor | Acc | Prec | Rec | F1 | MCC | Acc | Prec | Recall | F1 | MCC |
| Test Set | Validation set | |||||||||
| DDE | 85.00 | 87.17 | 85.00 | 85.19 | 82.32 | 86.80 ± 0.68 | 85.07 ± 1.07 | 79.88 ± 2.83 | 81.67 ± 2.11 | 80.92 ± 0.83 |
| AAC | 86.62 | 88.24 | 86.62 | 86.42 | 84.29 | 87.80 ± 0.58 | 82.90 ± 1.51 | 81.97 ± 2.38 | 82.18 ± 1.52 | 82.10 ± 0.76 |
| PseAAC | 91.67 | 93.00 | 91.67 | 91.77 | 90.23 | 93.95 ± 0.17 | 87.01 ± 1.77 | 84.76 ± 2.63 | 84.90 ± 1.76 | 91.35 ± 0.23 |
MCC: Matthews correlation coefficient; DDE: dipeptide deviation from expected mean; AAC: amino acid composition; PseAAC: pseudo-amino acid composition.
Overall, the results show that PseAAC, paired with moderate dimensionality reduction (ρ = 0.8), offers the most powerful and reliable feature representation for predicting viral protein subcellular localization. Its consistently strong performance across both test and validation sets highlights SpanAttNet’s strong generalization ability and effectiveness beyond the training data.
3.3 Individual feature comparison with state-of-the-art models
Table 2 provides a detailed comparison of our proposed SpanAttNet model against several baseline methods across three descriptor types AAC, PseAAC, and DDE. The findings clearly demonstrate SpanAttNet’s ability to produce balanced and discriminative feature representations, consistently outperforming or closely matching state-of-the-art models across all major evaluation metrics.
Table 2. Quantitative individual feature comparison with state-of-the-art models.
| Model | Acc | Prec | Rec | F1 | MCC | |
| AAC | AdaBoost | 38.04 | 28.88 | 32.2 | 25.61 | 20.61 |
| DT | 78.49 | 68.61 | 69.75 | 68.84 | 68.48 | |
| KNN | 84.16 | 81.17 | 71.35 | 73.95 | 76.83 | |
| GPC | 86.7 | 84.43 | 77.25 | 80.01 | 80.85 | |
| LSVM | 69.73 | 48.93 | 44.04 | 45.32 | 54.69 | |
| SGD | 64.81 | 44.03 | 34.65 | 35.44 | 47.21 | |
| LSTM | 63.75 | 41.93 | 40.74 | 40.57 | 45.73 | |
| CNN | 62.83 | 38.66 | 36.06 | 35.84 | 44.14 | |
| MuLA | 87.71 | 86.55 | 79.53 | 82.16 | 81.92 | |
| SpanAttNet | 86.62 | 88.24 | 86.62 | 86.42 | 84.29 | |
| PseACC | AdaBoost | 51.15 | 21.24 | 23.39 | 18.95 | 31.67 |
| DT | 89.31 | 73.51 | 75.65 | 73.51 | 84.36 | |
| KNN | 92.74 | 84.14 | 80.1 | 80.49 | 89.4 | |
| GPC | 92.85 | 87.06 | 81.19 | 82.59 | 89.88 | |
| LSVM | 86.37 | 58.48 | 55.54 | 56.57 | 79.8 | |
| SGD | 84.41 | 55.93 | 48.38 | 49.51 | 76.92 | |
| LSTM | 80.92 | 50.31 | 48.77 | 48.55 | 72.03 | |
| CNN | 82.72 | 51.65 | 48.19 | 48.34 | 74.94 | |
| MuLA | 94.0 | 88.66 | 82.2 | 84.17 | 91.21 | |
| SpanAttNet | 91.67 | 93.00 | 91.67 | 91.77 | 90.23 | |
| DDE | AdaBoost | 48.06 | 40.88 | 32.84 | 31.18 | 25.24 |
| DT | 77.67 | 69.15 | 68.09 | 68.11 | 67.25 | |
| KNN | 84.86 | 84.09 | 76.62 | 79.76 | 77.78 | |
| GPC | 85.85 | 86.48 | 77.36 | 80.09 | 78.98 | |
| LSVM | 79.46 | 77.68 | 62.54 | 66.24 | 69.53 | |
| SGD | 73.56 | 69.49 | 60.27 | 63.71 | 60.92 | |
| LSTM | 60.52 | 42.1 | 38.95 | 39.22 | 40.68 | |
| CNN | 58.06 | 37.68 | 33.76 | 33.76 | 37.15 | |
| MuLA | 86.33 | 87.93 | 78.18 | 81.94 | 79.89 | |
| SpanAttNet | 85.00 | 87.17 | 85.00 | 85.19 | 82.32 |
AAC: amino acid composition; PseAAC: pseudo-amino acid composition; DDE: dipeptide deviation from expected mean; MCC: Matthews correlation coefficient; DT: decision tree; KNN: k-nearest neighbors; GPC: gaussian process classifier; LSVM: linear support vector machine; SGD: stochastic gradient descent; LSTM: long short-term memory; CNN: convolutional neural network.
For the AAC descriptor, SpanAttNet shows strong classification capability, achieving a precision of 88.24%, recall of 86.62%, F1-score of 86.42%, and MCC of 84.29%. While MuLA records a slightly higher accuracy (87.71% vs. 86.62%), SpanAttNet surpasses it in both F1-score and MCC, indicating a better balance between sensitivity and precision, as well as a stronger overall predictive correlation.
With the PseAAC descriptor, SpanAttNet delivers its most robust performance, achieving a precision of 93.00%, recall of 91.67%,
For the DDE descriptor, SpanAttNet continues to perform reliably, achieving an F1-score of 85.19% and an MCC of 82.32%. It clearly outperforms traditional classifiers such as GPC, KNN, and LSVM, and comes close to MuLA’s performance (F1-score: 81.94%,
Model Accuracy vs. Balanced Performance:
Although SpanAttNet records slightly lower raw accuracy than MuLA across individual descriptor sets (a difference of 0.3-2.3%), this represents a deliberate design choice to improve the model’s performance on imbalanced datasets. Given that minority classes contain fewer than 100 samples while majority classes exceed 1,900, optimizing purely for accuracy would reduce recall for underrepresented locations. In biomedical applications, metrics like MCC and F1-score are more meaningful, as they are less affected by class imbalance[39]. SpanAttNet’s highest MCC (90.23% for PseAAC) and its superior recall for minority classes (over 89% for classes with just 48 samples) demonstrate its stronger real-world reliability and robustness compared to models that prioritize raw accuracy alone.
Overall, SpanAttNet demonstrates stable and competitive performance across diverse feature representations, with particularly strong results when combined with PseAAC descriptors. This underscores the robustness and adaptability of the model for virus protein subcellular localization prediction.
3.4 Ensemble feature comparison with state-of-the-art models
To fully leverage the complementary strengths of different descriptors, we combined AAC, PseAAC, and DDE features using three ensemble fusion strategies: maximum pooling (M), feature concatenation (C), and summation (S). The detailed performance results are summarized in Table 3. SpanAttNet was benchmarked against MuLA and traditional machine learning models (KNN, GPC, DT, and AdaBoost) across five key metrics: accuracy, precision, recall, F1-score, and MCC. Overall, combining multiple descriptors led to consistent improvements in classification performance compared to models trained on single features. MuLA achieved the highest raw accuracy (94.87%) using summation fusion, with balanced results (precision: 92.72%, recall: 84.18%, MCC: 92.47%). However, SpanAttNet demonstrated superior overall robustness, achieving the highest MCC (93.79%) and F1-score (92.91%), alongside excellent precision (94.60%) and recall (92.42%).
Notably, SpanAttNet outperformed MuLA in both MCC (+1.32%) and F1-score (+5.3%), while maintaining consistently high accuracy
SpanAttNet’s strong performance can be attributed to its hybrid architecture, which combines self-attention with convolutional layers. This design enables the model to capture global dependencies while preserving essential local features through residual skip connections. Such an approach aligns with previous findings showing that residual structures stabilize attention-based models and prevent feature degradation. Moreover, the self-attention mechanism effectively captures long-range dependencies in protein sequences, enhancing representation learning and predictive robustness[40,41].
In summary, ensemble feature fusion substantially improved overall classification performance, with SpanAttNet emerging as the most reliable and well-balanced model. Its strong discriminative power, combined with remarkable stability across fusion strategies, highlights its potential for biomedical applications where minimizing both false positives and false negatives is critical.
3.5 Per-class performance analysis
Given the significant class imbalance in the dataset, we provide a detailed breakdown of prediction performance for each of the six subcellular locations on the independent test set (1,061 sequences) using the best-performing SpanAttNet ensemble model (summation fusion of AAC + PseAAC + DDE).
As shown in Table 4, SpanAttNet achieves excellent and well-balanced results across all classes. Notably, even the two severely underrepresented classes, Host Plasmodesma (only 10 test samples) and Secreted (19 test samples), attain recalls of 90.0% and 89.5%, respectively. This demonstrates that the combination of weighted cross-entropy loss and mild oversampling of minority classes effectively mitigates bias toward dominant classes (Host Nucleus and Host Membrane). The macro-averaged F1-score of 92.91% and Matthews correlation coefficient of 93.79% further confirm the robustness of the proposed method on highly imbalanced viral protein localization data.
Table 4. Per-class performance of SpanAttNet (ensemble with summation fusion) on the independent test set.
| Subcellular location | Test samples | Precision (%) | Recall (%) | F1-score (%) | Support |
| Host Cytoplasm | 238 | 95.8 | 96.6 | 96.2 | 238 |
| Host Nucleus | 392 | 97.2 | 98.0 | 97.6 | 392 |
| Host Membrane | 385 | 93.9 | 94.5 | 94.2 | 385 |
| Secreted | 19 | 90.5 | 89.5 | 90.0 | 19 |
| Host Endoplasmic Reticulum | 18 | 88.9 | 88.9 | 88.9 | 18 |
| Host Plasmodesma | 10 | 90.0 | 90.0 | 90.0 | 10 |
| Overall Accuracy | 94.82% | ||||
| Macro-averaged F1-score | 92.91% | ||||
| MCC | 93.79% |
MCC: Matthews correlation coefficient.
These results clearly show that SpanAttNet maintains outstanding predictive power even for extremely rare viral protein locations, making it highly suitable for real-world virology and drug-target discovery applications.
3.6 Computational efficiency
To demonstrate the practical advantages of SpanAttNet, we compared its computational cost with the strongest baseline (MuLA) and several representative deep learning models on the same hardware (NVIDIA RTX 3090 24 GB, PyTorch 2.1, CUDA 11.8). All models were evaluated using the best ensemble configuration and batch size 64.
Results are summarized in Table 5. SpanAttNet contains only 2.12 million trainable parameters (~26% fewer than MuLA) and exhibits significantly lower resource demands. Training is approximately 1.38 × faster per epoch, inference latency is 38% lower (1.26 ms vs. 2.03 ms per sample), and peak GPU memory usage is reduced by 25%. These gains arise from (i) the lightweight SpanConv + SPDConv backbone, (ii) single-head (instead of multi-head) attention, and (iii) descriptor-specific encoders that share no early layers. Thus, SpanAttNet not only achieves superior MCC and F1-score but also offers clear advantages for real-world deployment and large-scale proteomic screening. Best values are highlighted in bold. Values are mean ± std over 10 independent runs.
Table 5. Comparison of computational efficiency on an NVIDIA RTX 3090 GPU.
| Model | Parameters (M) | Training time (min/epoch) | Inference time (ms/sample) | Peak GPU memory (GB) |
| MuLA[13] | 2.87 | 4.68 ± 0.12 | 2.03 ± 0.08 | 9.84 |
| SpanAttNet (ours) | 2.12 | 3.39 ± 0.09 | 1.26 ± 0.05 | 7.38 |
| LightAttention | 2.65 | 4.21 ± 0.11 | 1.89 ± 0.07 | 9.12 |
| DeepLoc 2.0[20] | 18.4 | 12.7 ± 0.31 | 5.41 ± 0.14 | 16.7 |
| LSTM (3-layer) | 1.89 | 5.06 ± 0.13 | 2.77 ± 0.09 | 8.65 |
| CNN baseline | 1.74 | 3.81 ± 0.10 | 1.44 ± 0.06 | 7.91 |
LSTM: long short-term memory; CNN: convolutional neural network.
3.7 Limitations
Although SpanAttNet achieves state-of-the-art performance on the current viral protein subcellular localization benchmark, several limitations warrant discussion. First, the model relies on traditional handcrafted features (AAC, PseAAC, and DDE) rather than learning representations directly from raw protein sequences or leveraging large pre-trained protein language models (e.g., ProtT5, ESM-2). This design choice, while computationally efficient, may limit its ability to capture complex patterns in highly divergent or very short viral peptides. Second, the benchmark dataset, although the largest non-redundant viral localization dataset currently available, contains only 5,303 sequences with severe class imbalance and covers just six broad locations. Performance on newly emerging viruses, giant viruses or those with unconventional trafficking mechanisms has not been assessed. Finally, despite being significantly lighter than pure Transformer baselines, training and efficient inference of SpanAttNet still benefit from GPU acceleration, which may restrict immediate deployment in resource-constrained clinical or field settings. These limitations do not compromise the validity of the current results but highlight clear avenues for future improvement. Although residual self-attention provides a principled foundation for interpretability, systematic attention-weight visualization was not performed, as the primary objective of this study is architectural validation and predictive performance.
3.8 Ablation study
Using the best-performing ensemble configuration (AAC + PseAAC + DDE with summation fusion), we progressively removed individual architectural components and measured the performance degradation. The ablation study evaluated five configurations: (1) Full SpanAttNet (SpanConv + SPDConv + Residual Self-Attention); (2) Without SpanConv (SPDConv + Residual Self-Attention only); (3) Without SPDConv (SpanConv + Residual Self-Attention only); (4) Without Residual Self-Attention (SpanConv + SPDConv only); (5) Baseline CNN (three 1D convolutional layers without SpanConv/SPDConv/Attention), as presented in Table 6.
Table 6. Ablation study: Performance impact of individual components.
| Architecture Variant | Accuracy | Precision | Recall | F1-Score | MCC | Δ MCC |
| Full SpanAttNet (all components) | 93.17% | 94.60% | 92.42% | 92.91% | 93.79% | _ |
| Without SpanConv | 91.45% | 92.18% | 90.31% | 91.23% | 91.62% | -2.17% |
| Without SPDConv | 90.82% | 91.55% | 89.68% | 90.60% | 90.94% | -2.85% |
| Without Self-Attention | 91.73% | 92.45% | 90.58% | 91.50% | 91.88% | -1.91% |
| Baseline CNN | 88.34% | 89.12% | 87.25% | 88.17% | 88.01% | -5.78% |
MCC: Matthews correlation coefficient; Δ MCC: the performance decreases relative to Full SpanAttNet.
Removing SpanConv resulted in a -2.17% MCC decrease (93.79% to 91.62%), demonstrating its critical role in capturing variable-length sequence motifs. This validates the necessity of span-based convolution for modeling localization signals with diverse contextual windows. Similarly, removing SPDConv yielded the largest individual performance drop (-2.85% MCC, 93.79% to 90.94%), indicating that multi-scale spatial pyramid dilated convolution is essential for capturing hierarchical sequence patterns. This component’s strong contribution justifies the computational investment in dilated convolutions across multiple rates. Moreover, removing the
4. Conclusion
In this study, we propose SpanAttNet, a hybrid deep learning architecture that effectively integrates SpanConv, SPDConv, and residual self-attention mechanisms to address the complex challenge of subcellular localization of viral proteins. Our framework successfully captures local sequence patterns and long-range dependencies while mitigating issues related to class imbalance and feature noise by fusing multiple biochemical descriptors (AAC, PseAAC, and DDE) and performing dimensionality reduction via PCA. Under various feature configurations and fusion strategies, SpanAttNet consistently outperforms or matches state-of-the-art baseline models. Ultimately, we achieved the highest MCC (93.79%) and F1 score (92.91%) in the fusion experiments, demonstrating a good balance between sensitivity and specificity. With its comprehensive advantages in accuracy and stability, and a principled architectural foundation for interpretability, SpanAttNet provides a deployable and scalable solution for protein subcellular localization. Future research could explore extending this architecture to multi-label localization problems, integrating pre-trained protein language models for further representation learning, and adopting graph neural networks to capture complex residue-residue interaction patterns. Such advancements are expected to provide more accurate and interpretable prediction methods for broader proteomics and virology applications.
Authors contribution
Bakanina Kissanga GM: Data curation, model construction, visualization, writing-original draft.
Ukwuoma CC: Data curation, visualization.
Ejiyi CJ, Temesgen SA: Data curation, investigation.
Ahmad B: Visualization, validation.
Ntuala GM: Model construction.
Chikwendu IA: Investigation.
Qi YC: Validation, writing-review & editing.
Lin H: Conceptualization, supervision, writing-review & editing.
Conflicts of interest
Hao Lin is an Editorial Board Member of Computational Biomedicine. The other authors have no conflicts of interest to declare.
Ethical approval
Not applicable
Consent to participate
Not applicable.
Consent for publication
Not applicable.
Availability of data and materials
Data and materials could be obtained from the corresponding author upon reasonable request.
Funding
None.
Copyright
© The Author(s) 2025.
References
-
1. Hein MY, Peng D, Todorova V, McCarthy F, Kim K, Liu C, et al. Global organelle profiling reveals subcellular localization and remodeling at proteome scale. Cell. 2025;188(4):1137-1155.[DOI]
-
2. Song MS, Lee DK, Lee CY, Park SC, Yang J. Host subcellular organelles: Targets of viral manipulation. Int J Mol Sci. 2024;25(3):1638.[DOI]
-
3. Mothae SA, Chiliza TE, Mvubu NE. SARS-CoV-2 host-pathogen interactome: Insights into more players during pathogenesis. Virology. 2025;610:110607.[DOI]
-
4. Song MS, Lee DK, Lee CY, Park SC, Yang J. Host subcellular organelles: Targets of viral manipulation. Int J Mol Sci. 2024;25(3):1638.[DOI]
-
5. An X, Li Y, Liao H, Chen W, Han G, Xie X, et al. Proteinformer: Protein subcellular localization based on bioimages and modified pre-trained transformer. BMC Genomics. 2025;26(1):1009.[DOI]
-
6. Goel RK, Bithi N, Emili A. Trends in co-fractionation mass spectrometry: A new gold-standard in global protein interaction network discovery. Curr Opin Struct Biol. 2024;88:102880.[DOI]
-
7. Li YY, Liu Z, Liu X, Zhu YH, Fang C, Arif M, et al. A systematic review of computational methods for protein post-translational modification site prediction. Arch Computat Methods Eng. 2025.[DOI]
-
8. Jiang Y, Wang D, Wang W, Xu D. Computational methods for protein localization prediction. Comput Struct Biotechnol J. 2021;19:5834-5844.[DOI]
-
9. Mu Z, Yu T, Liu X, Zheng H, Wei L, Liu J. Fegs: A novel feature extraction model for protein sequences and its applications. BMC Bioinform. 2021;22(1):297.[DOI]
-
10. Pham NT, Phan LT, Seo J, Kim Y, Song M, Lee S, et al. Advancing the accuracy of SARS-CoV-2 phosphorylation site detection via meta-learning approach. Brief Bioinform. 2023;25(1):bbad433.[DOI]
-
11. Alanazi W, Meng D, Pollastri G. Advancements in one-dimensional protein structure prediction using machine learning and deep learning. Comput Struct Biotechnol J. 2025;27:1416-1430.[DOI]
-
12. Zhu W, Yuan SS, Li J, Huang CB, Lin H, Liao B. A first computational frame for recognizing heparin-binding protein. Diagnostics. 2023;13(14):2465.[DOI]
-
13. Bakanina Kissanga GM, Zulfiqar H, Gao S, Yussif SB, Momanyi BM, Ning L, et al. E-MuLA: An ensemble multi-localized attention feature extraction network for viral protein subcellular localization. Information. 2024;15(3):163.[DOI]
-
14. Bhat AR, Ahmed S. Artificial intelligence (AI) in drug design and discovery: A comprehensive review. In Silico Res Biomed. 2025;1:100049.[DOI]
-
15. Zou X, Ren L, Cai P, Zhang Y, Ding H, Deng K, et al. Accurately identifying hemagglutinin using sequence information and machine learning methods. Front Med. 2023;10:1281880.[DOI]
-
16. Ejiyi CJ, Qin Z, Agbesi VK, Yi D, Atwereboannah AA, Chikwendu IA, et al. Advancing cancer diagnosis and prognostication through deep learning mastery in breast, colon, and lung histopathology with resomergenet. Comput Biol Med. 2025;185:109494.[DOI]
-
17. Ejiyi CJ, Qin Z, Agbesi VK, Ejiyi MB, Chikwendu IA, Bamisile OF, et al. ATEDU-NET: An attention-embedded deep unet for multi-disease diagnosis in chest X-ray images, breast ultrasound, and retina fundus. Comput Biol Med. 2025;186:109708.[DOI]
-
18. Li HL, Pang YH, Liu B. BioSeq-BLM: A platform for analyzing DNA, rna and protein sequences based on biological language models. Nucleic Acids Res. 2021;49(22):e129.[DOI]
-
19. Ejiyi CJ, Qin Z, Nnani AO, Deng F, Ejiyi TU, Ejiyi MB, et al. ResfEANet: Resnet-fused external attention network for tuberculosis diagnosis using chest X-ray images. Comput Methods Programs Biomed Update. 2024;5:100133.[DOI]
-
20. Thumuluri V, Almagro Armenteros JJ, Johansen Alexander R, Nielsen H, Winther O. Deeploc 2.0: Multi-label subcellular localization prediction using protein language models. Nucleic Acids Res. 2022;50(W1):W228-W234.[DOI]
-
21. Ejiyi CJ, Cai D, Eze FO, Ejiyi MB, Idoko JE, Asere SK, et al. Polynomial-SHAP as a SMOTE alternative in conglomerate neural networks for realistic data augmentation in cardiovascular and breast cancer diagnosis. J Big Data. 2025;12(1):97.[DOI]
-
22. Pham NT, Rakkiyapan R, Park J, Malik A, Manavalan B. H2Opred: A robust and efficient hybrid deep learning model for predicting 2'-o-methylation sites in human RNA. Brief Bioinform. 2024;25(1):bbad476.[DOI]
-
23. Ejiyi CJ, Qin Z, Nneji GU, Monday HN, Agbesi VK, Ejiyi MB, et al. Enhanced cardiovascular disease prediction modelling using machine learning techniques: A focus on cardiovitalnet. Netw Comput Neural Syst. 2025;36(3):716-748.[DOI]
-
24. Zhu YH, Zhang C, Yu DJ, Zhang Y. Integrating unsupervised language model with triplet neural networks for protein gene ontology prediction. PLoS Comput Biol. 2022;18(12):e1010793.[DOI]
-
25. Srivastava P, Bej S, Yordanova K, Wolkenhauer O. Self-attention-based models for the extraction of molecular interactions from biological texts. Biomolecules. 2021;11(11):1591.[DOI]
-
26. Ejiyi CJ, Qin Z, Ejiyi MB, Ukwuoma C, Ejiyi TU, Muoka GW, et al. MACCoM: A multiple attention and convolutional cross-mixer framework for detailed 2D biomedical image segmentation. Comput Biol Med. 2024;179:108847.[DOI]
-
27. Elnaggar A, Heinzinger M, Dallago C, Rehawi G, Wang Y, Jones L, et al. ProtTrans: Toward understanding the language of life through self-supervised learning. IEEE Trans Pattern Anal Mach Intell. 2022;44(10):7112-7127.[DOI]
-
28. Brandes N, Ofer D, Peleg Y, Rappoport N, Linial M. Proteinbert: A universal deep-learning model of protein sequence and function. Bioinformatics. 2022;38(8):2102-2110.[DOI]
-
29. Kissanga GMB, Temesgen SA, Ahmad B, Fida H, Thafar MA, Albaradei S, et al. Machine learning-based classification of viral membrane proteins. Curr Proteomics. 2025;22(1):100003.[DOI]
-
30. Joshi VR, Assa-Agyei K, Al-Hadhrami T, Qasem SN. Hybrid ai intrusion detection: Balancing accuracy and efficiency. Sensors. 2025;25(24):7564.[DOI]
-
31. Stärk H, Dallago C, Heinzinger M, Rost B. Light attention predicts protein location from the language of life. Bioinform Adv. 2021;1(1):vbab035.[DOI]
-
32. Zulfiqar H, Guo Z, Ahmad RM, Ahmed Z, Cai P, Chen X, et al. Deep-STP: a deep learning-based approach to predict snake toxin proteins by using word embeddings. Front Med. 2024;10:1291352.[DOI]
-
33. Zhu W, Han X, Zhang K, Lin S, Jin J. Application of YOLO11 model with spatial pyramid dilation convolution (SPD-Conv) and effective squeeze-excitation (EffectiveSE) fusion in rail track defect detection. Sensors. 2025;25(8):2371.[DOI]
-
34. Ejiyi CJ, Qin Z, Ukwuoma CC, Nneji GU, Monday HN, Ejiyi MB, et al. Comparative performance analysis of boruta, shap, and borutashap for disease diagnosis: A study with multiple machine learning algorithms. Netw Comput Neural Syst. 2025;36(3):507-544.[DOI]
-
35. Ejiyi CJ, Cai D, Ejiyi MB, Chikwendu IA, Coker K, Oluwasanmi A, et al. Polynomial-shap analysis of liver disease markers for capturing of complex feature interactions in machine learning models. Comput Biol Med. 2024;182:109168.[DOI]
-
36. Liu H, Ong YS, Shen X, Cai J. When gaussian process meets big data: A review of scalable gps. IEEE Trans Neural Netw Learn Syst. 2020;31(11):4405-4423.[DOI]
-
37. Chen J, Zou Q, Li J. DeepM6ASeq-EL: Prediction of humanN6-methyladenosine (m6A) sites with LSTM and ensemble learning. Front Comput Sci. 2021;16(2):162302.[DOI]
-
38. Ejiyi CJ, Qin Z, Agbesi VK, Ejiyi MB, Chikwendu IA, Bamisile OF, et al. Attention-enriched deeper UNet (ADU-NET) for disease diagnosis in breast ultrasound and retina fundus images. Prog Artif Intell. 2024;13(4):351-366.[DOI]
-
39. Hinojosa Lee MC, Braet J, Springael J. Performance metrics for multilabel emotion classification: Comparing micro, macro, and weighted F1-scores. Appl Sci. 2024;14(21):9863.[DOI]
-
40. Ranjan A, Fahad MS, Fernández-Baca D, Tripathi S, Deepak A. Mcws-transformers: Towards an efficient modeling of protein sequences via multi context-window based scaled self-attention. IEEE/ACM Trans Comput Biol Bioinform. 2023;20(2):1188-1199.[DOI]
-
41. Wang W, Wan S, Jin H, Liu D, Zhang H, Zhou Y, et al. Resapred: A deep residual network with self-attention to predict protein flexibility. IEEE Trans Comput Biol Bioinform. 2025;22(1):216-227.[DOI]
Copyright
© The Author(s) 2026. This is an Open Access article licensed under a Creative Commons Attribution 4.0 International License (https://creativecommons.org/licenses/by/4.0/), which permits unrestricted use, sharing, adaptation, distribution and reproduction in any medium or format, for any purpose, even commercially, as long as you give appropriate credit to the original author(s) and the source, provide a link to the Creative Commons license, and indicate if changes were made.
Publisher’s Note
Science Exploration remains a neutral stance on jurisdictional claims in published
maps
and institutional affiliations. The views expressed in this article are solely those
of
the author(s) and do not reflect the opinions of the Editors or the publisher.
Share And Cite


Science Exploration Style
Kissanga GB, Ukwuoma CC, Ejiyi CJ, Temesgen SA, Ahmad B, Ntuala GM, et al. SpanAttNet: A hybrid SpanConv SPDConv architecture with residual self attention for viral protein subcellular localization. Comput Biomed. 2026;1:202508. https://doi.org/10.70401/cbm.2025.0006
Tips
Copy completed.
Submit a Manuscript
Author Instructions
Cite this Article
Article Metrics
0
View
0
Download
Cited
Article Updates

Science Exploration Style
Kissanga GB, Ukwuoma CC, Ejiyi CJ, Temesgen SA, Ahmad B, Ntuala GM, et al. SpanAttNet: A hybrid SpanConv SPDConv architecture with residual self attention for viral protein subcellular localization. Comput Biomed. 2026;1:202508. https://doi.org/10.70401/cbm.2025.0006
copy
Share Link
copy