Drug-target affinity prediction based on multi-source information and graph convolutional network
Xiujuan Lei
1,*

,
Xin Tang
1
,
Yuchen Zhang
2
*Correspondence to:
Xiujuan Lei, School of Artificial Intelligence and Computer Science, Shaanxi Normal University, Xi’an 710062, Shaanxi, China.
E-mail: xjlei@snnu.edu.cn
Comput Biomed. 2026;1:202520. 10.70401/cbm.2026.0007
Received: October 24, 2025Accepted: January 08, 2026Published: January 19, 2026
Abstract
Aims: Drug-target affinity (DTA) prediction is crucial for drug discovery and repositioning. However, existing deep learning-based methods often overlook the synergy between the topological structure of DTA networks and the multimodal features of drugs and targets themselves.
Methods: This study proposes a new method, MIGDTA, a DTA prediction method based on multi-source information and graph convolutional network (GCN), which enhances prediction accuracy by integrating local features with global interaction information. MIGDTA first constructs a drug molecular graph, a target protein graph, and a DTA network, while computing molecular fingerprints and protein descriptors. Subsequently, it employs a graph isomorphism network to learn graph features, a GCN to capture network features, and a multilayer prceptron to encode biological features. Then, it refines heterogeneous network and graph features iteratively through the GCN, and finally concatenates the fused features with biological features for affinity prediction.
Results: Comparative experiments on benchmark datasets demonstrate that MIGDTA significantly outperforms existing methods. On the Davis dataset, compared to the best baseline method, MIGDTA reduces mean squared error (MSE) to 0.185, increases CI by 0.006, and improves
Conclusion: Feature ablation studies verify the core role of graph features in modeling local structures and network features in capturing global topology, along with the supplementary importance of biological features. Comparative analyses of feature integration approaches confirm the effectiveness of the feature refinement module in fusing multimodal features and enhancing model discriminability.
Keywords
Graph isomorphism network, multi-source information fusion, drug-target affinity, graph convolutional network
1. Introduction
Drug-Target Interaction (DTI) directly influences drug efficacy and safety. Drug-Target Affinity (DTA), which includes metrics such as dissociation constant (Kd), inhibition constant (Ki), and half-maximal inhibitory concentration (IC50), quantifies the strength of DTI[1]. While biochemical assays remain the gold standard for DTA measurement, their labor-intensive nature and prolonged timelines make them impractical for high-throughput applications. Developing accurate computational prediction methods as an alternative can eliminate most experiments, thereby accelerating drug discovery. By predicting the affinity of numerous compounds against target proteins, researchers can rapidly identify promising drug candidates. Furthermore, affinity prediction toward off-target proteins enables systematic evaluation of drug safety profiles, and profiling approved drugs against disease-associated proteins beyond their primary targets may reveal novel therapeutic mechanisms and open new avenues for drug repurposing[2].
Conventional computational approaches for DTA prediction, such as molecular dynamics simulation and molecular docking[3], heavily rely on high-resolution 3D structural data of drug-target complexes. However, their computational intensity and prolonged execution time pose significant bottlenecks, ultimately constraining their broader application.
Recent advances in experimental biotechnology and bioinformatics have facilitated the establishment of numerous DTA-related databases, providing critical support for data-driven Deep Learning (DL) applications in DTA prediction. Current DL-based DTA prediction methods typically employ molecular representations of drugs and target proteins as input, leverage diverse DL models for feature extraction, and ultimately integrate these features through a multi-layer perceptron (MLP) to predict DTA. These approaches can be categorized into three input modalities: 1D sequences, 2D graphs, and multimodal inputs[4].
Sequences encompass drug SMILES[5] strings, protein amino acid sequences, and relevant biological descriptors, encoding compositional and sequential relationships of molecules. Representative models include DeepDTA[6], which employs a convolutional neural network (CNN) to learn sequential features. WideDTA[7] expands feature diversity by integrating protein domains, motifs, and maximum common drug substructures. DeepCDA[8] enhances feature extraction through hybrid CNN and Long-Short-Term Memory (LSTM) architectures with attention-based fusion. MGPLI[9] processes character level and fragment level sequences via Transformer-CNN encoders, leveraging highway layers to reduce redundancy.
Graphs encompass molecular graphs and protein contact maps, which capture spatial-topological relationships between chemical components. GraphDTA[10] pioneers the use of four types of graph neural networks (GNNs) for drug molecular graph feature extraction, whereas MGraphDTA[11] combines residual graph convolutional networks (GCNs) and multi-branch CNNs to capture local-global patterns from drug graphs and protein sequences. SubDTA[12] introduces probabilistic matrices and contrastive learning between drug molecular graphs and their subgraph representations for multi-scale feature learning. DGraphDTA[13] constructs dual GCN encoders to extract graph features from both drug and target protein graph representations.
Multimodal inputs integrate 1D sequences and 2D graphs, further considering the synergistic and complementary effects between multimodal data to comprehensively model drug-target binding interactions. DeepGS[14] combines Smi2Vec and ProtVec-based sequence embeddings with drug molecular graphs. AttentionMGT-DTA[15] introduces target protein pocket graphs and ESM-2[16]-generated sequence features, uses graph Transformers for graph feature extraction, and employs cross-attention mechanisms to fuse cross-modal features. MGSDTA[17] simultaneously incorporates ProtVec and molVec based pre-trained sequence embeddings with drug and target graphs, implements dual-branch feature extraction, and applies weighted fusion modules to balance the importance of multimodal features. NHGNN-DTA[18] innovatively utilizes a bidirectional LSTM-based adaptive feature generator to create initial node features for drug-target hybrid graphs, then combines prediction results from sequence-based features and hybrid graph-based features for final affinity prediction.
Current DTA prediction methods have evolved from single-modal to multimodal frameworks, yet two critical limitations persist. First, existing methods predominantly focus on extracting intrinsic features of drugs and targets while neglecting the topological correlation information embedded within DTA networks. Second, conventional biological features such as molecular fingerprints and protein descriptors remain underutilized in multimodal frameworks, failing to fully exploit the multi-faceted representation of drug-target pairs. To address these gaps, this study proposes MIGDTA, a DTA prediction method based on multi-source information and GCN, which introduces novel strategies through synergistic modeling of heterogeneous data and topology-driven feature refinement mechanisms.
Specifically, MIGDTA first incorporates multiple molecular fingerprints and protein descriptors as biological features at the local level to enhance the discriminative power of graph features, while introducing the DTA network at the global level. Subsequently, it employs a GIN-CNN encoder to extract graph features, a GCN to capture network topological features, and an MLP to encode biological features. These heterogeneous features are then refined iteratively through GCN-based propagation within the DTA network to generate fused features. Finally, the biological features are concatenated with the refined fused features, and the combined representation is fed into an MLP for affinity prediction.
The contributions of MIGDTA include the following aspects:
(1) By introducing diverse molecular fingerprints and protein descriptors, MIGDTA provides comprehensive chemical property characterization of drugs and targets, significantly enhancing the expressiveness of feature representations.
(2) Through the construction of a DTA network, MIGDTA captures the global topological association between drugs and targets. The feature refinement module iteratively updates graph features and network features, effectively integrating local graph structures with global network information while eliminating redundancy in heterogeneous features.
(3) Comparative experiments on benchmark datasets demonstrate the superior performance of MIGDTA; feature ablation studies quantify the contributions of different features to the efficacy of the model; and feature fusion strategy selection experiments validate the scientific rationale of the refinement module. Finally, a case study on Erlotinib confirms the drug repositioning capability of MIGDTA.
2. Materials and Methods
2.1 Datasets
This study employed commonly used benchmark datasets in the DTA prediction: Davis[19] and KIBA[20]. The Davis dataset contains 30,056 affinity values between 68 drugs and 442 targets, measured by Kd. However, due to the excessively wide distribution range of Kd, we converted it to the logarithmic space, denoted as pKd, as the affinity measurement. The conversion formula is as follows:
The affinity distribution in the Davis dataset is highly imbalanced, with values concentrated around 5. The KIBA dataset includes 118,254 affinity values between 2,111 drugs and 229 targets, with the KIBA score serving as the affinity measurement. The labels in the KIBA dataset approximately follow a normal distribution, primarily concentrated in the range of 10~12.
2.2 Overview of MIGDTA
MIGDTA consists of four main stages:
(1) In multi-representation construction stage, MIGDTA constructs a molecular graph of drug and a protein graph of target, respectively. Feature selection is performed on three types of molecular fingerprint representations (Morgan fingerprints, MACCS fingerprints, Avalon fingerprints) and four types of protein descriptors (Composition, Transformation and Distribution (CTD), Geary, Pseudo Amino Acid Composition (PAAC), Quasi-Sequence-order (QSorder)) are used to obtain molecular fingerprint vectors and protein descriptor vectors. Simultaneously, a DTA network is constructed, where drugs and targets serve as nodes and normalized affinity values as edges.
Feature extraction stage is divided into three branches. Graph feature extraction: A multi-layer GIN is used to extract graph features of drugs and targets, which are then stacked and further processed by CNN to extract hierarchical features. Network feature extraction: A GCN is employed to extract features from the DTA network. Biological feature extraction: An MLP is used to extract features from drug molecular fingerprints and target protein descriptors.
In Feature refinement stage, MIGDTA combines the graph features and network features of drugs and targets to serve as new node features for the DTA network. These features are then input into a three-layer GCN for feature updating, resulting in fused features.
Finally, in Affinity prediction stage, MIGDTA concatenates the biological features with the fused features to form the final drug and target representations, which are then processed through an MLP to generate the DTA prediction value.
The overall framework of MIGDTA is illustrated in Figure 1.
Figure 1. Overall framework of MIGDTA. GCN: graph convolutional network; GIN: graph isomorphism network; CNN: convolutional neural network; MLP: multi-layer perceptron; DTA: drug-target affinity; CTD: composition, transition and distribution; QSO: Quasi-Sequence-order; PAAC: Pseudo Amino Acid Composition; GAT: graph attention network; PDB: protein data bank.
2.3 Multi-representation construction
2.3.1 Graph representation construction
Drug Molecular Graph Construction: Let D denote the sets of drugs in the dataset. Given a drug Di ϵ D, each drug can be represented as a graph with atoms as nodes. The corresponding molecular graph is denoted as
The adjacency matrix
Target Protein Graph Construction: Let T denote the sets of targets in the dataset. Given a target protein Ti ϵ T, each protein is represented as a graph with amino acids as nodes. The corresponding protein graph is denoted as
The 3D structures predicted by AlphaFold2 are processed as follows. Following the methodology of Bi et al.[22], a distance threshold of S = 8 Å is applied to compute the adjacency matrix
2.3.2 Sequence descriptors construction
Molecular Fingerprint Construction: For a given drug Di ϵ D, its SMILES string is converted into molecular fingerprints using RDKit. Three fingerprint techniques: MACCS, Morgan, and Avalon are employed to generate complementary structural representations of the drug molecule, corresponding to circular fingerprints, path-based fingerprints, and substructure-based fingerprints, respectively.
(1) Morgan fingerprint is a 1,024-dimensional binary vector, capturing atomic neighborhoods and their local chemical environments[23] with a radius of 2.
(2) MACCS fingerprint, represented as a 167-dimensional binary vector, encodes the presence of 166 predefined molecular substructures or functional groups[24].
(3) Avalon fingerprint is a 512-dimensional binary vector that maps atomic features, bond characteristics, and local chemical environments to a fixed-length representation through hash functions[25].
The concatenation of these three fingerprints produces a 1,703-dimensional feature vector. To select the most informative and least redundant feature subset, feature selection is performed: zero-variance features are first removed, followed by iterative elimination of highly correlated features (Pearson correlation coefficient > 0.9) based on the correlation matrix. The final drug feature vectors retain 1,387 dimensions for drugs in the Davis dataset and 1,689 dimensions for those in the KIBA dataset.
Protein Descriptor Construction: For a target protein Ti ϵ T, four descriptors: CTD, Geary, PAAC, and Qsorder are computed from its amino acid sequence using the ifeaturepro Python toolkit, providing a comprehensive representation of physicochemical and sequential properties:
CTD descriptor is a 234-dimensional vector calculated by composition, transition, and distribution properties of amino acids[26].
Geary descriptor is a 240-dimensional vector calculated by sequence autocorrelation across varying amino acid distances[26].
PAAC descriptor is a 50-dimensional vector constructed by amino acid composition with sequence order and attribute correlations[27].
Qsorder descriptor is a 100-dimensional vector derived by physicochemical distance matrices to characterize spatial relationships between residues[27].
These descriptors are concatenated into a 624-dimensional feature vector. Applying the same feature selection method as above, the final protein feature vectors retain 663 dimensions for targets in the Davis dataset and 789 dimensions for those in the KIBA dataset.
2.3.3 DTA affinity network construction
The affinity values between drugs and targets in the dataset are organized into an affinity matrix
The DTA network is inherently a bipartite weighted graph Gn = {Vn, En, Wn}, where: VN represents the union of drug and target nodes and |Vn| = |D| + |T|, En denotes edges between drug-target pairs with known affinities, and contains edge weights derived from the normalized drug-target binding affinities, scaled to the range [0, 1] via min-max normalization.
The adjacency matrix An ϵ R|D|+|T|×|D|+|T| of Gn is formulated as:
The initial feature matrix of Gn can be represented as:
where Xdn corresponds to the first |D| rows of An, concatenated with a one-hot node type encoding (0, 1) indicating drug nodes. Xtn corresponds to the last |T| rows of An, concatenated with a one-hot encoding (1, 0) indicating target nodes.
2.4 Feature extraction
2.4.1 Graph feature exaction
To address gradient vanishing and node over-smoothing issues caused by increasing GNN depth, a 1D-CNN is introduced, enabling inter-layer feature interaction to comprehensively capture structural graph information. First, the drug molecular graph
Inspired by the Weisfeiler-Lehman (WL) graph isomorphism test, GIN approximates the maximum discriminative power of GNNs[28]. The feature
where
The node feature matrices from layers 1 to L are stacked into two 3D tensors
Subsequently, a 1D-CNN with a kernel size of (1,1) compresses the layer dimension L to 1 for inter-layer aggregation:
Where
2.4.2 Biological feature extraction
The drug molecular fingerprint vector
Here, MLPd and MLPt consist of three fully connected layers with ReLU activation functions.
2.4.3 Network feature extraction
Network pharmacology, grounded in systems biology, emphasizes the importance of interaction patterns in DTA networks for modeling DTIs[29]. To capture complex relational and topological features, we employ a GCN on the DTA network.
Given the adjacency matrix An and initial feature matrix Xn of the DTA network Gn, the feature update result Hn(l) at the l-th GCN layer is defined as:
Where Hn(l-1) denotes the node feature matrix at layer, with Hn(0) = Xn, An(0) = dropEdge(An). The dropEdge regularization layer randomly masks edges in An with probability p to mitigate over-smoothing and enhance generalization.
Through iterative neighborhood aggregation across L GCN layers, each node progressively integrates information from its high-order neighbors. The final network-based representations of drug Di and target Tj are derived as:
Where Hn[i, :] and Hn[|D| +j, :] correspond to the i-th row (drug) and |D|+j-row (target) of the network feature matrix, respectively.
2.5 Feature refinement
Following the feature extraction stage, we obtain graph features
The study adopts a differential-synergistic feature fusion strategy, where element-wise addition and subtraction were performed on drug molecular features and target protein features to capture binding synergism and binding divergence, respectively. The resulting features are then concatenated and fed into the subsequent model, thereby improving the accuracy of affinity prediction. For drug node Di and target node Tj in the DTA network, their graph and network features are fused to obtain
where || denotes concatenation. The fused features
Xrn along with the adjacency matrix An, is fed into a K-layer GCN encoder for feature updating, ensuring that interacting drugs and targets become closer in the feature space. The refinement process also incorporates a dropEdge layer before GCN:
The refined features for drug Di and target Tj are extracted as
where Hrn[i] and Hrn[|D| + j] correspond to the i-th row and |D| + j-row of the network feature matrix, respectively.
2.6 Affinity prediction
The biological features
The drug-target pair representation is obtained by concatenating
The MLP comprises three fully connected layers, with a dropout layer and a ReLU activation layer between each pair of adjacent layers. The final fully connected layer outputs the predicted affinity value.
As the binding affinity prediction is formulated as a regression task, the MSE loss is adopted to compute the regression loss:
where
3. Results and Discussion
3.1 Experimental settings
3.1.1 Experiment environment
MIGDTA was implemented using the PyTorch framework and trained on an NVIDIA 3090 GPU with 32GB memory. The Adam optimizer was employed, and other training-related hyperparameters, including the maximum number of training epochs, batch size, learning rate, and dropout rate, are summarized in Table 1.
Table 1. Hyperparameters setting of MIGDTA.
| Hyperparameters | Ranges | Optimal value |
| Optimizer | - | Adam |
| Epochs | - | 2000 |
| Batch size | - | 512 |
| Learning rate | - | 0.0002 |
| Dropout rate | - | 0.2 |
| DropEdge rate | - | 0.2 |
| Number of GIN layers in Graph feature extraction | - | 3 |
| Hidden layer dimensions of GIN in Graph feature extraction | - | 128 |
| Number of MLP layers in Biological feature extraction | {2, 3, 4} | 3 |
| Hidden layer dimensions of MLP in Biological feature extraction | {128, 256} | 128 |
| Number of GCN layers in Network feature extraction | {1, 2, 3} | 3 |
| Hidden layer dimensions of GCN in Network feature extraction | {128, 256} | 256 |
| Number of GCN layers in Feature refinement | {1, 2, 3} | 2 |
| Hidden layer dimensions of GCN in Feature refinement | {128, 256} | 256 |
GIN: graph isomorphism network; MLP: multi-layer perceptron; GCN: graph convolutional network.
3.1.2 Hypermeters setting
Key architectural hyperparameters of MIGDTA, such as the number of neural network layers and hidden layer dimensions for the GIN in Graph feature extraction, the MLP in biological feature extraction, and the GCN in Network feature extraction and Feature refinement, were determined via 5-fold cross-validation (5-CV) on the Davis training set. Table 1 additionally specifies the experimental search ranges and finalized configurations for these hyperparameters.
3.1.3 Evaluation metrics
This study employed three widely adopted metrics in the field: Mean Squared Error (MSE), Concordance index (CI), and the modified coefficient of determination
where yi and
where Z is a normalization factor equal to the number of valid pairs in test set, and h(.) is a step function:
CI evaluates the model’s ranking capability by measuring the consistency between predicted and true affinity orders for randomly selected pairs. Higher CI values reflect superior performance.
where r2 and
3.2 Performance comparison
We comprehensively compared MIGDTA with 7 other DL-based DTA prediction methods to validate its superior performance. The baseline methods are described as follows:
DeepDTA employs CNNs to learn feature representations from drug SMILES strings and protein amino acid sequences separately.
DeepCDA utilizes CNN-LSTM networks to extract features from drug SMILES sequences and protein 3-gram sequences, and employs a bidirectional attention mechanism to fuse drug-target features.
DeepGS encodes drug SMILES strings and protein sequences using Smi2Vec and Prot2Vec, respectively, then learns multi-modal drug representations through GAT and BiGRU, while using CNN to extract protein representations.
MGPLI simultaneously utilizes character-level and segment-level features of drug and target sequences, employs Transformer-CNN encoders to extract high-level features, and addresses feature redundancy through highway layers.
GraphDTA adopts four GNN variants to generate drug molecular graph representations, while using CNN for protein sequence feature extraction.
DGraphDTA applies GCN to extract graph features from both drugs and targets.
MGSDTA integrates graph data and pre-trained sequence embeddings of drugs and targets, employs a GIN to extract graph features, utilizes a Bidirectional Gated recurrent Unit to capture sequence features, and then performs weighted fusion of multimodal features for prediction.
For the hyperparameter configuration of these baseline methods, we strictly adopted the values reported in their original publications. For methods with publicly available official code, we further validated the settings by using the default hyperparameters provided in their code repositories. To ensure a fair comparison, MIGDTA and all baseline methods were evaluated using identical data splits, with performance metrics averaged across 5-fold cross-validation (5-CV) using a training: validation: test ratio of 5:1:1. The experimental results are presented in Table 2 and Figure 2.
Table 2. Experimental results of MIGDTA and baseline methods.
| Davis | KIBA | |||||
| Methods | MSE↓ | CI↑ | MSE↓ | CI↑ | ||
| DeepDTA | 0.261 | 0.882 | 0.646 | 0.197 | 0.862 | 0.690 |
| DeepCDA | 0.248 | 0.891 | 0.649 | 0.176 | 0.889 | 0.682 |
| DeepGS | 0.252 | 0.882 | 0.686 | 0.193 | 0.860 | 0.684 |
| MGPLI | 0.240 | 0.885 | 0.696 | 0.172 | 0.877 | 0.706 |
| GraphDTA | 0.250 | 0.880 | 0.684 | 0.153 | 0.885 | 0.768 |
| DgraphDTA | 0.230 | 0.893 | 0.672 | 0.142 | 0.893 | 0.771 |
| MGSDTA | 0.208 | 0.897 | 0.724 | 0.136 | 0.898 | 0.782 |
| MIGDTA | 0.185 | 0.903 | 0.761 | 0.130 | 0.900 | 0.791 |
Bold: optimal values; Underline: suboptimal values; ↑: higher values indicate better performance; ↓: lower values indicate better performance; MSE: mean squared error; CI: Concordance index.
The results demonstrate that MIGDTA achieves significant performance improvements on both Davis and KIBA datasets. On the Davis dataset, compared to the best baseline method MGSDTA, MIGDTA reduces MSE to 0.185 (11% improvement), increases CI by 0.006, and improves
We have also conducted a comparative analysis of MIGDTA against several representative alternative methods, including MMPD-DTA[30], MMGIN[31], and DTI-BGCGCN[32]. While MMPD-DTA and DTI-BGCGCN integrate graph features and network topology via static concatenation or linear weighting, MIGDTA introduces an iterative GCN-based refinement module on the DTA network to dynamically model the synergy between local molecular/protein graph features and global network topological features, rather than treating these heterogeneous features as parallel inputs. Although MMGIN achieves impressive performance in toxicity prediction by leveraging graph isomorphism networks, its design focuses on unimodal feature optimization for ligand molecules, whereas MIGDTA is tailored for DTA prediction with a multi-source information fusion framework that unifies graph features, network topology, and hand-crafted biological descriptors.
Figure 3 illustrates the distribution of predicted versus actual affinity values for test samples across both datasets. The black dashed line (y = x) represents perfect prediction. The dense clustering of data points around this line confirms strong predictive capability of MIGDTA.
The performance superiority of MIGDTA stems from its comprehensive integration of multiple feature modalities: drug molecular graphs, target protein graphs, molecular fingerprints, protein descriptors, and DTA network features. This unified approach effectively captures both local molecular characteristics and global network properties, enhancing feature discriminability. Furthermore, the feature refinement module employs iterative GCN updates to achieve noise suppression and feature enhancement, fully leveraging the complementary nature of multimodal data.
3.3 Ablation study of features
We also proposed comprehensive feature ablation experiments. We first constructed three variants: MIGDTA_Graph, MIGDTA_Network, and MIGDTA_Bio by exclusively using graph feature extraction, network feature extraction, and biological feature extraction modules, respectively, to validate the effectiveness of each feature type. Subsequently, while maintaining original architecture of MIGDTA, we progressively removed graph features, network features, and biological features to create additional variants: MIGDTA-Graph, MIGDTA-Network, and MIGDTA-Bio, evaluating contribution of different features to overall performance. The feature configurations of these variants are detailed in Table 3.
Table 3. Variant methods of MIGDTA.
| Method variants | Graph feature | Network feature | biological feature |
| MIGDTA _Graph | √ | × | × |
| MIGDTA _Network | × | √ | × |
| MIGDTA _Bio | × | × | √ |
| MIGDTA-Graph | × | √ | √ |
| MIGDTA-Network | √ | × | √ |
| MIGDTA-Bio | √ | √ | × |
| MIGDTA | √ | √ | √ |
Experimental results in Table 4 and Figure 4 demonstrate that the complete MIGDTA achieves optimal performance on all datasets. MIGDTA_Graph shows relatively strong performance, with MSE increases of 0.016 and 0.149 and CI decreases of 0.013 and 0.008 on Davis and KIBA datasets, respectively. The significant performance degradation of MIGDTA-Graph confirms that graph features are essential for modeling local structural patterns of drugs and targets. While MIGDTA_Bio exhibits limited standalone performance, removing biological features (MIGDTA-Bio) causes notable deterioration, increasing MSE to 0.198 on the Davis dataset and 0.140 on the KIBA dataset. This underscores that biological features play a complementary role in characterizing chemical properties.
Figure 4. Performance comparison between MIGDTA and variant methods. MSE: mean squared error; CI: Concordance index.
Table 4. Feature ablation experiment results of MIGDTA
| Davis | KIBA | |||||
| Method variants | MSE↓ | CI↑ | MSE↓ | CI↑ | ||
| MIGDTA_Graph | 0.220 | 0.891 | 0.706 | 0.142 | 0.889 | 0.775 |
| MIGDTA_Network | 0.215 | 0.890 | 0.719 | 0.152 | 0.890 | 0.763 |
| MIGDTA_Bio | 0.236 | 0.884 | 0.694 | 0.163 | 0.882 | 0.730 |
| MIGDTA-Graph | 0.201 | 0.892 | 0.737 | 0.149 | 0.892 | 0.761 |
| MIGDTA-Network | 0.213 | 0.893 | 0.730 | 0.135 | 0.890 | 0.782 |
| MIGDTA-bio | 0.198 | 0.895 | 0.752 | 0.140 | 0.893 | 0.771 |
| MIGDTA | 0.185 | 0.903 | 0.761 | 0.130 | 0.900 | 0.791 |
Bold: optimal values; Underline: suboptimal values; ↑: higher values indicate better performance; ↓: lower values indicate better performance; MSE: mean squared error; CI: Concordance index.
Among the models MIGDTA_Network, MIGDTA_Graph, and MIGDTA_Bio, MIGDTA_Network demonstrated optimal performance on the Davis dataset but showed suboptimal results on the KIBA dataset. After removing network features, MIGDTA-Network exhibited a substantial MSE increase of 0.028 on the Davis dataset, compared to only a 0.005 MSE increase on the KIBA dataset, suggesting that their effectiveness in modeling global topology is dataset-dependent.
The weaker performance on KIBA could be attributed to drug-target imbalance-induced feature propagation bias and network sparsity-driven feature over smoothing. In conclusion, graph features and network features constitute the core of MIGDTA, delivering critical local structural information and global topological information, respectively, whereas biological features provide supplementary chemical characterization. The synergistic integration of these multi-source features within MIGDTA substantially improves prediction accuracy and enhances model robustness.
3.4 Selection of approaches of feature combination
This section validates the effectiveness of the feature refinement module and the rationality of our feature integration strategy by examining alternative feature combination approaches. Three variant methods were constructed as follows:
MIGDTA_1: Biological features are first fused with network features, processed through the refinement module, and then concatenated with graph features for final prediction.
MIGDTA_2: Graph features, molecular fingerprints, and network features are initially fused, refined, and directly used for prediction.
MIGDTA_3: The refinement module is removed, with raw concatenation of graph, biological, and network features used directly for prediction.
Experimental results on the Davis dataset are shown in Table 5, which reveal that MIGDTA achieves optimal performance, confirming the refinement module’s efficacy in fusing local graph features with global network patterns. MIGDTA_1 underperforms MIGDTA likely because its fusion sequence diminishes the refinement module’s capacity to leverage graph features, which ablation studies identified as the most discriminative. MIGDTA_2 shows worse performance than MIGDTA_1 due to high-dimensional, heterogeneous feature inputs that may propagate noise through insufficient redundancy reduction. MIGDTA_3’s significant performance drop (MSE: 0.210 vs. 0.185) demonstrates that unrefined feature concatenation introduces noise rather than improving predictions. These results underscore the necessity of our hierarchical refinement approach for multi-modal feature integration.
Table 5. Impact of different feature combination methods on MIGDTA performance.
| variant methods | MSE↓ | CI↑ | |
| MIGDTA | 0.185 | 0.903 | 0.761 |
| MIGDTA _1 | 0.198 | 0.899 | 0.746 |
| MIGDTA _2 | 0.199 | 0.898 | 0.737 |
| MIGDTA _3 | 0.234 | 0.885 | 0.675 |
Bold: optimal values; Underline: suboptimal values; ↑: higher values indicate better performance; ↓: lower values indicate better performance; MSE: mean squared error; CI: Concordance index.
3.5 Case study
We conduct a case study to validate the capability of the proposed MIGDTA model in identifying potential drug repositioning targets.
We employed the MIGDTA model trained on the Davis dataset to predict potential targets for Erlotinib[27] (PubChem ID: 176870), a tyrosine kinase receptor inhibitor used to treat advanced or metastatic pancreatic cancer and non-small cell lung cancer. First, given that Erlotinib is known to bind and inhibit the Epidermal Growth Factor Receptor[28] (EGFR), we included it in the training set while using the remaining target proteins as the test set. The top 10 target proteins ranked by MIGDTA-predicted affinity are listed in Table 6. Notably, 9 out of the top 10 predicted targets also ranked among the top 10 in terms of actual affinity.
Table 6. Prediction results of MIGDTA on the top 10 potential targets of Erlotinib.
| Predicted rank | Target | Actual affinity | Predicted affinity | Actual rank |
| 1 | EGFR(G719S) | 9.283997 | 9.237158 | 5 |
| 2 | EGFR(L747E749del) | 9.283997 | 9.228023 | 4 |
| 3 | EGFR(G719C) | 9.070581 | 9.226543 | 6 |
| 4 | EGFR(L858R) | 9.013228 | 9.220452 | 7 |
| 5 | EGFR(L861Q) | 8.920818 | 9.217475 | 8 |
| 6 | EGFR(L747T751del) | 9.455932 | 9.203938 | 1 |
| 7 | EGFR(L747S752del) | 9.327902 | 9.184792 | 2 |
| 8 | EGFR(E746A750del) | 9.318759 | 9.157184 | 3 |
| 9 | EGFR(S752I759del) | 8.79588 | 9.152869 | 9 |
| 10 | IRAK1 | 5.0 | 8.532074 | 435 |
The 10 th-ranked target protein, IRAK1 (PDB ID: 6BFN), had an affinity label of 5.0 in the dataset, indicating unknown binding activity. However, MIGDTA predicted a high affinity between them. To further validate this prediction, we performed molecular docking using AutoDock, which revealed a binding energy of -6.01 kcal/mol. The docking results in Figure 5 show that Erlotinib binds to VAL-235 of IRAK1 with an intermolecular bond length of 2.1 Å, confirming the formation of specific interactions.
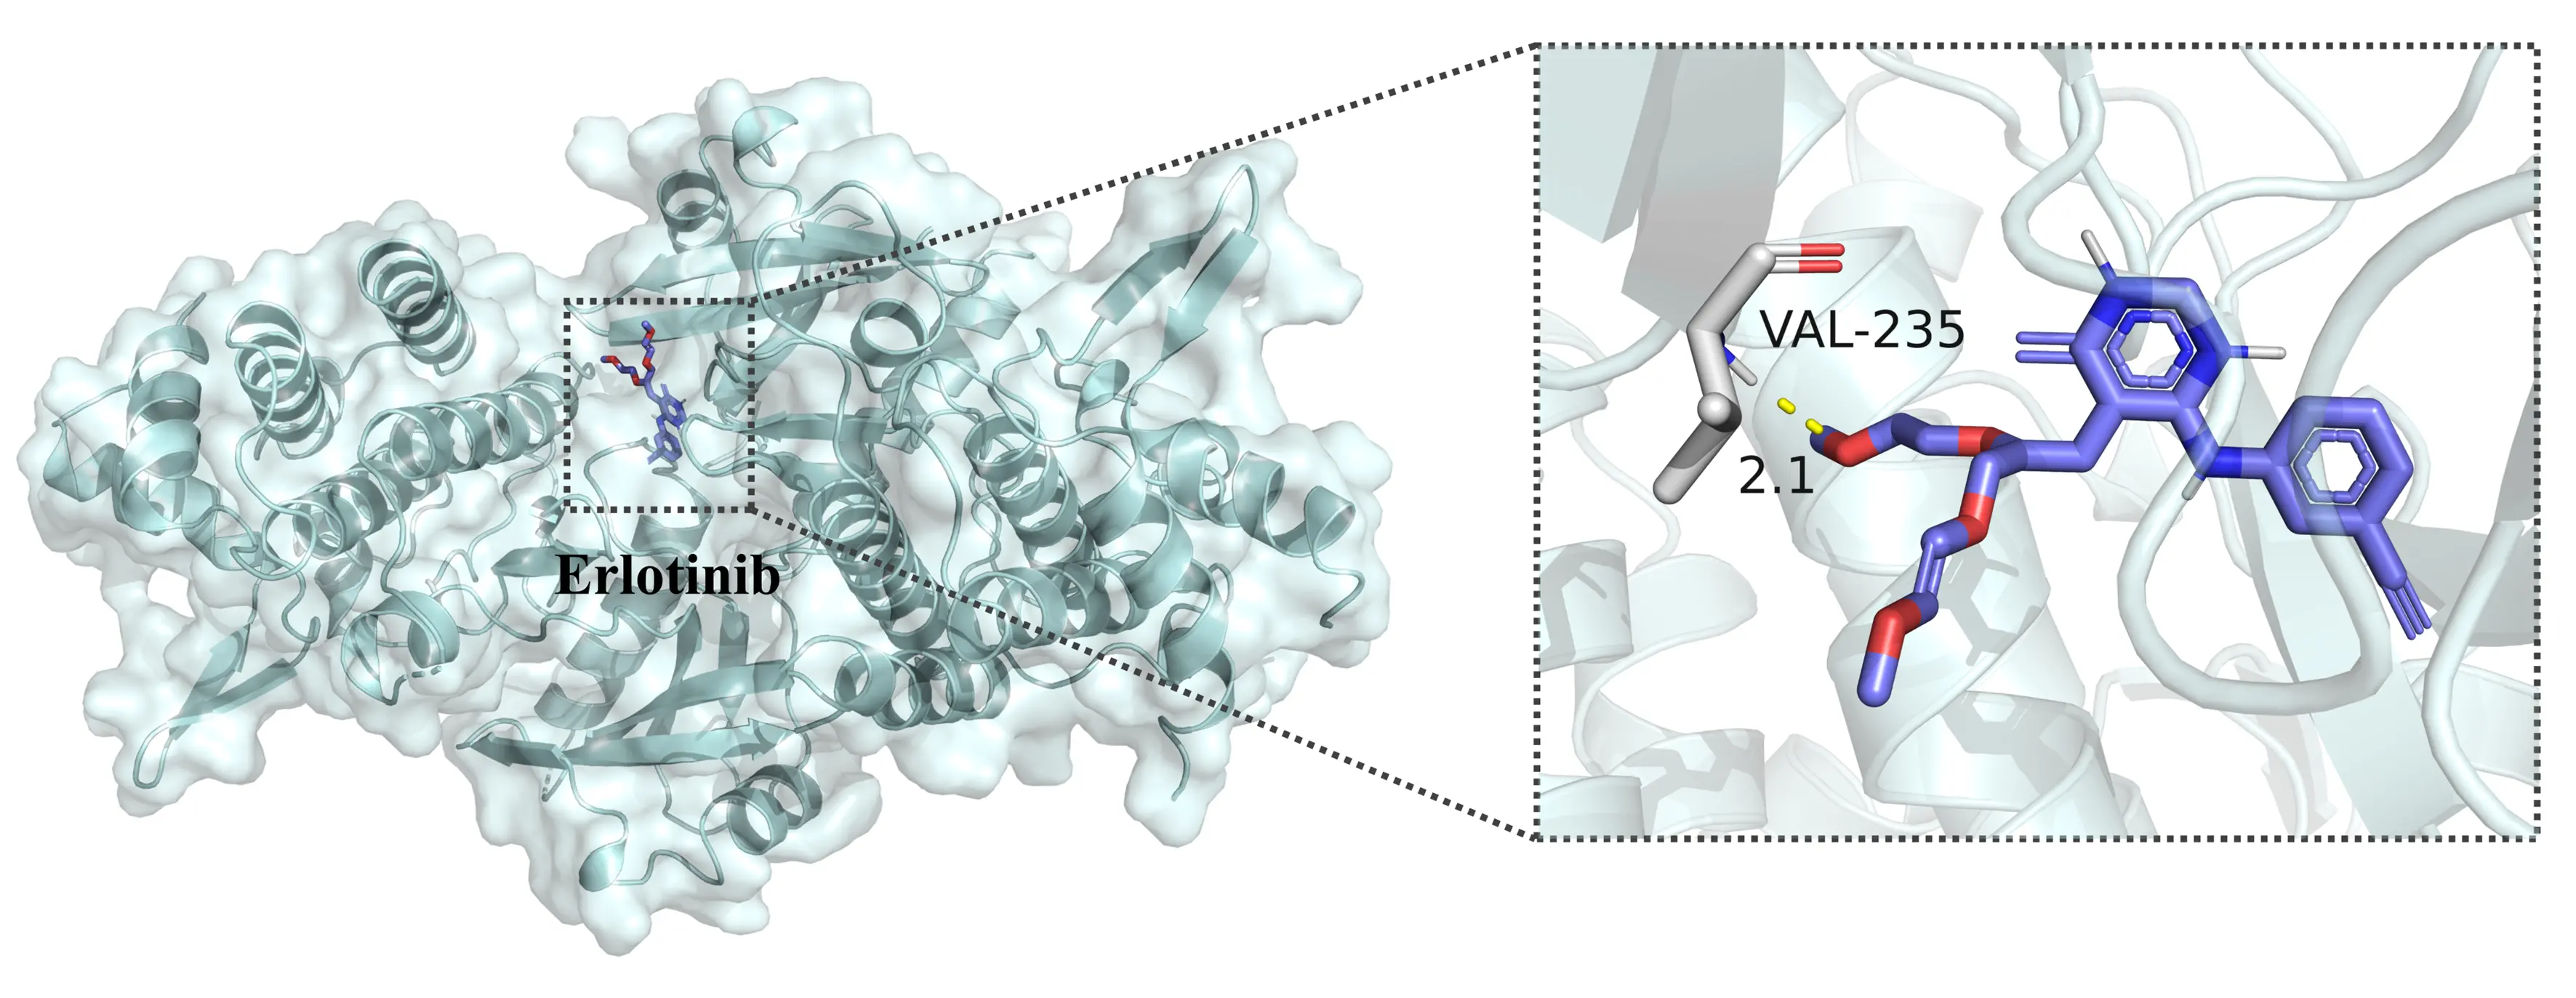
In summary, MIGDTA successfully identified potential protein targets for Erlotinib, and molecular docking experimentally validated the predicted target IRAK1. These findings provide valuable insights into Erlotinib’s mechanism of action and its potential applications in treating other diseases.
4. Limitations
Although the DTA network utilizes global topological information, its construction relies on known DTAs, limiting the ability of MIGDTA to predict interactions involving novel drugs or targets. Future work could explore similarity-based methods to estimate topological information for unknown drugs/targets based on their similarity to known entities. Additionally, unsupervised pre-training strategies using large-scale unlabeled drug and protein data may further improve model generalizability. Future research directions will include larger-scale clinical sample analyses and structural biology studies to further improve the generalization capability of the model.
5. Conclusion
In this article, we propose MIGDTA, a novel DTA prediction method integrating multi-source information and GCNs. MIGDTA incorporates traditional biological features, including diverse molecular fingerprints and protein descriptors, to complement graph representations of drugs and targets, while establishing global interaction relationships through DTA network construction. By combining independent molecular feature extraction, network feature extraction, and feature refinement within the DTA network, MIGDTA achieves collaborative local-global modeling of multi-source features, significantly enhancing the learning capability for complex drug-target interaction patterns. Experimental results demonstrate the superior performance of MIGDTA on benchmark datasets. Feature ablation studies verify the core role of graph features in modeling local structures and network features in capturing global topology, along with the supplementary importance of biological features. Comparative analyses of feature integration approaches confirm the effectiveness of the feature refinement module in fusing multimodal features and enhancing model discriminability.
Authors contribution
Lei X: Conceptualization, supervision, funding acquisition.
Tang X: Data curation, methodology, writing-original draft.
Zhang Y: Visualization, validation, writing-review & editing.
Conflicts of interest
Xiujuan Lei is an Editorial Board Member of Computational Biomedicine. The other authors declare that they have no conflicts of interest.
Ethical approval
Not applicable.
Consent to participate
Not applicable.
Consent for publication
Not applicable.
Availability of data and materials
The data and code of the paper can be obtained by contacting the corresponding author.
Funding
This work was supported in part by National Natural Science Foundation of China (62272288, 62402394), Natural Science Basic Research Program of Shaanxi Province (2024JC-YBQN-0645), Fundamental Research Funds for the Central Universities, Shaanxi Normal University (GK202302006), Scientific Startup Foundation for Doctors of Northwest A & F University (2452023023).
Copyright
© The Author(s) 2026.
References
-
1. Uma E, Mala T, Geetha AV, Priyanka D. A comprehensive survey of drug-target interaction analysis in allopathy and siddha medicine. Artif Intell Med. 2024;157:102986.[DOI]
-
2. Zhang Y, Cheng X, Zhou W. Drug repositioning: an important application of network pharmacology. Chin J Pharmacol Toxicol. 2012;26(6):779-786.[DOI]
-
3. Liao C, Sitzmann M, Pugliese A, Nicklaus MC. Software and resources for computational medicinal chemistry. Future Med Chem. 2011;3(8):1057-1085.[DOI]
-
4. Liu X, Li M. A survey of deep learning-based drug-target interaction prediction. CAAI Trans Intell Syst. 2024;19(3):494-524.[DOI]
-
5. Weininger D. SMILES, a chemical language and information system. 1. J Chem Inf Comput Sci. 1988;28(1):31-36.[DOI]
-
6. Öztürk H, Özgür A, Ozkirimli E. DeepDTA: Deep drug-target binding affinity prediction. Bioinformatics. 2018;34(17):i821-i829.[DOI]
-
7. Öztürk H, Ozkirimli E, Özgür A. WideDTA: Prediction of drug-target binding affinity. arXiv:1902.04166 [Preprint]. 2019.[DOI]
-
8. Abbasi K, Razzaghi P, Poso A, Amanlou M, Ghasemi JB, Masoudi-Nejad A. DeepCDA: Deep cross-domain compound-protein affinity prediction through lstm and convolutional neural networks. Bioinformatics. 2020;36(17):4633-4642.[DOI]
-
9. Wang J, Hu J, Sun H, Xu M, Yu Y, Liu Y, et al. MGPLI: Exploring multigranular representations for protein–ligand interaction prediction. Bioinformatics. 2022;38(21):4859-4867.[DOI]
-
10. Nguyen T, Le H, Quinn TP, Nguyen T, Le TD, Venkatesh S. GraphDTA: Predicting drug-target binding affinity with graph neural networks. Bioinformatics. 2021;37(8):1140-1147.[DOI]
-
11. Yang Z, Zhong W, Zhao L, Yu-Chian Chen C. MGraphDTA: deep multiscale graph neural network for explainable drug-target binding affinity prediction. Chem Sci. 2022;13(3):816-833.[DOI]
-
12. Pan S, Xia L, Xu L, Li Z. SubMDTA: drug target affinity prediction based on substructure extraction and multi-scale features. BMC Bioinformatics. 2023;24(1):334.[DOI]
-
13. Jiang M, Li Z, Zhang S, Wang S, Wang X, Yuan Q, et al Drug–target affinity prediction using graph neural network and contact maps. RSC Adv. 2020;10(35):20701-20712.[DOI]
-
14. Lin X. DeepGS: Deep representation learning of graphs and sequences for drug-target binding affinity prediction. arXiv:2003.13902 [Preprint]. 2020.[DOI]
-
15. Wu H, Liu J, Jiang T, Zou Q, Qi S, Cui Z, et al. Attentionmgt-DTA: A multi-modal drug-target affinity prediction using graph transformer and attention mechanism. Neural Netw. 2024;169:623-636.[DOI]
-
16. Lin Z, Akin H, Rao R, Hie B, Zhu Z, Lu W, et al. Evolutionary-scale prediction of atomic-level protein structure with a language model. Science. 2023;379(6637):1123-1130.[DOI]
-
17. Tang X, Lei X, Liu L. A multi-modal drug target affinity prediction based on graph features and pre-trained sequence embeddings. Interdiscip Sci Comput Life Sci. 2025;17(4):822-843.[DOI]
-
18. He H, Chen G, Chen CYC. NHGNN-DTA: A node-adaptive hybrid graph neural network for interpretable drug-target binding affinity prediction. Bioinformatics. 2023;39(6):btad355.[DOI]
-
19. Davis MI, Hunt JP, Herrgard S, Ciceri P, Wodicka LM, Pallares G, et al. Comprehensive analysis of kinase inhibitor selectivity. Nat Biotechnol. 2011;29(11):1046-1051.[DOI]
-
20. Tang J, Szwajda A, Shakyawa S, Xu T, Hintsanen P, Wennerberg K, et al. Making sense of large-scale kinase inhibitor bioactivity data sets: A comparative and integrative analysis. J Chem Inf Model. 2014;54(3):735-743.[DOI]
-
21. Bento AP, Hersey A, Félix E, Landrum G, Gaulton A, Atkinson F, et al. An open source chemical structure curation pipeline using RDKit. J Cheminform. 2020;12(1):51.[DOI]
-
22. Bi X, Zhang S, Ma W, Jiang H, Wei Z. HiSIF-DTA: A hierarchical semantic information fusion framework for drug-target affinity prediction. IEEE J Biomed Health Inform. 2025;29(3):1579-1590.[DOI]
-
23. Zhou H, Skolnick J. Utility of the morgan fingerprint in structure-based virtual ligand screening. J Phys Chem B. 2024;128(22):5363-5370.[DOI]
-
24. Nakajima M, Nemoto T. Machine learning enabling prediction of the bond dissociation enthalpy of hypervalent iodine from SMILES. Sci Rep. 2021;11(1):20207.[DOI]
-
25. Li G, Li J, Tian Y, Zhao Y, Pang X, Yan A. Machine learning-based classification models for non-covalent bruton’s tyrosine kinase inhibitors: Predictive ability and interpretability. Mol Divers. 2024;28(4):2429-2447.[DOI]
-
26. Lumbanraja FR, Nguyen NG, Phan D, Faisal MR, Abipihi B, Purnama B, et al. Improved protein phosphorylation site prediction by a new combination of feature set and feature selection. J Biomed Sci Eng. 2018;11(06):144-157.[DOI]
-
27. Peng ZL, Yang JY, Chen X. An improved classification of g-protein-coupled receptors using sequence-derived features. BMC Bioinformatics. 2010;11(1):420.[DOI]
-
28. Hamilton W, Ying Z, Leskovec J. Inductive representation learning on large graphs. In: von Luxburg U, Guyon I, Bengio S, Wallach H, Fergus R, editors. Proceedings of the 31st International Conference on Neural Information Processing Systems; 2017 Dec 4-9; California, USA. United States: Curran Associates Inc.; 2017. p. 1025-1035.[DOI]
-
29. Li S, Li Y, Gu J. Principle, method and application of relationship inference based on biological networks. Sci Sinica Inform. 2022;52(5):856.[DOI]
-
30. Wang G, Zhang H, Shao M, Sun S, Cao C. MMPD-DTA: Integrating multi-modal deep learning with pocket-drug graphs for drug-target binding affinity prediction. J Chem Inf Model. 2025;65(3):1615-1630.[DOI]
-
31. Wang G, Feng H, Du M, Feng Y, Cao C. Multimodal representation learning via graph isomorphism network for toxicity multitask learning. J Chem Inf Model. 2024;64(21):8322-8338.[DOI]
-
32. Wang H, Xu M, Guo Z, You G, Wang G, Cao C, et al. DTI-BGCGCN: A novel bipartite graph-based cluster graph convolutional network for drug-target interaction prediction in modern and traditional Chinese medicine. Comput Biol Chem. 2025;117:108410.[DOI]
Copyright
© The Author(s) 2026. This is an Open Access article licensed under a Creative Commons Attribution 4.0 International License (https://creativecommons.org/licenses/by/4.0/), which permits unrestricted use, sharing, adaptation, distribution and reproduction in any medium or format, for any purpose, even commercially, as long as you give appropriate credit to the original author(s) and the source, provide a link to the Creative Commons license, and indicate if changes were made.
Publisher’s Note
Science Exploration remains a neutral stance on jurisdictional claims in published
maps
and institutional affiliations. The views expressed in this article are solely those
of
the author(s) and do not reflect the opinions of the Editors or the publisher.
Share And Cite


Science Exploration Style
Lei X, Tang X, Zhang Y. Drug-target affinity prediction based on multi-source information and graph convolutional network. Comput Biomed. 2026;1:202520. https://doi.org/10.70401/cbm.2026.0007
Tips
Copy completed.
Submit a Manuscript
Author Instructions
Cite this Article
Article Metrics
0
View
0
Download
Cited
Article Updates

Science Exploration Style
Lei X, Tang X, Zhang Y. Drug-target affinity prediction based on multi-source information and graph convolutional network. Comput Biomed. 2026;1:202520. https://doi.org/10.70401/cbm.2026.0007
copy
Share Link
copy