iCDG-MOHGAT: Identification of cancer driver gene using multi-omics data and heterogeneous graph attention network
*Correspondence to:
Lin Yuan, Key Laboratory of Computing Power Network and Information Security, Ministry of Education, Shandong Computer Science Center, Qilu University of Technology (Shandong Academy of Sciences), Jinan 250014, Shandong, China; Key Laboratory of Computing Power Network and Information Security, Ministry of Education, Shandong Computer Science Center, Qilu University of Technology (Shandong Academy of Sciences), Jinan 250014, Shandong, China; Shandong Provincial Key Laboratory of Industrial Network and Information System Security, Shandong Fundamental Research Center for Computer Science, Jinan 250353, Shandong, China.
E-mail: yuanlindc@126.com
Comput Biomed. 2026;1:202515. 10.70401/cbm.2026.0008
Received: September 26, 2025Accepted: January 22, 2026Published: February 03, 2026
Abstract
Aims: Driver mutations are crucial factors in the occurrence and development of cancer. Identifying cancer-related driver genes is of great significance for understanding the mechanisms of cancer initiation, prevention, and treatment. With the continuous accumulation of cancer data, how to effectively utilize these data for the identification of cancer driver genes has become a major challenge in the field of cancer biology.
Methods: We propose a novel computational model called iCDG-MOHGAT. This model integrates multi-omics pan-cancer data (such as mutations, DNA methylation, etc.), multi-dimensional gene networks, and disease semantic similarity networks to identify cancer driver genes. We first construct multi-dimensional gene networks using various types of gene correlation information (protein-protein interaction, gene sequence similarity, etc.) and establish disease semantic similarity networks for relevant cancers. Due to the complexity of node and edge types, we utilize a heterogeneous graph attention network to learn and extract features from the multi-dimensional gene networks and disease semantic similarity networks. We also incorporate a fusion learning module to effectively integrate features from different dimensions. Finally, we optimize the random forest classifier using the sparrow algorithm for the task of predicting cancer driver genes.
Results: Experimental results demonstrate that iCDG-MOHGAT outperforms many state-of-the-art models in terms of AUPR and AUROC. In the final prediction results, 91% of the predicted new driver genes have at least one supporting evidence of being cancer genes. In the laboratory, this model can serve as an effective tool for identifying cancer driver genes.
Conclusion: We have introduced a novel computational model named iCDG-MOHGAT, which precisely identifies cancer driver genes by integrating multi-omics pan-cancer data and intricate multidimensional gene networks, coupled with disease semantic similarity networks. Experimental results demonstrate that iCDG-MOHGAT outperforms many state-of-the-art models in terms of AUPR and AUROC. In the final prediction results, 91% of the predicted genes have supporting evidence. In the laboratory, this model can serve as an effective tool for identifying cancer driver genes.
Keywords
Multi-omics information, heterogeneous graph attention network, multi-scale channel attention module, cancer driver gene identification
1. Introduction
Cancer is a disease that occurs at the genetic level. It is caused by mutations in genes that control cell function, especially the growth and division of cells[1]. The heterogeneous and dynamic nature of cancer presents a serious challenge to cancer treatment. At the same time, the interaction and dynamic changes between cancer and the microenvironment make the treatment of cancer more complex and arduous. With the development of research, it has been found that cancer driver genes can give cells growth benefits and affect the transformation process from normal cells to cancer cells, which provides us with new research ideas, and identification of cancer driver genes is of great significance in understanding the pathogenesis of cancer, improving the accuracy of cancer diagnosis, and guiding precise treatment[2].
Over the past decade, several large cancer genomics projects have been established, such as the Cancer Genome Atlas (TCGA) and the International Cancer Genome Consortium, these cancer genomics projects have provided researchers with a wealth of data. However, there is increasing evidence that cancer is driven by both genetic and non-genetic factors, and using multivariate omics data and extracting valuable information from it would be an effective method to predict cancer driver genes[3].
According to the principle of graph, the main computational tools abstract the biological system as the biological network, and the gene as the node, the association between genes is used as an edge, the feature of omics is used as a node attribute, and the graph neural network is used to learn the complex biological data. For example, EMOGI integrates genomic, transcriptomic, and other multi-omics data into omics features that bind to protein-protein interaction networks (PPI), and uses graph convolution networks (GCN) to learn more abstract, deeper features. Modig introduces heterogeneous information of Gene Association into a multi-dimensional gene network and integrates cancer multi-omics information using a graph attention network (GAT)[4]. Although the current mainstream model has a relatively superior performance, there are still some problems: 1. The current mainstream model although considering the information of Gene Association, but the information of disease association has never been considered. 2. In multi-dimensional graph networks, there are many kinds of nodes and edges. If we don't consider the kinds of nodes and edges, we will ignore a lot of biological features.
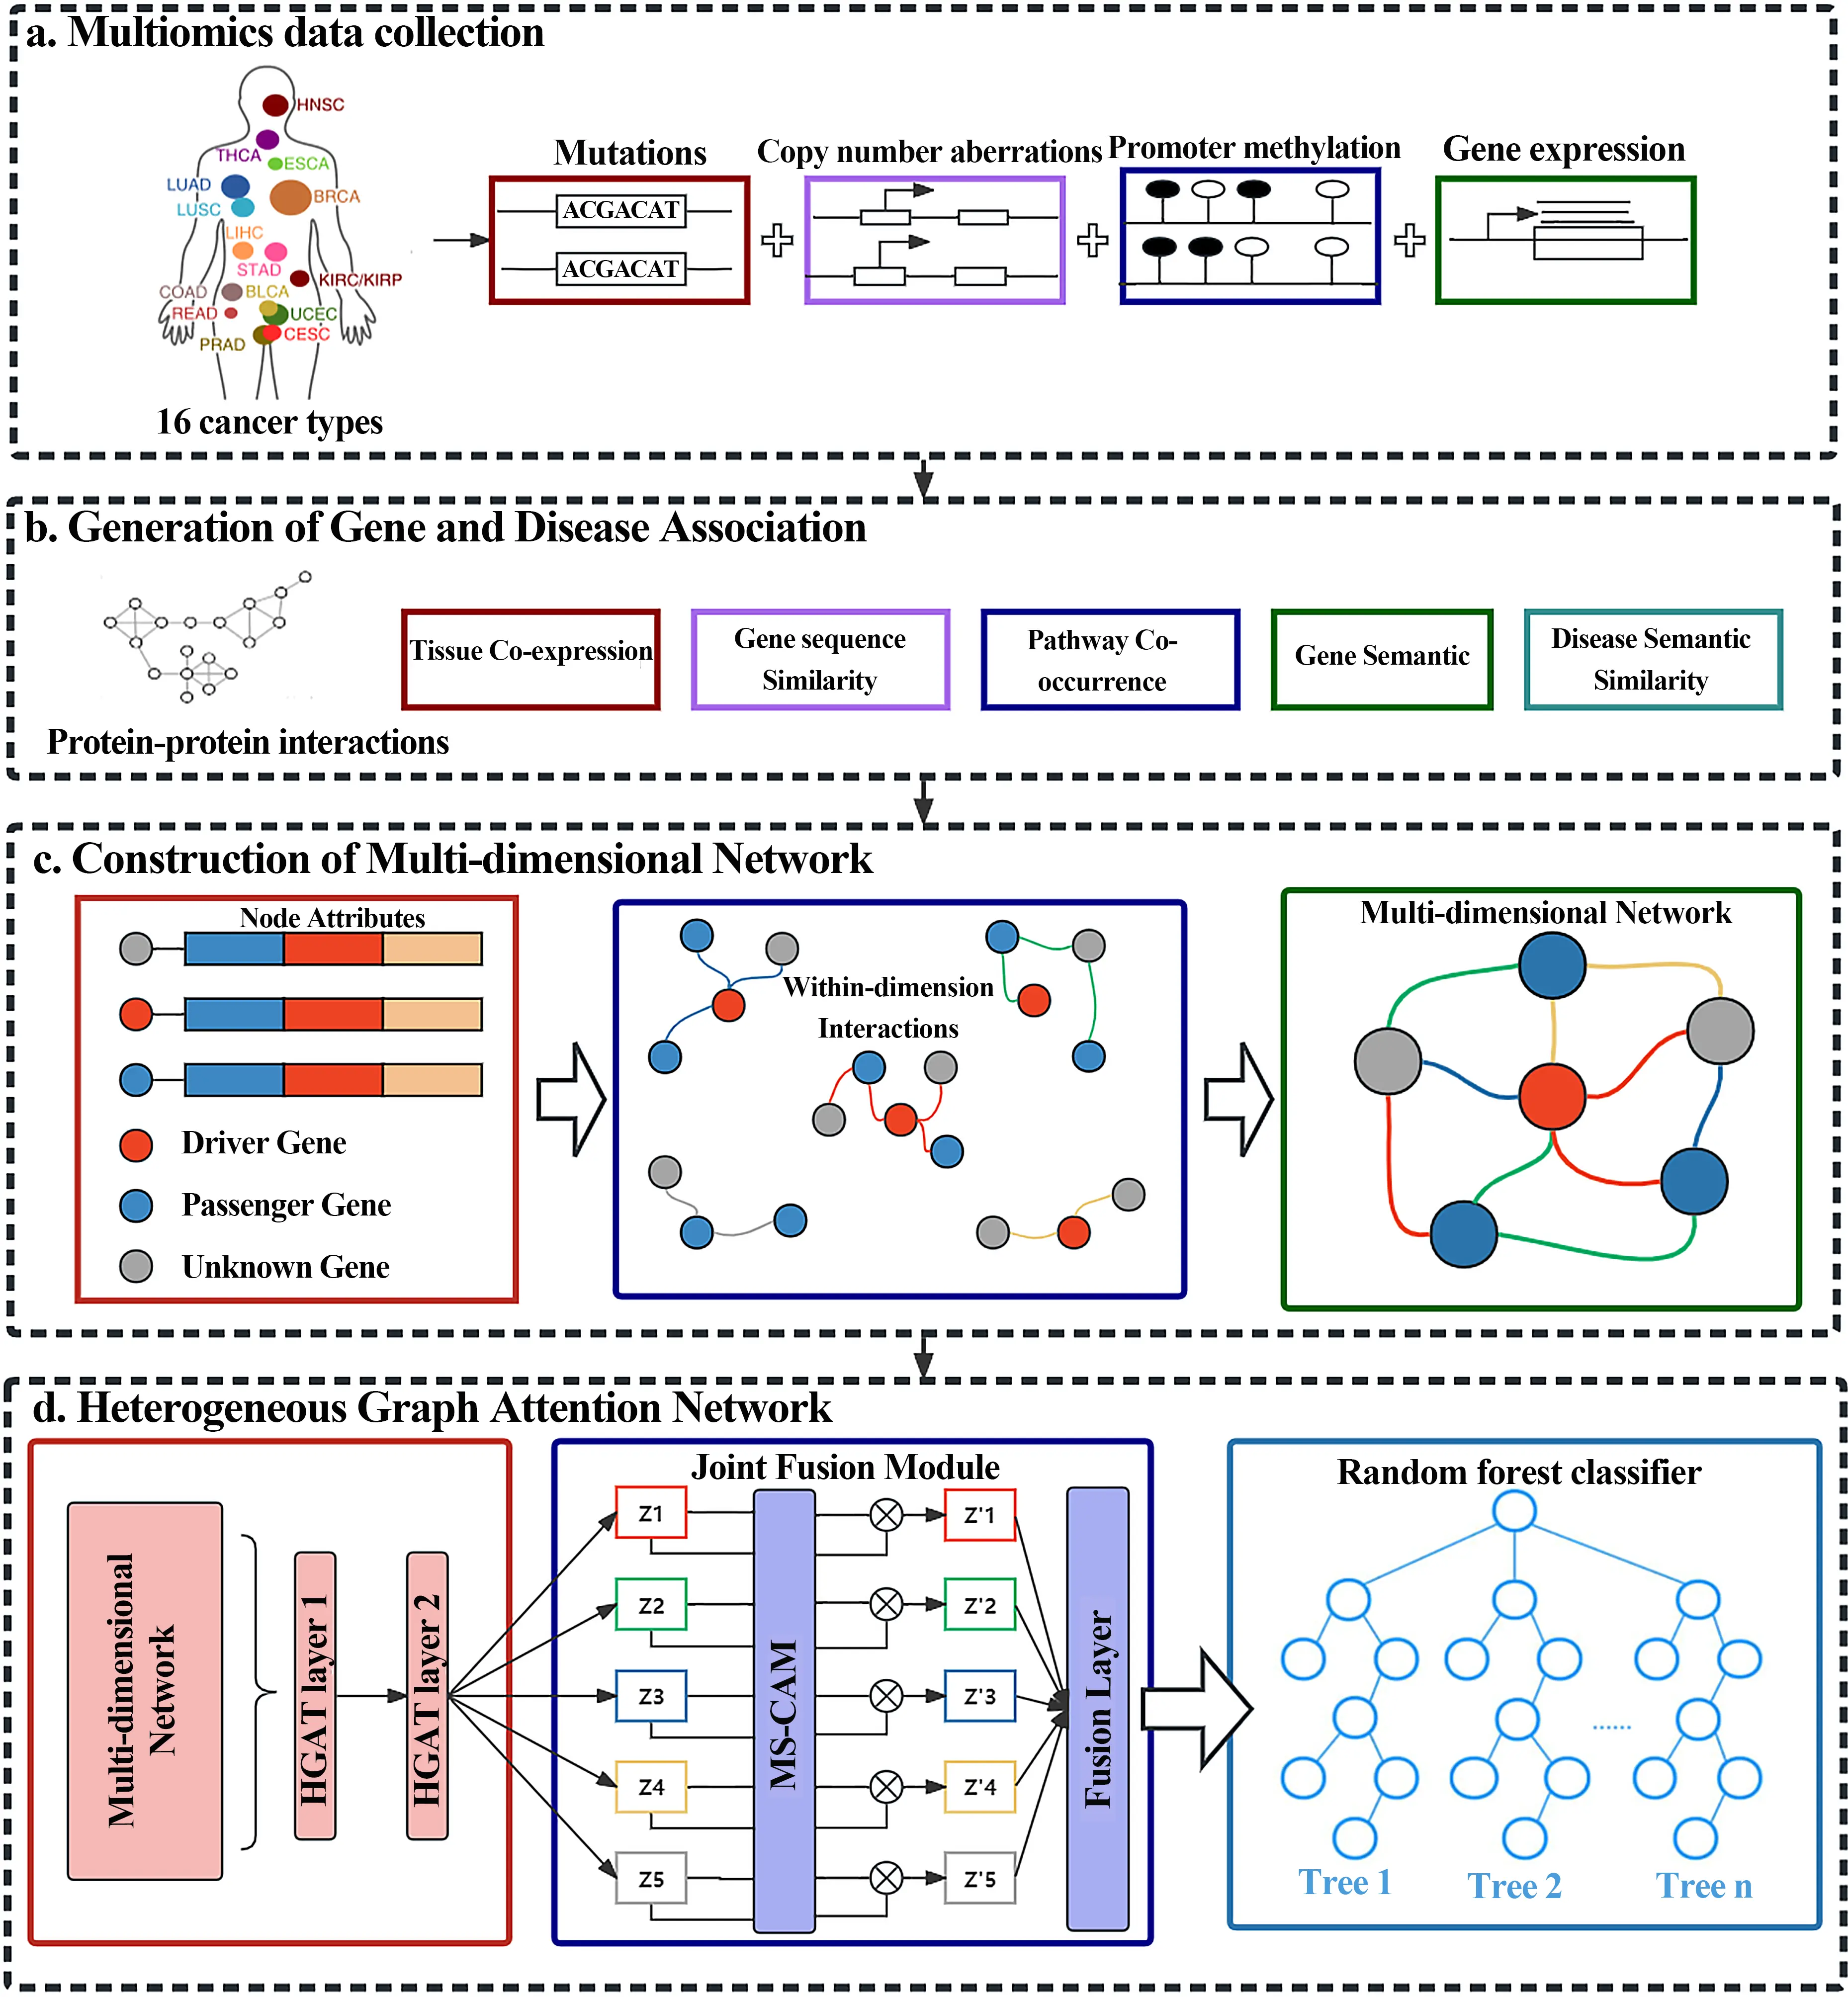
To solve the above problems, we propose a new computational model named iCDG-MOHGAT, which identifies cancer driver genes through multi-omics pan-cancer data, multi-dimensional gene networks, and disease semantic similarity networks. As shown in Figure 1, we first construct a gene network using multiple types of gene association information and construct a semantic similarity network for cancer. Because the types of nodes and edges are too complex, we use a heterogeneous graph attention network to learn and extract features from a multi-dimensional gene network and disease semantic similarity network, and build a fusion learning module, finally, the Sparrow[5] algorithm is used to optimize the random forest classifier to predict cancer driver genes. Experimental results indicate that iCDG-MOHGAT is superior to many mainstream models in terms of AUPR and AUROC, and in the final prediction, 91% of the predicted genes have evidence in support of cancer genes. In the laboratory, the model could be a useful tool for identifying cancer driver genes.
iCDG-MOHGAT identifies cancer driver genes by integrating multi-omics pan-cancer data, intricate multidimensional gene networks, coupled with disease semantic similarity networks. Furthermore, we meticulously established a disease semantic similarity network that reflects the subtle interconnections between various cancers. We employed a cutting-edge heterogeneous graph attention network model for learning, allowing our system to efficiently extract and process key features from both the multidimensional gene network and the disease semantic similarity network. We also developed an innovative fusion learning module that enables the organic combination and synergistic optimization of features across different network layers, which is critical for enhancing the overall predictive power and robustness of the model.
2. Materials and Methods
2.1 Data preparation
Our proposed model iCDG-MOHGAT is based on a heterogeneous attention network, the main purpose of which is to obtain gene and disease expression from the generated multidimensional gene network and disease network, and ultimately use it to identify cancer driver genes, mainly through three steps to achieve the integration of multi-omics data, construction of multidimensional gene and disease network, and learning and obtaining the final cancer gene expression[6]. Firstly, we construct multiple gene maps, and use the MeSH database to calculate the semantic similarity between related cancers to generate disease networks[7]. Then, we construct a multi-dimensional gene network[8]. Finally, in order to maximize the use of genetic and disease information, we did not refer to the previous fusion method, that is, the fusion of multiple sides into one edge[9]. Considering the complexity of nodes and edges, we use the HAGT module to learn the different dimensions interactively, obtain the specific gene and disease expression of each dimension, and learn the importance of different dimension representations through the fusion learning module, and fuse them[10].
2.2 Generation of gene association profiles and disease semantic similarity networks
In this study, we used five different gene association maps: gene pathway co-occurrence, protein-protein interaction network, gene sequence similarity, gene co-expression patterns, and gene functional similarity[11]. These five gene association maps are commonly used as basic gene association maps. We will introduce the computational methods for these gene association maps, and we will also introduce the construction process of the disease semantic similarity network. For these gene association maps and disease similarity networks, we set the association values to be in the range of [0,1].
2.2.1 Gene co-expression patterns
We obtain the gene expression profiles of genes G1 and G2:
2.2.2 Gene sequence similarity
We downloaded the gene protein sequences from the Refseq database established by NCBI, compared the sequences with each other using the BAMP program, and then calculated the gene sequence similarity as follows:
2.2.3 Gene pathway co-occurrence
In order to calculate gene pathway coexistence, we downloaded the human cancer pathway from the KEGG database and constructed a multidimensional binary vector for each gene according to the number of human cancer pathways. If the gene is included in the corresponding pathway, the corresponding dimension is assigned 1; otherwise it is assigned 0. Then, we calculate the gene pathway commonality of the two genes G1 and G2 by cosine similarity. The formula is as follows:
2.2.4 Similarity in gene function
We measured the functional similarity through the R package GOSemSim based on the genetic annotation of GO terminology[12]. We analyzed through the biological process, cell composition, and molecular function three levels, and finally used the godata(.) function to construct the GOSemSim required GO annotation data, and calculated the gene function similarity of genes G1 and G2, the calculation formula is as follows:
2.2.5 Protein-protein interactions
In the construction of protein-protein interactions, we use a variety of datasets, such as STRING, CPDB, iRefIndex, HINT, IntAct, etc. Due to the differences among the networks, we introduce the concept of confidence, that is, the probability of interaction between two proteins[13]. We refer to the settings of EMOGI. For CPDB networks, we remove complex interactions and interactions with a confidence level of < 0.5. For STRING networks, we remove interactions with a confidence level of < 0.85. For the iRefIndex network, We only consider binary interactions. Other networks are collected from the MODIG github repository with no further preprocessing[14,15].
2.2.6 Construction of disease semantic similarity
A directed cycle graph (DAG) is used to represent diseases-disease associations. DAGd(d, Nd, Ed) represents disease information, where Nd represents disease nodes, and Ed represents the set of edges.
The semantic similarity DSS1(d(i), d(j)) is defined as follows:
2.3 Build a multidimensional gene network
To make full use of the information from different gene association maps, we build these maps into a unified multidimensional network, in which genes are nodes, different gene association maps are used as edges of different dimensions, and multi-omics information is used as node attributes. The multidimensional gene network is composed of N nodes and D group edges, and D group edges can be represented by D relationships, that is, D adjacency matrices. During the construction process, since each gene association atlas contains missing values, we preprocessed the gene association atlas to set the association threshold to 0.5 and filtered out the smaller association values in the association map[16]. However, due to the dense composition of gene co-expression patterns and gene functional similarity networks, we set the threshold to 0.8 for the association map of the two genes and used the absolute Pearson correlation coefficient. Finally, we constructed about 22,000 nodes and 2.1 million edges, as well as five types of multidimensional networks.
2.4 Heterogeneous attention network
In this study, because multidimensional gene networks have complex node and edge information, we used heterogeneous attention networks (HGAT) to better learn the importance of these nodes and edges. A node has different importance for the neighbors of the same path, and the neighbors of the same central node may have multiple classes, and each node has a feature vector of different dimensions, so our first step is to map them to the same dimension by transforming the matrix M. Let the node feature vector before the conversion be hi and the feature vector after the transformation be
where attnode represents node-level attention, and for the same path, the weights of different neighbor nodes based on this path are shared.
For a given set of paths {L1, L2, ..., LP}, after this node-level attention, P-group semantically related embeddings are obtained, denoted as {ZL1, ZL2, ..., ZLP}.
After performing node-level attention operations on different nodes, for different types of edges, we combine different types of connected embedding through semantic-level attention, and its abstract calculation is:
The final characteristic is represented as:
In practice, we use 4 attention heads stacked on top of each other, using 4 attention heads with a loss rate of 0.2. We applied HGAT modules to interdimensional interactions to generate dimension-specific gene expression Z1, Z2, Z3, Z4, Z5.
2.5 Fusion learning modules
To enable cooperation between the specific genetic characterization of different dimensions, we build a fusion learning module whose main idea is to focus on local and global context features of different dimensions through point-by-point convolution, and the use of station-point convolution can also keep the module lightweight. First, we calculate the channel attention R(Zi) of local features by expressing {Z1, Z2, ..., Z5} as specific genes in each dimension:
After obtaining the final gene expression characteristics, we normalize DS and spliced DS with Zf to obtain the final feature expression GA.
2.6 Data collection and preprocessing
In this study, we referred to the multi-omics data and driver gene lists used by EMOGI to identify cancer driver genes. We collected the required cell mutations, copy number variations, DNA methylation, and gene expression data from the TCGA, including more than 9,000 samples and 16 different cancers.
We constructed positive samples from a list of known cancer genes obtained from a variety of sources, such as Cancer Gene Network (NCG) v6.0[17], COSMIC Cancer Gene Screening (CGC v91)[18], and DigSEE[19]. A negative sample is the gene most likely not to be associated with cancer.
3. Results
3.1 Model performance evaluation
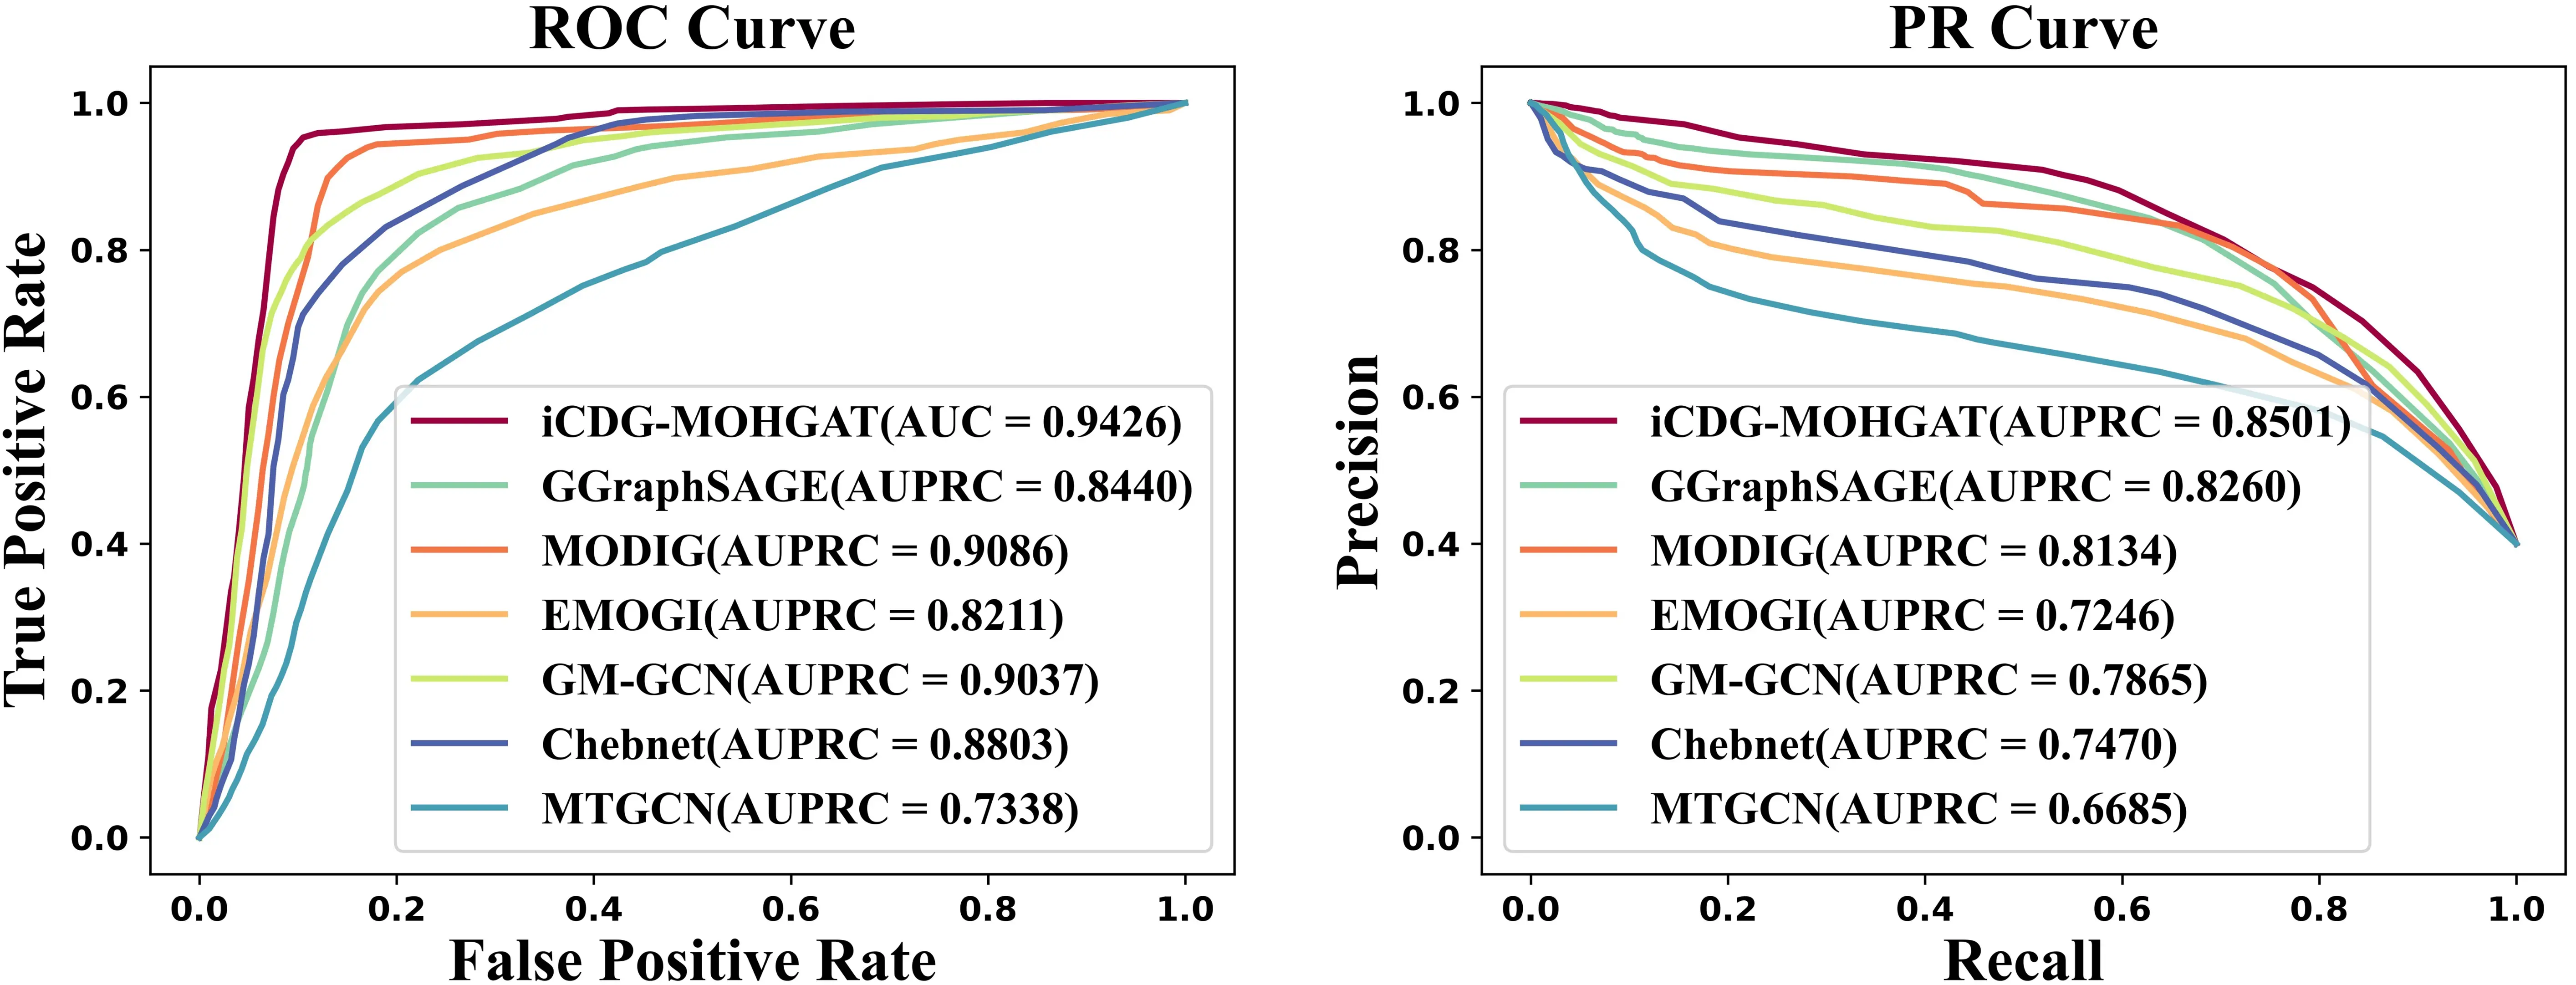
To better evaluate the performance of iCDG-MOHGAT, we used two metrics, AUROC and AUPR, both of which were evaluated using five-fold cross-validation. We segmented the genes from all collections into two groups, designating 25% as the test set and the remaining 75% as the training set. Optimal hyperparameters were sought within a reasonable parameter scope via grid search. This entailed reserving 20% of the training set for validation and employing the rest for the actual model training; this process was repeated more than four times. In conclusion, we selected the set of hyperparameters with the highest average AUPRC score as the final model parameters. For comparison, we selected six models (MODIG, EMOGI, MTGCN, Chebnet, GM-GCN, and GGraphSAGE). As shown in Figure 2, we trained iCDG-MOHGAT on STRING (MG-STRING) integrated multi-dimensional gene network and achieved the best performance compared to the AUROC (0.94) and AUPR (0.85) scores of other models. Our model achieved optimal AUROC and AUPR in different multidimensional gene networks that integrate different PPIs. It shows that the integration of multiple gene networks and disease networks plays a key role in improving the performance of cancer driver gene prediction tasks, indicating advantages in network inheritance.
3.2 Ablation experiments
To evaluate the superiority of iCDG-MOHGAT, we conducted a five-fold cross-validation ablation experiment on MG-STRING. The results are shown in Table 1. We observed that integrating more diverse gene association maps into the construction of the multidimensional gene network significantly improved the model’s performance, and iCDG-MOHGAT achieved the best performance when integrating the multidimensional gene network and disease network with all five gene association maps. Subsequently, we compared randomly generated input features and found that multi-omics features can improve prediction performance. When we replaced HGAT with GAT and GCN, the model’s performance dropped significantly, indicating that HGAT and the fusion learning module are indispensable in iCDG-MOHGAT.
Table 1. The results of the ablation experiment.
| Model | Features | AUPR | AUROC | ACC | F1 |
| MOHGAT, PPI | multi-omics | 0.6122 ± 0.0007 | 0.8319 ± 0.0004 | 0.7661 ± 0.0006 | 0.6303 ± 0.0003 |
| MOHGAT, PPI + Exp | multi-omics | 0.6518 ± 0.0002 | 0.8477 ± 0.0003 | 0.7753 ± 0.0001 | 0.6498 ± 0.0005 |
| MOHGAT, PPI+ Path | multi-omics | 0.7244 ± 0.0001 | 0.8693 ± 0.0007 | 0.8031 ± 0.0005 | 0.6786 ± 0.0005 |
| MOHGAT. PPI + GO | multi-omics | 0.7257 ± 0.0014 | 0.8672 ± 0.0006 | 0.8010 ± 0.0009 | 0.6781 ± 0.0011 |
| MOHGAT, PPI + Seq + Ds | multi-omics | 0.7353 ± 0.0020 | 0.8703 ± 0.0002 | 0.8049 ± 0.0003 | 0.6647 ± 0.0008 |
| MOHGAT, PPI + Exp + Path | multi-omics | 0.7469 ± 0.0007 | 0.8770 ± 0.0005 | 0.8101 ± 0.0004 | 0.6759 ± 0.0010 |
| MOHGAT, PPI + Exp + GO | multi-omics | 0.7551 ± 0.0003 | 0.8784 ± 0.0003 | 0.8095 ± 0.0003 | 0.6844 ± 0.0005 |
| MOHGAT, PPI + Path + Seq | multi-omics | 0.7672 ± 0.0002 | 0.8806 ± 0.0001 | 0.8114 ± 0.0002 | 0.6900 ± 0.0006 |
| MOHGAT, PPI + GO + Seq + Ds | multi-omics | 0.7759 ± 0.0004 | 0.8873 ± 0.0003 | 0.8198 ± 0.0002 | 0.7055 ± 0.0007 |
| MOHGAT, PPI + Exp + GO + Seq | multi-omics | 0.7948 ± 0.0010 | 0.8951 ± 0.0003 | 0.8304 ± 0.0006 | 0.7122 ± 0.0003 |
| MOHGAT, PPI + Exp + Path + GO + Ds | multi-omics | 0.8066 ± 0.0007 | 0.9085 ± 0.0002 | 0.8477 ± 0.0002 | 0.7299 ± 0.0005 |
| MOHGAT. PPI + Path + GO + Seq + Ds | multi-omics | 0.8157 ± 0.0005 | 0.9101 ± 0.0009 | 0.8532 ± 0.0003 | 0.7309 ± 0.0001 |
| MOHGAT, PPI + GO + Seq + Path + Exp + Ds | multi-omics | 0.8501 ± 0.0006 | 0.9426 ± 0.0002 | 0.8738 ± 0.0004 | 0.7596 ± 0.0003 |
| MOHGAT, PPI + GO + Seq + Path + Exp + Ds | Mut | 0.7941 ± 0.0005 | 0.9015 ± 0.0001 | 0.8151 ± 0.0005 | 0.6950 ± 0.0002 |
| MOHGAT, PPI + GO + Seq + Path + Exp + Ds | Expr | 0.6408 ± 0.0007 | 0.8682 ± 0.0007 | 0.7280 ± 0.0012 | 0.6329 ± 0.0005 |
| MOHGAT, PPI + GO + Seq + Path + Exp + Ds | Meth | 0.6973 ± 0.0025 | 0.8739 ± 0.0005 | 0.7717 ± 0.0014 | 0.6535 ± 0.0008 |
| MOHGAT, PPI + GO + Seq + Path + Exp + Ds | Meth + Expr | 0.7162 ± 0.0012 | 0.8844 ± 0.0010 | 0.7666 ± 0.0023 | 0.6605 ± 0.0010 |
| MOHGAT, PPI + GO + Seq + Path + Exp + Ds | Mut + Meth | 0.8007 ± 0.0002 | 0.9173 ± 0.0003 | 0.8443 ± 0.0003 | 0.7189 ± 0.0004 |
| MOHGAT, PPI + GO + Seq + Path + Exp + Ds | Mut + Expr | 0.8004 ± 0.0006 | 0.9168 ± 0.0002 | 0.8275 ± 0.0002 | 0.7084 ± 0.0004 |
| MOHGAT-GAT, PPI + GO + Seq + Path + Exp + Ds | multi-omics | 0.8237 ± 0.0009 | 0.9132 ± 0.0011 | 0.8495 ± 0.0005 | 0.7201 ± 0.0020 |
| MOHGAT-GCN, PPI + GO + Seq + Path + Exp + Ds | multi-omics | 0.7786 ± 0.0018 | 0.8724 ± 0.0007 | 0.8076 ± 0.0006 | 0.6861 ± 0.0013 |
| MODIG, PPI + GO + Seq + Path + Exp + Ds | multi-omics | 0.8247 ± 0.0003 | 0.9266 ± 0.0001 | 0.8612 ± 0.0003 | 0.7374 ± 0.0002 |
| EMOGI, PPI + GO + Seq + Path + Exp + Ds | multi-omics | 0.7258 ± 0.0001 | 0.8439 ± 0.0002 | 0.7790 ± 0.0005 | 0.6587 ± 0.0007 |
| MTGCN, PPI + GO + Seq + Path + Exp + Ds | multi-omics | 0.7042 ± 0.0004 | 0.7531 ± 0.0003 | 0.7567 ± 0.0007 | 0.6477 ± 0.0002 |
| Chebnet, PPI + GO + Seq + Path + Exp + Ds | multi-omics | 0.7470 ± 0.0005 | 0.8803 ± 0.0001 | 0.8031 ± 0.0003 | 0.7029 ± 0.0014 |
3.3 Perturbation experiments
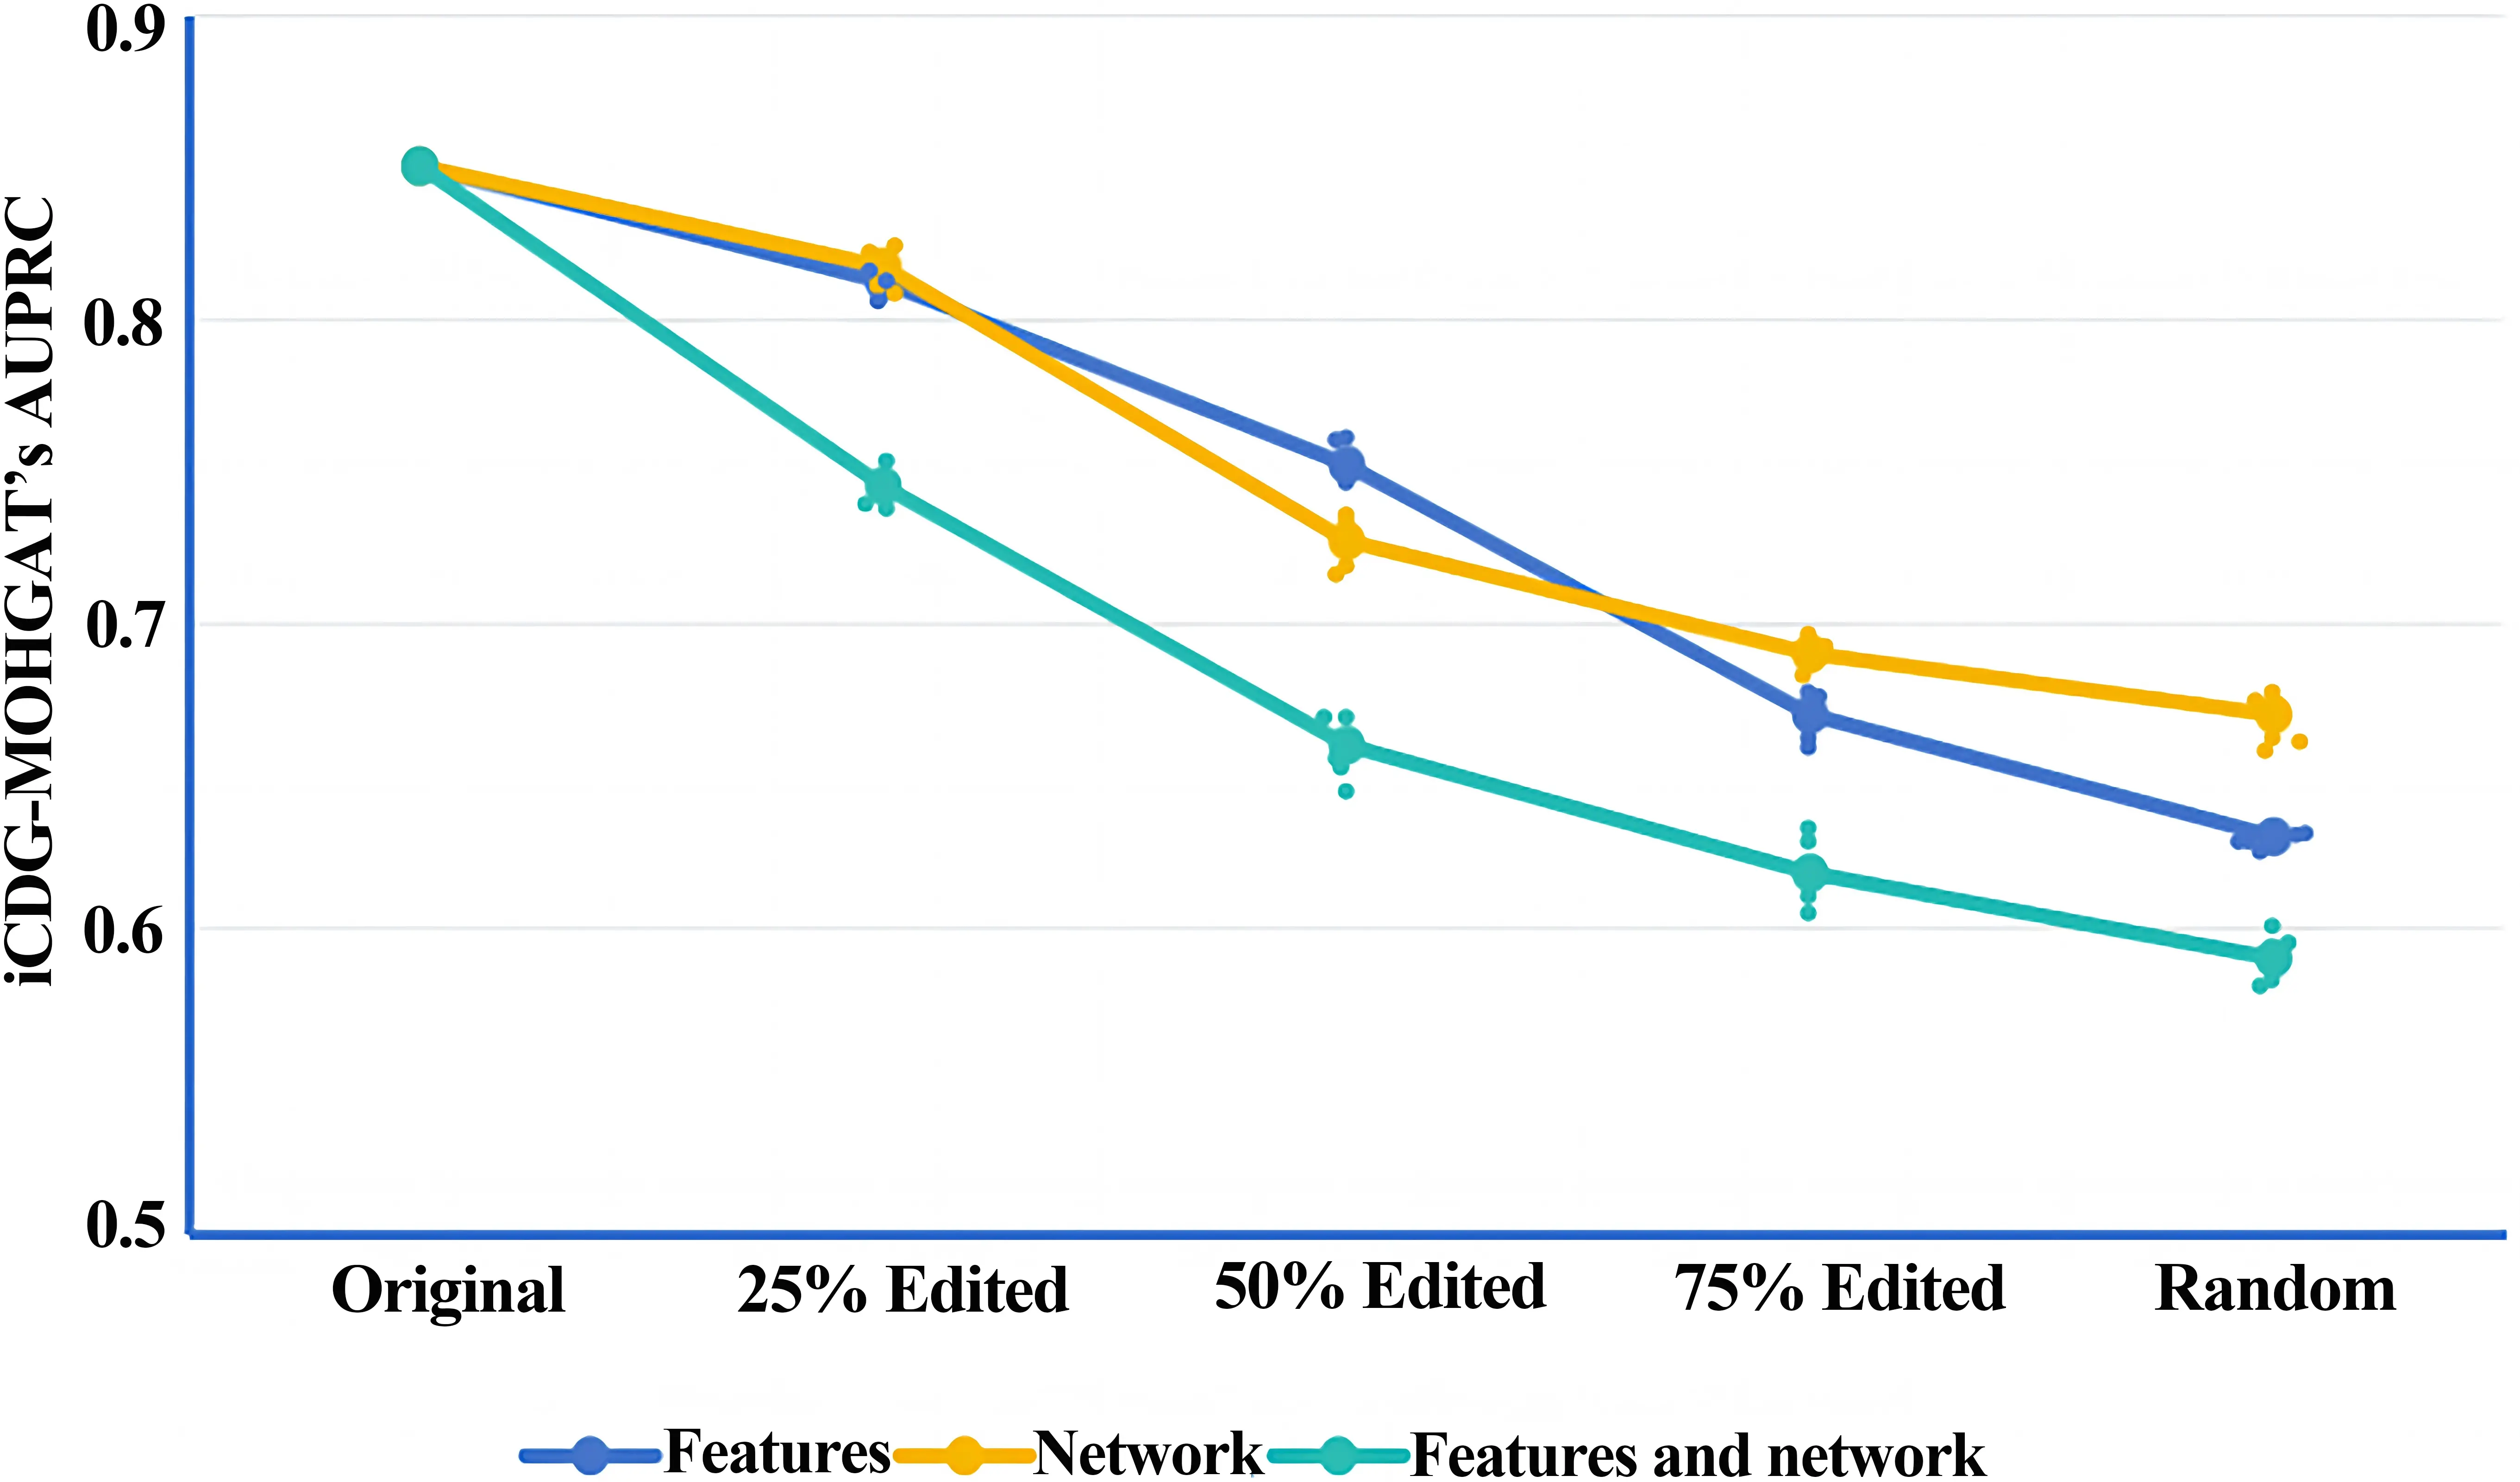
To delve deeper into model performance and the significance of multi-omics data, we systematically conducted perturbation experiments targeting the node features and network structure within the model[20]. Specifically, node feature perturbations involved randomly selecting pairs of nodes and swapping their corresponding feature sets, affecting 25%, 50%, 75%, and all nodes across the network. Structural perturbations were enacted through a double-edge swapping strategy: two pairs of edges, such as edge a-b and edge c-d, were selected and reconnected as a-c and b-d, sequentially repeating this method until 25%, 50%, 75%, and all edges were swapped. Throughout this process, the degree of each node was preserved.
Focusing solely on structural perturbations, we incrementally increased the proportion of edges randomly swapped between node pairs from 25% to 50%, 75%, and ultimately 100%, where all nodes were randomly connected while maintaining node degree. Likewise, during perturbations of node features, feature vectors were swapped between nodes in equal proportions. Ultimately, we merged perturbations of both node features and network structure, concurrently affecting an equivalent percentage of nodes and edges within the network. Through this compounded experimental setup, the findings demonstrated that the AUPRC value of the iCDG-MOHGAT’s model significantly decreased as the degree of perturbation deepened. However, even at the highest degree of combined perturbations, the model still sustained approximately 59% AUPRC (Figure 3), indicating the iCDG-MOHGAT's capacity to identify cancer-driving genes, and thus validating the key role of PPI network structural characteristics in differentiating between cancer-driving and non-cancer-driving genes.
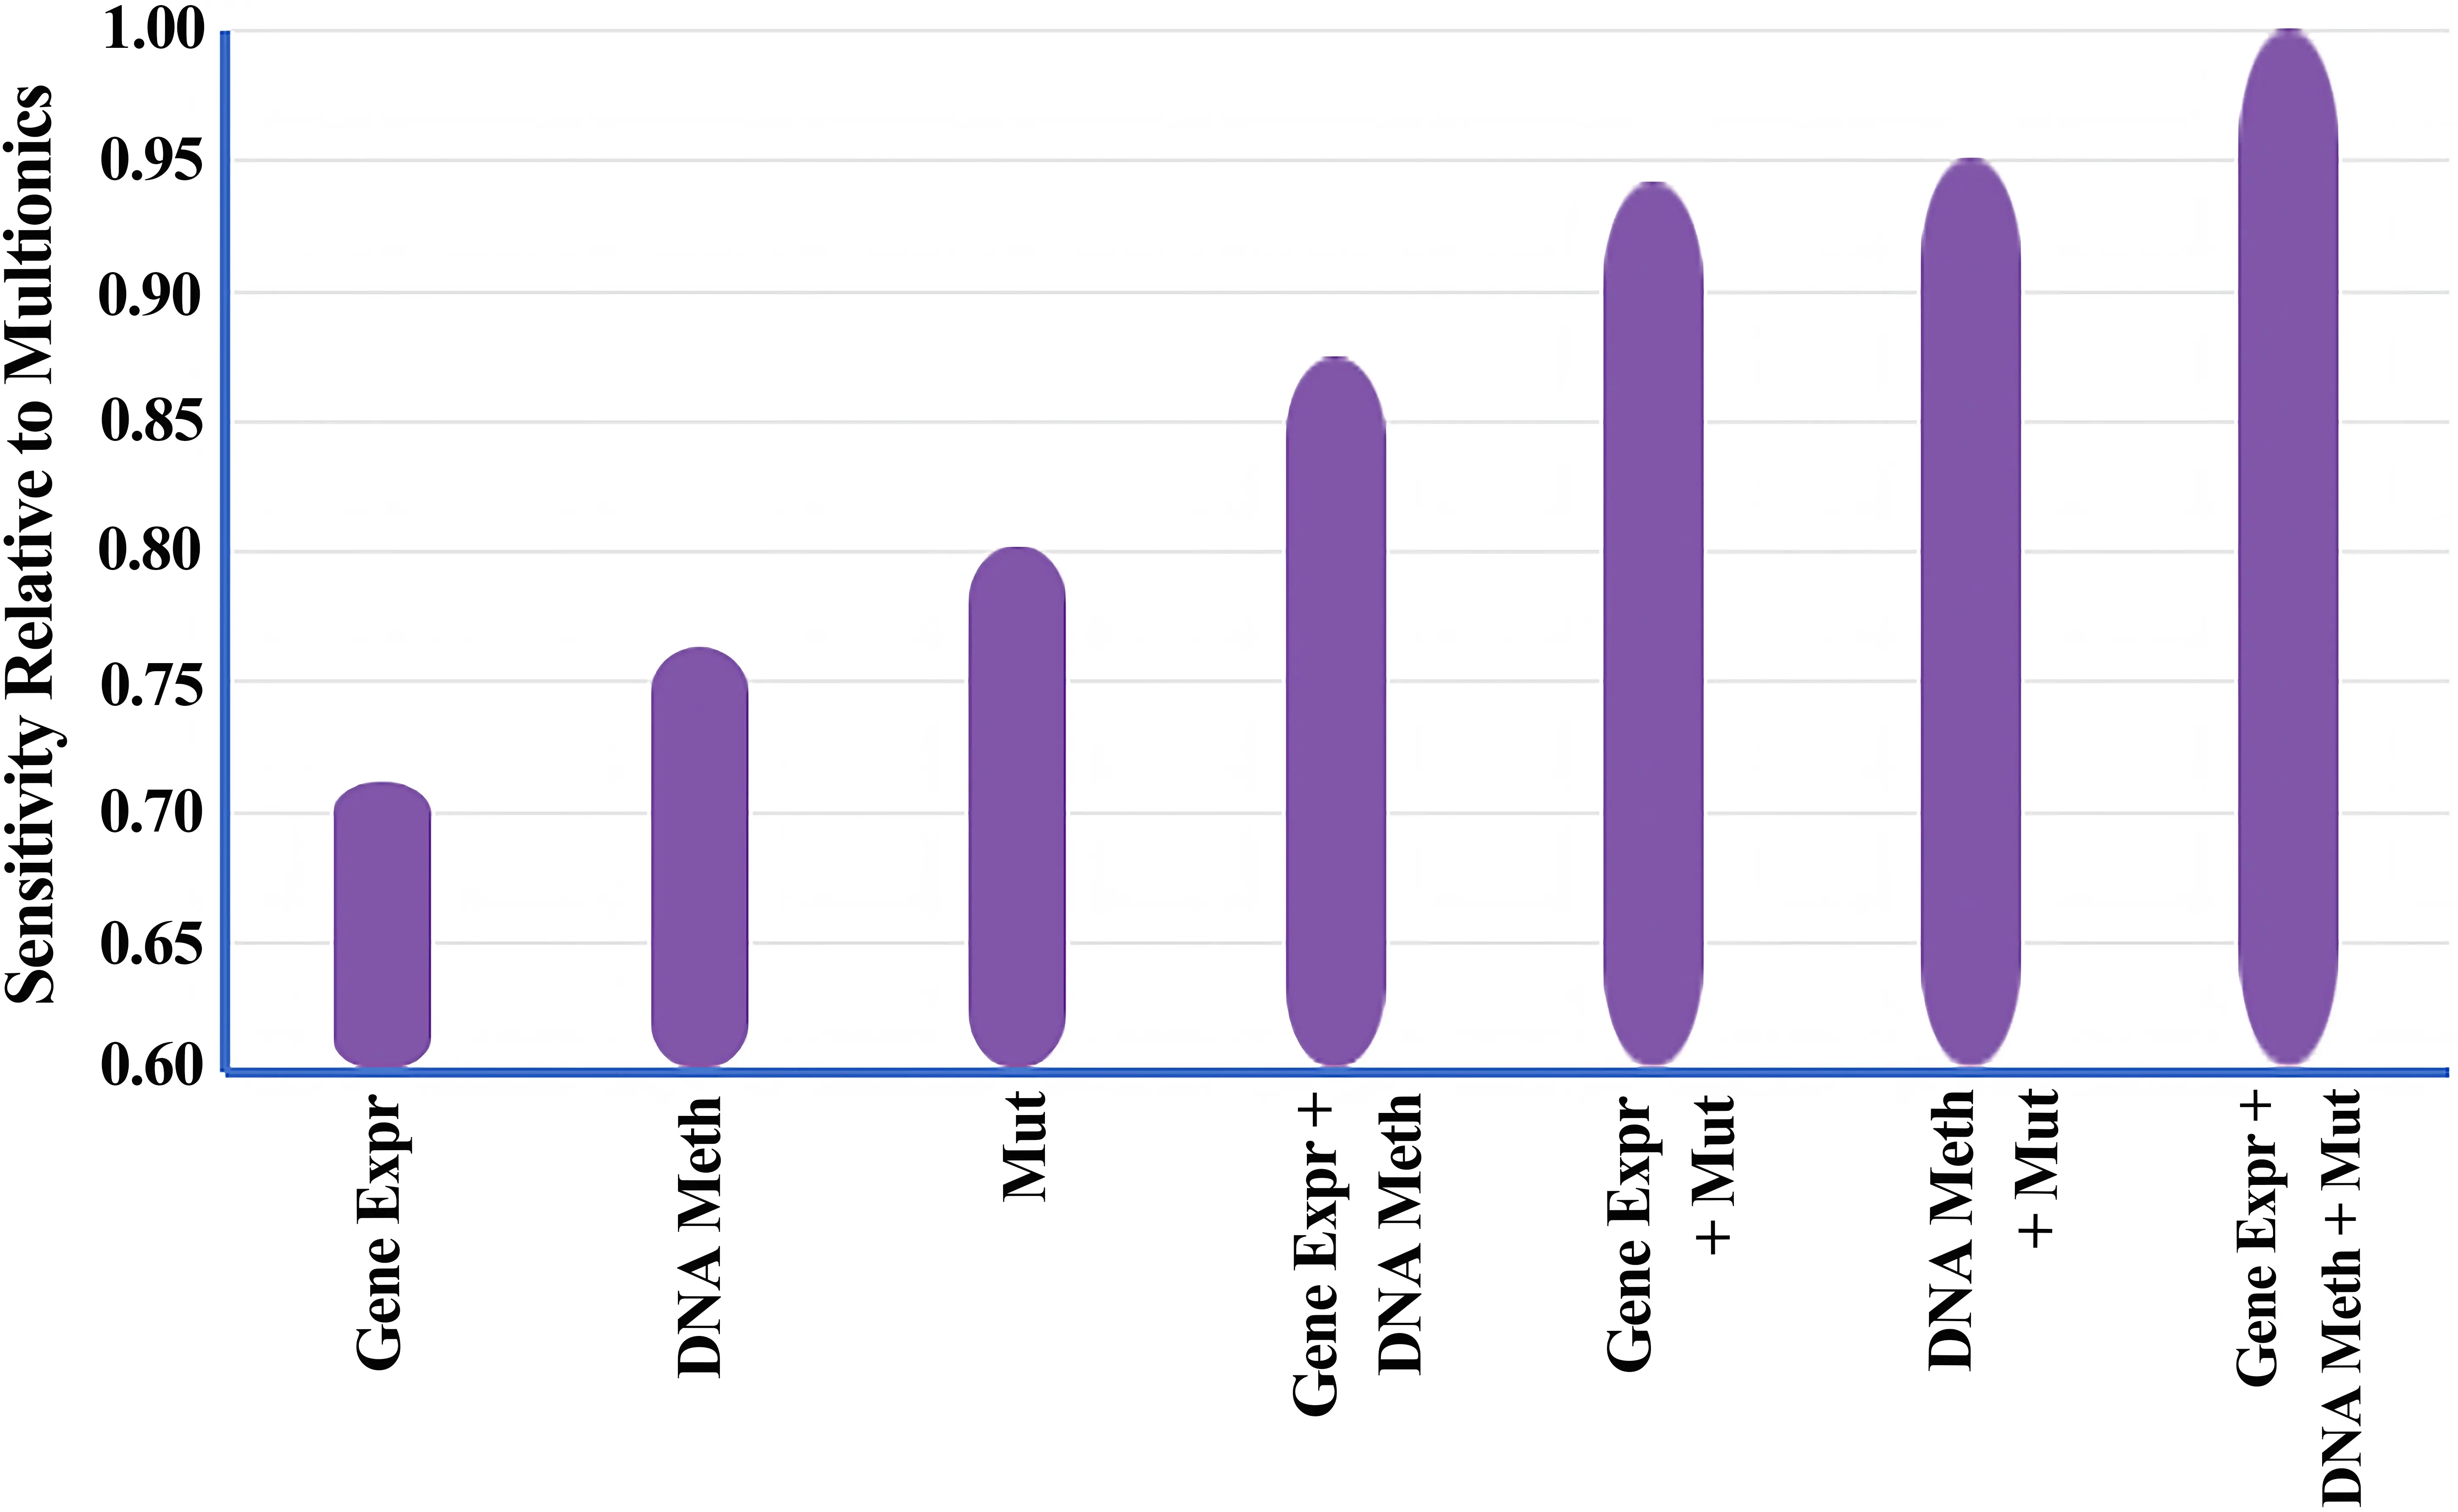
The perturbation experiments underline the vital and indispensable role played by both network structure and omics characteristics in ensuring the accuracy of the model. Additionally, by systemically employing three types of omics and five subsets of networks on the MG-STRING PPI network to train the model, and independently measuring its AUPRC value, it was evident that a gradual enhancement in predictive performance emerged with the integration of more omics types and networks. When selecting omics data, models utilizing only one omics type showed a notable decline in performance across all configurations, except for the model that utilized only Mut (Table 1), which accentuated the paramount importance of mutation rate in the classification of cancer genes, aligning with prior expectations. To further validate the advantages of using multi-omics data, we utilized the iCDG-MOHGAT model, which was trained on subsets of omics types, in tandem with the MG-STRING PPI network, to compute the percentage of known cancer genes included in each model's predictions (sensitivity), as depicted in Figure 4. The bar graph illustrates the sensitivity scores of each model relative to the full multi-omics setup, sorted by their sensitivity. For instance, a value of 0.90 suggests that the iCDG-MOHGAT, when trained on that specific omics subset, can attain 90% of the sensitivity exhibited by the comprehensive model. We found that the iCDG-MOHGAT's sensitivity on subsets of omics types was consistently lower in comparison to a complete multi-omics setup, with gradual increases as additional omics information was incorporated, further corroborating our standpoint.
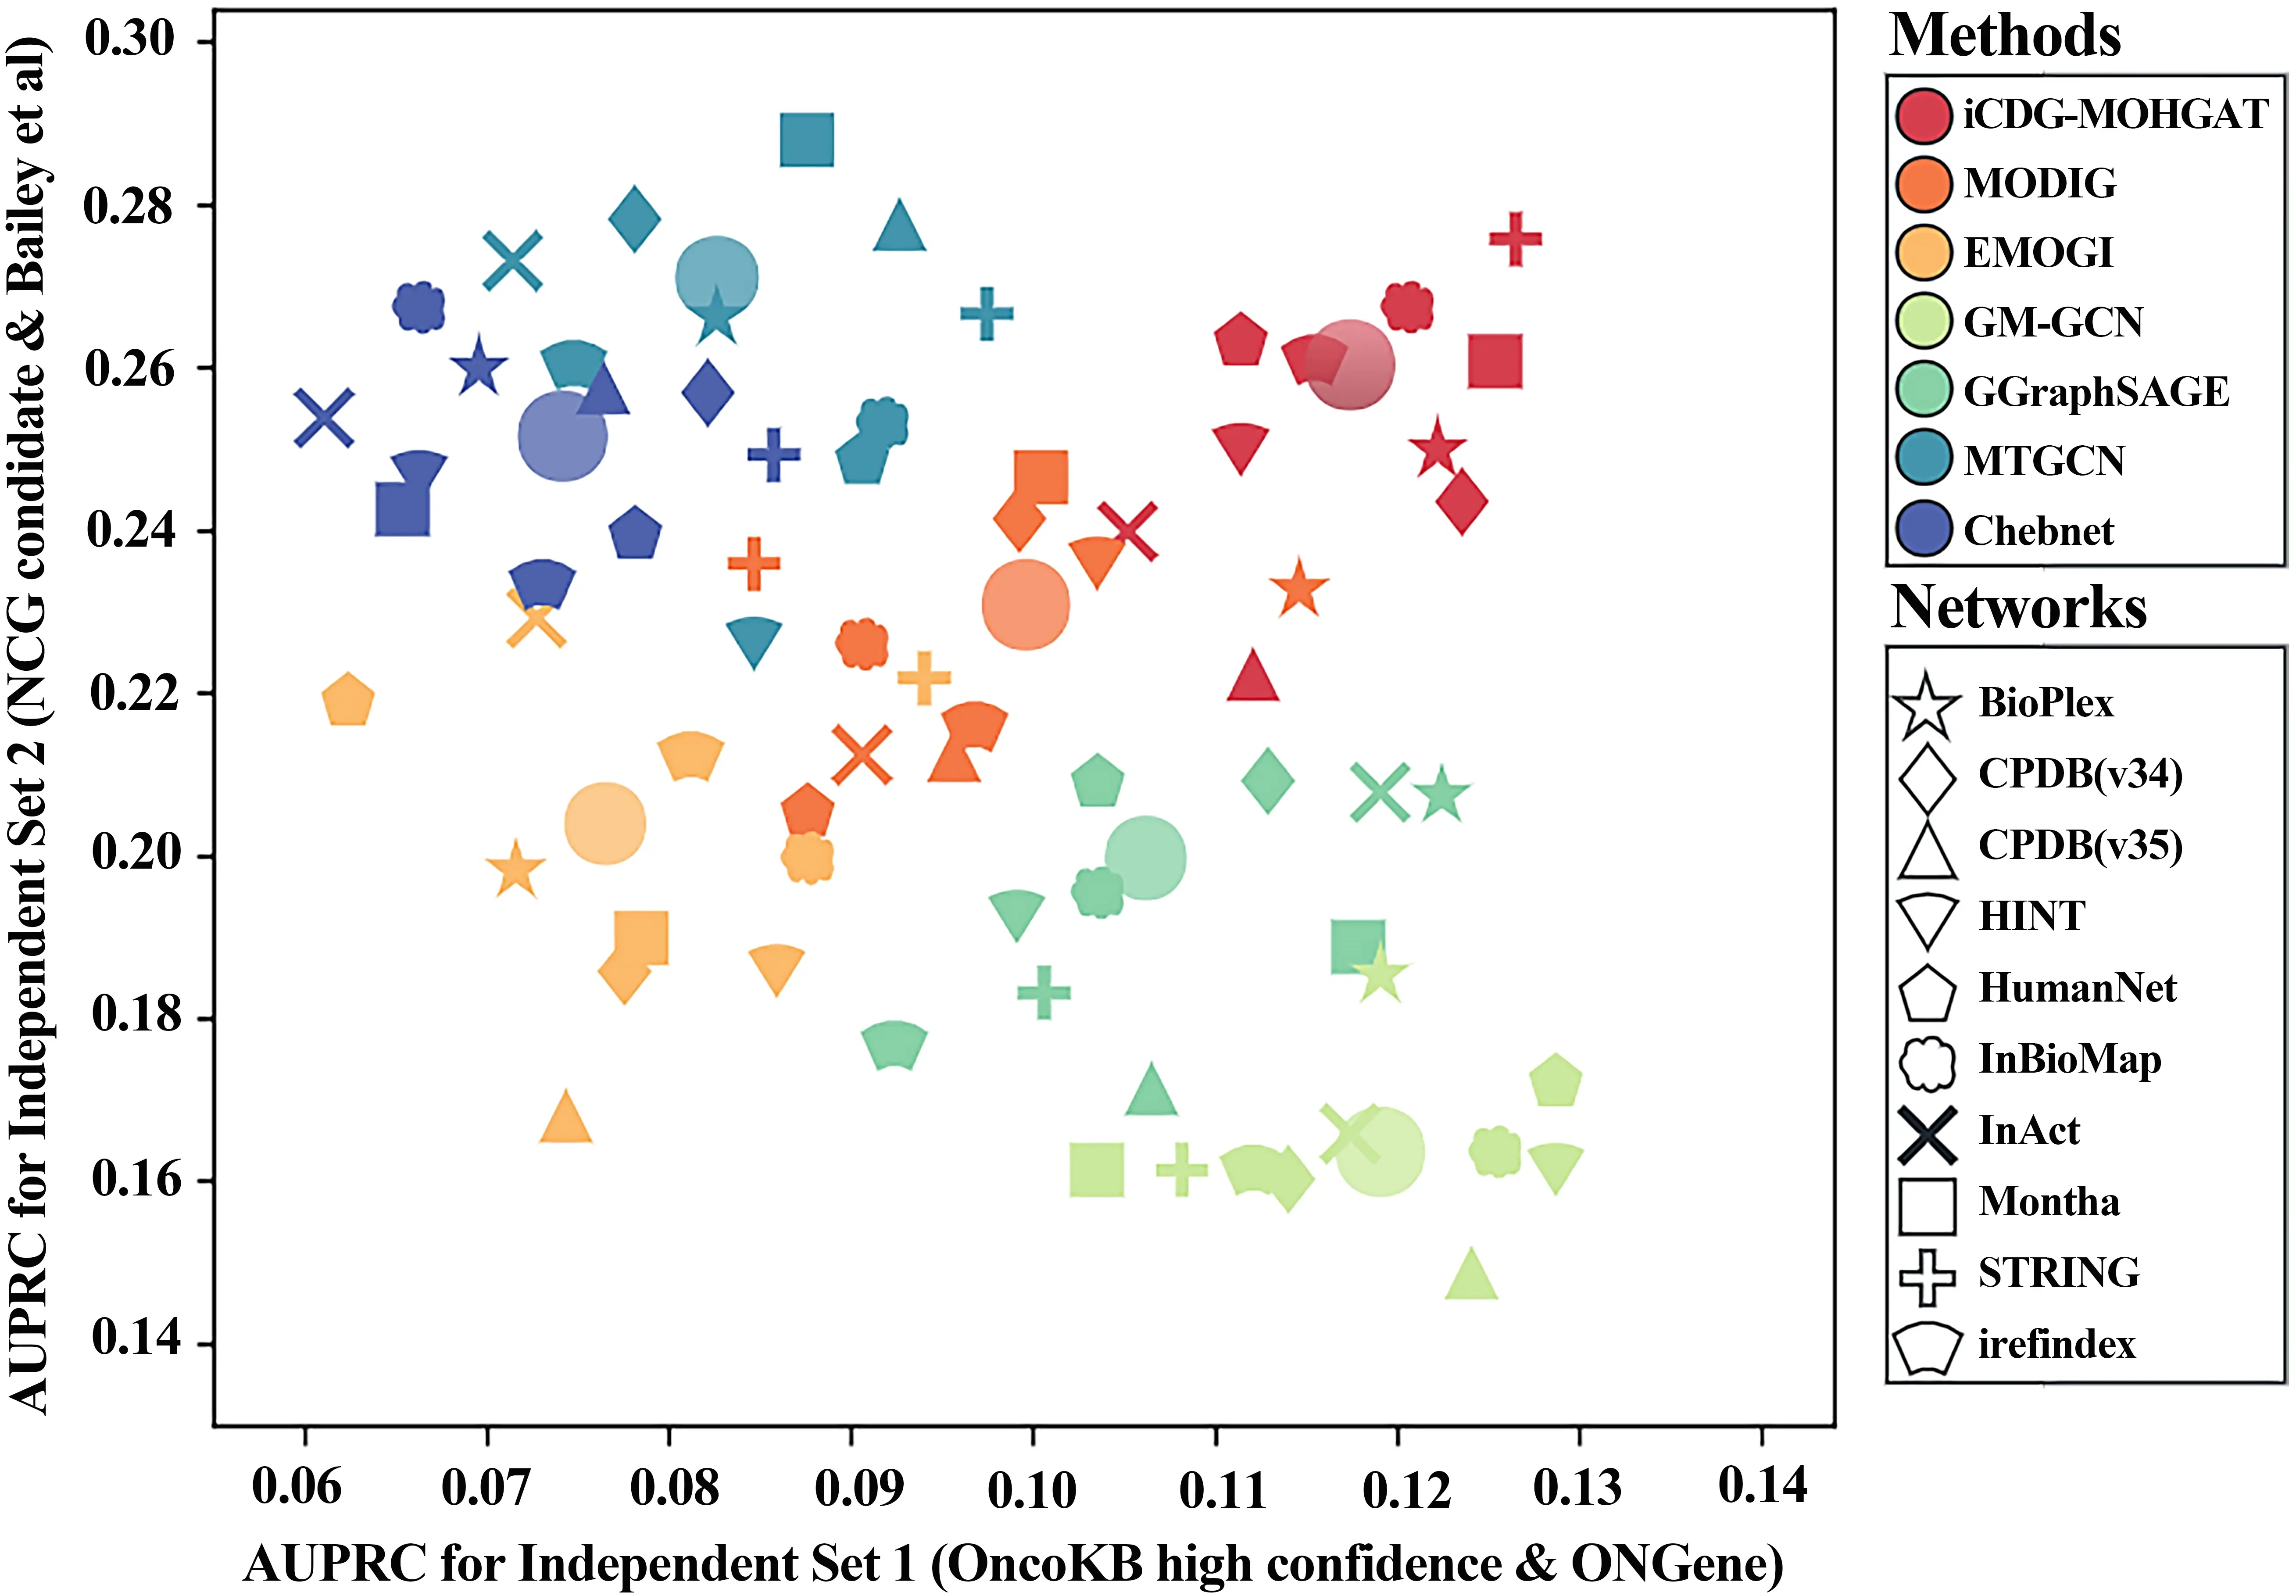
3.4 Independent test set performance
To investigate whether the performance of the model is biased towards a particular dataset, we collected two additional cancer gene sets from other sources and constructed two independent test sets for benchmarking different methods. As shown in Figure 5, the first group (independent group 1) includes validated cancer genes with oncogenic effect annotations from OncoKB and cancer genes from ONGene. The second group (independent group 2) includes candidate cancer genes from NCGs that do not overlap with known cancer gene sets. We compared them on two separate datasets. The results showed that iCDG-MOHGAT exhibited robustness across different cancer gene sets.
3.5 Prediction of new driver genes for cancer
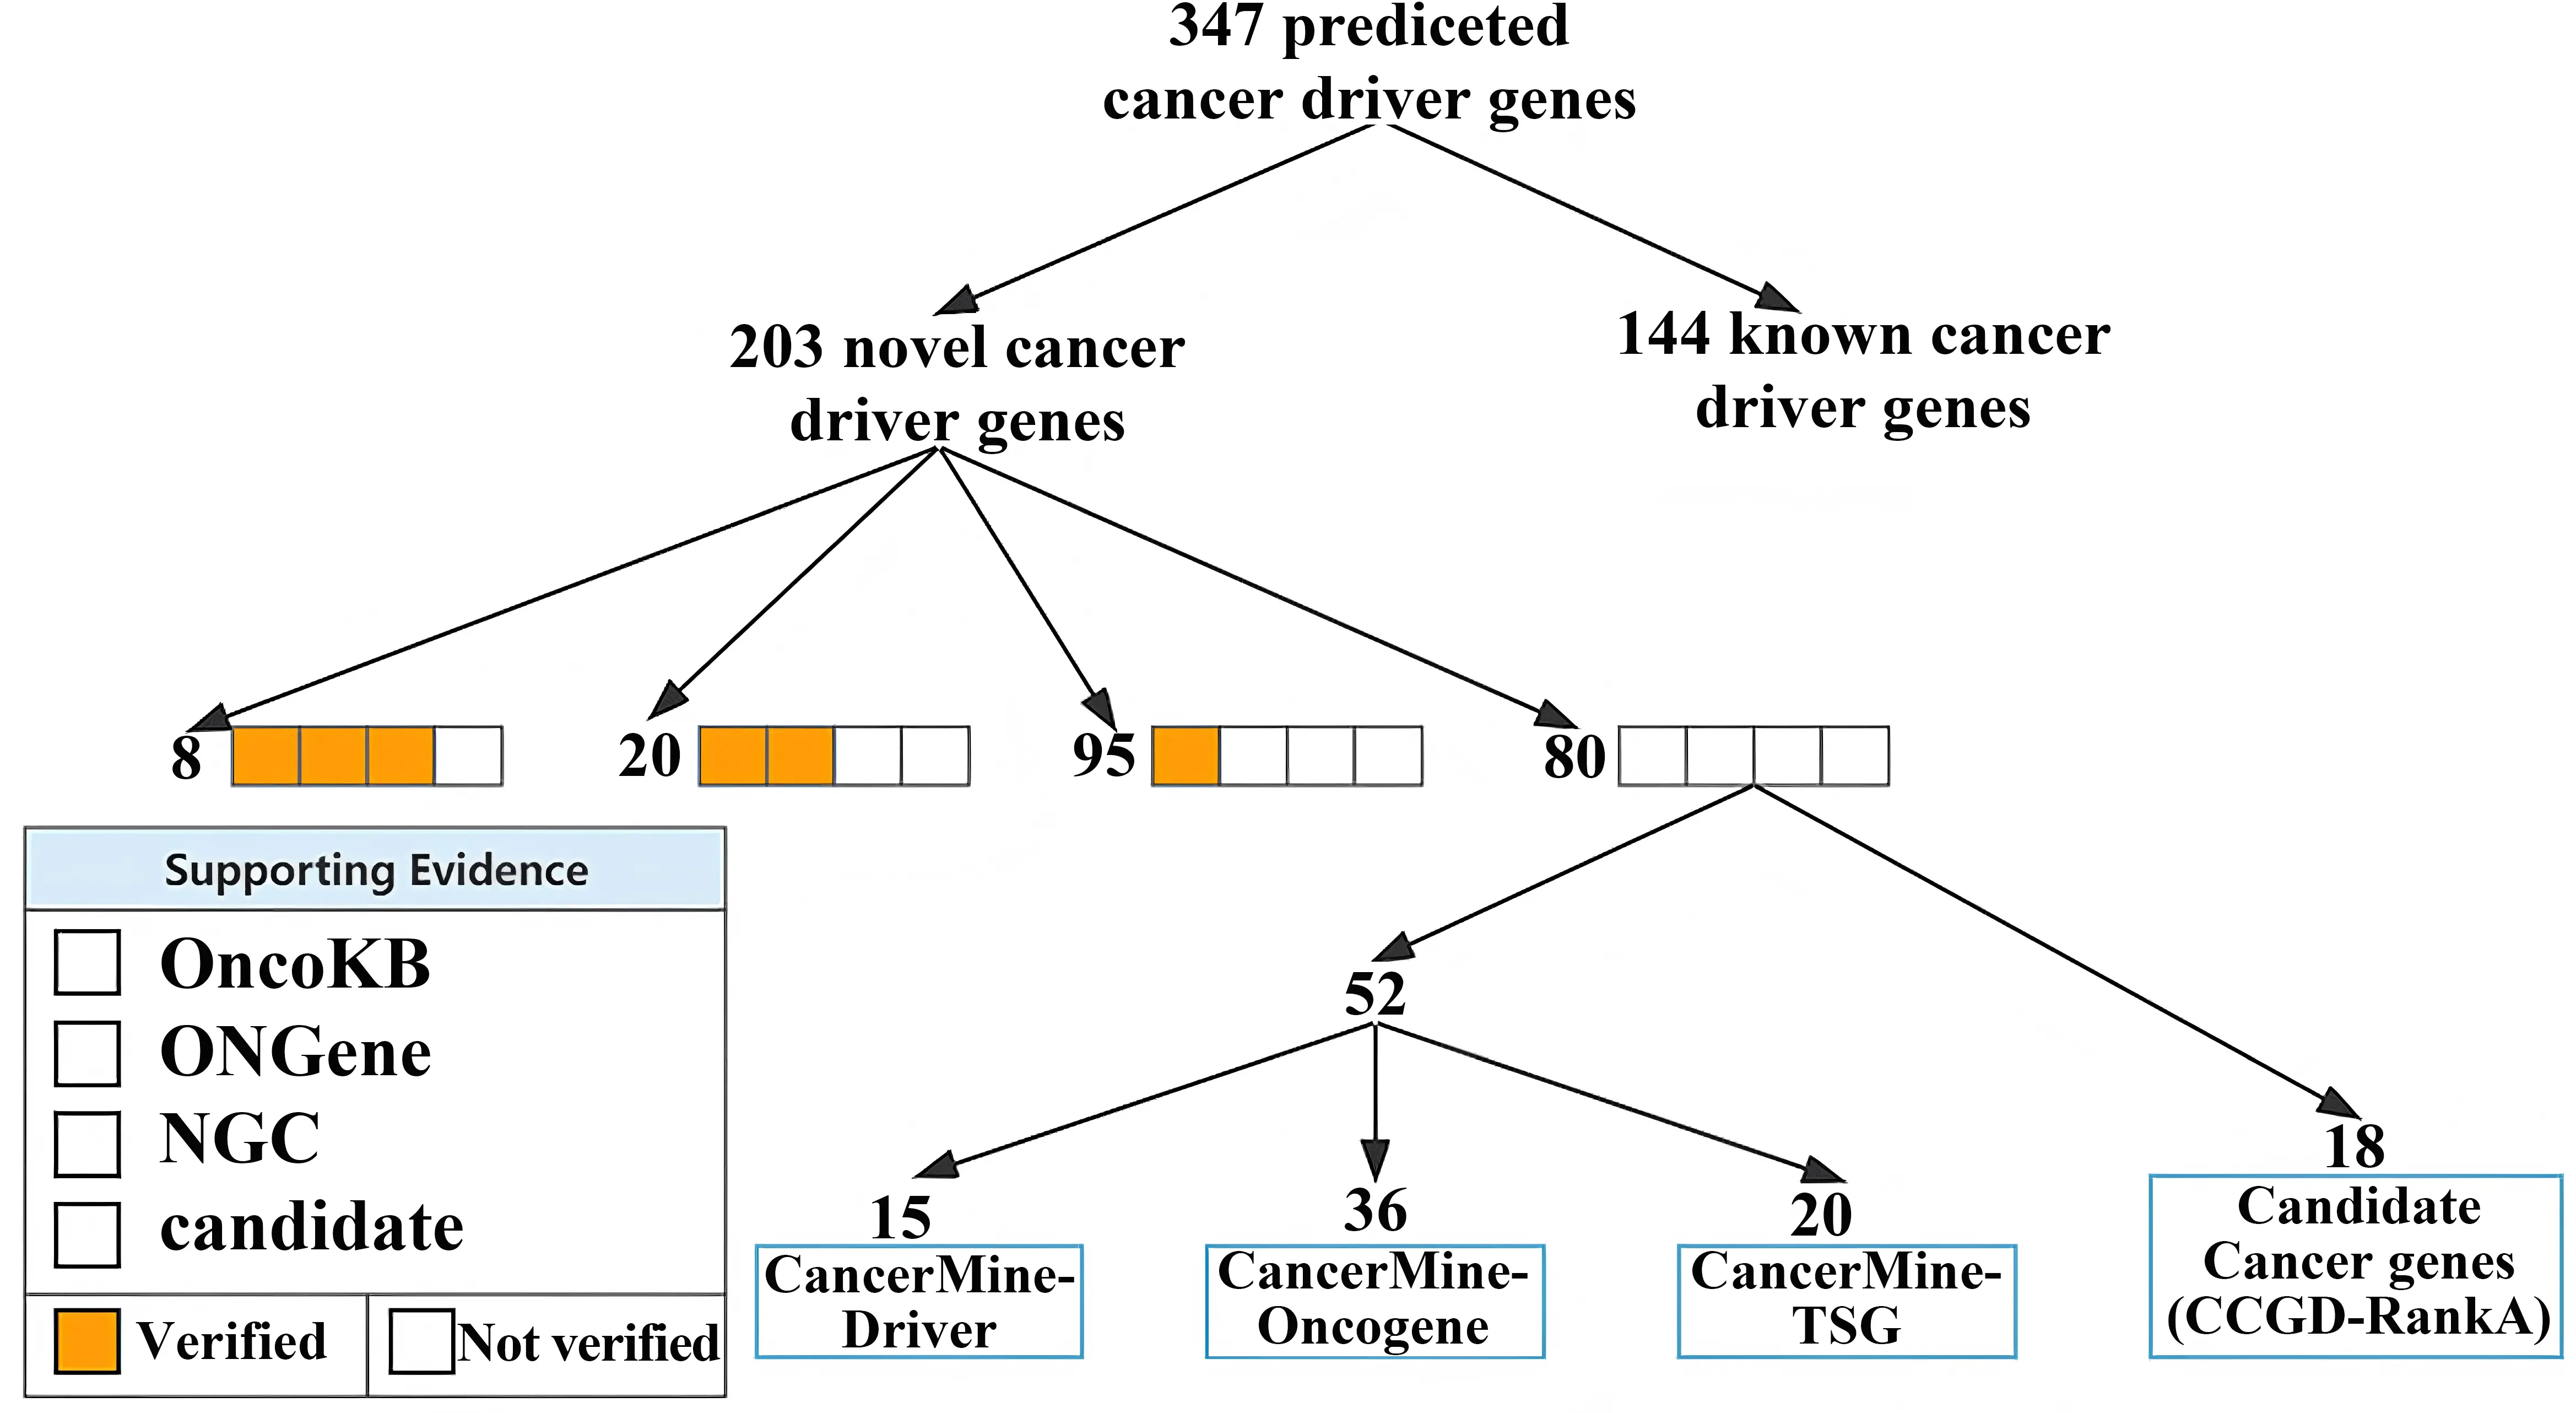
Trained on all training data, we filtered the predictions by setting a threshold of 0.99, resulting in 347 predicted cancer driver genes, 146 of the 347 predicted cancer driver genes were known cancer driver genes.
As shown in Figure 6, we also analyzed these new cancer genes through two candidate cancer driver gene databases. One is the CancerMine resource, which is text-based and a regularly updated database of different types of cancer drivers, oncogenes, and tumor inhibitors. A higher number of citations represents a higher probability that the gene is a cancer-driving gene. The other is the Cancer Candidate Gene Database. About 91% (184/203) of predicted new driver genes had evidence of at least one supporting cancer gene.
As shown in Figure 7, compared with other methods, we found that more than 53% of the new driver genes did not overlap with other methods, indicating that MODIG[15] can uniquely predict new driver genomes that other methods cannot recognize.
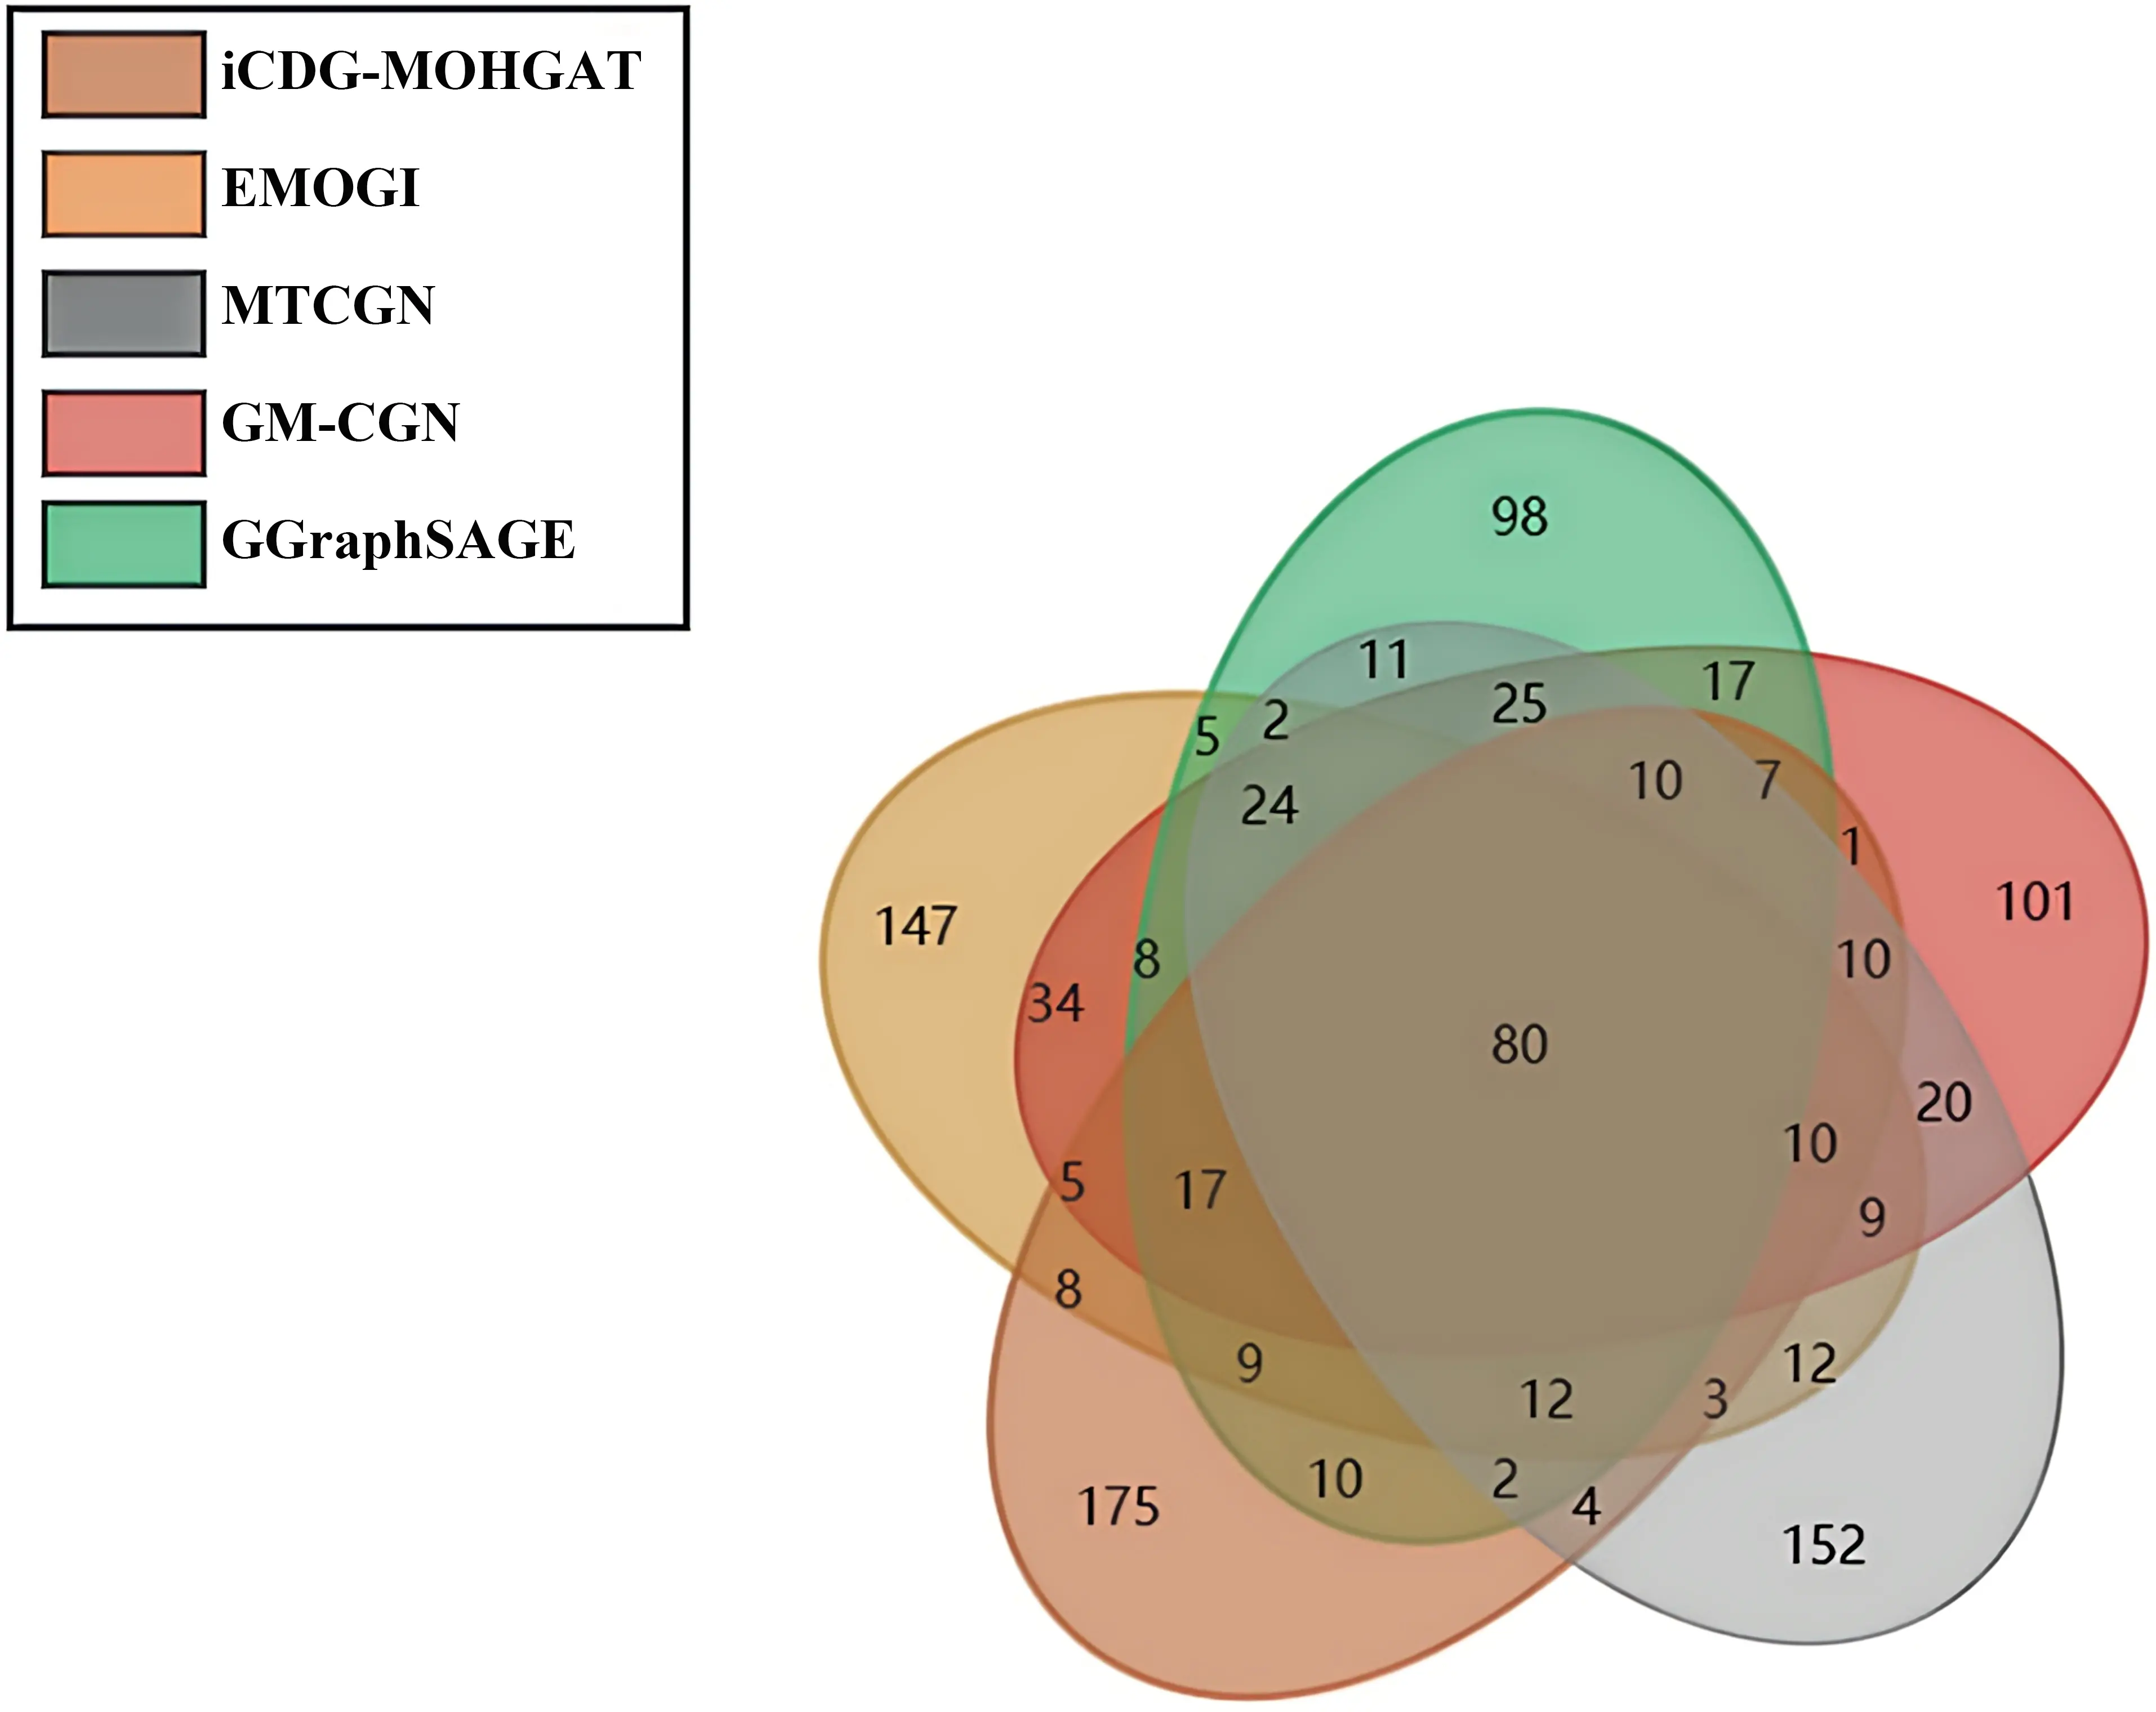
Figure 7. More than 53% of the new driver genes predicted by iCDG-MOHGAT did not overlap with other methods.
In addition, iCDG-MOHGAT is a model that adeptly leverages the attention mechanism, and through the interpretability of HGAT, we’ve analyzed the attention coefficients of newly predicted genes within a multi-dimensional gene network, highlighting the 30 most significant genes (Table 2). Furthermore, as shown in Figure 8, iCDG-MOHGAT employs the attention mechanism to amalgamate embeddings from diverse networks, facilitating the computation of individual network contributions to gene classification. The contributions of varying networks to the score of the top 30 newly predicted genes are depicted in Figure 9.
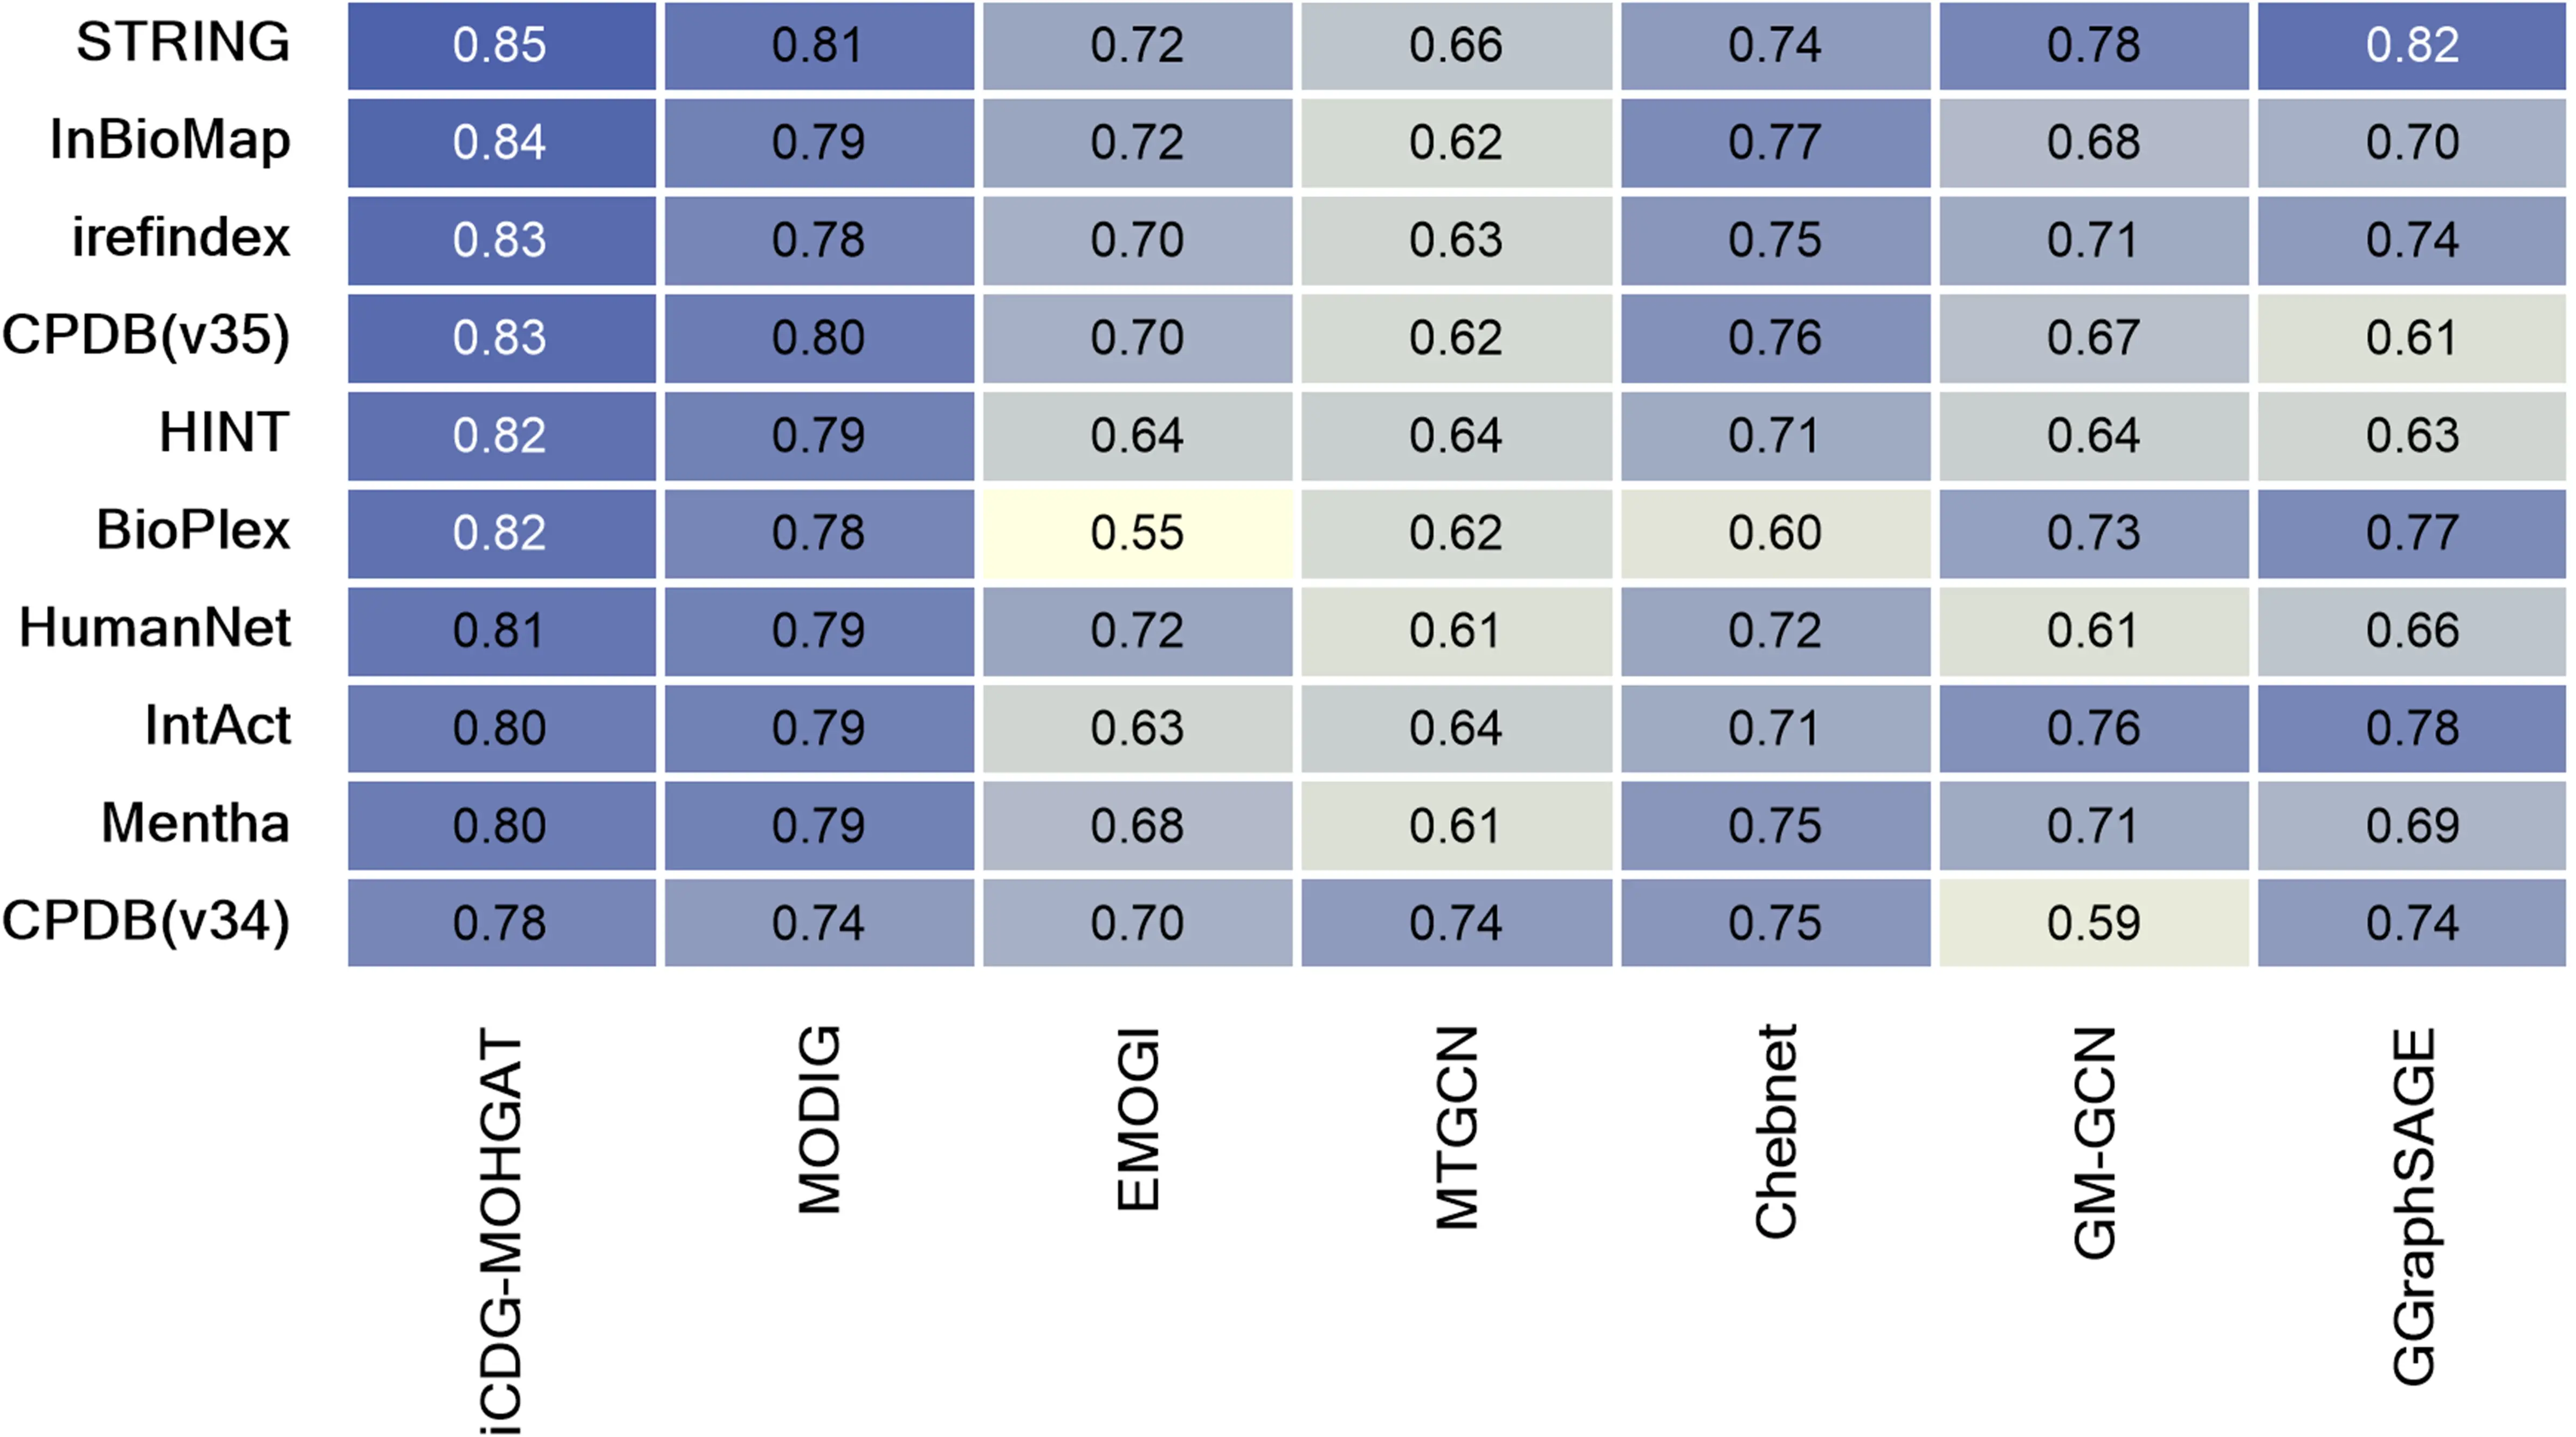
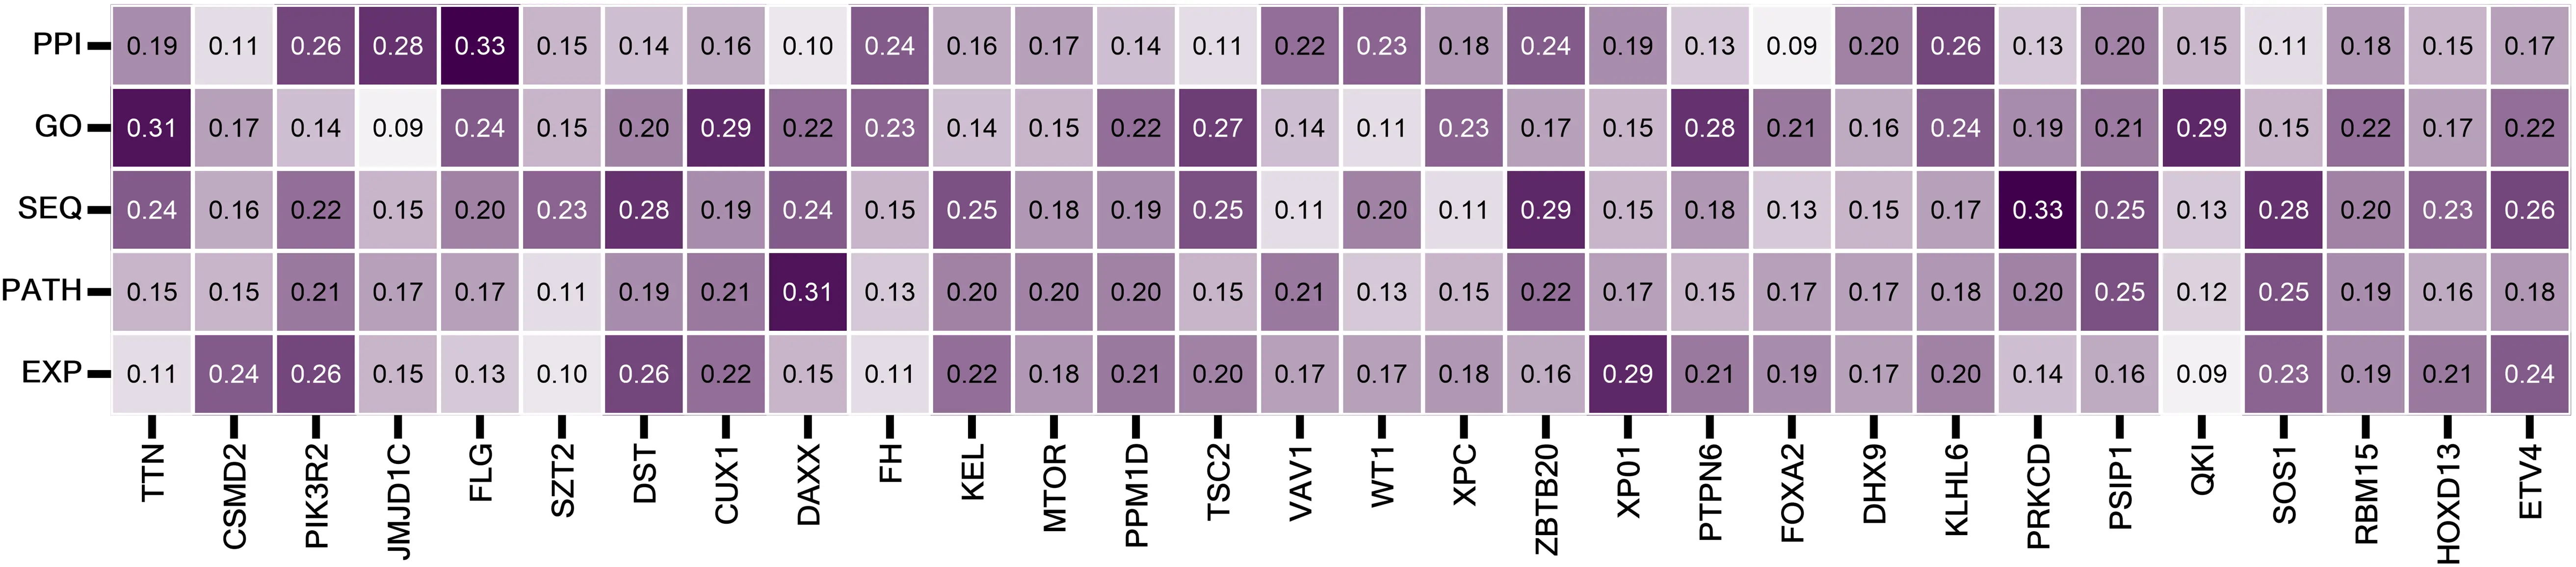
Table 2. The 30 most significant genes.
| ID | name |
| 1 | TTN |
| 2 | CSMD2 |
| 3 | PIK3R2 |
| 4 | JMJD1C |
| 5 | FLG |
| 6 | SZT2 |
| 7 | DST |
| 8 | CUX1 |
| 9 | DAXX |
| 10 | FH |
| 11 | KEL |
| 12 | MTOR |
| 13 | PPM1D |
| 14 | TSC2 |
| 15 | VAV1 |
| 16 | WT1 |
| 17 | XPC |
| 18 | ZBTB20 |
| 19 | XPO1 |
| 20 | PTPN6 |
| 21 | FOXA2 |
| 22 | DHX9 |
| 23 | KLHL6 |
| 24 | PRKCD |
| 25 | PSIP1 |
| 26 | QKI |
| 27 | SOS1 |
| 28 | RBM15 |
| 29 | HOXD13 |
| 30 | ETV4 |
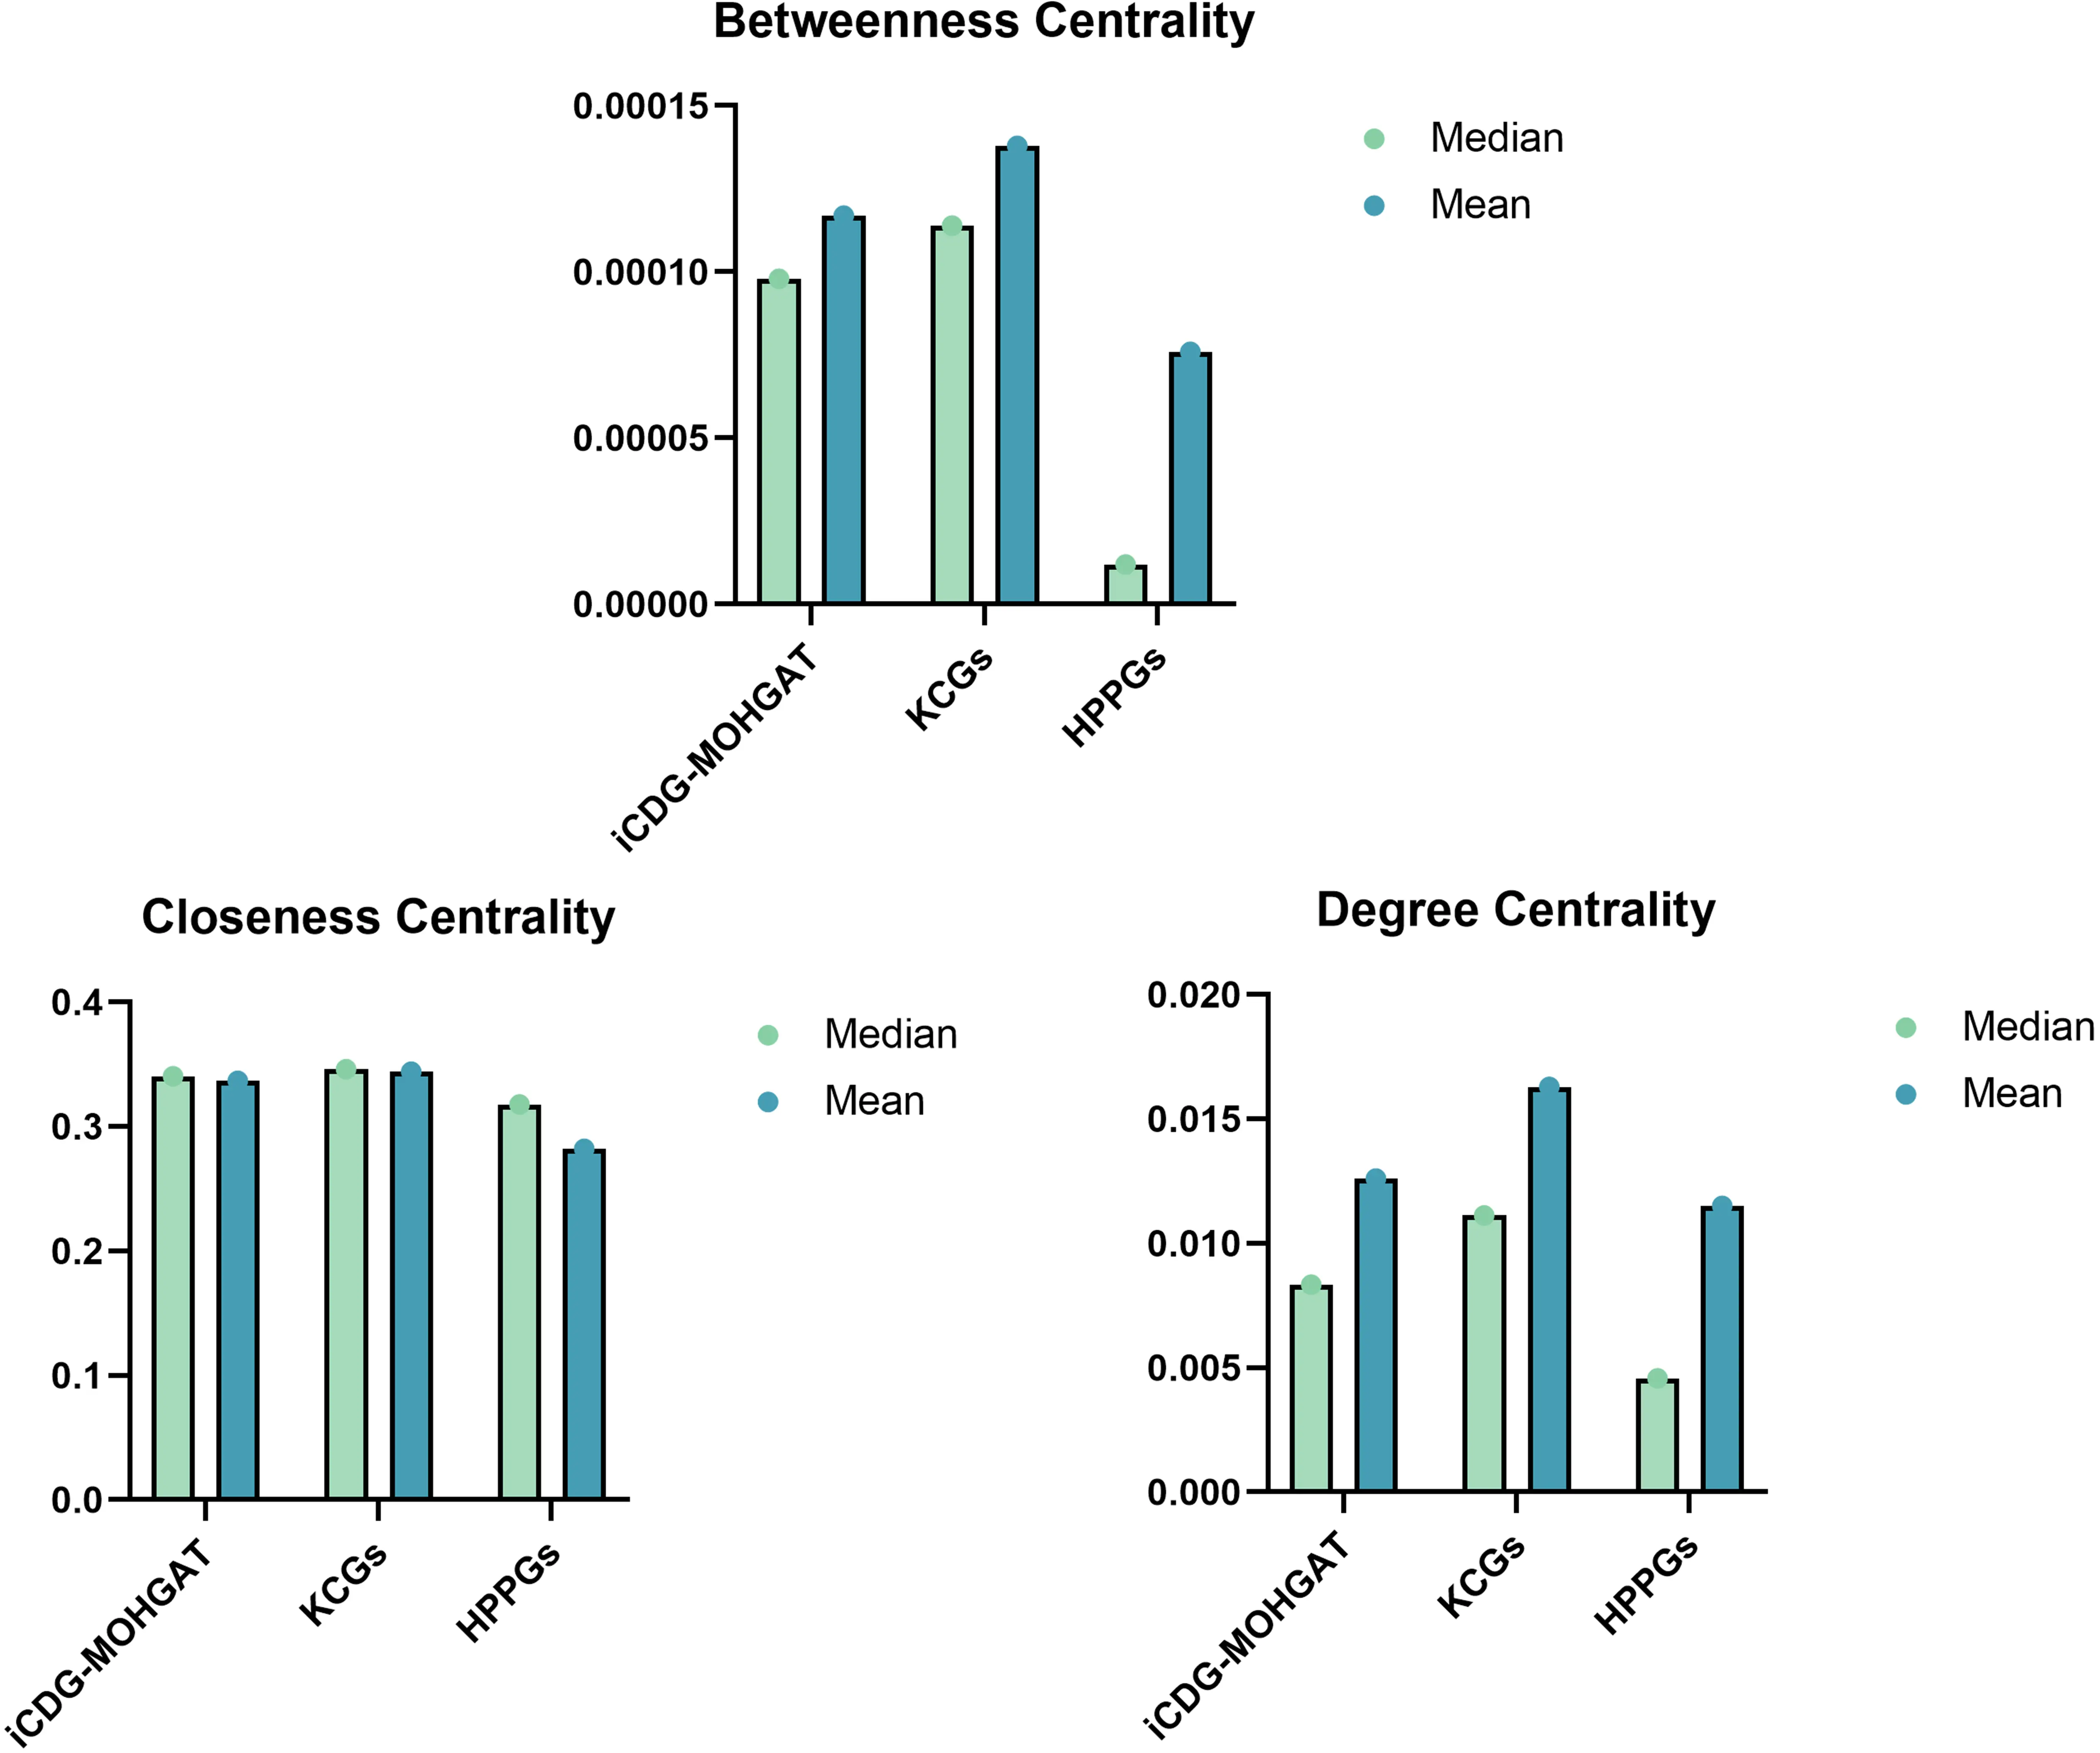
To further evaluate model performance, the importance of genes is considered to be highly correlated with their centrality in the network according to the rules of centrality lethality. As shown in Figure 10, based on the constructed multidimensional gene network, we calculated three centrality indicators for each gene: degree centrality, proximity centrality, and betweenness centrality. Most of the predicted driver genes were found to be significantly more central than HPPG (high-probability passenger genes).
4. Discussion
We have introduced a novel computational model named iCDG-MOHGAT, which precisely identifies cancer driver genes by integrating multi-omics pan-cancer data, intricate multidimensional gene networks, coupled with disease semantic similarity networks. In the initial stages of model construction, we extensively collected various types of gene association information, including, but not limited to, mutation frequency, gene expression patterns, and protein-protein interactions, laying the foundation for a richly connected multidimensional gene network. Furthermore, to approach a macro perspective of disease progression, we meticulously established a disease semantic similarity network that reflects the subtle interconnections between various cancers. Considering the complexity and heterogeneity of biological networks, we employed a cutting-edge heterogeneous graph attention network model for learning, allowing our system to efficiently extract and process key features from both the multidimensional gene network and the disease semantic similarity network. We also developed an innovative fusion learning module that enables the organic combination and synergistic optimization of features across different network layers, which is critical for enhancing the overall predictive power and robustness of the model. For the ultimate prediction of cancer driver genes, we did not settle for traditional machine learning classifiers, instead, we adopted an improved sparrow algorithm to precisely adjust and optimize the parameters of the random forest classifier. The application of this algorithm ensures the balance between the model's generalizability and predictive accuracy.
Experimental results show that iCDG-MOHGAT outperforms six state-of-the-art methods (MODIG, EMOGI, MTGCN, Chebnet, GM-GCN, and GGraphSAGE). MODIG employs GAT to learn gene representations within a given dimension and combines this with a joint learning module to fuse cross-dimensional information, effectively addressing the key challenge of integrating multi-omics data with gene association information. However, it does not delve into the differences in the contributions of gene networks of different dimensions to specific cancer types or driver gene families. GGraphSAGE combines GAT and GraphSAGE, integrating multi-omics data and biological network features to achieve cancer driver gene identification for specific tumor types. However, GGraphSAGE does not validate the impact of different confidence thresholds on model performance and does not consider the tissue specificity of the PPI network. Using a general-purpose network may not accurately reflect the actual gene interactions in specific tumor types. EMOGI proposes an interpretable machine learning method based on GCN, which integrates pan-cancer multi-omics data with a PPI network to identify cancer driver genes. The PPI network used by EMOGI is a general-purpose network and does not consider the specificity of gene interactions in different cancer types, which may limit the accuracy of identifying some tissue-specific driver genes. More impressively, over ninety percent of the newly predicted driver genes have been supported by at least one experimental or clinical study, indicating their pivotal role in cancer development. Additionally, to further validate the model’s performance, we conducted ablation experiments, perturbation experiments, independent test set evaluations, and centrality analyses, with most of the new predictive cancer driver genes being uniquely predicted by our model, thus demonstrating the comprehensive superiority of iCDG-MOHGAT.
5. Limitation
Despite achieving significant success in this endeavor, we are acutely aware of the areas where the model could be improved. As biological data grows in complexity, the variety of node properties and edge types will inevitably increase the overall computational burden of the model and may affect its accuracy in prediction. Moreover, the presence of multidimensional network noise factors could undermine the overall reliability of the network. In response to these challenges, our future work will concentrate on developing more efficient data processing algorithms and noise reduction techniques, aiming to ensure network stability while further enhancing the model’s performance and predictive accuracy.
Authors contribution
Yuan L: Conceptualization, investigation, supervision, writing-original draft, writing review & editing.
Zhao J: Data curation, visualization, writing-original draft, writing review & editing.
Conflicts of interest
The authors declare no conflicts of interest.
Ethical approval
Not applicable.
Consent to participate
Not applicable.
Consent for publication
Not applicable.
Availability of data and materials
Data supporting the findings of this study are available from the corresponding author upon reasonable request.
Funding
None.
Copyright
© The Author(s) 2026.
References
-
1. Yuan S, Almagro J, Fuchs E. Beyond genetics: Driving cancer with the tumour microenvironment behind the wheel. Nat Rev Cancer. 2024;24(4):274-286.[DOI]
-
2. Karras P, Black JRM, McGranahan N, Marine JC. Decoding the interplay between genetic and non-genetic drivers of metastasis. Nature. 2024;629(8012):543-554.[DOI]
-
3. Chen X, Agustinus AS, Li J, DiBona M, Bakhoum SF. Chromosomal instability as a driver of cancer progression. Nat Rev Genet. 2025;26(1):31-46.[DOI]
-
4. Vrahatis AG, Lazaros K, Kotsiantis S. Graph attention networks: A comprehensive review of methods and applications. Future Internet. 2024;16(9):318.[DOI]
-
5. Xue J, Shen B. A novel swarm intelligence optimization approach: Sparrow search algorithm. Syst Sci Control Eng. 2020;8(1):22-34.[DOI]
-
6. Hu Z, Li G, Luo X, Peng W, Liu J, Zhu X, et al. Identification of cancer driver genes based on dynamic incentive model. IEEE/ACM Trans Comput Biol Bioinform. 2024;21(6):2371-2381.[DOI]
-
7. Yang Q, Jung J, Deschamps T, Xu X, Liu S. TDMD: A database for dynamic color mesh quality assessment study. IEEE Trans Vis Comput Graph. 2024;31(9):5421-5434.[DOI]
-
8. Nunes L, Li F, Wu M, Luo T, Hammarström K, Torell E, et al. Prognostic genome and transcriptome signatures in colorectal cancers. Nature. 2024;633(8028):137-146.[DOI]
-
9. Weinstock JS, Gopakumar J, Burugula BB, Uddin MM, Jahn N, Belk JA, et al. Aberrant activation of TCL1A promotes stem cell expansion in clonal haematopoiesis. Nature. 2023;616(7958):755-763.[DOI]
-
10. Luccioni AS, Akiki C, Mitchell M, Jernite Y. Stable bias: Evaluating societal representations in diffusion models. In: Oh A, Naumann T, Globerson A, Saenko K, Hardt M, Levine S, editors. Advances in neural information processing systems 36. NeurIPS 2023; 2023 Dem 10-16; New Orleans, USA. Red Hook: Curran Associates, Inc; 2023. Available from: https://papers.nips.cc/paper_files/paper/2023/hash
-
11. Sasse A, Ng B, Spiro AE, Tasaki S, Bennett DA, Gaiteri C, et al. Benchmarking of deep neural networks for predicting personal gene expression from DNA sequence highlights shortcomings. Nat Genet. 2023;55(12):2060-2064.[DOI]
-
12. Yu G, Li F, Qin Y, Bo X, Wu Y, Wang S. GOSemSim: An R package for measuring semantic similarity among GO terms and gene products. Bioinformatics. 2010;26(7):976-978.[DOI]
-
13. Shen Z, Shao YL, Liu W, Zhang Q, Yuan L. Prediction of back-splicing sites for CircRNA formation based on convolutional neural networks. BMC Genomics. 2022;23(1):581.[DOI]
-
14. Pölönen P, Di Giacomo D, Seffernick AE, Elsayed A, Kimura S, Benini F, et al. The genomic basis of childhood T-lineage acute lymphoblastic leukaemia. Nature. 2024;632(8027):1082-1091.[DOI]
-
15. Zhao W, Gu X, Chen S, Wu J, Zhou Z. MODIG: Integrating multi-omics and multi-dimensional gene network for cancer driver gene identification based on graph attention network model. Bioinformatics. 2022;38(21):4901-4907.[DOI]
-
16. Shih J, Sarmashghi S, Zhakula-Kostadinova N, Zhang S, Georgis Y, Hoyt SH, et al. Cancer aneuploidies are shaped primarily by effects on tumour fitness. Nature. 2023;619(7971):793-800.[DOI]
-
17. Deng C, Li HD, Zhang LS, Liu Y, Li Y, Wang J. Identifying new cancer genes based on the integration of annotated gene sets via hypergraph neural networks. Bioinformatics. 2024;40:i511-i520.[DOI]
-
18. Tate JG, Bamford S, Jubb HC, Sondka Z, Beare DM, Bindal N, et al. COSMIC: The catalogue of somatic mutations in cancer. Nucleic Acids Res. 2019;47:D941-D947.[DOI]
-
19. Kim J, So S, Lee HJ, Park JC, Kim JJ, Lee H. DigSee: Disease gene search engine with evidence sentences (version cancer). Nucleic Acids Res. 2013;41:W510-W517.[DOI]
-
20. Gosai SJ, Castro RI, Fuentes N, Butts JC, Kales S, Noche RR, et al. Machine-guided design of synthetic cell type-specific cis-regulatory elements. BioRxiv 552077 [Preprint]. 2023.[DOI]
Copyright
© The Author(s) 2026. This is an Open Access article licensed under a Creative Commons Attribution 4.0 International License (https://creativecommons.org/licenses/by/4.0/), which permits unrestricted use, sharing, adaptation, distribution and reproduction in any medium or format, for any purpose, even commercially, as long as you give appropriate credit to the original author(s) and the source, provide a link to the Creative Commons license, and indicate if changes were made.
Publisher’s Note
Science Exploration remains a neutral stance on jurisdictional claims in published
maps
and institutional affiliations. The views expressed in this article are solely those
of
the author(s) and do not reflect the opinions of the Editors or the publisher.
Share And Cite


Science Exploration Style
Yuan L, Zhao J. iCDG-MOHGAT: Identification of cancer driver gene using multi-omics data and heterogeneous graph attention network. Comput Biomed. 2026;1:202515. https://doi.org/10.70401/cbm.2026.0008
Tips
Copy completed.
Submit a Manuscript
Author Instructions
Cite this Article
Article Metrics
0
View
0
Download
Cited
Article Updates

Science Exploration Style
Yuan L, Zhao J. iCDG-MOHGAT: Identification of cancer driver gene using multi-omics data and heterogeneous graph attention network. Comput Biomed. 2026;1:202515. https://doi.org/10.70401/cbm.2026.0008
copy
Share Link
copy