PCMCI-SVM: A model identifying diagnostic biomarkers for autism spectrum disorder through causal network analysis
*Correspondence to:
Yanrui Ding, School of Science, Jiangnan University, Wuxi 214122, Jiangsu, China.
E-mail: yr_ding@jiangnan.edu.cn
Comput Biomed. 2026;1:202523. 10.70401/cbm.2026.0009
Received: November 12, 2025Accepted: January 28, 2026Published: February 04, 2026
This article belongs to the Special lssue AI for Biomedicine: Models, Applications, and Challenges
Abstract
Aims: Accurately identifying diagnostic biomarkers for Autism Spectrum Disorder (ASD) is crucial for enabling early diagnosis and timely intervention. Brain causal networks, which outline causal relationships and information transmission pathways among different brain regions, hold significant diagnostic value for ASD. Identifying ASD-relevant causal relationships between brain regions is critical for ASD diagnosis and for elucidating its pathophysiology. This study proposes a new model called the Peter and Clark Momentary Conditional Independence (PCMCI)-Support Vector Machine (SVM) model, which can identify diagnostic biomarkers for ASD.
Methods: The brain blood oxygen level-dependent signals of 116 brain regions from 167 participants, consisting of 72 participants with ASD and 95 Typical Controls (TCs), were used to derive brain causal networks by detecting inter-regional causal relationships using five causal discovery algorithms; the PCMCI algorithm, spectral dynamic causal modeling, Granger causal analysis, Transfer Entropy, and Liang-Kleeman information flow causal analysis. Then, the brain causal relationships were fed into the SVM, Random Forest (RF), and K-Nearest Neighbors (KNN) classifiers, respectively to classify individuals with ASD and TCs, and thereby obtain a model suitable for identifying diagnostic biomarkers for ASD through causal network analysis.
Results: Experimental results demonstrate that the PCMCI-SVM model achieves an accuracy of 91.29% in ASD identification and outperforms the other four causal discovery algorithms, as well as the RF and KNN classifiers. Moreover, our analysis indicates that the right thalamus and right middle temporal gyrus are potential diagnostic biomarkers for ASD. Additionally, the causal relationship between [left inferior parietal→right insula] was found to be associated with the dorsal attention network, while [right cuneus→left cuneus] was associated with the visual network, suggesting that disruptions in these causal relationships may impair the functional integrity of their respective subnetworks.
Conclusion: Our findings show that cognitive processes and brain connectivity are largely influenced by causal interactions between different brain regions. These potential diagnostic biomarkers not only offer insights into the neurofunctional mechanisms of ASD but also hold promise for improving diagnostic accuracy for ASD.
Keywords
Autism spectrum disorder, PCMCI-SVM model, causal relationship, diagnostic biomarker, brain region
1. Introduction
Autism spectrum disorder (ASD) is a neurodevelopmental disorder clinically characterized by impairments in social functioning, as well as restricted and repetitive behaviors. Due to delayed diagnosis and heterogeneity in cognitive functioning, many individuals do not receive timely and effective intervention. Therefore, it is particularly important to find reliable diagnostic biomarkers for ASD.
Previous studies have demonstrated that brain connections can serve as important diagnostic biomarkers for ASD[1]. Brain connectivity is usually divided into two categories: functional connectivity and effective connectivity (causal connectivity). In contrast to functional connectivity, effective connectivity can be used not only to assess the influence between brain regions or neurons, but also to give the direction of information flow and, to some extent, eliminate spurious connections caused by common drivers and indirect paths within the network. Several common methods are widely used for calculating effective connectivity in resting-state functional magnetic resonance imaging (rs-fMRI) of individuals with ASD, such as dynamic causal modeling (DCM)[2], Granger causal analysis[3], transfer entropy (TE)[4], and Liang-Kleeman information flow (LKIF)[5]. Yu et al. have used spectral dynamic causal modeling (spDCM) to find inhibitory directional connections between the core regions of the default mode network in children with ASD[6]. Bernas et al. have found differences in causal connections originating from the temporal and prefrontal cortices in individuals with ASD using Granger causal analysis[7]. Zhao et al. have discovered a reduced entropy connection between the right dorsolateral prefrontal cortex and the left supramarginal gyrus in patients with ASD by TE analysis[8]. Cong et al. have observed increased interregional causal connectivity differences involving the dorsal and ventral medial prefrontal cortex, hippocampal formation, and temporo-parietal junction in ASD through the LKIF[9]. Obviously, these methods provide important information for understanding causal relationships between brain regions in ASD. However, DCM heavily relies on prior knowledge, and the accuracy of the obtained causal connections is closely related to this prior knowledge. A higher value of Granger causal analysis does not necessarily mean a stronger causal relationship[10]. TE requires long time series and is computationally complex[9]. In the context of handling larger variable sets, the LKIF exhibits limited performance[11].
To better discover causal relationships, Runge et al.[12] proposed the Peter and Clark Momentary Conditional Independence (PCMCI) algorithm as a method for discovering causal networks based on a framework of graphical causal models. PCMCI has been shown to produce accurate causal effect estimates. It has successfully estimated the drivers of tropical Walker circulation and polar vortex states[13-15], and has been widely used in earth system sciences[16], transportation engineering[17], neuroscience, and other fields. In neuroscience, PCMCI has been applied to study brain mechanisms related to motor function[18] and situational memory connectivity patterns[19]. Its principle and method for inferring causality are also applicable to the analysis of rs-fMRI data. fMRI data are characterized by high dimensionality, high noise levels, strong autocorrelation, and nonlinear dependencies. The PCMCI algorithm is specifically designed for high-dimensional time-series data, and its key advantage lies in its ability to systematically handle strong autocorrelation and nonlinear dependencies while progressively identifying direct causal parent nodes through conditional independence tests[18,20].
Given the advantages of PCMCI in discovering causal relationships, we propose the PCMCI-SVM model, which investigates causal connections between brain regions, constructs causal networks and ultimately identifies potential biomarkers for ASD. In this analysis, all brain regions under consideration are included, which could partially eliminate spurious causal relationships resulting from shared causal parents. Further, we compared the differences in causal networks between ASD and typical controls (TCs) to find the altered causal connectivity in ASD. Finally, an ASD-TC classification model characterized by the most different causal connectivity features is constructed to validate the potential of diagnostic biomarkers for ASD (Figure 1). This study aims to find brain diagnostic biomarkers for ASD to help assess the autism risk in the suspected population as early as possible.
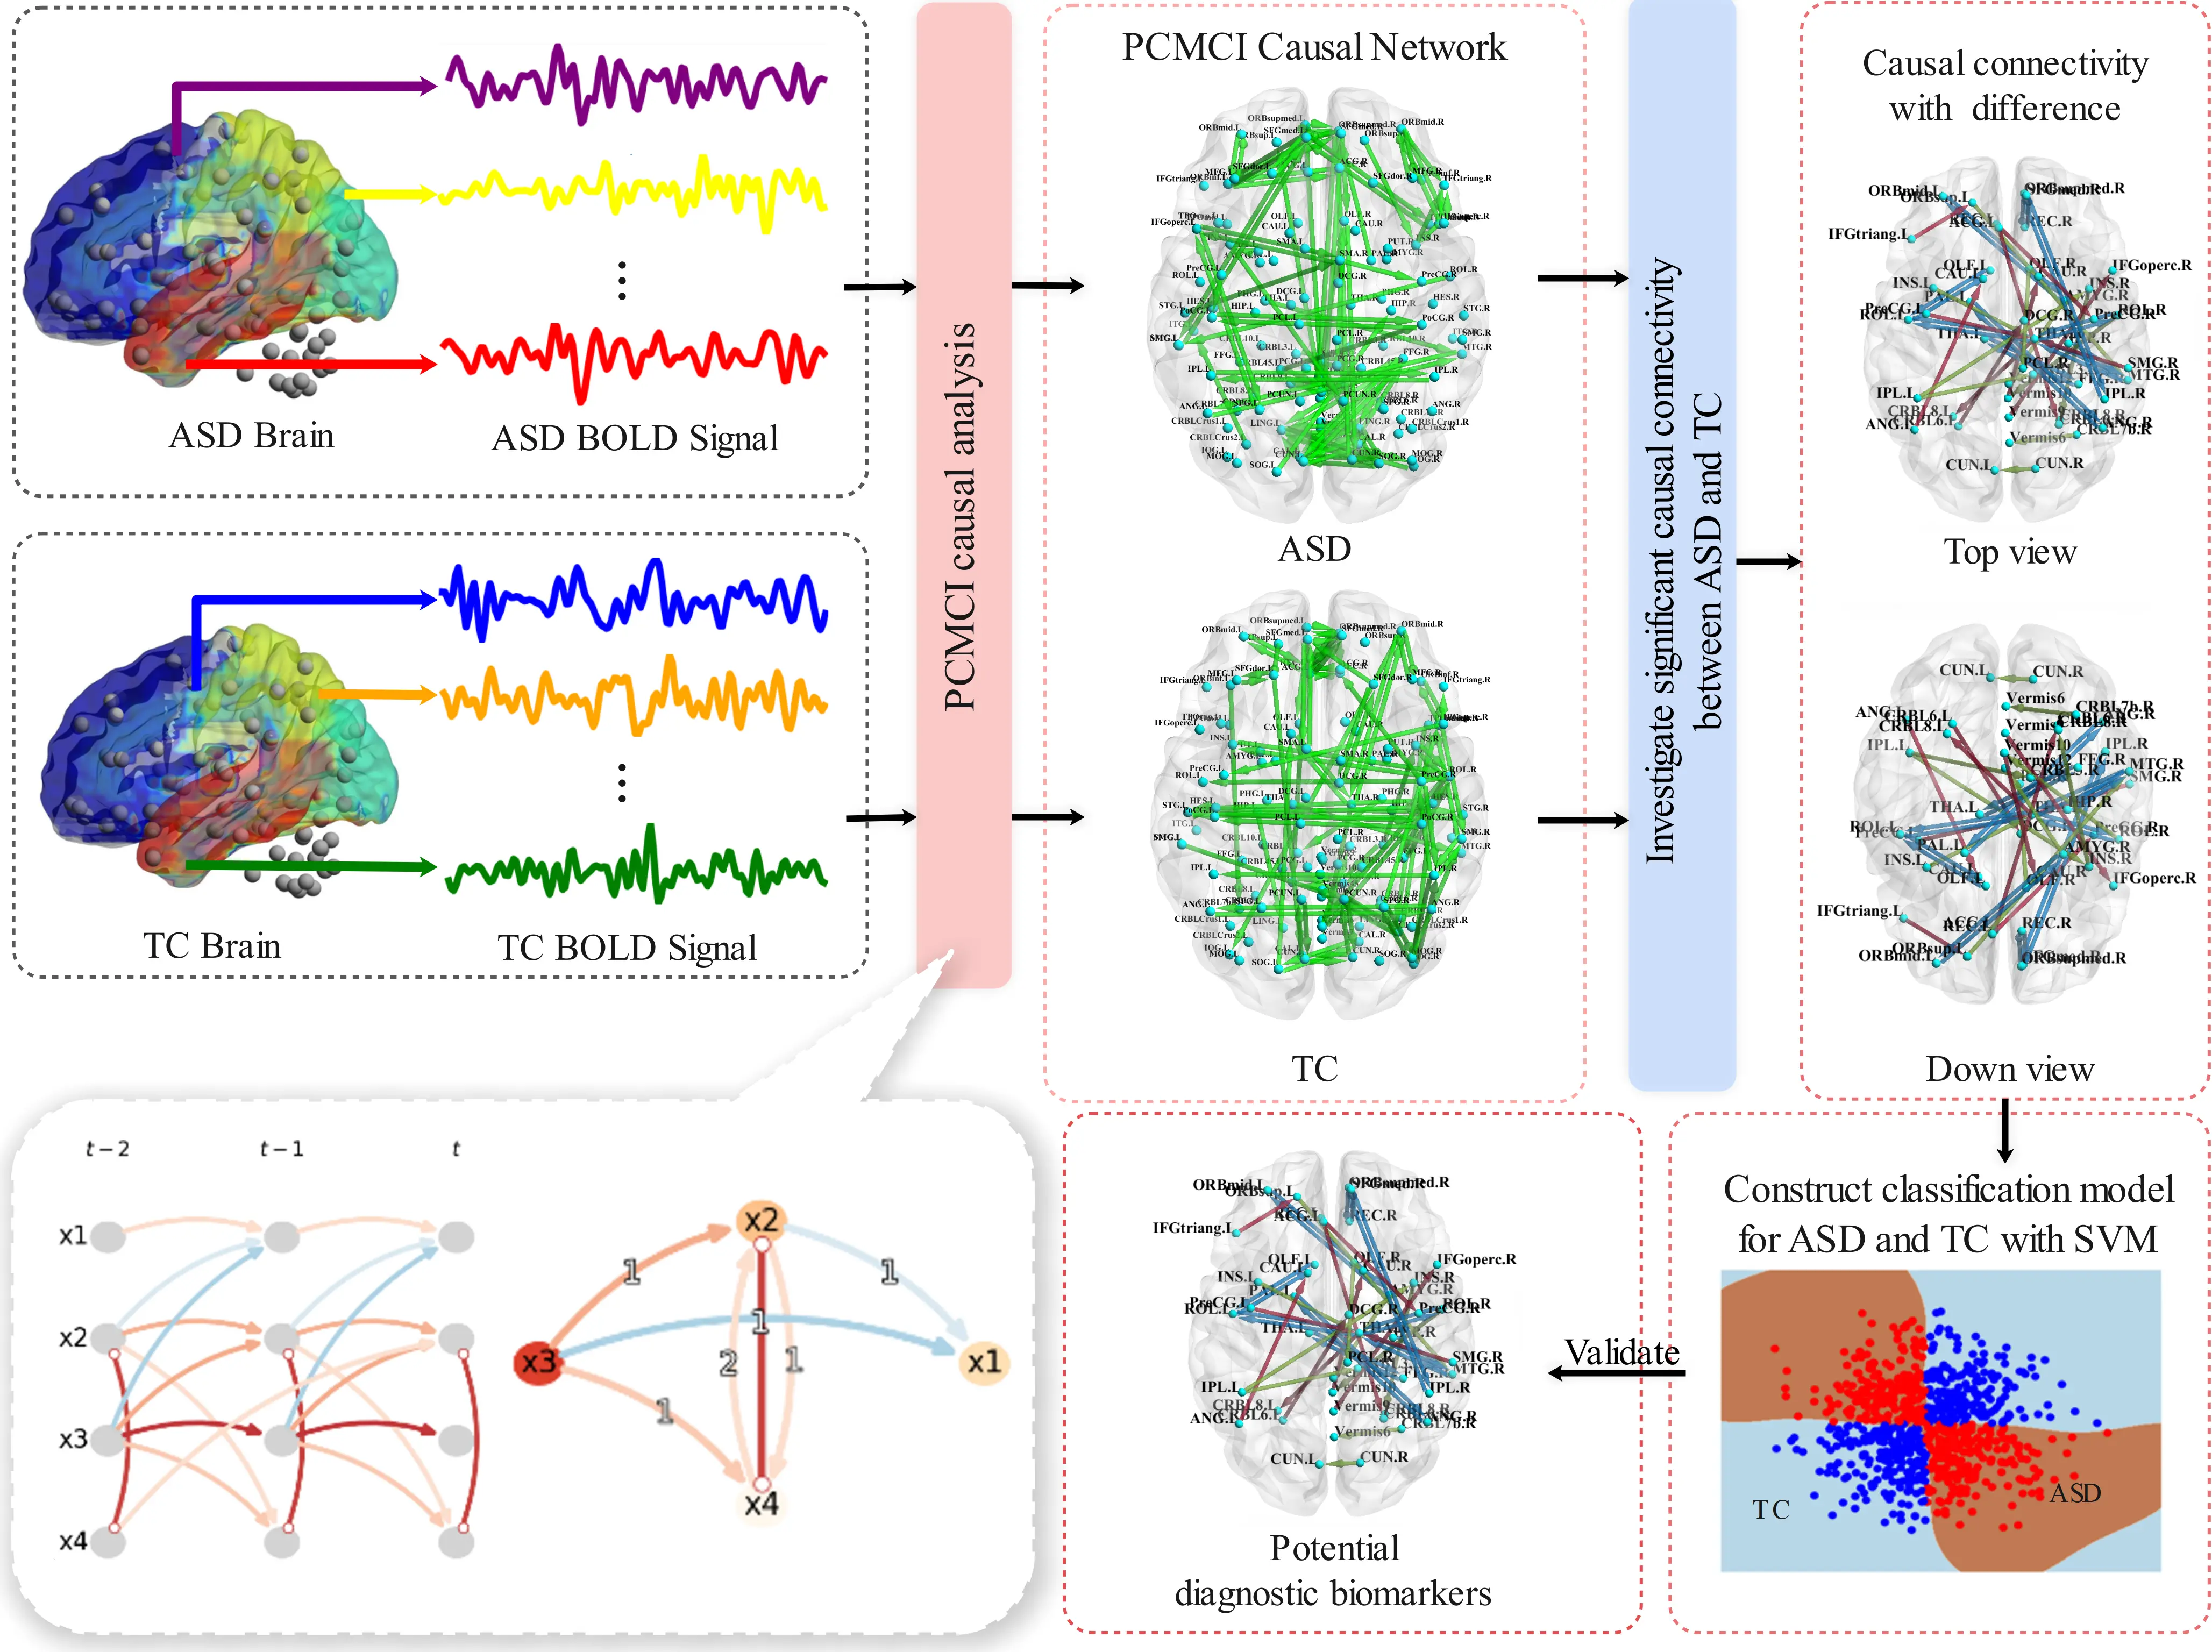
Figure 1. The workflow of the PCMCI-SVM model. PCMCI: Peter and Clark Momentary Conditional Independence; SVM: Support Vector Machine; ASD: autism spectrum disorder; TC: typical control; BOLD: blood oxygen level-dependent.
2. Material and Methods
2.1 Subjects
The brain blood oxygen level-dependent (BOLD) signaling dataset was obtained from NYU Langone Medical Center in Autism Brain Imaging Data Exchange I (ABIDE I, https://fcon_1000.projects.nitrc.org/indi/abide/abide_I.html). We excluded participants with missing or poor-quality BOLD signals, so there are 167 participants in total, consisting of 72 individuals with ASD and 95 TCs. All participants brain regions were defined by the automated anatomical labeling atlas (Table S1)[21]. Data preprocessing was performed by the Configurable Pipeline for the Analysis of Connectomes[22]. After preprocessing, BOLD signals from 116 brain regions were extracted. If the BOLD signal value of brain region i at time point t is expressed by
2.2 PCMCI-SVM model
The PCMCI-SVM model consists of two steps: (1) constructing a causal network using the PCMCI causal discovery algorithm, and (2) constructing an ASD-TC classification model based on the SVM algorithm using significantly different causal connectivities as features.
2.2.1 Constructing causal network by the PCMCI causal discovery algorithm
The PCMCI causal discovery algorithm discovers causal connections between brain regions from BOLD signals. Prior to the estimation of causal relationships, it is necessary to state the following assumptions. (1) Causal Sufficiency (or Confoundedness), i.e., common drivers are included in the known data. (2) Causal Markov Condition, i.e., when a given brain region i has causal parents, all other past brain variables become irrelevant for predicting the current state of that region. (3) Faithfulness, i.e., the observed conditional independencies are implied by the causal graph structure.
The BOLD signals in all brain regions are subsequently considered as a multivariate discrete-time stochastic process X. The time series graph of X is defined as G = (X × Z, E) (Figure 2). The nodes represent the individual time-dependent brain region variables X = (X1, X1, X2, ..., X116)′ at each time t ∈ Z. Let
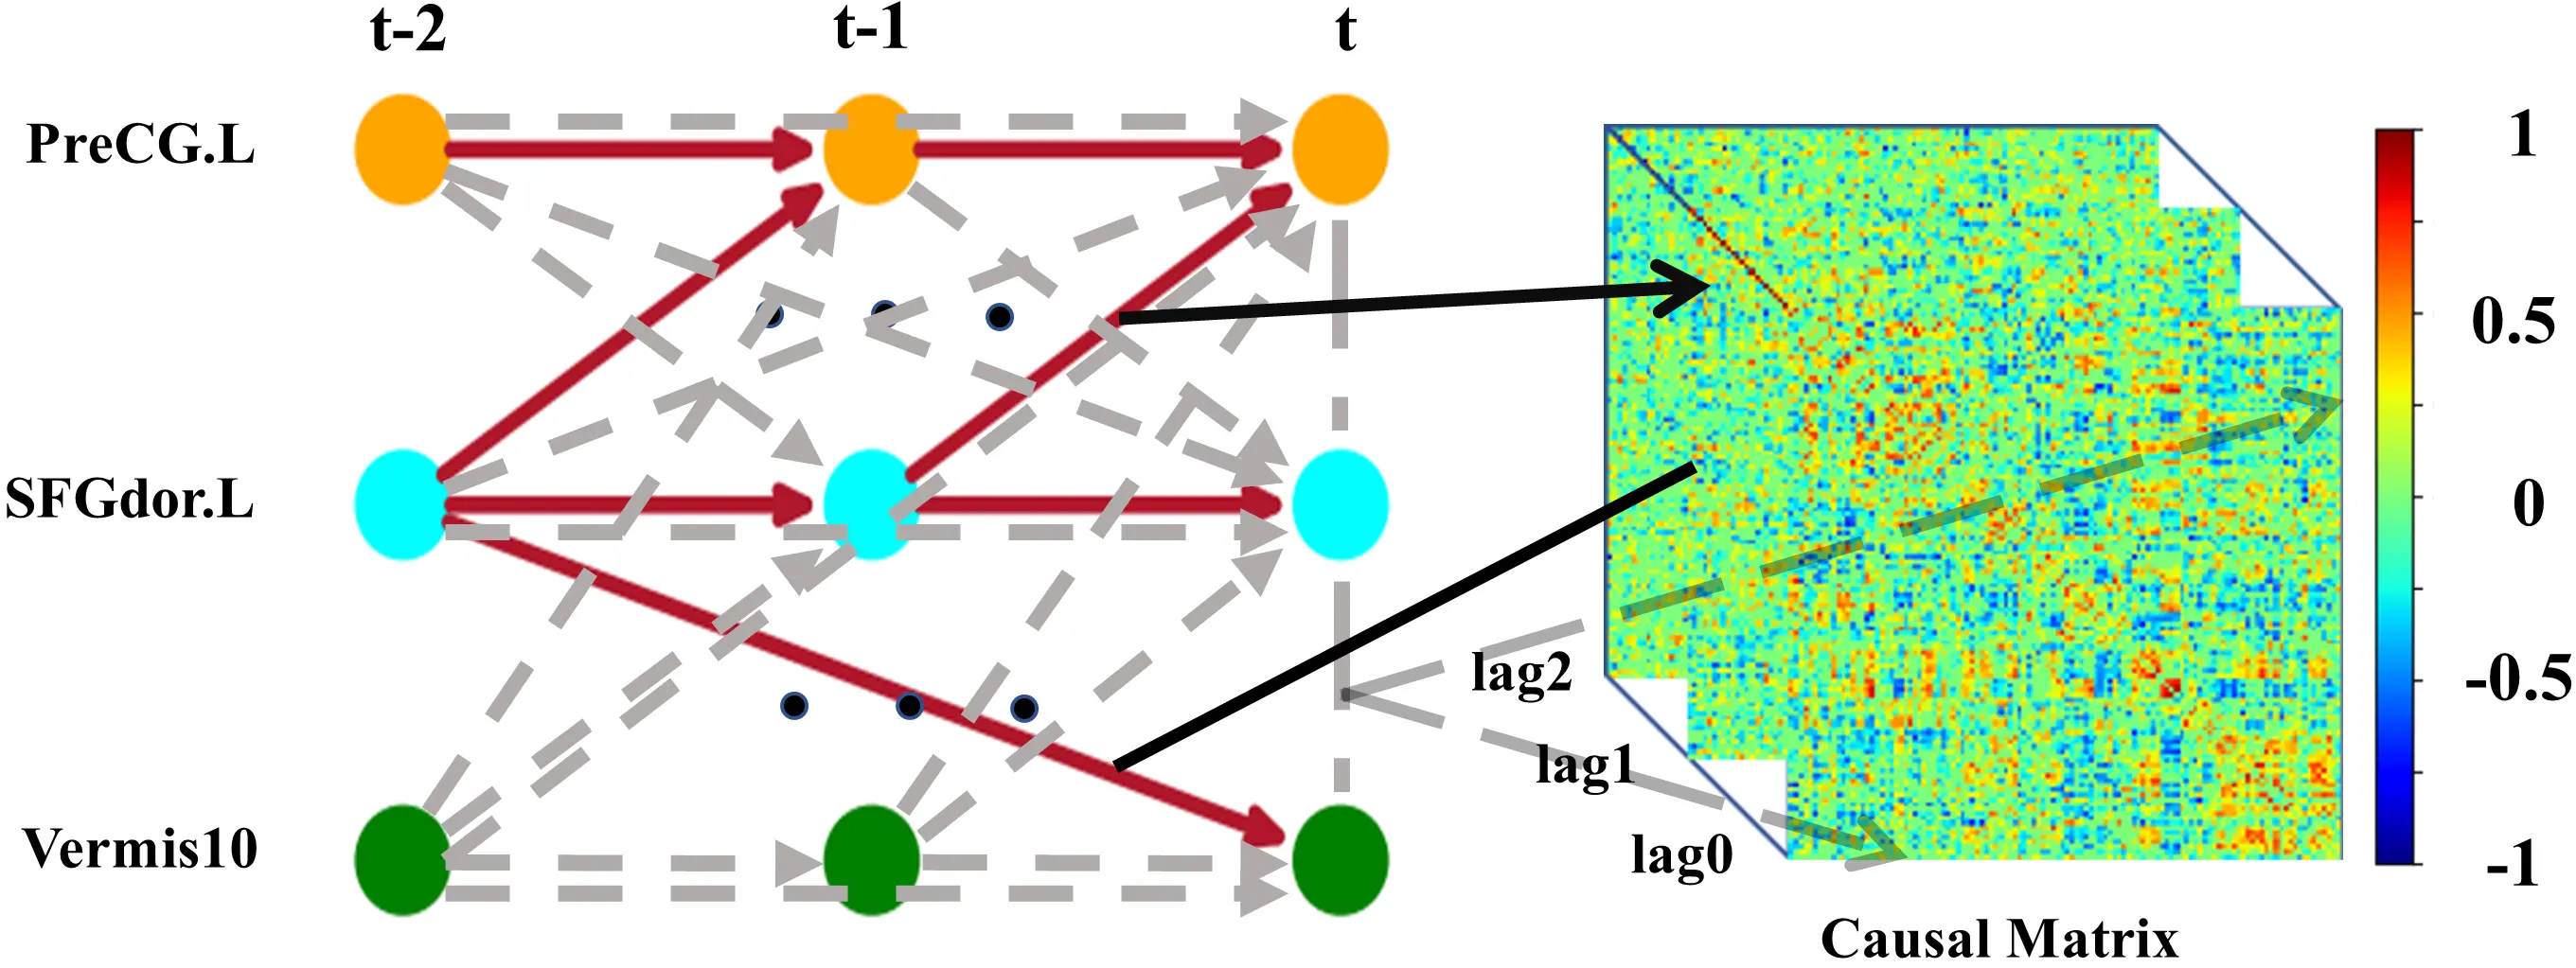
Figure 2. Time series graph (left) among brain regions left PreCG.L, left SFGdor.L, and Vermis10 and the corresponding causal matrix (right). Solid lines represent the presence of causal connections, while dashed lines represent the absence of causal connections. Each value in the lag0 causal matrix corresponds to a contemporaneous connection. Each value in the lag1 causal matrix corresponds to a causal connection with a drive time of 1*TR. Each value in the lag2 causal matrix corresponds to a causal connection with a drive time of 2*TR. PreCG.L: precentral gyrus; SFGdor.L: superior frontal gyrus of dorsolateral.
Define a time-dependent system model for brain region i as:
where fi is the corresponding functional expression of information processed by brain region i,
PCMCI estimates the causal parents
Conditional selection: PC algorithm obtains an estimate
The MCI test: This step attains a more accurate estimate of
Linear partial correlation is used for the conditional independence test, i.e., using linear partial correlation to assess whether
Hypothetical model is as follows.
Residuals are from the least squares fit.
The Pearson correlation coefficients of
To test the null hypothesis H0:ρ = 0 and the alternative hypothesis H1:ρ ≠ 0, we use
Through these two steps, a time series graph presenting causal relationships between brain regions is constructed, from which we obtain a PCMCI directed causal matrix for each participant (Figure 2). Based on the matrix, we construct a brain PCMCI causal network where the nodes are brain regions and the weights of the edges are the causal connection values.
2.2.2 Constructing ASD-TC classification model based on SVM algorithm
Two-sample t-tests assess differences in causal connections between ASD and TCs. The significance level for the two-sample t-test is set to 0.05 to find significant differences in causal connectivity. Based on causal connectivity with significant differences, we attempt to identify ASD from a potentially at-risk population. Causal connectivity with significant differences is used as characteristics of each participant. Then, we use an SVM for classification and conduct a grid search to select the optimal parameters, and the parameters are shown in Table 1. The ratio of the training set to the test set is set to 8:2. A 10-fold cross-validation is adopted to evaluate the reliability of the model, and 25 parallel experiments are conducted, with the average accuracies are reported. We also construct Random Forest (RF) and K-Nearest Neighbors (KNN) classifiers using the same significant differences in causal connectivity features.
Table 1. The details of parameters for SVM.
| Parameter Name | Range of Parameter |
| Kernel functions | [‘linear’, ‘rbf’, ‘poly’] |
| Regularization parameter C | [0.1, 1, 10, 100] |
| Kernel coefficient γ | [0.001, 0.01, 0.1, ‘scale’, ‘auto’] |
| Degree of the polynomial kernel function (degree) | 2 |
SVM: Support Vector Machine.
2.3 Baseline methods
It has been reported that spDCM, Granger causality analysis, TE, and LKIF causality analysis can also identify causal relationships between brain regions. In this study, we compared PCMCI with spDCM, Granger causality analysis, TE, and LKIF causality analysis. A detailed introduction to these four methods is provided.
2.3.1 Spectral dynamic causal modeling
The spDCM is an effective connectivity estimation method based on frequency domain analysis. The spDCM builds a state space model based on continuous-time linear stochastic differential equations to describe the dynamic relationship between hidden neural states xt and observed signals yt:
where A is used to characterize the effective connectivity between brain regions, h is the non-linear hemodynamic response function[23], vt and et are the neural state noise and the observation noise respectively. In order to convert the time-domain dynamics into observable statistics in the frequency domain, spDCM performs a Fourier transform on h, and inversely infers the intrinsic effective connectivity, that is A, the parameter matrix. Statistical analysis is carried out on the posterior samples, and the mean, standard deviation and 95% confidence interval of A are calculated. For the time series of each subject’s brain region, an effective connectivity matrix of 116 × 116 is estimated, and the matrix elements represent the significant effective connectivity strength from one brain region to another.
2.3.2 Granger causal analysis
Granger causal analysis is a commonly used method for constructing causal networks in the brain. The fundamental idea is that if the past values of the time series Xj can help predict the future values of another time series Xi, we say that Xj is the cause of Xi. For the given brain BOLD signals Xi and Xj, let their autoregressive representations be as follows.
The bivariate autoregressive representations of Xi and Xj are expressed as:
where A is the matrix of model coefficients, m represents the time lag (in time samples), and p represents the maximum time lag.
Similarly, the Granger causality relationship from Xi to Xj can be defined as follows.
We implement bivariate Granger causality by selecting an autoregressive model order of 2 using Schwarz’s Bayesian Criterion, aligning with the results reported by Haghighat et al.[1,24]. Each participant obtains a 116 × 116 Granger directed causal matrix. Then, a brain Granger causal network with brain regions as nodes is constructed, with the values of causal connections representing the edge weights.
2.3.3 Transfer entropy
TE, initially introduced by Schreiber in 2000[4], is a directed information-theoretic measure rooted in Wiener causality and information theory. It quantifies the directional causal influence and strength between variables in dynamic systems through conditional probability distributions, effectively capturing both linear and nonlinear interactions. For brain functional data, the TE from region J to I is mathematically defined as:
where
2.3.4 LKIF causal analysis
The LKIF method is developed by Liang[5]. This approach assesses how information transfers within dynamic systems, derived rigorously from the propagation of information entropy among variables. For a 116-dimensional continuous-time random system in the brain, the maximum likelihood estimate of the information flow from Xj to Xi is given as:
where
2.4 Model evaluation criteria
Classification quality is measured by accuracy (ACC), sensitivity, specificity, F1-Score, and area under the curve (AUC). The formulas are as follows.
TruePositive is an outcome where the model correctly predicts the positive class. Similarly, TrueNegative is an outcome where the model correctly predicts the negative class. False Positive is an outcome where the model incorrectly predicts the positive class, and False Negative is an outcome where the model incorrectly predicts the negative class.
Where M is the number of positive samples and N is the number of negative samples, Ppositive denotes the prediction score of positive samples, while PNegative indicates the prediction score of negative samples.
3. Results
3.1 Causal connectivity with significant difference between ASD and TC
After applying the PCMCI algorithm, the causal relationships of brain regions are determined, and based on p-values from two-sample t-tests, we obtain the top 10 causal connections for each lag in the PCMCI causal network (Figure 3). Accordingly, we obtained the 30 most significant causal connections for baseline methods: spDCM (Table S2), Granger causal analysis (Table S3), TE (Table S4), and Liang-Kleeman information flow (Table S5). Table 2 lists these causal connections with significant differences and the changes in the ASD group compared with the TC group. Among them, right thalamus (THA.R) exhibits more causal connections with significant differences, including: [THA.R-left rolandic operculum] (lag 0), [right middle temporal gyrus (MTG.R)-THA.R] (lag 0), [right rolandic operculum (ROL.R)-THA.R] (lag 0), [PreCG.L→THA.R] (lag 1), [right supramarginal gyrus (SMG.R)→THA.R] (lag 1), [THA.R→Cerebelum.8.L (CRBL8.L)] (lag 1), [left insula (INS.L)→THA.R] (lag 2). Additionally, [left inferior parietal but supramarginal and angular gyri (IPL.L)→right insula (INS.R)] (lag 2) belongs to the dorsal attention network[25,26]. [Right cuneus (CUN.R)→left cuneus (CUN.L)] (lag 2) belongs to the visual network[27]. These connections may affect the functional integrity of the corresponding subnetworks. Here, “-” indicates a contemporaneous connection goes both ways, “→” indicates the direction of causality obtained according to the time-sequential relationship, “[]” indicates the causal connection between two regions.
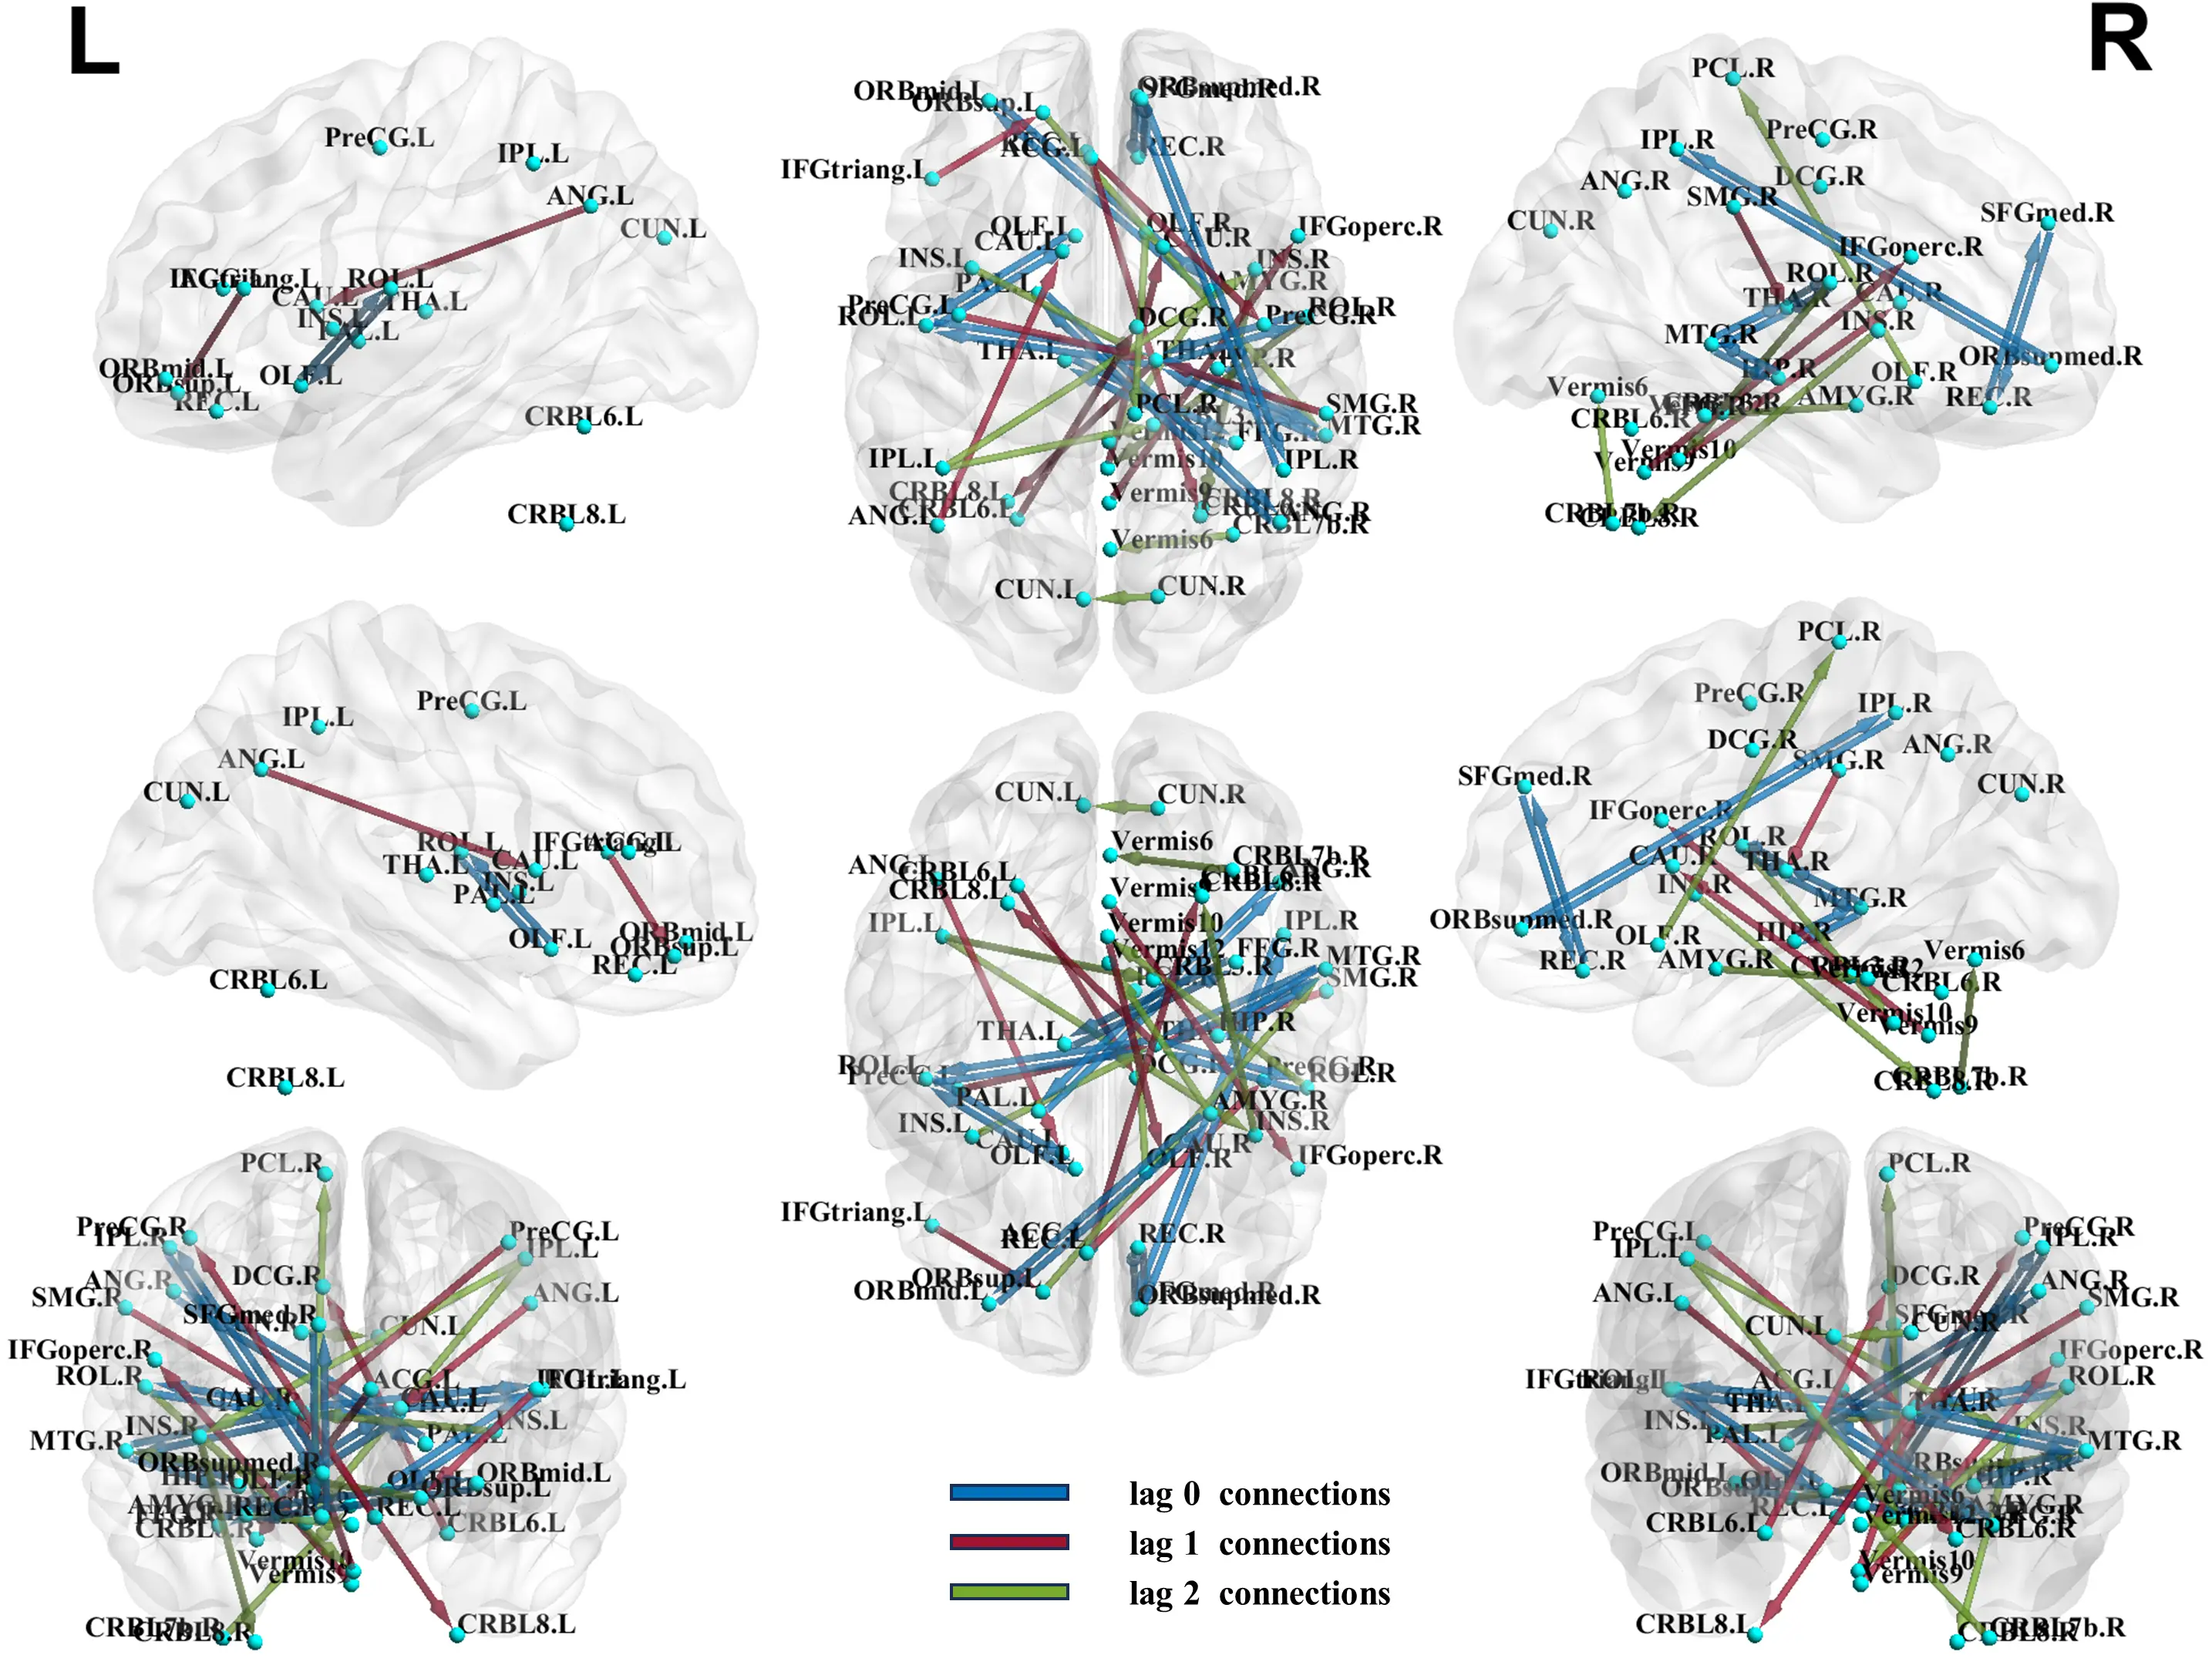
Figure 3. Causal connectivity with significant difference between ASD and TC. ASD: autism spectrum disorder; TC: typical control.
Table 2. Causal connections with significant difference and the changes in the ASD group compared to the TC group.
| Lag | Brain region 1 | Brain region 2 | P-value | Causal connection change |
| 0 | ORBsupmed.R | IPL.R | 1.22E-05 | increase |
| 0 | AMYG.R | ORBmid.L | 3.51E-05 | decrease |
| 0 | THA.R | ROL.L | 6.25E-05 | increase |
| 0 | MTG.R | HIP.R | 6.49E-05 | increase |
| 0 | ANG.R | PAL.L | 9.15E-05 | decrease |
| 0 | MTG.R | THA.R | 9.22E-05 | increase |
| 0 | OLF.L | ROL.L | 9.23E-05 | increase |
| 0 | SFGmed.R | REC.R | 0.000149 | decrease |
| 0 | FFG.R | THA.L | 0.000154 | increase |
| 0 | ROL.R | THA.R | 0.000234 | increase |
| 1 | REC.L | PreCG.R | 0.000156 | increase |
| 1 | PreCG.L | THA.R | 0.000173 | increase |
| 1 | ANG.L | CAU.L | 0.000194 | increase |
| 1 | IFGtriang.L | ORBsup.L | 0.000224 | increase |
| 1 | SMG.R | THA.R | 0.000226 | increase |
| 1 | Vermis9 | IFGoperc.R | 0.000263 | decrease |
| 1 | Vermis10 | CAU.R | 0.000282 | decrease |
| 1 | THA.R | CRBL8.L | 0.000302 | decrease |
| 1 | ACG.L | CRBL6.R | 0.000319 | decrease |
| 1 | CRBL6.L | DCG.R | 0.000405 | increase |
| 2 | IPL.L | INS.R | 2.04E-05 | increase |
| 2 | ORBsup.L | MTG.R | 9.69E-05 | increase |
| 2 | AMYG.R | Vermis12 | 0.000214 | decrease |
| 2 | OLF.R | PCL.R | 0.000281 | decrease |
| 2 | ROL.R | Vermis10 | 0.000412 | increase |
| 2 | CRBL7b.R | Vermis6 | 0.000530 | increase |
| 2 | CUN.R | CUN.L | 0.000714 | decrease |
| 2 | INS.R | CRBL8.R | 0.000838 | decrease |
| 2 | IPL.L | CRBL3.R | 0.000921 | increase |
| 2 | INS.L | THA.R | 0.000922 | decrease |
*The direction of the causal connection at lag 1 and 2 is: Brain region 1→Brain region 2. The causal connection at lag 0 has no direction. ASD: autism spectrum disorder; TC: typical control.
3.2 The performance of PCMCI-SVM model and the comparison with baseline methods
When selecting the classifier, we compare RF and KNN with SVM for classification and the results of RF and KNN are shown in Table S6,S7, while the optimal parameter combinations of SVM, KNN, and RF are respectively listed in Table S8,S9,S10. SVM achieves the best performance compared with RF and KNN. Hence, we choose SVM as the classifier for identifying ASD.
We selected spDCM, Granger causal analysis, TE, and the LKIF causal analysis as baseline methods and compared their performances for identifying ASD. Using causal connectivities with significant difference as features, we construct the PCMCI-SVM model and the performance is shown in Figure 4. The PCMCI-SVM model has good performance with the metrics Test-ACC (91.29%), Train-ACC (96.07%), and Validation-ACC (90.05%), which suggests that these causal connectivities with significant difference are important for distinguishing ASD from TCs and have the potential to be biomarkers, while also suggesting that the PCMCI-SVM model has good generalization ability.
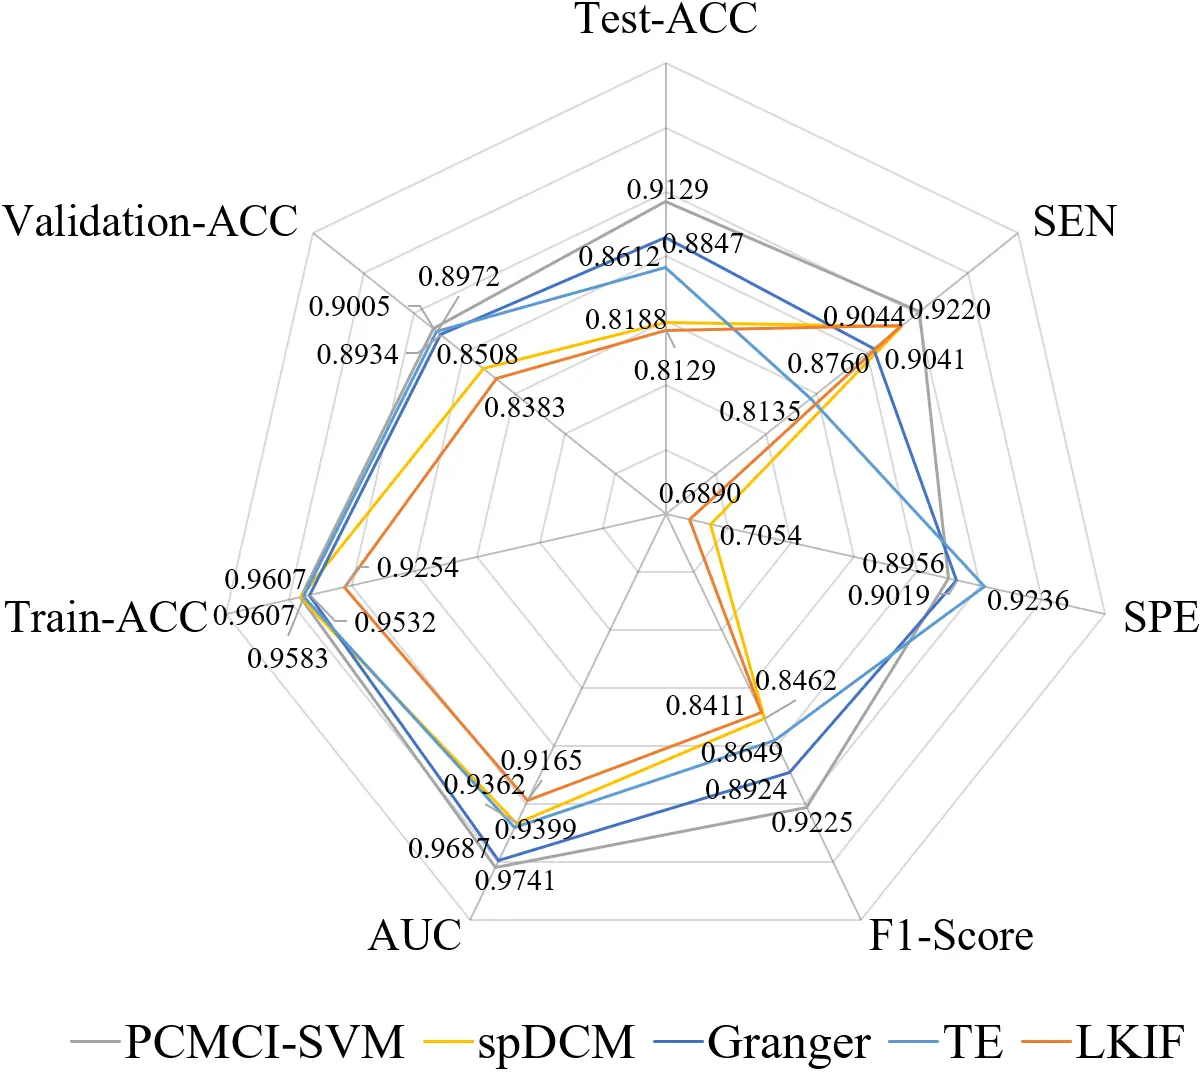
Figure 4. The classification results of ASD based on SVM using PCMCI, spDCM, Granger, TE, and LKIF causal model. ASD: autism spectrum disorder; SVM: Support Vector Machine; PCMCI: Peter and Clark Momentary Conditional Independence; spDCM: spectral dynamic causal modeling; TE: transfer entropy; LKIF: Liang-Kleeman information flow; ACC: accuracy; SEN: sensitivity; SPE: specificity; AUC: area under the curve.
Comparative analysis reveals that the PCMCI-SVM model achieves the highest sensitivity (SEN = 92.20%) among all methods (spDCM, Granger, TE, LKIF, and PCMCI-SVM), indicating superior capability in identifying ASD (Figure 4). Furthermore, the PCMCI-SVM model demonstrates optimal performance on classifier-specific metrics, attaining the highest F1-Score and AUC values. However, PCMCI-SVM (SPE = 89.56%) exhibits lower specificity than Granger (SPE = 90.19%) and TE (SPE = 92.36%), suggesting relatively weaker performance in recognizing TCs. When evaluating feature extraction methods independently, PCMCI features yield the highest mean classification accuracy (91.29%) across all comparative methods. Notably, the SVM classifier consistently outperforms alternative classifiers (RF and KNN) regardless of feature type (spDCM, Granger, TE, LKIF, or PCMCI-SVM).
4. Discussion
We construct the PCMCI-SVM model to analyze the brain image data to identify diagnostic biomarkers for ASD through causal network analysis. This model can reveal the causal relationships and information transfer pathways among different brain regions, which provides a new perspective for us to deeply understand the complexity of the brain and mechanisms underlying diseases.
In recent years, although increasing attention has been paid to research on ASD, accurate identifying ASD remains a challenging problem. The use of effective connectivity has contributed greatly to the identification of ASD, and one of the most common methods is Granger causal analysis. Researchers have used bivariate Granger causality as features to construct classifiers. One study used stochastic gradient descent, and the other used backpropagation to train a multilayer perceptron, achieving accuracies of 66.7% and 86.7%, respectively[24]. Our PCMCI-SVM model is significantly better than Granger. The PCMCI-SVM model’s identification of abnormal connectivity in ASD also provides valuable insights into its functional organization and information transfer, thus affirming its potential as diagnostic biomarkers.
In the PCMCI-SVM model, a discrepancy between ASD and TCs is notable, particularly in the right thalamus. As an integral part of the default mode network, the thalamus is suggested to play a crucial role in contributing to the sensory processing and attention impairments observed in ASD[28,29]. Prior work has highlighted that atypical thalamocortical connectivity is strongly associated with hallmark ASD symptoms such as sensory hyper-responsivity and attentional difficulties[30]. Alterations in causal connections, such as [THA.R-ROLL], [MTG.R-THA.R], [ROL.R-THA.R], [PreCG.LTHA.R] (lag 1), [SMG.RTHA.R] (lag 1), [THA.RCRBL8.L] (lag 1), and [INS.LTHA.R] (lag 2), may lead to diverse functional changes associated with ASD. Noteworthy is the role of ROL in emotional processing[31], the recognized involvement of MTG in language-related tasks like lexical comprehension and semantic cognition[32], and the pivotal contribution of PreCG within the motor control network[33]. The right middle temporal gyrus is critically implicated in social cognition and language-related processing, making it a plausible neural substrate for the social-communication impairments characteristic of ASD. Our results are concordant with the study by Xu et al.[34], which demonstrated atypical functional connectivity of MTG subregions in both children and adults with ASD, particularly in networks supporting language and social cognition. PreCG has been found to exhibit a deviation in degree centrality in ASD[35]. Furthermore, Brieber et al.[36] identified increased grey matter volume in the right SMG as a manifestation of autism-related brain abnormalities. Numerous reports provide detailed insights into variations in functionality, structure, and cytoarchitecture within the cerebellum, as observed in ASD studies[37]. The insula is thought to integrate diverse functional systems essential for emotion processing, sensorimotor functions, and general cognition[38]. [IPL.L→INS.R] (lag 2) belongs to the dorsal attention network[25,26], and its functions may be associated with working and episodic memory, primarily facilitating the “top-down” attention process[26]. The abnormality of the dorsal attention network provides a plausible systems-level pathway linking DAN dysfunction to core behavioral manifestations of ASD, including social difficulties and executive-function impairments[39,40]. [CUN.RCUN.L] (lag 2) belongs to the visual network. The abnormality in the right CUN is crucial for visual attention processing[27]. Just as Liu et al.[41] emphasized that visual hypersensitivity is a prominent feature of ASD and may arise from dysregulated visual-network activity, contributing to heightened responsiveness to visual stimulation, one of the common forms of sensory processing atypicality in ASD. These studies validate some brain regions or connectivity of the potential biomarkers we discovered, while there are some new discoveries including [ORBsupmed.R-IPL.R] (lag 0), [AMYG.R-ORBmid.L] (lag 0), [ANG.R-PAL.L] (lag 0), [SFGmed.R-REC.R] (lag 0), [FFG.R-THA.L] (lag 0), [ANG.L→CAU.L] (lag 1), [IFGtriang.L→ORBsup.L] (lag 1), [Vermis9→IFGoperc.R] (lag 1), [Vermis10→CAU.R] (lag 1), [ACG.L→CRBL6.R] (lag 1), [CRBL6.L→DCG.R] (lag 1), [AMYG.R→Vermis12] (lag 2), [OLF.R→PCL.R] (lag 2), [CRBL7b.R→Vermis6] (lag 2), [IPL.L→CRBL3.R] (lag 2). Notably, more than half of the significant differential connections belong to interhemispheric causal connections, and over 90% of the significant differential connections are associated with different functional subnetworks. To some extent, this suggests disruptions in ASD’s functional coordination.
5. Research Limitations and Future Directions
While this study has revealed a set of potential causal network biomarkers distinguishing ASD from TCs through the PCMCI-SVM model, several important limitations remain to be addressed in future work.
Data limitations. This study is based on 167 participants from a single site (NYU) within the ABIDE I database. Although this selection was methodologically driven by the need for data homogeneity, the relatively limited sample size may affect statistical power and constrain the generalizability of the findings to broader and more heterogeneous ASD populations. Future research is required to validate the stability and generalizability of the current discoveries as the dataset expands.
Although head motion parameters were controlled for during preprocessing, systematic covariate analysis or strict matching for important covariates that may influence brain causal connectivity (such as age, sex, IQ, and ADOS core symptom scores) was not performed, limited by the completeness of the public dataset. This may lead to observed between-group differences being influenced by potential confounding factors. Subsequent research should prospectively and systematically collect complete clinical and behavioral data at the design stage and incorporate these variables as covariates in the analytical models to more rigorously isolate ASD-specific neural signatures.
Clinical application limitation. The contribution of this work lies in identifying diagnostic biomarkers based on causal networks. However, its direct translation to clinical practice remains challenging, and a systematic discussion regarding its feasibility for clinical application has not yet been fully developed. Translating the analytical method into a stable and reliable clinical auxiliary tool still requires addressing a series of challenges, including data standardization, automation of the computational pipeline, clinical interpretability of results, and integration with existing diagnostic workflows. Future translational research should establish clear phased objectives, encompassing technical validation in large-scale real-world data and evaluation of its clinical utility for auxiliary subtyping or outcome prediction.
We believe leveraging these limitations to guide the planning of future validation and in-depth research will help advance the field toward greater reproducibility and clinical relevance.
6. Conclusion
In this paper, we explore the changes in brain causal networks with ASD using the PCMCI-SVM model and achieve a classification accuracy of 91.29%. In the PCMCI-SVM model, the analysis highlighted significant differences in the right thalamus. Additionally, among the significant differences, there are a substantial number of interhemispheric connections and connections between subnetworks. The results show that cognitive processes and brain connectivity are largely influenced by causal interactions between different brain regions. In summary, the PCMCI-SVM model can deepen our understanding of the ASD causal network and enrich our comprehension of ASD.
Supplementary materials
The supplementary material for this article is available at: Supplementary materials.
Acknowledgements
We thank Professor Li Liu from the Big Data Center of Affiliated Hospital of Jiangnan University for her support and assistance in data collection, preprocessing, and analysis of potential biomarkers identified in this study. We also extend our gratitude to all individuals who have contributed to the ABIDE database by collecting, organizing, and sharing their materials.
Authors contribution
Wang H: Conceptualization, methodology, data curation, formal analysis, writing-original draft, writing-review & editing.
Liu L, Liu Y, Ding Y: Conceptualization, writing-review & editing.
Conflicts of interest
Yanrui Ding is an Editorial Board Member of Computational Biomedicine. The other authors declare no conflicts of interest.
Ethical approval
Not applicable.
Consent to participate
Not applicable.
Consent for publication
Not applicable.
Availability of data and materials
Data supporting the findings of this study are available from the corresponding author upon reasonable request.
Funding
This work was supported by the Postgraduate Research & Practice Innovation Program of Jiangsu Province (Grant No. KYCX25_2635).
Copyright
©The Author(s) 2026.
References
-
1. Haghighat H, Mirzarezaee M, Nadjar Araabi B, Khadem A. An age-dependent Connectivity-based computer aided diagnosis system for Autism Spectrum Disorder using Resting-state fMRI. Biomed Signal Process Control. 2022;71:103108.[DOI]
-
2. Friston KJ, Harrison L, Penny W. Dynamic causal modelling. NeuroImage. 2003;19(4):1273-1302.[DOI]
-
3. Granger CWJ. Investigating causal relations by econometric models and cross-spectral methods. Econometrica. 1969;424-438.[DOI]
-
4. Schreiber T. Measuring information transfer. Phys Rev Lett. 2000;85(2):461.[DOI]
-
5. Liang XS. Unraveling the cause-effect relation between time series. Phys Rev E. 2014;90(5):052150.[DOI]
-
6. Yu H, Qu H, Chen A, Du Y, Liu Z, Wang W. Alteration of effective connectivity in the default mode network of autism after an intervention. Front Neurosci. 2021;15:796437.[DOI]
-
7. Bernas A, Barendse EM, Aldenkamp AP, Backes WH, Hofman PAM, Hendriks MPH, et al. Brain resting-state networks in adolescents with high-functioning autism: Analysis of spatial connectivity and temporal neurodynamics. Brain Behav. 2018;8(2):e00878.[DOI]
-
8. Zhao H, Lv R, Cai X, Zhang G. Changes of entropy connectivity of the default mode and central executive networks in ASD. Research Square [Preprint]. 2021.[DOI]
-
9. Cong J, Zhuang W, Liu Y, Yin S, Jia H, Yi C, et al. Altered default mode network causal connectivity patterns in autism spectrum disorder revealed by Liang information flow analysis. Hum Brain Mapp. 2023;44(6):2279-2293.[DOI]
-
10. Harmah DJ, Li C, Li F, Liao Y, Wang J, Ayedh WMA, et al. Measuring the non-linear directed information flow in schizophrenia by multivariate transfer entropy. Front Comput Neurosci. 2019;13:85.[DOI]
-
11. Docquier D, Di Capua G, Donner RV, Pires CA, Simon A, Vannitsem S. A comparison of two causal methods in the context of climate analyses. Nonlinear Process Geophys. 2024;31(1):115-136.[DOI]
-
12. Runge J, Nowack P, Kretschmer M, Flaxman S, Sejdinovic D. Detecting and quantifying causal associations in large nonlinear time series datasets. Sci Adv. 2019;5(11):eaau4996.[DOI]
-
13. Kretschmer M, Coumou D, Donges JF, Runge J. Using causal effect networks to analyze different Arctic drivers of midlatitude winter circulation. J Climate. 2016;29(11):4069-4081.[DOI]
-
14. Kretschmer M, Runge J, Coumou D. Early prediction of extreme stratospheric polar vortex states based on causal precursors. Geophys Res Lett. 2017;44(16):8592-8600.[DOI]
-
15. Runge J, Bathiany S, Bollt E, Camps-Valls G, Coumou D, Deyle E, et al. Inferring causation from time series in Earth system sciences. Nat Commun. 2019;10(1):2553.[DOI]
-
16. Almendra-Martín L, Martínez-Fernández J, Piles M, González-Zamora Á, Benito-Verdugo P, Gaona J. Influence of atmospheric patterns on soil moisture dynamics in Europe. Sci Total Environ. 2022;846:157537.[DOI]
-
17. Zeng L, Wang B, Wang T, Wang Z. Research on delay propagation mechanism of air traffic control system based on causal inference. Transp Res Part C Emerg Technol. 2022;138:103622.[DOI]
-
18. Saetia S, Yoshimura N, Koike Y. Constructing brain connectivity model using causal network reconstruction approach. Front Neuroinform. 2021;15:619557.[DOI]
-
19. Saetia S, Yoshimura N, Koike Y. Group representative brain connectivity model of episodic encoding using large fMRI dataset. J Phys: Conf Ser. 2019;1379(1):012058.[DOI]
-
20. Arab F, Ghassami A, Jamalabadi H, Peters MAK, Nozari E. Whole-brain causal discovery using fMRI. Netw Neurosci. 2025;9(1):392-420.[DOI]
-
21. Tzourio-Mazoyer N, Landeau B, Papathanassiou D, Crivello F, Etard O, Delcroix N, et al. Automated anatomical labeling of activations in SPM using a macroscopic anatomical parcellation of the MNI MRI single-subject brain. NeuroImage. 2002;15(1):273-289.[DOI]
-
22. Craddock C, Sikka S, Cheung B, Khanuja R, Ghosh SS, Yan C, et al. Towards automated analysis of connectomes: The configurable pipeline for the analysis of connectomes (C-PAC). Front Neuroinform. 2013.[DOI]
-
23. Stephan KE, Weiskopf N, Drysdale PM, Robinson PA, Friston KJ. Comparing hemodynamic models with DCM. NeuroImage. 2007;38(3):387-401.[DOI]
-
24. Haghighat H. A sex-dependent functional-effective connectivity model for diagnostic classification of Autism Spectrum Disorder using resting-state fMRI. Biomed Signal Process Control. 2023;85:104837.[DOI]
-
25. Lee D, Park JY, Kim WJ. Altered functional connectivity of the default mode and dorsal attention network in subjective cognitive decline. J Psychiatr Res. 2023;159:165-171.[DOI]
-
26. Wu H, Song Y, Yang X, Chen S, Ge H, Yan Z, et al. Functional and structural alterations of dorsal attention network in preclinical and early-stage Alzheimer’s disease. CNS Neurosci Ther. 2023;29(6):1512-1524.[DOI]
-
27. Zhu D, Liu Y, Zhao Y, Yan L, Zhu L, Qian F, et al. Dynamic changes of resting state functional network following acute ischemic stroke. J Chem Neuroanat. 2023;130:102272.[DOI]
-
28. Baran B, Nguyen QTH, Mylonas D, Santangelo SL, Manoach DS. Increased resting-state thalamocortical functional connectivity in children and young adults with autism spectrum disorder. Autism Res. 2023;16(2):271-279.[DOI]
-
29. Wagner L, Banchik M, Okada NJ, McDonald N, Jeste SS, Bookheimer SY, et al. Associations between thalamocortical functional connectivity and sensory over-responsivity in infants at high likelihood for ASD. Cereb Cortex. 2023;33(12):8075-8086.[DOI]
-
30. Sun F, Chen Y, Gao Q, Zhao Z. Abnormal gray matter structure in children and adolescents with high-functioning autism spectrum disorder. Psychiatry Res Neuroimaging. 2022;327:111564.[DOI]
-
31. Sutoko S, Atsumori H, Obata A, Funane T, Kandori A, Shimonaga K, et al. Lesions in the right Rolandic operculum are associated with self-rating affective and apathetic depressive symptoms for post-stroke patients. Sci Rep. 2020;10(1):20264.[DOI]
-
32. Briggs RG, Tanglay O, Dadario NB, Young IM, Fonseka RD, Hormovas J, et al. The unique fiber anatomy of middle temporal gyrus default mode connectivity. Oper Neurosurg. 2021;21(1):E8-E14.[DOI]
-
33. Nebel MB, Eloyan A, Barber AD, Mostofsky SH. Precentral gyrus functional connectivity signatures of autism. Front Syst Neurosci. 2014;8:80.[DOI]
-
34. Xu J, Wang C, Xu Z, Li T, Chen F, Chen K, et al. Specific functional connectivity patterns of middle temporal gyrus subregions in children and adults with autism spectrum disorder. Autism Res. 2020;13(3):410-422.[DOI]
-
35. Ren P, Bi Q, Pang W, Wang M, Zhou Q, Ye X, et al. Stratifying ASD and characterizing the functional connectivity of subtypes in resting-state fMRI. Behav Brain Res. 2023;449:114458.[DOI]
-
36. Brieber S, Neufang S, Bruning N, Kamp-Becker I, Remschmidt H, Herpertz-Dahlmann B, et al. Structural brain abnormalities in adolescents with autism spectrum disorder and patients with attention deficit/hyperactivity disorder. J Child Psychol Psychiatry. 2007;48(12):1251-1258.[DOI]
-
37. Frosch IR, Mittal VA, D’Mello AM. Cerebellar contributions to social cognition in ASD: A predictive processing framework. Front Integr Neurosci. 2022;16:810425.[DOI]
-
38. Chang LJ, Yarkoni T, Khaw MW, Sanfey AG. Decoding the role of the insula in human cognition: Functional parcellation and large-scale reverse inference. Cereb Cortex. 2013;23(3):739-749.[DOI]
-
39. Farrant K, Uddin LQ. Atypical developmental of dorsal and ventral attention networks in autism. Dev Sci. 2016;19(4):550-563.[DOI]
-
40. Fitzgerald J, Johnson K, Kehoe E, Bokde AL, Garavan H, Gallagher L, et al. Disrupted functional connectivity in dorsal and ventral attention networks during attention orienting in autism spectrum disorders. Autism Res. 2015;8(2):136-152.[DOI]
-
41. Liu W, Guan X, Zhang L, Zhu C, Chu H, Zhang X, et al. Electroencephalographic microstate evidence of visual network hyperactivation in children with autism spectrum disorder. J Intell Med. 2025;2(1):64-73.[DOI]
Copyright
© The Author(s) 2026. This is an Open Access article licensed under a Creative Commons Attribution 4.0 International License (https://creativecommons.org/licenses/by/4.0/), which permits unrestricted use, sharing, adaptation, distribution and reproduction in any medium or format, for any purpose, even commercially, as long as you give appropriate credit to the original author(s) and the source, provide a link to the Creative Commons license, and indicate if changes were made.
Publisher’s Note
Science Exploration remains a neutral stance on jurisdictional claims in published
maps
and institutional affiliations. The views expressed in this article are solely those
of
the author(s) and do not reflect the opinions of the Editors or the publisher.
Share And Cite


Science Exploration Style
Wang H, Liu L, Liu Y, Ding Y. PCMCI-SVM: A model identifying diagnostic biomarkers for autism spectrum disorder through causal network analysis. Comput Biomed. 2026;1:202523. https://doi.org/10.70401/cbm.2026.0009
Tips
Copy completed.
Submit a Manuscript
Author Instructions
Cite this Article
Article Metrics
0
View
0
Download
Cited
Article Updates

- Abstract
- Keywords
- 1. Introduction
- 2. Material and Methods
- 3. Results
- 4. Discussion
- 5. Research Limitations and Future Directions
- 6. Conclusion
- Supplementary materials
- Acknowledgements
- Authors contribution
- Conflicts of interest
- Ethical approval
- Consent to participate
- Consent for publication
- Availability of data and materials
- Funding
- Copyright
Science Exploration Style
Wang H, Liu L, Liu Y, Ding Y. PCMCI-SVM: A model identifying diagnostic biomarkers for autism spectrum disorder through causal network analysis. Comput Biomed. 2026;1:202523. https://doi.org/10.70401/cbm.2026.0009
copy
Share Link
copy