Janice A. Foster
*

,
Filbert Musau
*Correspondence to:
Janice A. Foster, Mackintosh Environmental Architecture Research Unit (MEARU), Glasgow School of Art, Glasgow, G3 6RQ, UK.
E-mail: j.foster@gsa.ac.uk
J Build Des Environ. 2025;3:202526. 10.70401/jbde.2025.0010
Received: March 21, 2025Accepted: June 17, 2025Published: June 20, 2025
This article belongs to the Special lssue Indoor Environmental Quality and Human Health
Abstract
In response to policy and legislative measures targeting the reduction of carbon dioxide emissions, building design has increasingly prioritised airtightness and energy efficiency. However, existing literature raises concerns that such designs may lead to issues such as overheating and inadequate ventilation. At the same time, some designers have turned to low-carbon construction materials such as straw bales, not only to minimise embodied carbon emissions but also to promote occupant health. Although straw bale buildings are known for their thermal efficiency, limited data are available on their indoor environmental quality (IEQ) during occupancy. This study presents a case study evaluating the environmental performance of an airtight, energy-efficient straw bale dwelling equipped with a decentralised ventilation system, located in southern England, UK. The research investigates whether the home maintains thermal comfort throughout the year, with a focus on both summer and winter seasons, along with an assessment of relative humidity and total volatile organic compounds (TVOCs). Data were collected over a 14-month period and evaluated against established IEQ benchmarks. Findings revealed no instances of overheating, even during a summer heatwave; however, elevated TVOC concentrations were recorded in summer compared to winter. Indoor temperature results also differed from those reported in previous studies on UK airtight homes, underscoring the need for broader research into the IEQ performance of dwellings constructed with natural materials to determine the extent to which sustainable building practices contribute to occupant comfort.
Keywords
Indoor environmental quality, decentralised ventilation, straw bale, overheating, thermal comfort
1. Introduction
For millennia, shelters and buildings worldwide have been constructed using natural materials, with building design and form continuously evolving alongside the industrialisation of construction processes. However, in the early 20th century, construction techniques in the United Kingdom (UK) began shifting away from traditional materials in response to a housing shortage and the urgent need to accommodate people after the world wars[1]. During this period, traditional building materials were scarce, and labour shortages prompted a major shift toward the use of mass-manufactured products such as concrete panels, steel frames, gypsum plaster, cementitious render, and later, synthetic insulation materials to accelerate housing delivery by an unskilled workforce[2]. This practice continues today, with dwellings constructed at scale using modern materials commonly referred to as ‘mainstream’ housing. This construction method has contributed to the erosion of the skills and knowledge associated with natural building techniques[2]. In addition, the ongoing use of mass-produced and highly processed materials in mainstream construction results in high embodied CO2 emissions[3], which contribute to climate change.
In the UK, energy consumption in dwellings accounts for approximately 20% of end-user greenhouse gas (GHG) emissions[4,5]. Given the well-established link between GHG emissions and adverse climate change effects, mitigation efforts in the UK include increasingly stringent policies aimed at achieving net zero GHG emissions by 2050. Within the housing sector, this strategy underscores the necessity for greener (sustainable) buildings that improve energy efficiency and foster innovation throughout supply chains[6]. In response, incremental updates to building regulations have introduced criteria for enhanced energy efficiency focused primarily on space heating, with the goal of reducing operational CO2 emissions. Nonetheless, comprehensive top-down mandates for sustainable buildings remain limited. Despite this, bottom-up approaches are gaining traction, with designers increasingly incorporating natural materials and whole-life carbon assessments into their projects—areas where regulation could help establish a level playing field[7].
Typically, sustainable designs employ a holistic approach that prioritises advanced fabric energy efficiency alongside environmental, economic, and social considerations, including the health and well-being of both constructors and future occupants[8,9]. This building typology is characterised by enhanced performance achieved through the selection of natural building materials and the integration of passive design strategies[10]. Sustainable buildings generally stand in direct contrast to today’s mainstream constructions, which, as previously noted, exhibit high embodied CO2 emissions and rely on energy-intensive active systems to maintain occupant comfort. Therefore, if policies aim to promote ‘greener’ buildings, increasing the adoption of natural building materials in construction projects is crucial.
Straw bale dwellings are recognised as a form of sustainable building, offering long-lasting durability and effective thermal insulation performance[11,12]. Straw, a byproduct of annual cereal crops such as wheat, oats, barley, and rye, has a lower environmental impact compared to conventional construction materials[12,13]. The use of straw bales in building dates back to the late 1800s in Nebraska, United States of America, where this construction method gained popularity following the invention of the baling machine, which produced well-compacted straw bales suitable for external walls[13]. In the UK, straw bale construction became more prominent in the 1990s, attracting interest from the self-build community and ecologically conscious designers[14]. As more designers recognise the advantages of natural construction materials, straw bale buildings have the potential to become mainstream in future construction. However, despite this positive trend, there remains limited knowledge regarding the in-situ performance of indoor environmental quality (IEQ) within straw bale dwellings.
Several studies have investigated the thermophysical properties of straw bale constructions to improve understanding of this building material[15]. For instance, an in-situ U-value measurement using heat flux plate methodology on a homogeneous straw bale wall, 532 mm thick (comprising a 450 mm bale, 40 mm earthen plaster externally, and 42 mm lime plaster internally, with a density of 80 kg/m3), demonstrated a thermal transmittance of 0.119 ± 0.041 W/m2·K[16]. Another study reported similar U-values for straw bale walls approximately 500 mm thick, with measured U-values ranging from 0.1 to 0.2 W/m2·K[17]. These results support confidence in the insulating performance of straw bale constructions, as the lower U-values observed exceed the stringent criteria of the Passivhaus energy standard, while the highest measured U-values remain below the external wall backstop U-values specified in UK building regulations.
Existing in-situ IEQ studies of straw bale buildings, such as one conducted in Germany, have demonstrated that straw bale walls can effectively moderate temperature fluctuations and stabilise indoor relative humidity (RH)[18]. Similarly, research in Tecate, Mexico, reported that indoor air temperatures in a straw bale office remained around 25 °C during summer despite significant diurnal external temperature variations[19]. However, these studies were limited by short monitoring periods and unoccupied buildings, resulting in insufficient data on annual and seasonal performance. More recently, a six-year study in Norfolk, UK, measured indoor temperature and RH in a straw bale building designed with Passivhaus-standard windows and equipped with a mechanical ventilation with heat recovery (MVHR) system. Comfortable average winter temperatures of 19.3 °C were recorded during intermittent occupancy, rising to 21.7 °C under full occupancy, with minimal active heating reported. RH levels remained stable between 40% and 65% throughout the monitoring period, indicating a healthy indoor environment[11]. While these findings support the potential for straw bale dwellings to provide comfortable conditions, there remains a paucity of published research on in-situ IEQ measurements in occupied straw bale buildings designed with passive heating and ventilation strategies and measured airtightness as-built.
In the UK, stricter building regulations have resulted in the construction of new homes that are highly insulated and airtight. However, this has led to growing concerns about overheating, particularly in southern regions. Research conducted over recent decades indicates that residents are increasingly struggling to keep their homes cool during summer months[20-25], raising significant public health concerns, especially for vulnerable populations[26]. Efforts to mitigate overheating may inadvertently increase reliance on air conditioning systems or contribute to summertime fuel poverty[26]. This trend presents a substantial challenge to the UK’s ambition to achieve net-zero emissions within the housing sector. Additionally, IEQ research highlights health risks associated with emissions of volatile organic compounds (VOCs) originating from external sources, building materials, furnishings, and occupant activities[27-29]. VOCs indoors can undergo complex chemical reactions that adversely affect occupant health[30-34], with emissions tending to increase at higher temperatures[29], a pattern particularly evident during summer months[35]. Nevertheless, there is limited knowledge regarding the intensity of VOC emissions in dwellings constructed from natural materials. Therefore, addressing IEQ in new buildings is increasingly critical to safeguarding occupant health while maintaining comfort.
Despite the growing popularity of straw bale construction, there remains a notable lack of empirical studies examining their in-situ performance, particularly within the UK context. Given the limited research and existing literature on IEQ in straw bale dwellings, this study aims to address that gap. The primary objective was to evaluate the IEQ of an occupied straw bale dwelling in southern England, focusing specifically on indoor air temperature, RH, and total VOCs (TVOCs) across different seasons. By conducting the study in a real-world setting, this research seeks to capture the dynamic behaviour of these parameters, providing insights into building performance during both summer and winter, thereby enhancing understanding of how straw bale dwellings perform under actual living conditions.
2. Method
A mixed-methods research design was employed for this case study, utilizing granular data collected through in-situ measurements and occupant activities in an occupied straw bale house, in order to gain insights into the IEQ performance across different seasons.
2.1 House Description
The 258 m2 detached case study dwelling, located near Southampton, UK, was completed and occupied in 2017. The house is designed on a single level to ensure easy accessibility for a full-time wheelchair user and to accommodate the occupants’ lifelong needs. The accommodation comprises an open-plan living, kitchen, and dining area, a utility room, four bedrooms, two bathrooms, and a home office. The dwelling is designed with built-in flexibility to accommodate a future live-in carer, who would have dedicated living spaces within the current home office, bedroom 4, and bathroom 2. The construction employs natural, low-VOC emitting materials, including load-bearing straw bale external walls finished with pigmented lime render externally and untreated larch timber cladding (Figure 1).
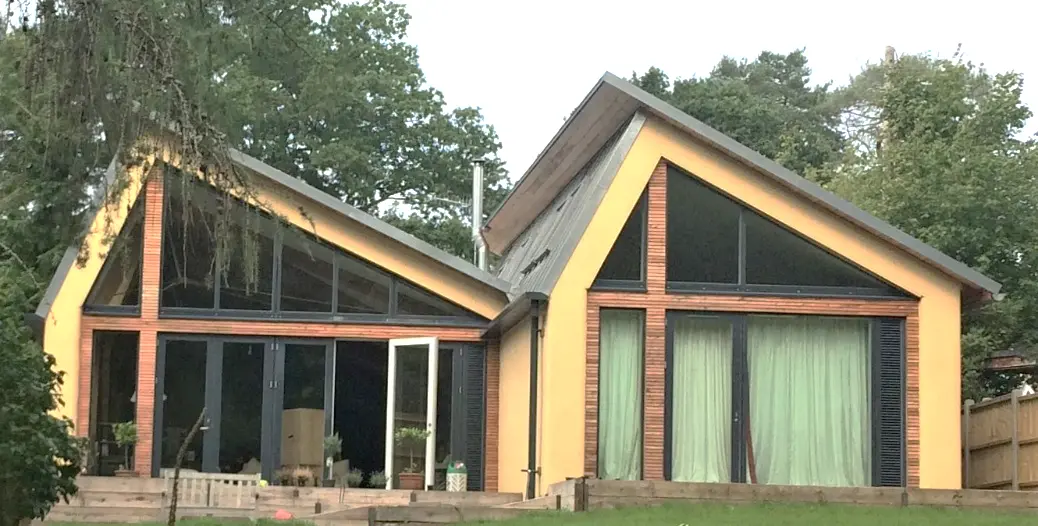
Figure 1. Rear façade (east facing). Living room to the left and bedroom to the right (image by authors).
Internally, the straw bale walls are finished with clay plaster and coated with clay paint. Internal partitions consist of timber frames with reinforced gypsum and cellulose boards on both sides. The double-pitched roof design allows low-angled solar gains to enter all rooms during winter, thereby reducing space heating demand. The northern roof section covers the bedrooms, while the southern roof extends over the open-plan living area, as illustrated in Figure 2. The front and rear elevations of the house face west and east, respectively.
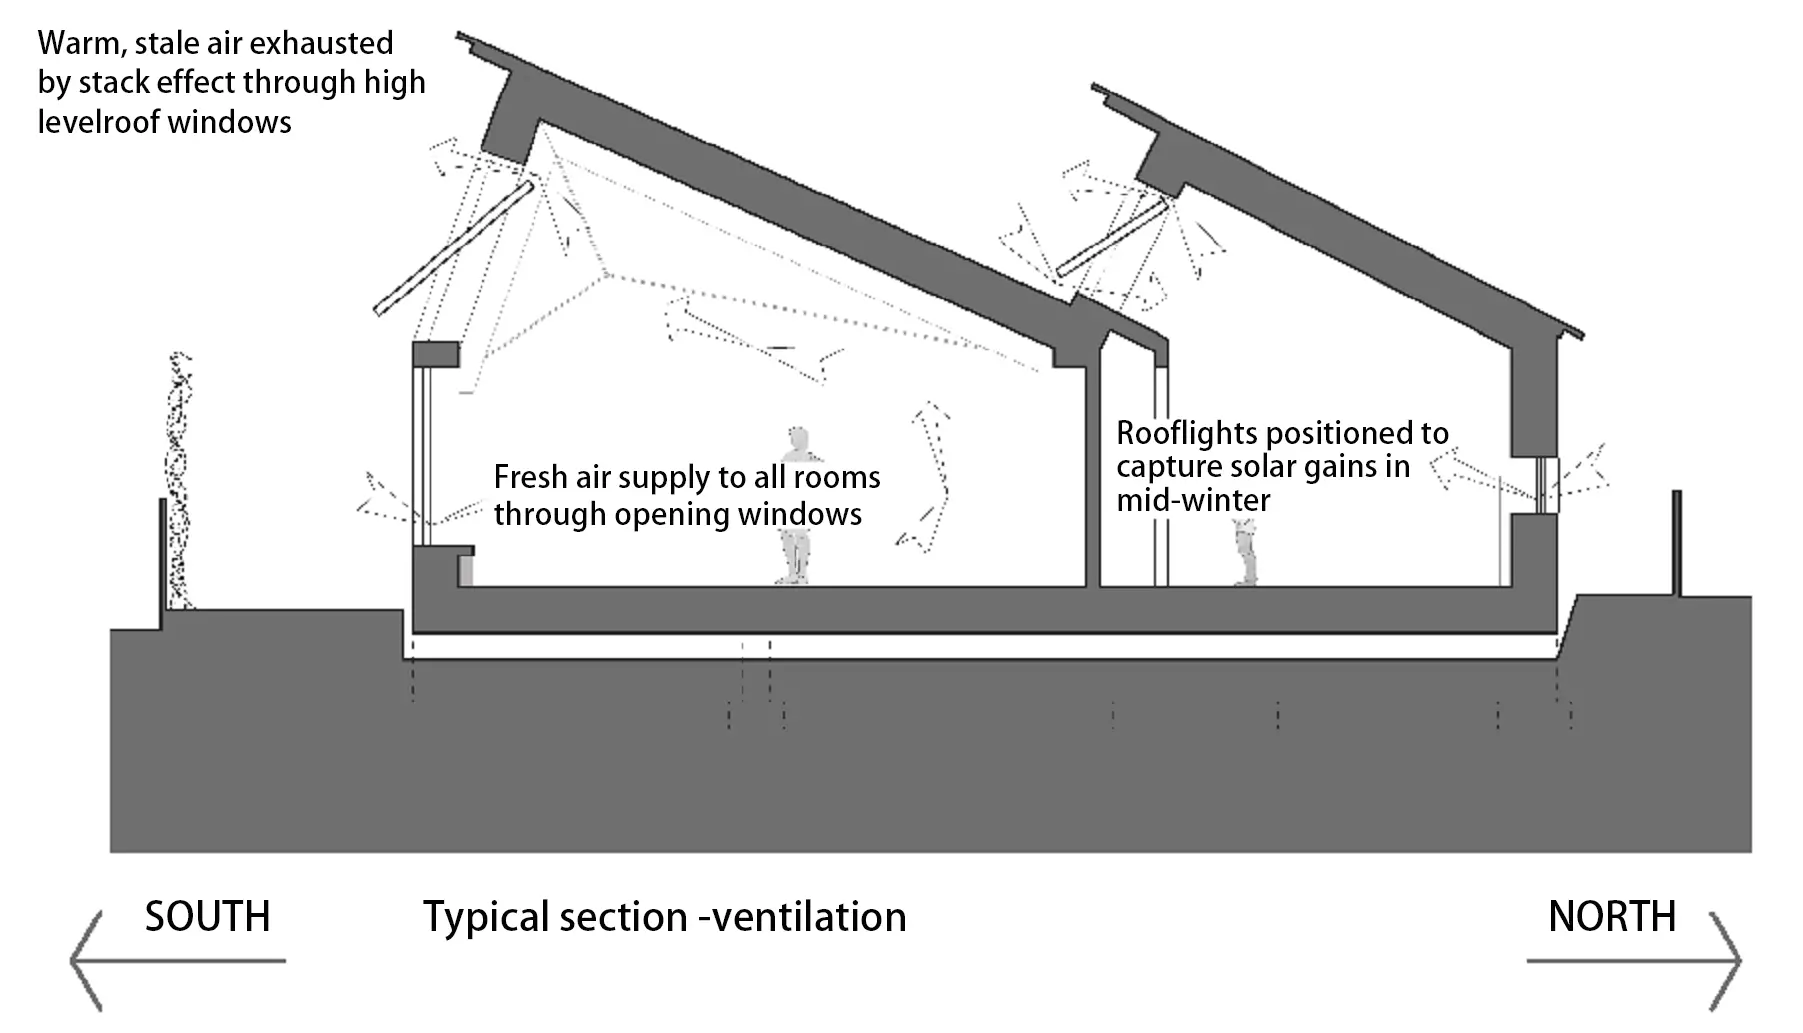
Figure 2. Dwelling cross section illustrating double roof design to allow passive solar gain and ventilation strategy (Image by the architect).
All window and rooflight frames are made of aluminium-clad timber, fitted with triple-glazed units (glazing g-value of 0.53). The roofs and floors are constructed using timber joists insulated with blown cellulose. All rooms feature vaulted ceilings composed of reinforced gypsum and cellulose boards, finished with clay paint. Untreated timber battens line portions of the living area ceiling, serving both as a decorative element and an acoustic buffer. Internal floors are finished with oiled oak, while natural linoleum covers the bathroom floors. Underfloor heating pipework is embedded within a dry mix of lime and sand, with space heating provided by a gas-fired condensing boiler. Additionally, a secondary heating system, a 5 kW wood-burning stove with a direct outdoor air supply, is installed in the living room.
The measured air permeability rate of the dwelling was 2.55 m3/m3/h at 50 Pa. According to building regulation guidance, dwellings with airtightness below 5 m3/m2/h at 50 Pa typically require the installation of a MVHR system. However, the architect designed a ventilation strategy combining operable windows and decentralised extract fans. This approach was approved by the building control authorities after the designers used computer simulation software to demonstrate that adequate ventilation could be achieved without MVHR.
Ventilation in the house comprises a combination of cross and stack ventilation, supplemented by five decentralised humidistat-controlled mechanical extract fans located in the bathrooms, kitchen, and utility room. The fans operate independently and have a combined extraction flow rate of 124 m3/h (0.13 air changes per hour) in low mode, increasing to 293 m3/h (0.3 air changes per hour) during combined boost. Secure ventilation is provided by inward-opening insulated panels integrated into the fenestrations in the entrance hall, living room, office, and master bedroom. The window design incorporates external louvres on the outside of these insulated panels, which form part of the window frame. The louvres prevent external access to the dwelling when the panel is open. These are referred to as secure ventilations, as they can be opened overnight to allow ingress of outside air while other doors and windows are likely closed, providing security when occupants are sleeping. Figure 1 shows an external view of the ventilation louvre panels on the right side of the window configurations, and Figure 3 shows an internal view of the vent panel in the home office.
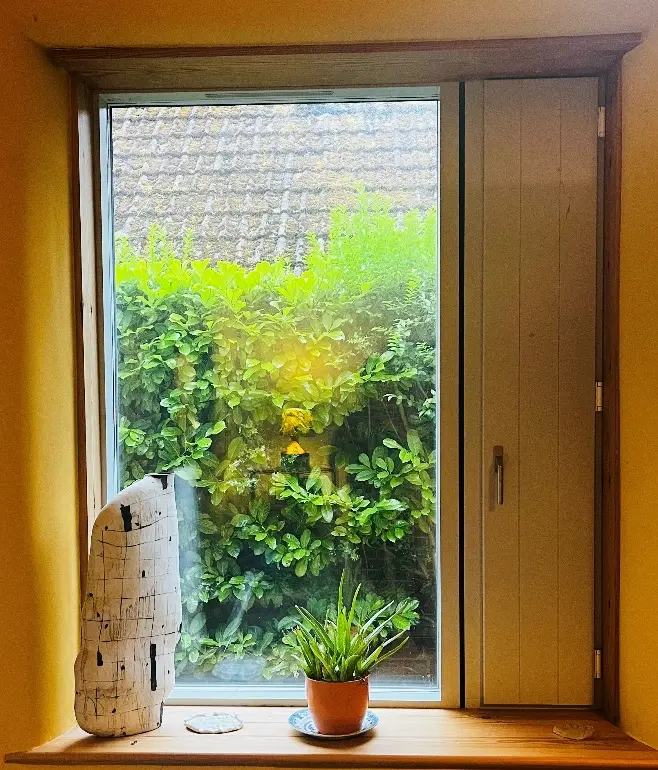
Figure 3. Internal view of insulated vent panel providing secure ventilation in the home office (image by the architect).
Thermal transmittance (U-value) for each building element is presented in Table 1. The table compares the design U-values for the case study dwelling with the maximum U-values specified in the 2015 Building Regulation Approved Document L1 for new dwellings, which was in effect at the time of design. The design U-values for the external elements are significantly lower than the regulatory limits.
Table 1. Elemental design U-values for the dwelling shown against the building regulation new build elemental U-values year 2015.
| Element | Design U-value Straw Bale dwelling W/(m2·K) | Design U-value Building Reg Max W/(m2·K) |
| Roof | 0.12 | 0.16 |
| Wall | 0.11 | 0.26 |
| Floor | 0.10 | 0.18 |
| Window | 0.85 | 1.60 |
| Rooflight | 0.85 | 2.20 |
| Door | 0.85 | 1.60 |
According to the UK Met Office, the dwelling is located in a temperate climate zone. The average annual minimum external temperature is approximately 8 °C, while the average maximum temperature reaches around 15 °C. Winter lows typically drop to about 3 °C, and summer maximum outdoor temperatures generally reach 22 °C. Annual rainfall is evenly distributed throughout the year, totaling approximately 818 mm. The wettest months are from November to February, with around 12 days of rainfall each month. In contrast, July and August experience about 8 days of rainfall per month[36].
2.2 Indoor air quality monitoring
Low-cost Foobot sensing equipment by Airboxlab (unit dimensions: 172 mm height × 71 mm depth) was used to collect indoor air temperature, RH, and TVOC data at five-minute intervals throughout the fourteen-month study period (Figure 4). Equipment specifications and accuracies, as provided by the manufacturer’s datasheets, are as follows: air temperature range 15-45 °C ± 1 °C; relative humidity 30-85% RH ± 5%; TVOC measured using MOS sensor technology with a precision of ± 10%. The device detects individual VOCs including formaldehyde, isobutane, toluene, methane, ammonia, and benzene; however, the Foobot outputs a combined TVOC value rather than separate concentrations of individual VOCs.
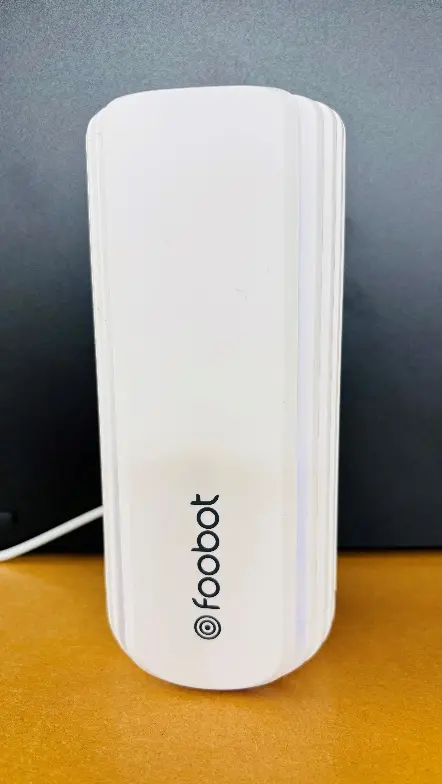
The use of the Foobot units enabled simultaneous data collection for these indoor pollutants, providing a non-invasive method for field measurements. Four Foobot units were sent to the householder via postal service, along with instructions to facilitate a remote set-up. The occupant connected the units to the Foobot App and placed one unit at a height above 1.1 metres from the finished floor level in each of the following rooms: living room, kitchen, office, and bedroom 2 (Figure 5).
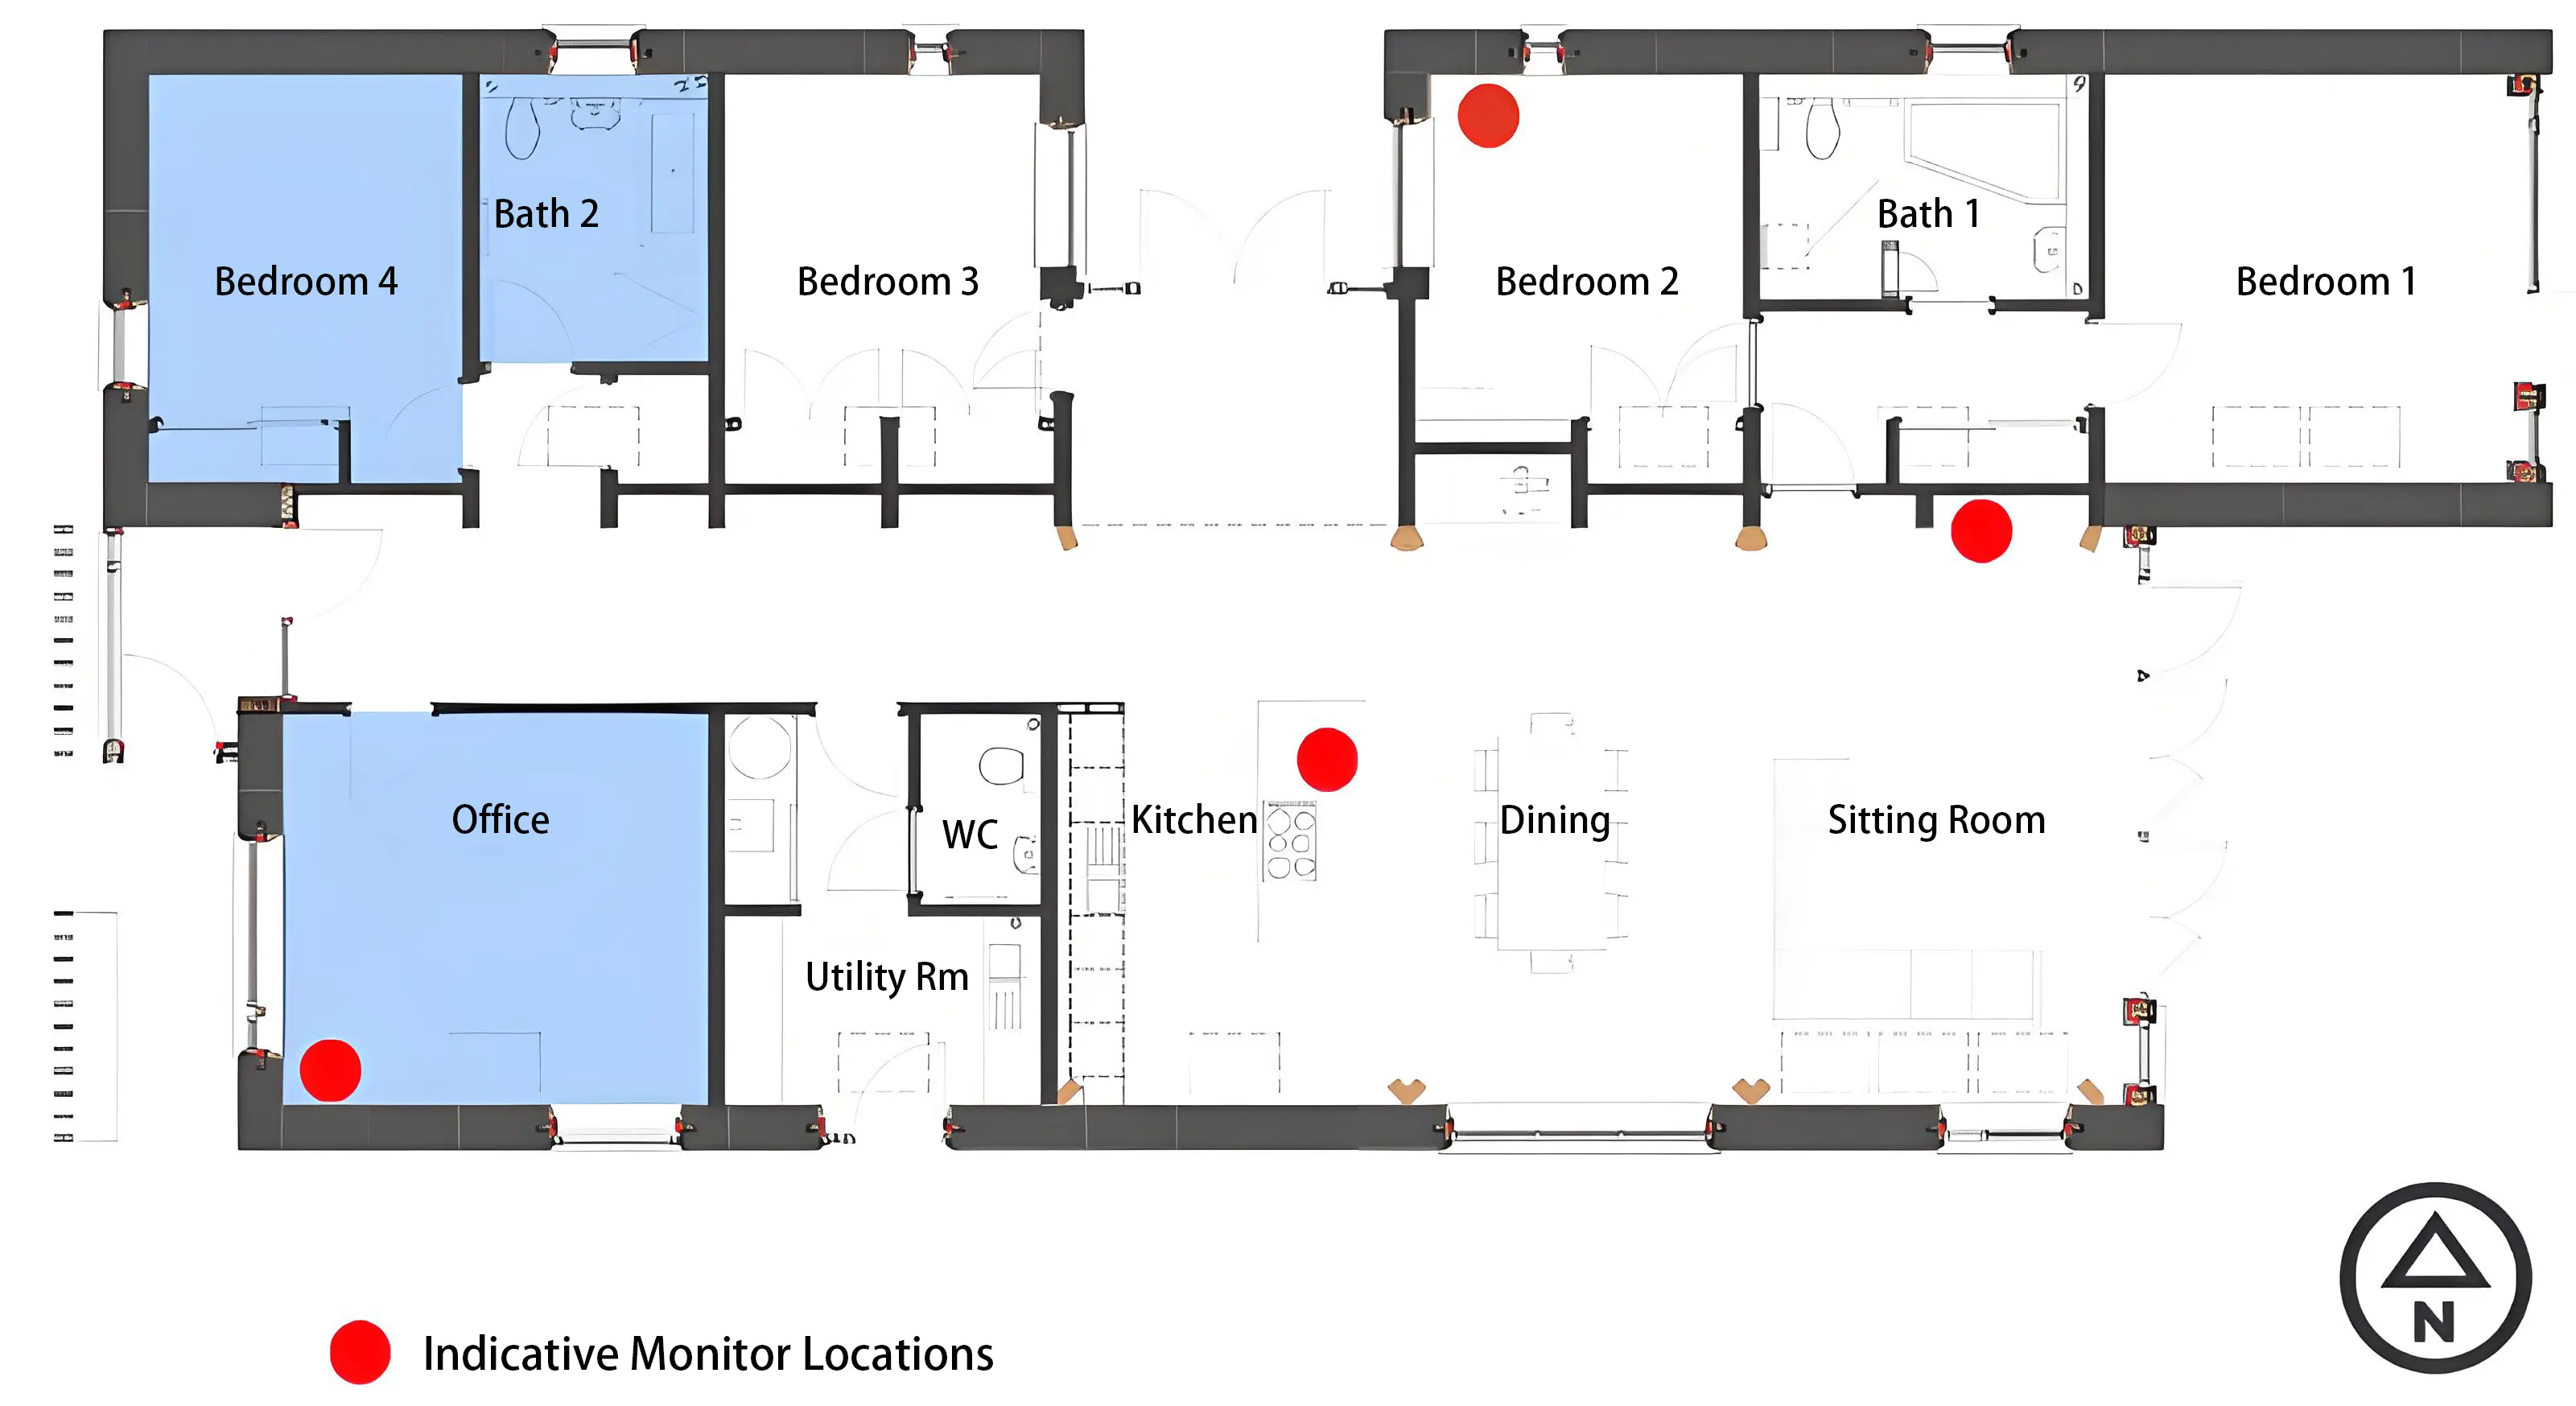
Figure 5. Whole life dwelling floor plan and indicative locations of Foobot monitoring apparatus. The shaded area shows the part of the home designed for a future carer (image by the architect).
The benefit of using this low-cost equipment approach was two-fold. Firstly, the web-based application allowed real-time and historical data viewing by the occupants. Secondly, the researchers, who were located in Scotland, could remotely download data from Foobot’s online data repository. However, there were drawbacks to using these units, including the risk of data loss if the units were unplugged or if the Wi-Fi connection was interrupted; the relatively short power cables, which restricted optimal placement; and the limitation that the units are designed solely for indoor use, making it impossible to collect external data using these devices. Although these non-scientific grade sensors posed a potential risk of accuracy variation, previous academic research has shown that Foobot measurement devices provide good accuracy and reliable data compared with scientific equipment for the parameters relevant to this study[37-39]. For this reason, and due to the ease of data access, the Foobot equipment was deemed appropriate for use in the current case study.
The household consisted of four residents, all non-smokers: two adults under the age of 45 and two children, aged five and seven. Data collection was conducted from 2 December 2019 to 31 January 2021, with measurements recorded at five-minute intervals. From March 2020 to January 2021, the family occupied the house without visitors due to restrictions related to the COVID-19 pandemic. One adult worked in the home office on weekdays between 09:00 and 17:00, and the children were home-schooled in the living room. Bedroom 2 was shared by both children.
Data were retrieved in .csv format from the Foobot website, and subsequent analysis of indoor air temperature, RH, and TVOC data was conducted using Microsoft Excel 2019. This analysis involved comparing the data against recognised benchmarks. The Chartered Institution of Building Services Engineers (CIBSE) thermal comfort and overheating criterion was applied, which states that no more than 1% of occupied hours should exceed 26 °C for bedrooms and 28 °C for other rooms[40]. While it is recognised that a dynamic adaptive method is now more commonly used for overheating analysis[41], outdoor air temperature data could not be collected directly at the house location. Instead, 30-minute data from a private meteorological station located 15 km from the dwelling[42] were used to calculate the running mean external air temperature, enabling an overheating assessment using the adaptive method[41,43]. RH levels were assessed against the optimal health range of 40 to 60% RH[44,45], and TVOC data were evaluated according to the guidelines outlined in Approved Document F[46]. Quantitative data were compared with qualitative information collected during two week-long periods in which the occupants kept diaries of their household activities. These diaries recorded specific details about occupancy, bathing, cooking, laundry, window opening, and heating practices at the following times:
• Summer diary: 8 August - 14 August 2020
• Winter diary: 25 January - 31 January 2021
A few instances were identified where the Foobot units failed to record data; these were sporadic, with one or two consecutive readings missing. The most significant data loss occurred for the monitor in the kitchen, where no data were recorded for 26 consecutive days starting from 23 July 2020. This period included the summer diary week. However, since the kitchen is open plan to the living area, which was monitored by a separate Foobot unit, this data loss was not considered significant. In all cases, the missing data appeared as empty cells in the spreadsheet.
3. Results
The objective of this research was to assess the IEQ in an occupied straw bale house and to compare the findings against established industry benchmarks. The following sections present the results and analysis of indoor air temperature, RH, and TVOCs in relation to recognised industry standards.
3.1 Indoor air temperature
Indoor air temperature measurements were evaluated to determine whether thermal comfort was achieved during winter and to assess overheating during summer. Table 2 provides an overview of the mean indoor temperatures, indicating that thermal comfort was generally maintained throughout the monitoring period. However, the analysis of absolute minimum temperatures in the bedroom and maximum temperatures in the living room and office warrants further attention, as these values fell outside the CIBSE comfort criteria.
Table 2. Indoor air temperature measured over three periods of monitoring (°C).
| 14-month period | Summer Diary Week | Winter Diary Week | ||||||||||
| Bedroom | Kitchen | Living Room | Office | Bedroom | Kitchen* | Living Room | Office | Bedroom | Kitchen | Living Room | Office | |
| Minimum | 8.4 | 16.4 | 16.2 | 15.3 | 21.2 | - | 20.5 | 21.5 | 15.6 | 19.9 | 19.7 | 18.2 |
| Maximum | 25.5 | 27.8 | 31.8 | 30.2 | 25.5 | - | 31.8 | 30.2 | 19.4 | 22.8 | 22.8 | 20.3 |
| Standard Deviation | 2.2 | 1.4 | 1.6 | 1.8 | 1.2 | - | 2.7 | 2.0 | 0.82 | 0.76 | 0.72 | 0.48 |
| Mean | 17.9 | 20.8 | 20.9 | 19.6 | 23.3 | - | 25.5 | 25.3 | 17.8 | 21.3 | 21.1 | 19.3 |
* Data collection failed during the summer diary period.
Figure 6 shows the data trend over the entire monitoring period. It indicates that the bedroom temperature frequently fell below the comfort temperature of 17 °C at various times throughout the year and was generally maintained at temperatures cooler than the CIBSE thermal comfort benchmarks for both summer and winter. The occupant noted that although the Foobot unit in this room was placed near a small window, the window remained closed because ventilation was provided through the roof light. Data inspection revealed that the absolute minimum temperatures occurred overnight between 25th and 26th December 2020, with temperatures below 12 °C recorded for short periods on two other occasions. Given the irregularity of these low temperatures, it is plausible that the window near the Foobot unit was opened during those times. The occupant’s diary also noted that the underfloor heating system serving the bedroom was not operated at any point during the monitoring period.
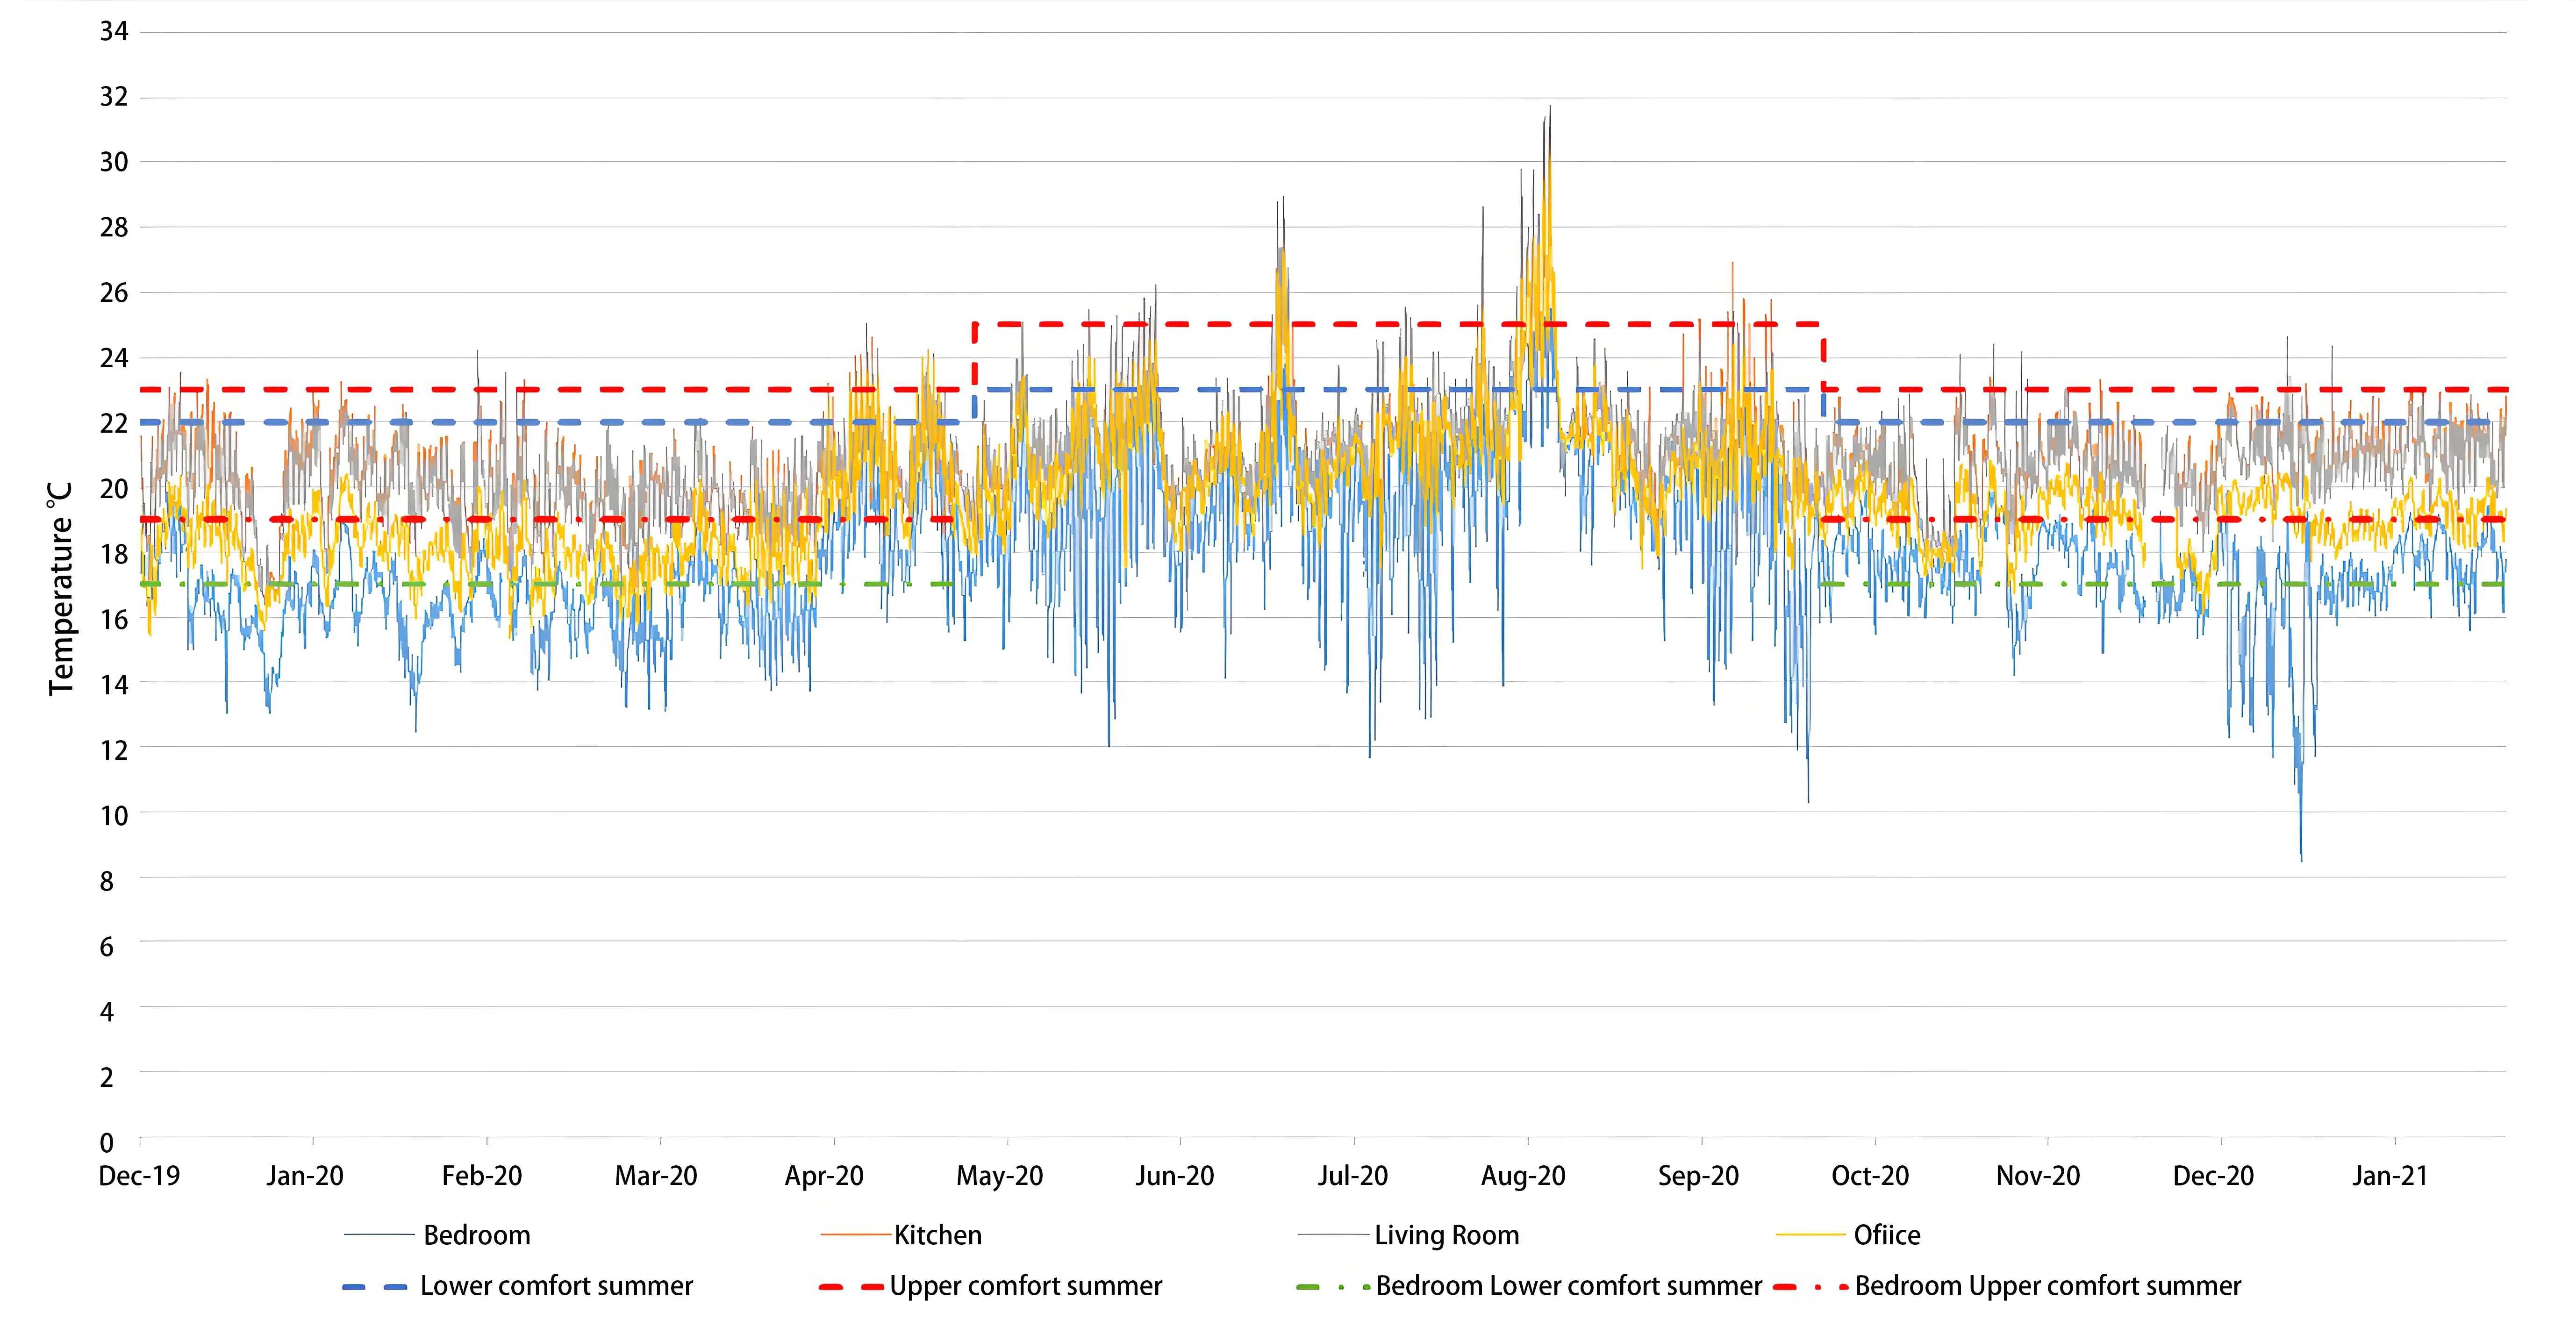
Figure 6. Indoor temperatures plotted against CIBSE summer and winter thermal comfort thresholds.
Elevated temperatures were recorded in the living room and office, with peak temperatures exceeding the CIBSE benchmarks on two occasions during the summer. These peaks coincided with high external temperatures recorded in the summer diary week, reflecting a temperature profile typical of a lightweight building. During this period, the occupant reported that no solar shading was used, and the doors and windows in these rooms were intentionally left open to maintain a connection with the garden.
Data from May to September was used for a static overheating evaluation to assess whether indoor temperatures exceeded 26 °C in the bedroom and 28 °C in other rooms for more than 1% of the annual occupied time. The analysis confirmed that overheating did not occur in any of the monitored rooms, with values of 0% in the bedroom and kitchen, 0.17% in the office, and 0.53% in the living room. Using the adaptive overheating methodology for the same period, as described by CIBSE[41,43], the results indicated zero overheating risk in all three rooms assessed. It is important to note that the calculations assumed the operative temperature was equal to the air temperature, as internal radiant temperature and air speed were not measured in this study. Therefore, the calculated overheating risk reflects typical conditions when air temperature and operative temperature are expected to be nearly equal, i.e., when there is no direct sunlight on internal surfaces combined with typically low internal air speeds. This assessment does not cover the less common conditions when direct sunlight enters the home or when increased air velocity occurs due to open windows, both of which can significantly affect the operative temperature experienced by occupants.
The duration for which the data remained within the comfort zone is shown in a box-and-whisker plot (Figure 7). This plot indicates that the lower quartile for the bedroom tended toward the cooler side. The kitchen, living room, and office generally stayed within the comfort thresholds, with only a few outliers exceeding the thermal comfort benchmarks.
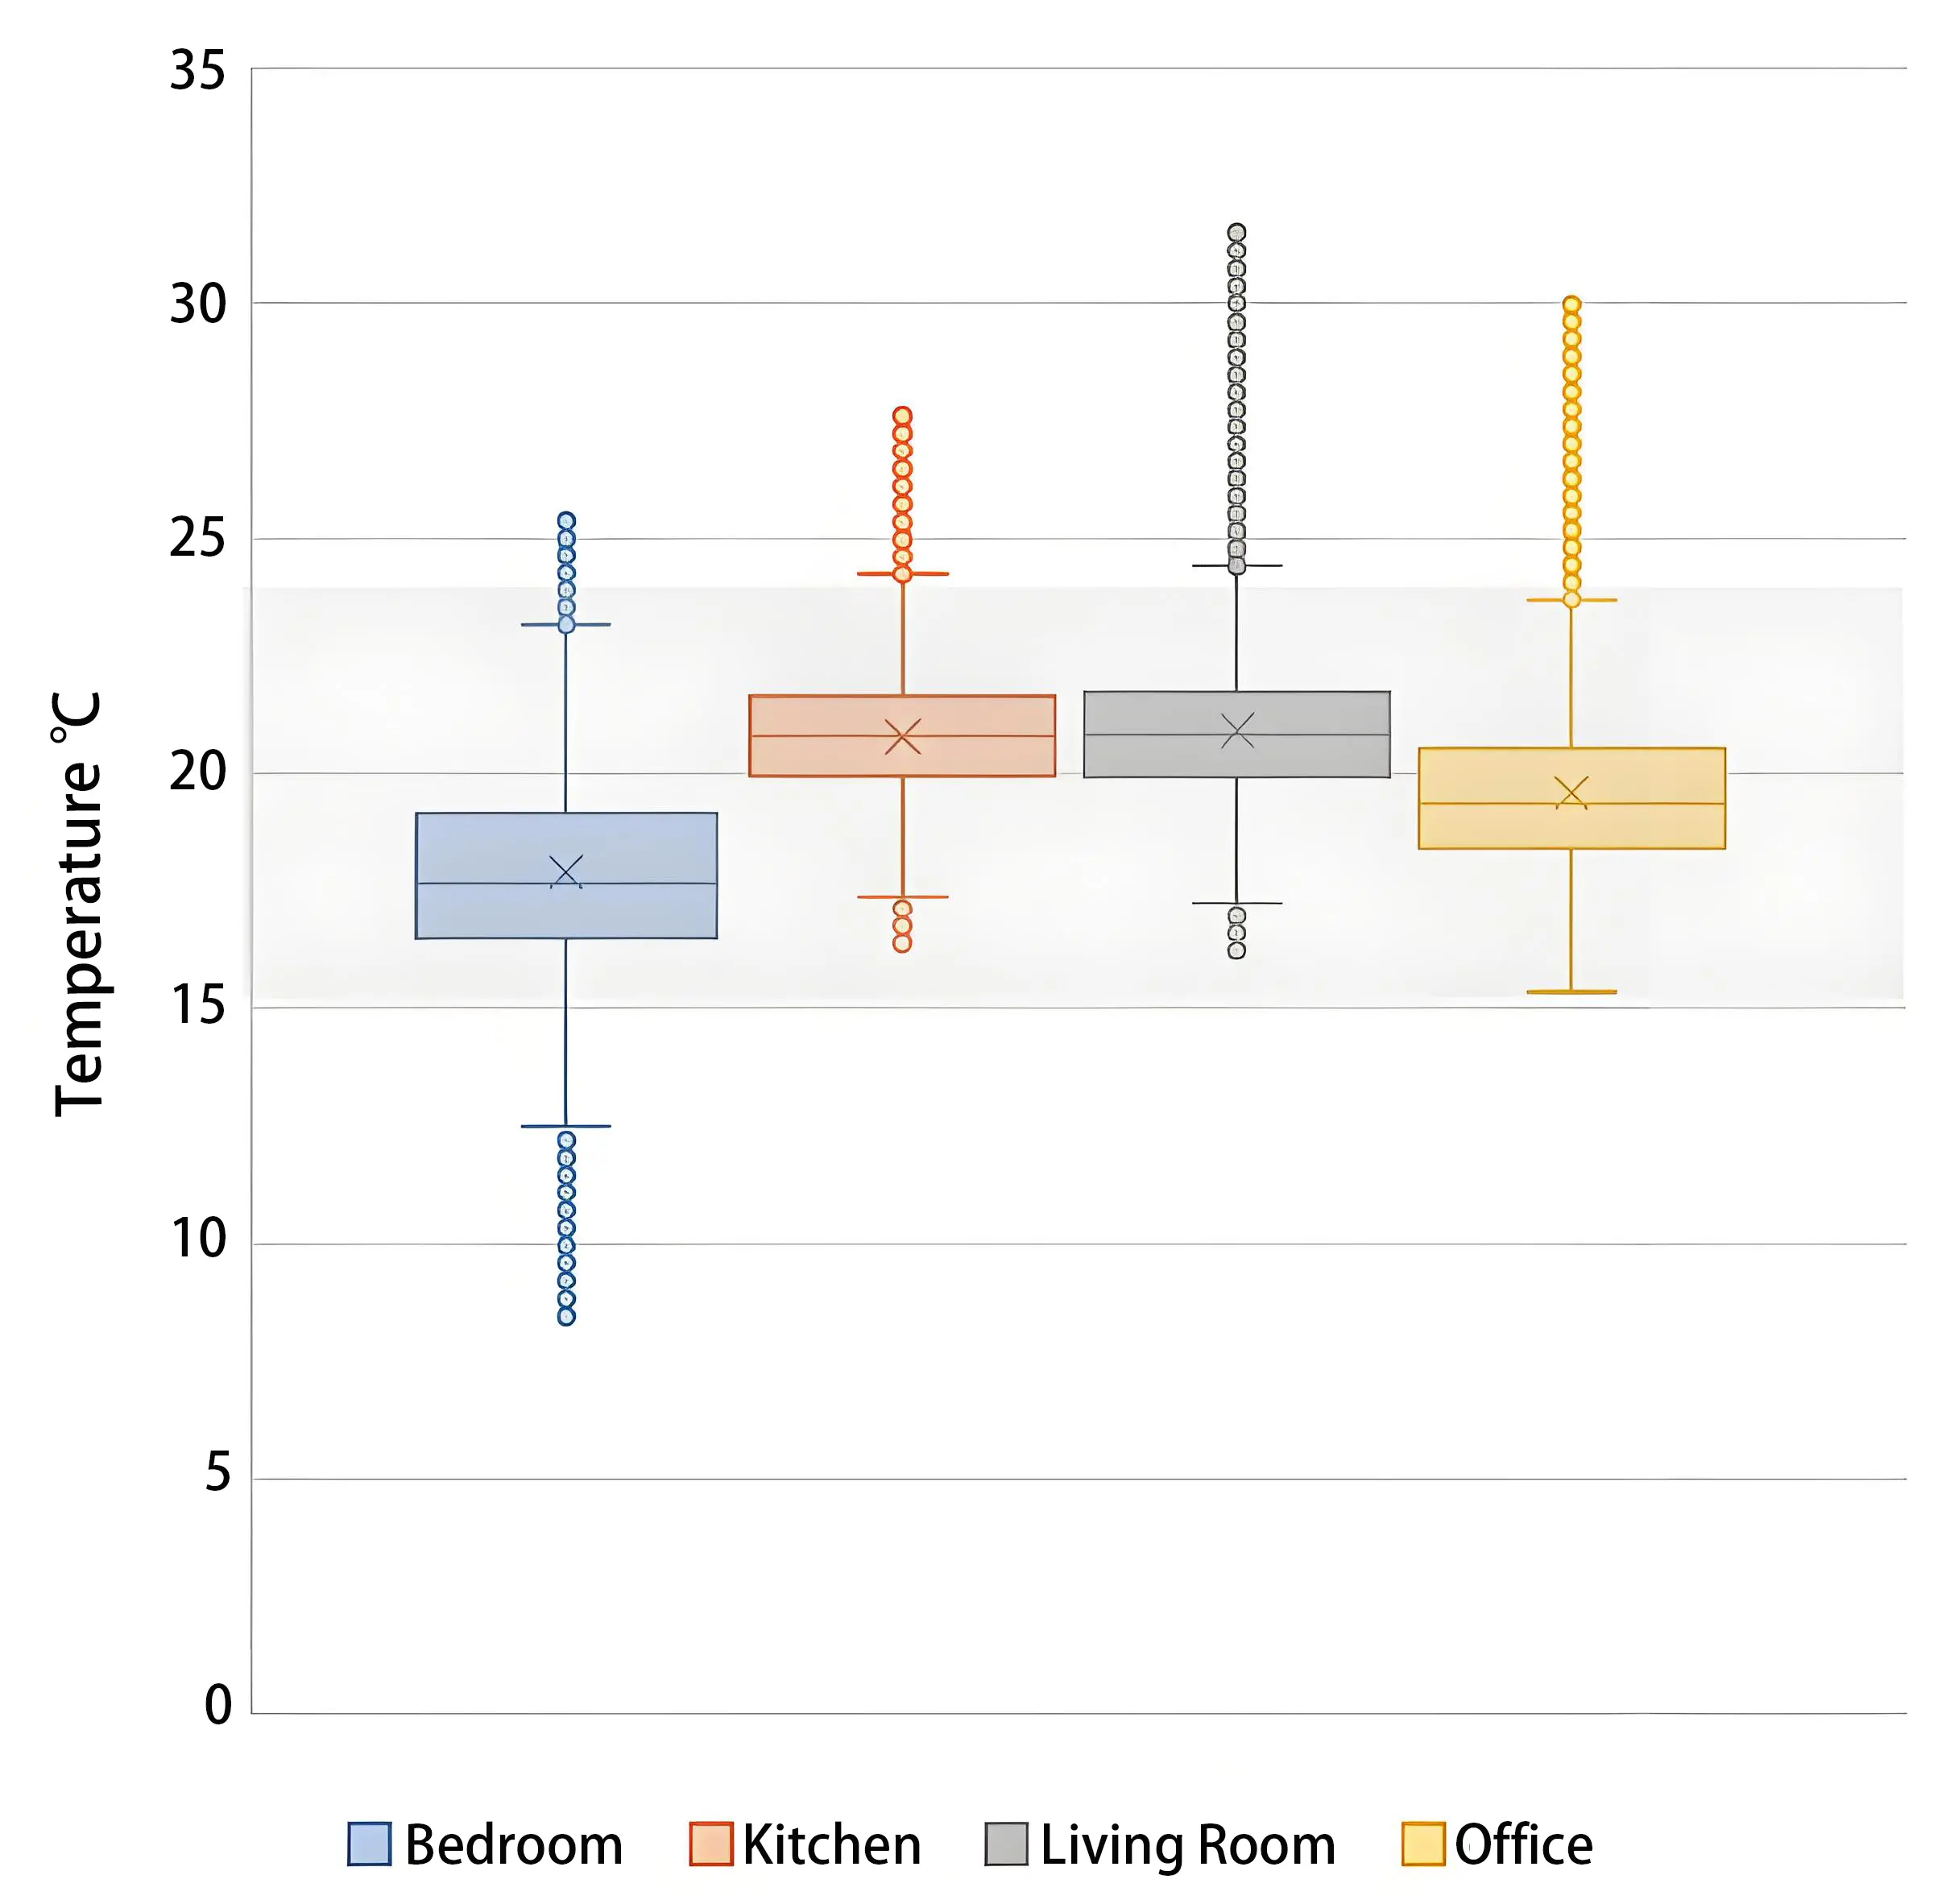
Figure 8 corresponds to the summer week during which the occupants kept a diary. It shows a relatively stable bedroom temperature that remained below the overheating threshold. Overnight temperatures were within a range conducive to comfortable sleep. In contrast, temperature fluctuations were observed in the office and living room, with peaks in the living room approximately 2 °C higher than those in the office. Comparing the indoor temperatures with external air temperatures revealed that the indoor temperatures cooled overnight as the outdoor environment cooled. On the last two days of this diary week, indoor temperatures stabilized, coinciding with lower external temperatures that reflect more typical summer averages for this region of the UK.
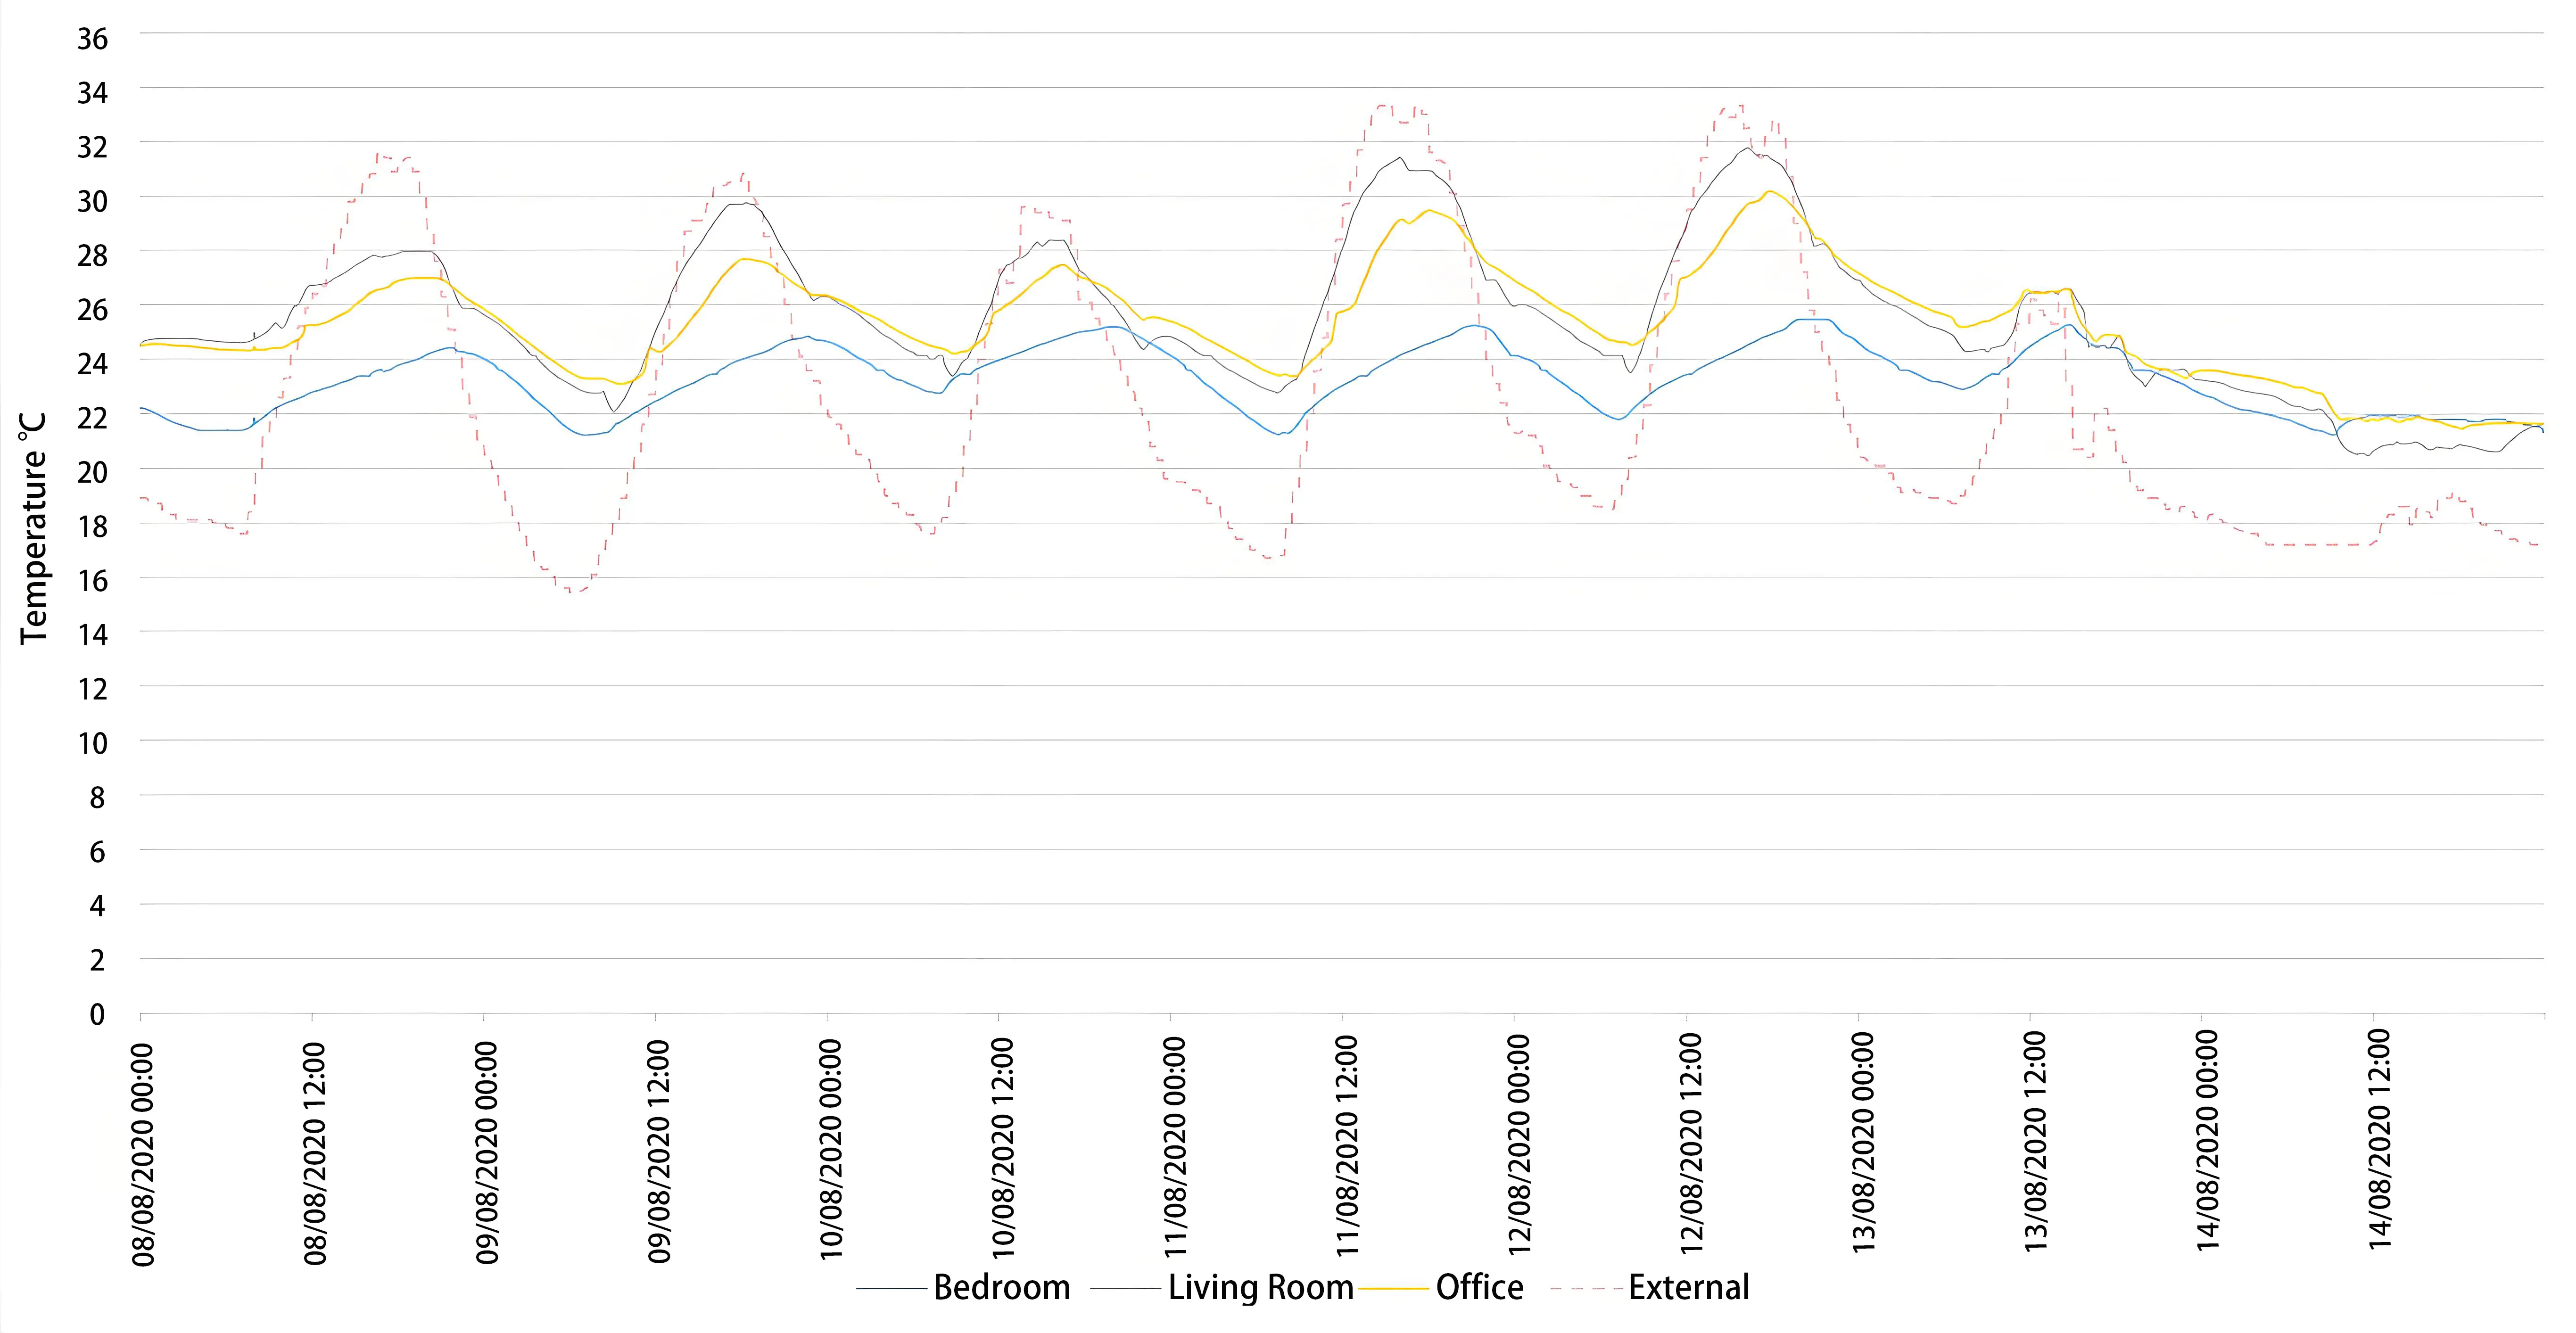
Figure 8. Indoor temperature trend during the summer diary week, plotted against external air temperature.
The data collected during the winter diary week are presented in Figure 9. While external diurnal temperatures varied, indoor conditions remained relatively consistent throughout the day and night. The bedroom was the coolest room in the house, while the open-plan living room and kitchen were the warmest, peaking at 22 °C. The office temperature was maintained steadily between 18 and 20 °C. The occupants noted that the primary heating system was used to heat the office, and the wood stove was used to heat the living room. The bedroom was not actively heated during this period but received heat from solar gains and by opening the door between the bedroom and the living areas.
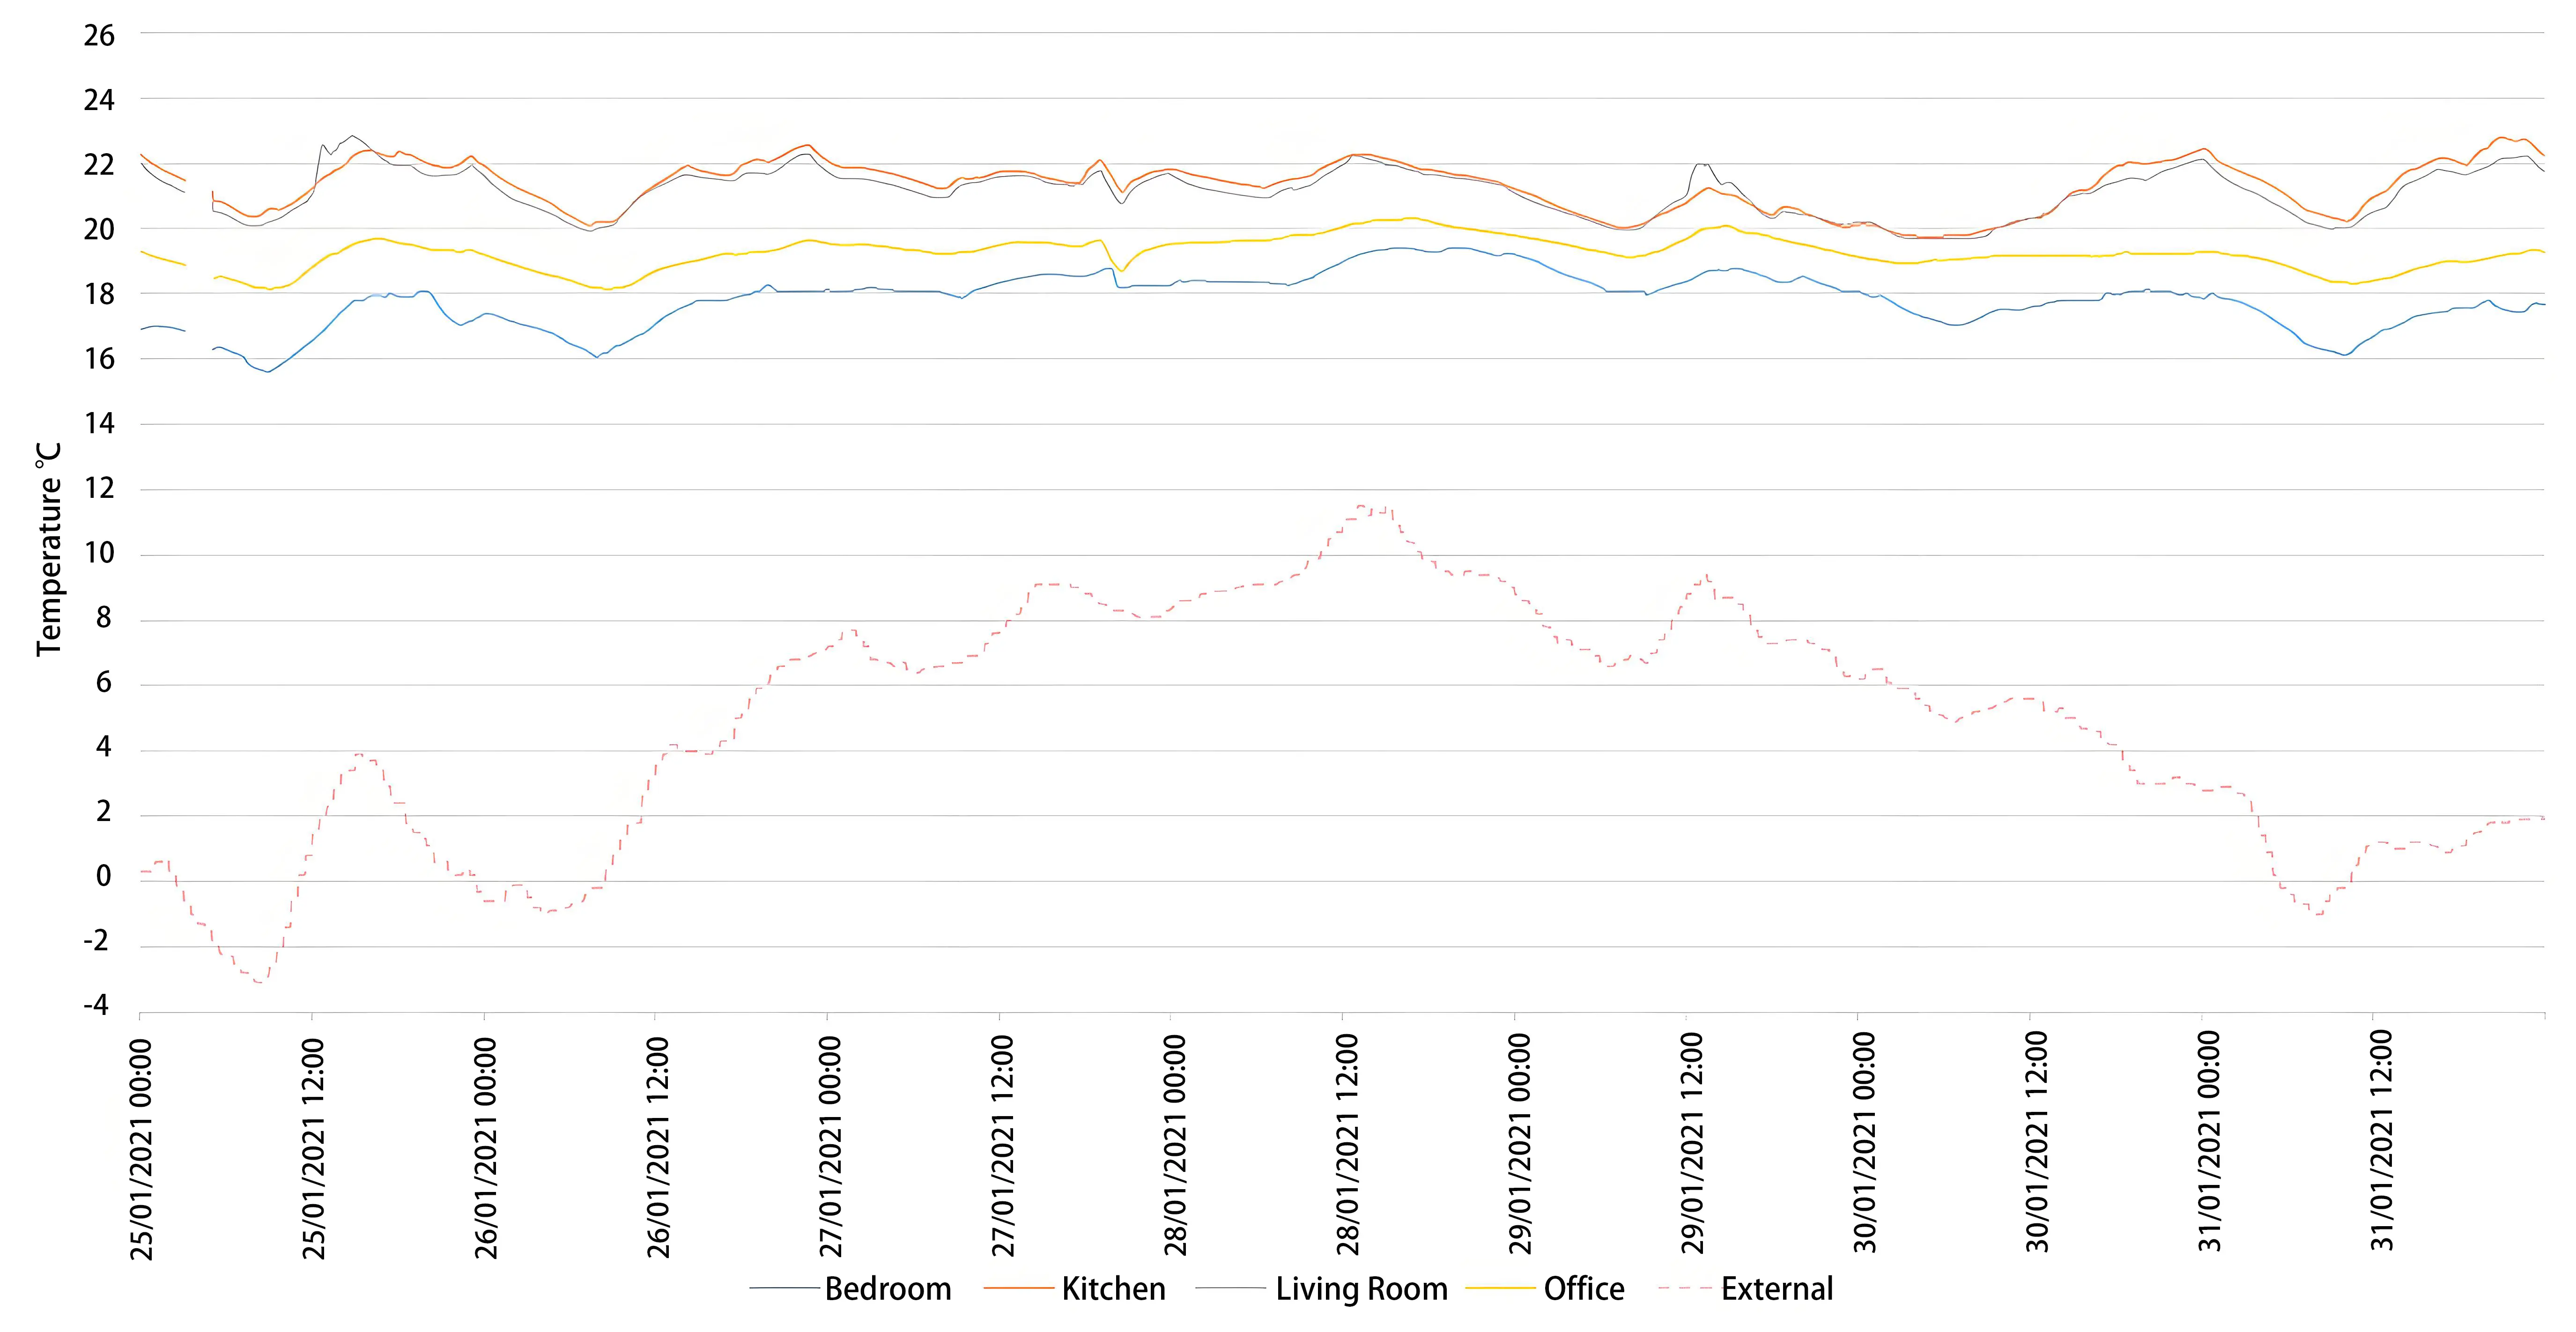
Figure 9. Indoor temperature trend during the winter diary week, plotted against external air temperature.
3.2 Relative humidity
RH was measured to determine whether indoor environmental conditions were maintained within the 40 to 60% RH range, which is generally considered optimal for health and comfort in buildings. Figure 10 presents an overview of the monitored period and shows two extended intervals in the spring and winter seasons when RH remained within this benchmark. During the summer, RH fluctuated considerably, with the bedroom exhibiting the highest levels. In December, January, and February, daily fluctuations were more stable. However, the bedroom and office regularly exceeded the 60% RH benchmark.
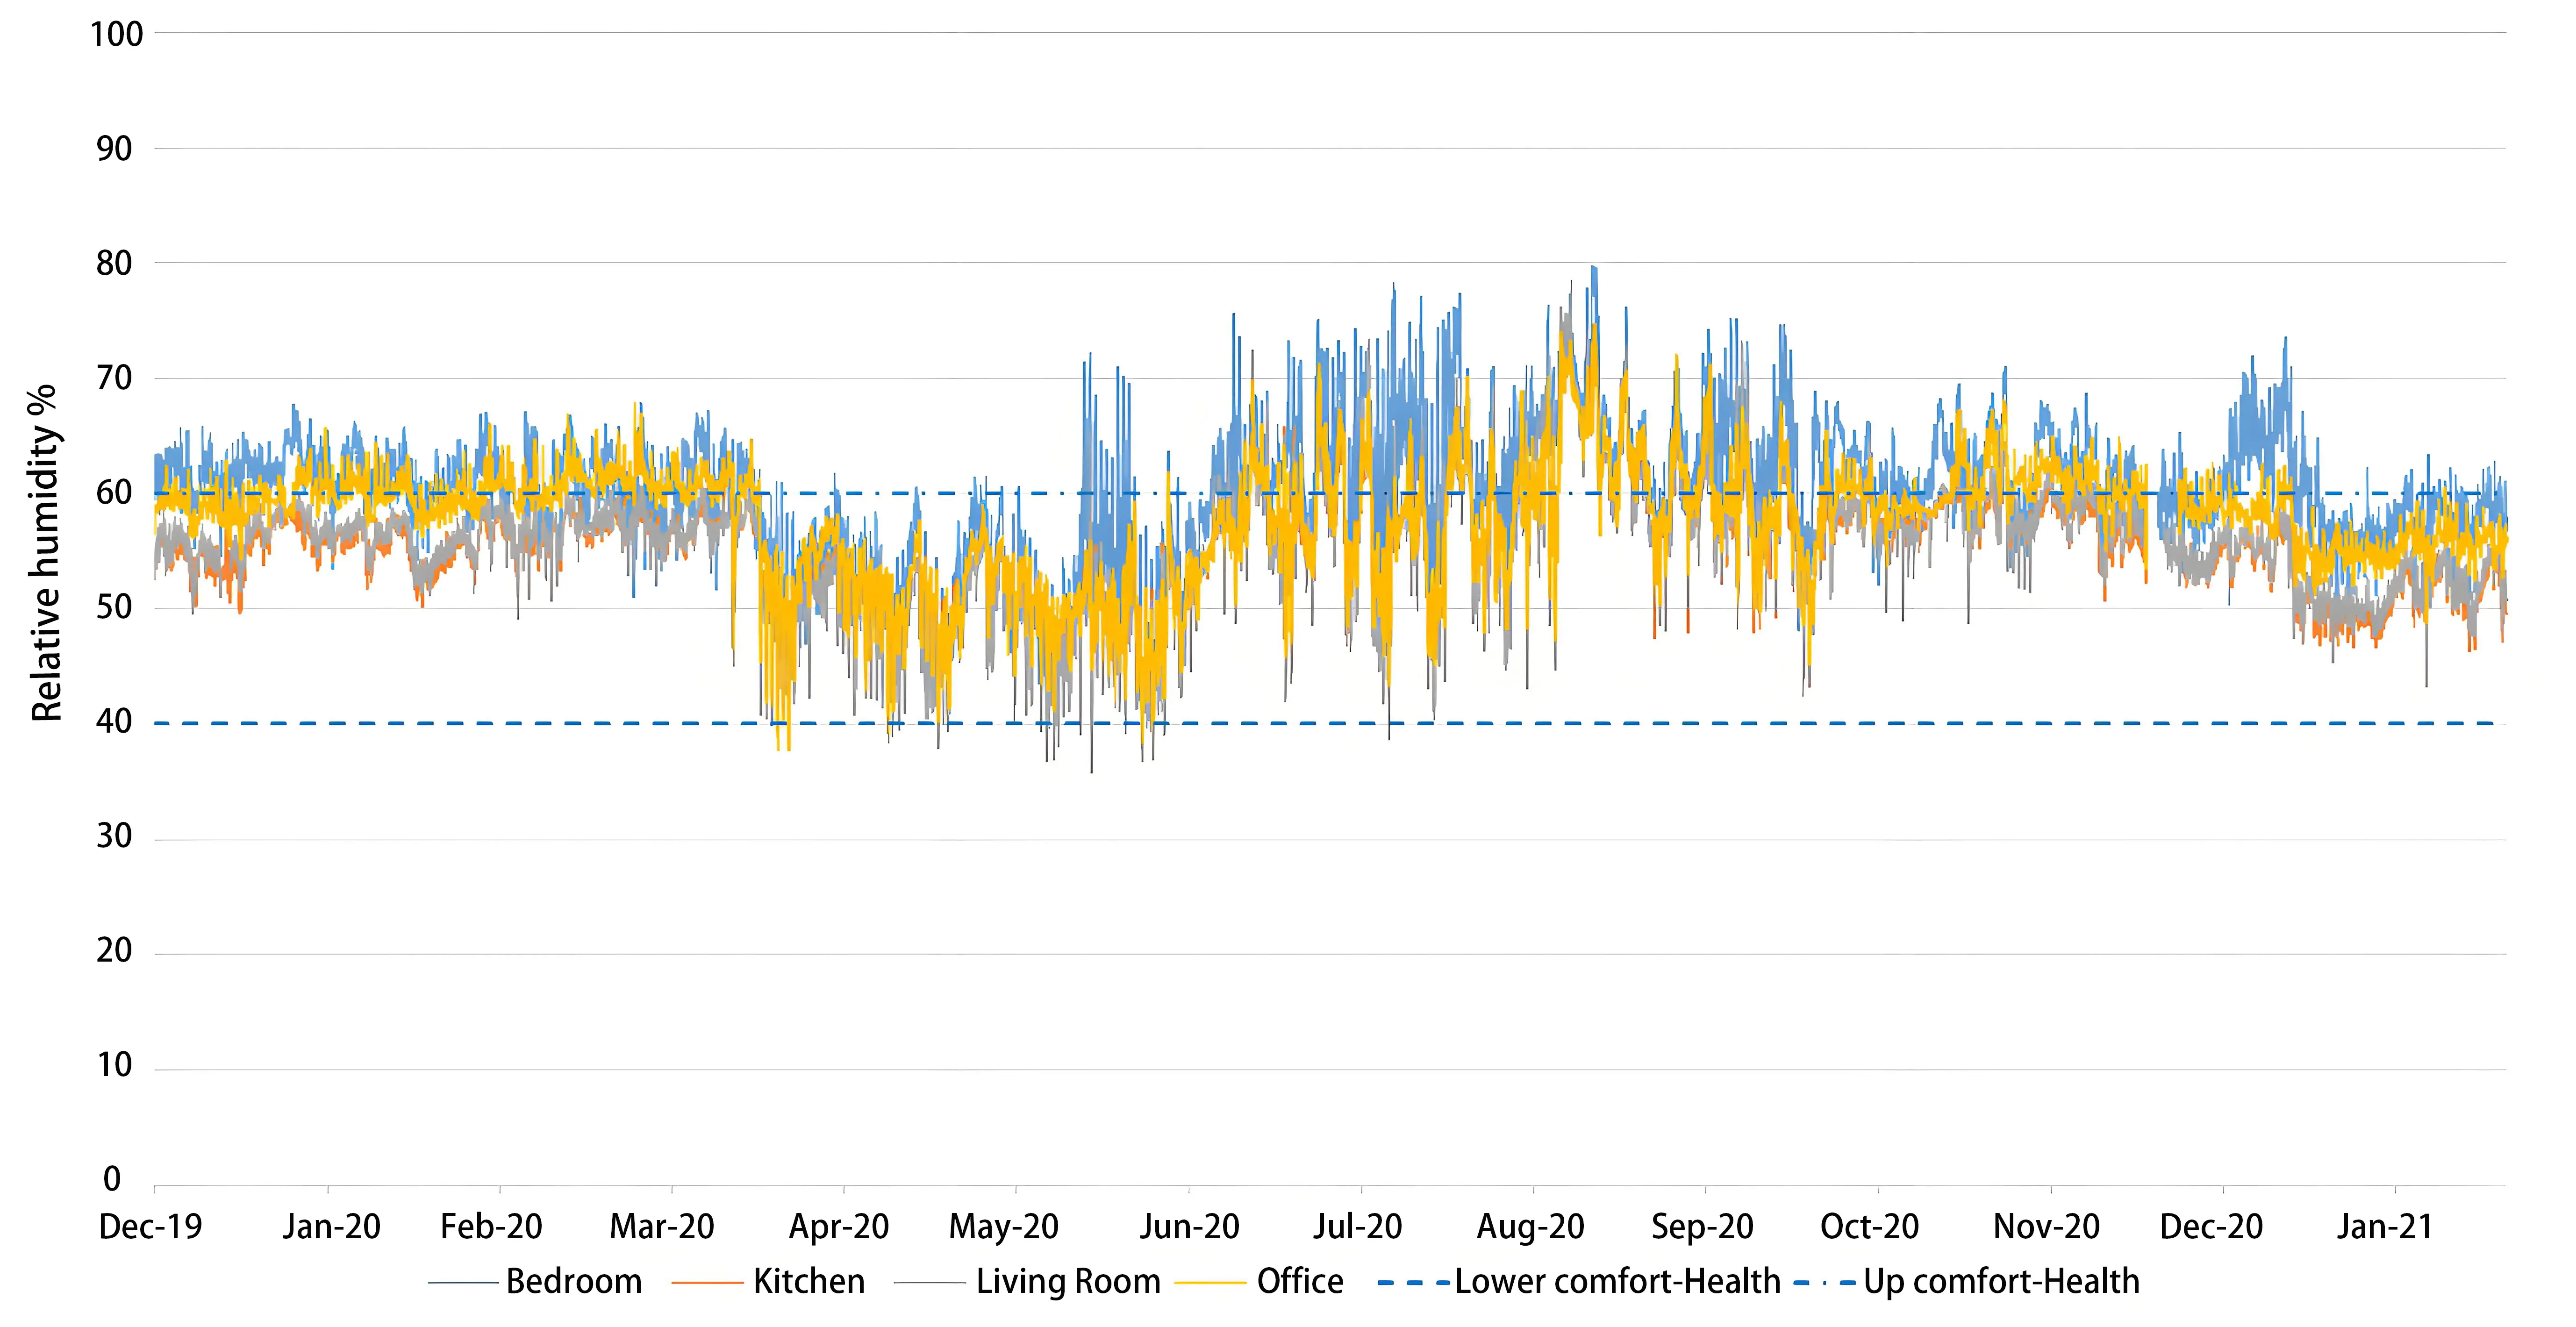
Figure 10. Indoor relative humidity plotted against health thresholds, according to the benchmark criteria.
The summary of RH data in Table 3 indicates that over the entire monitoring period, the mean RH for all monitored rooms remained between 55% and 60%. However, when reviewing the summer week independently, there was a notable increase in mean RH, with all rooms exceeding 60%. Figure 11 shows the summer RH trends, highlighting that although the data mostly remained above 60%, the bedroom RH was relatively stable during this period.
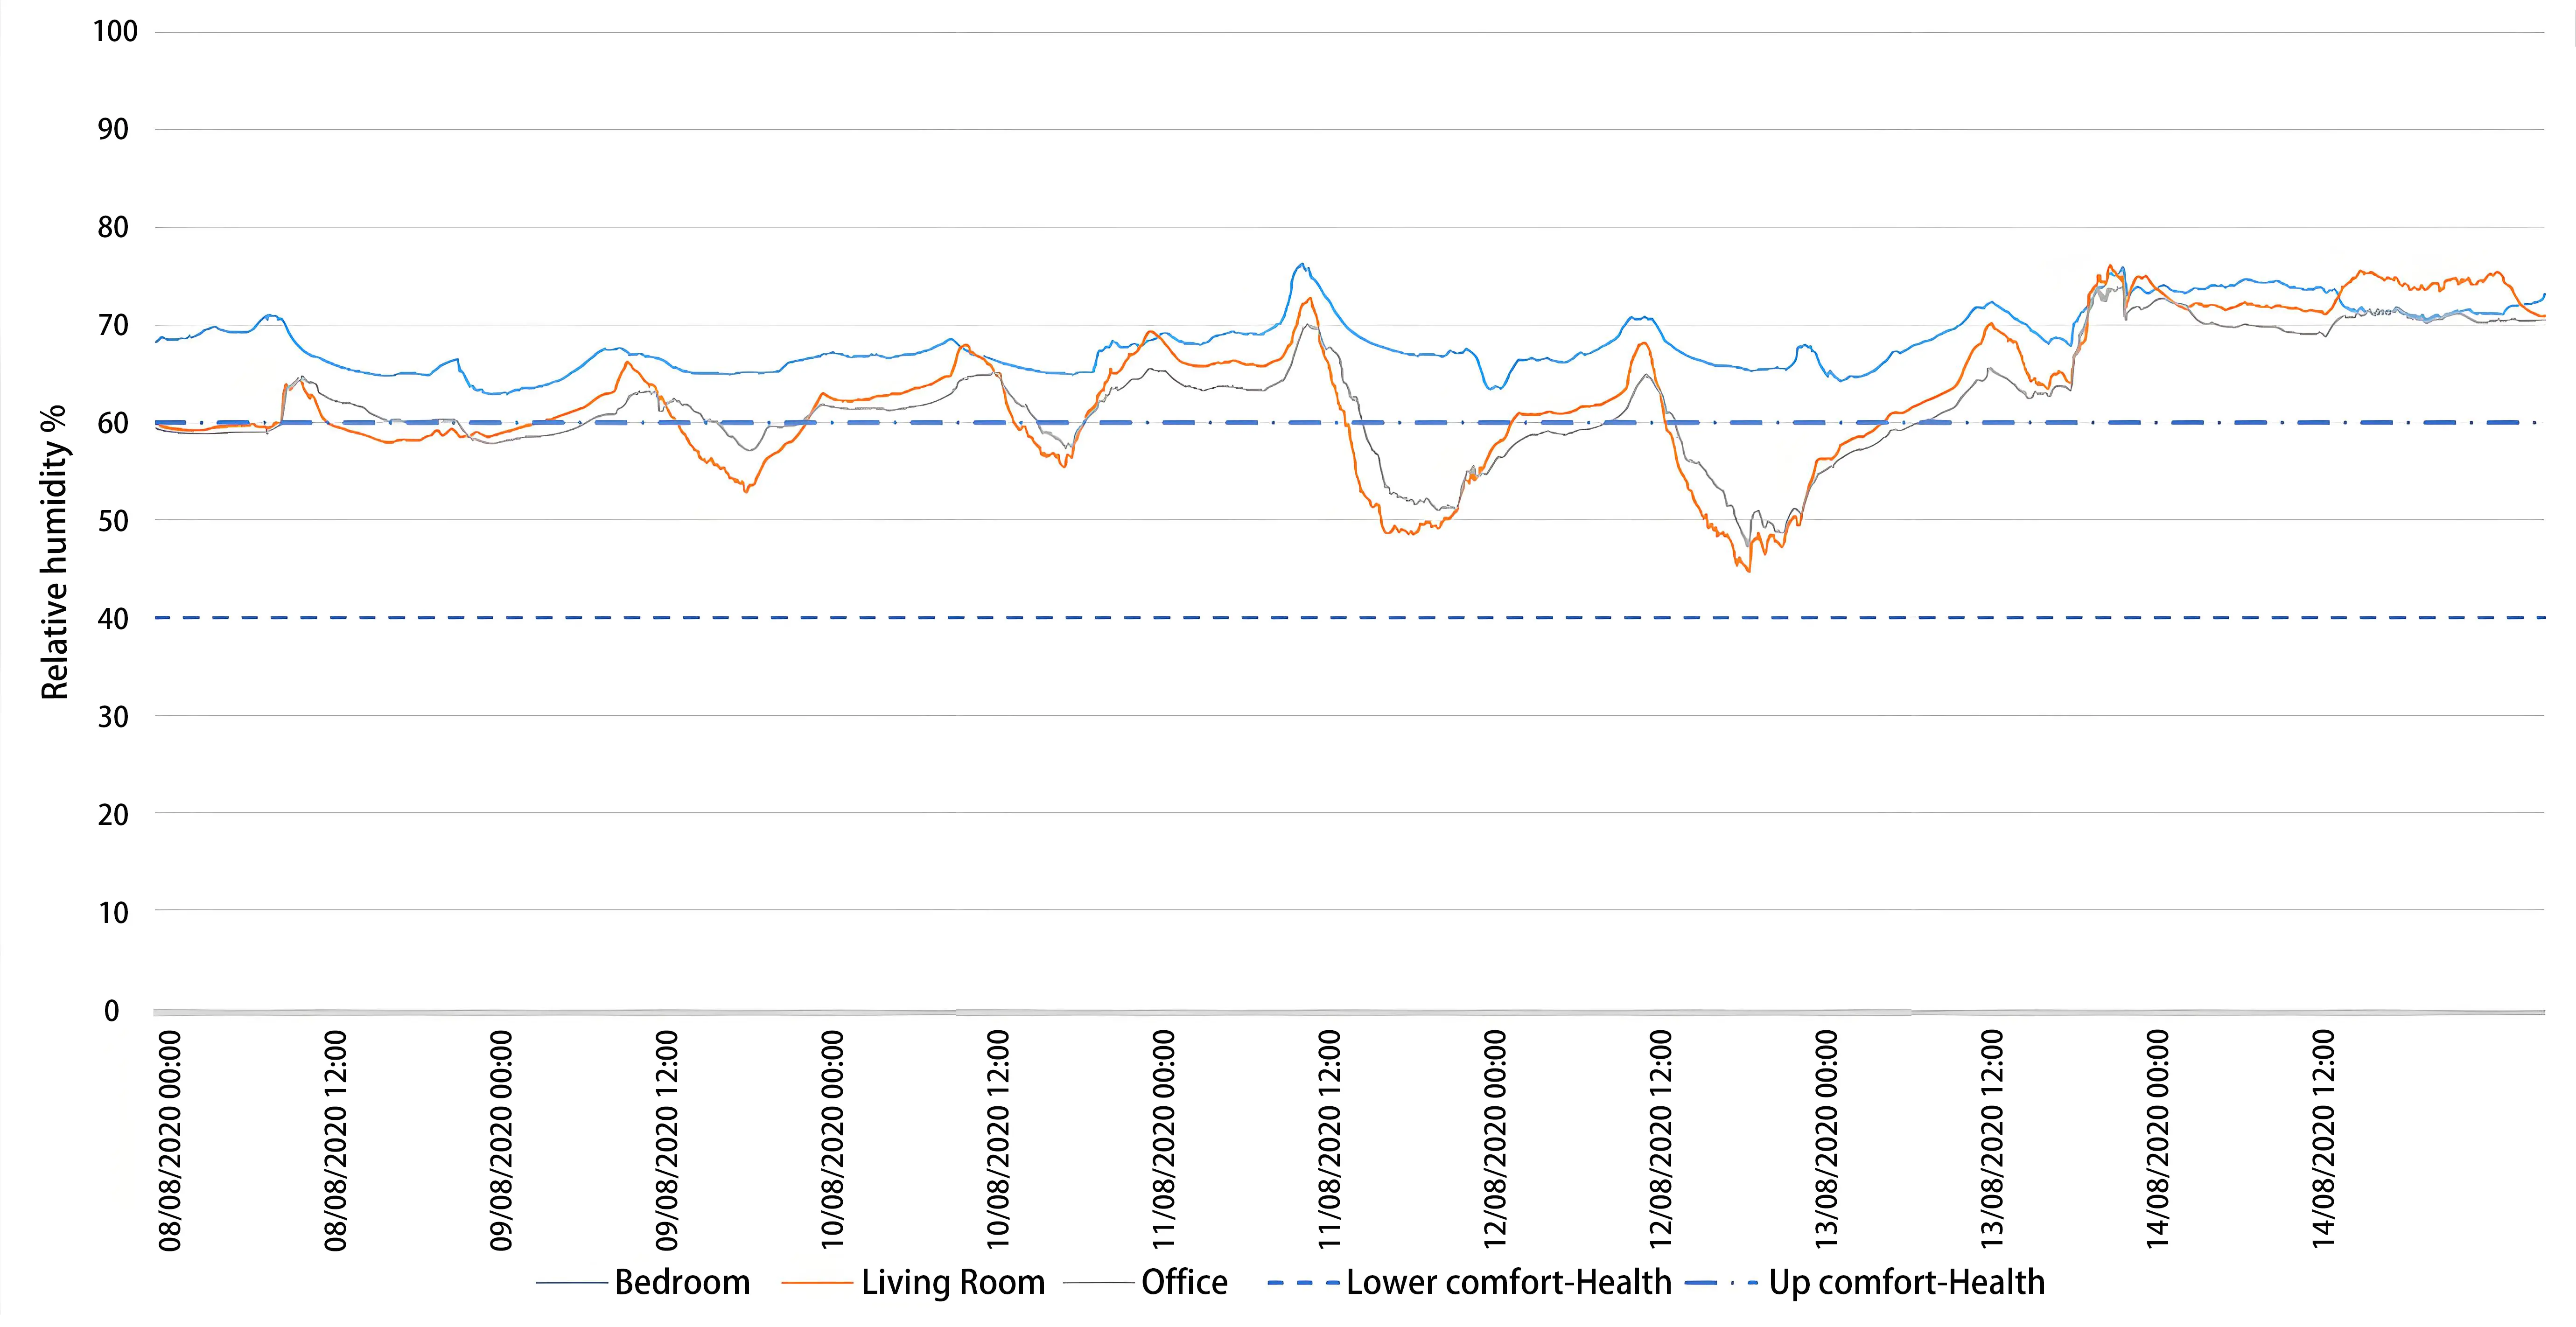
Figure 11. Indoor relative humidity temperature trend during the summer diary week, plotted against health benchmarks.
Table 3. Indoor relative humidity measured in three periods of monitoring (% RH).
| 14-month period | Summer Diary Week | Winter Diary Week | ||||||||||
| Bedroom | Kitchen | Living Room | Office | Bedroom | Kitchen* | Living Room | Office | Bedroom | Kitchen | Living Room | Office | |
| Minimum | 38 | 38 | 36 | 38 | 63 | - | 45 | 47 | 49 | 46 | 47 | 53 |
| Maximum | 80 | 74 | 78 | 75 | 76 | - | 76 | 74 | 63 | 55 | 57 | 59 |
| Standard Deviation | 6 | 4 | 5 | 5 | 3 | - | 7 | 6 | 2 | 2 | 2 | 1 |
| Mean | 60 | 55 | 55 | 58 | 68 | - | 63 | 62 | 58 | 52 | 52 | 56 |
*: Data collection failed during the summer diary period; RH: relative humidity.
In winter, the mean RH was predominantly within the health benchmark (Table 3). Although the bedroom RH exceeded 60%, it remained below 70%—the threshold at which the risk of mould growth and dust mite proliferation increases. Occupant activities such as bathing, cooking, and floor mopping were found not to significantly affect indoor RH. The activity with the most impact was identified as a 2% RH increase in the kitchen during a cooking event using the hob
The data overview indicated that RH in the living room and kitchen mostly remained within the healthy range, while the bedroom and office exceeded the comfort thresholds, as shown in Figure 12.
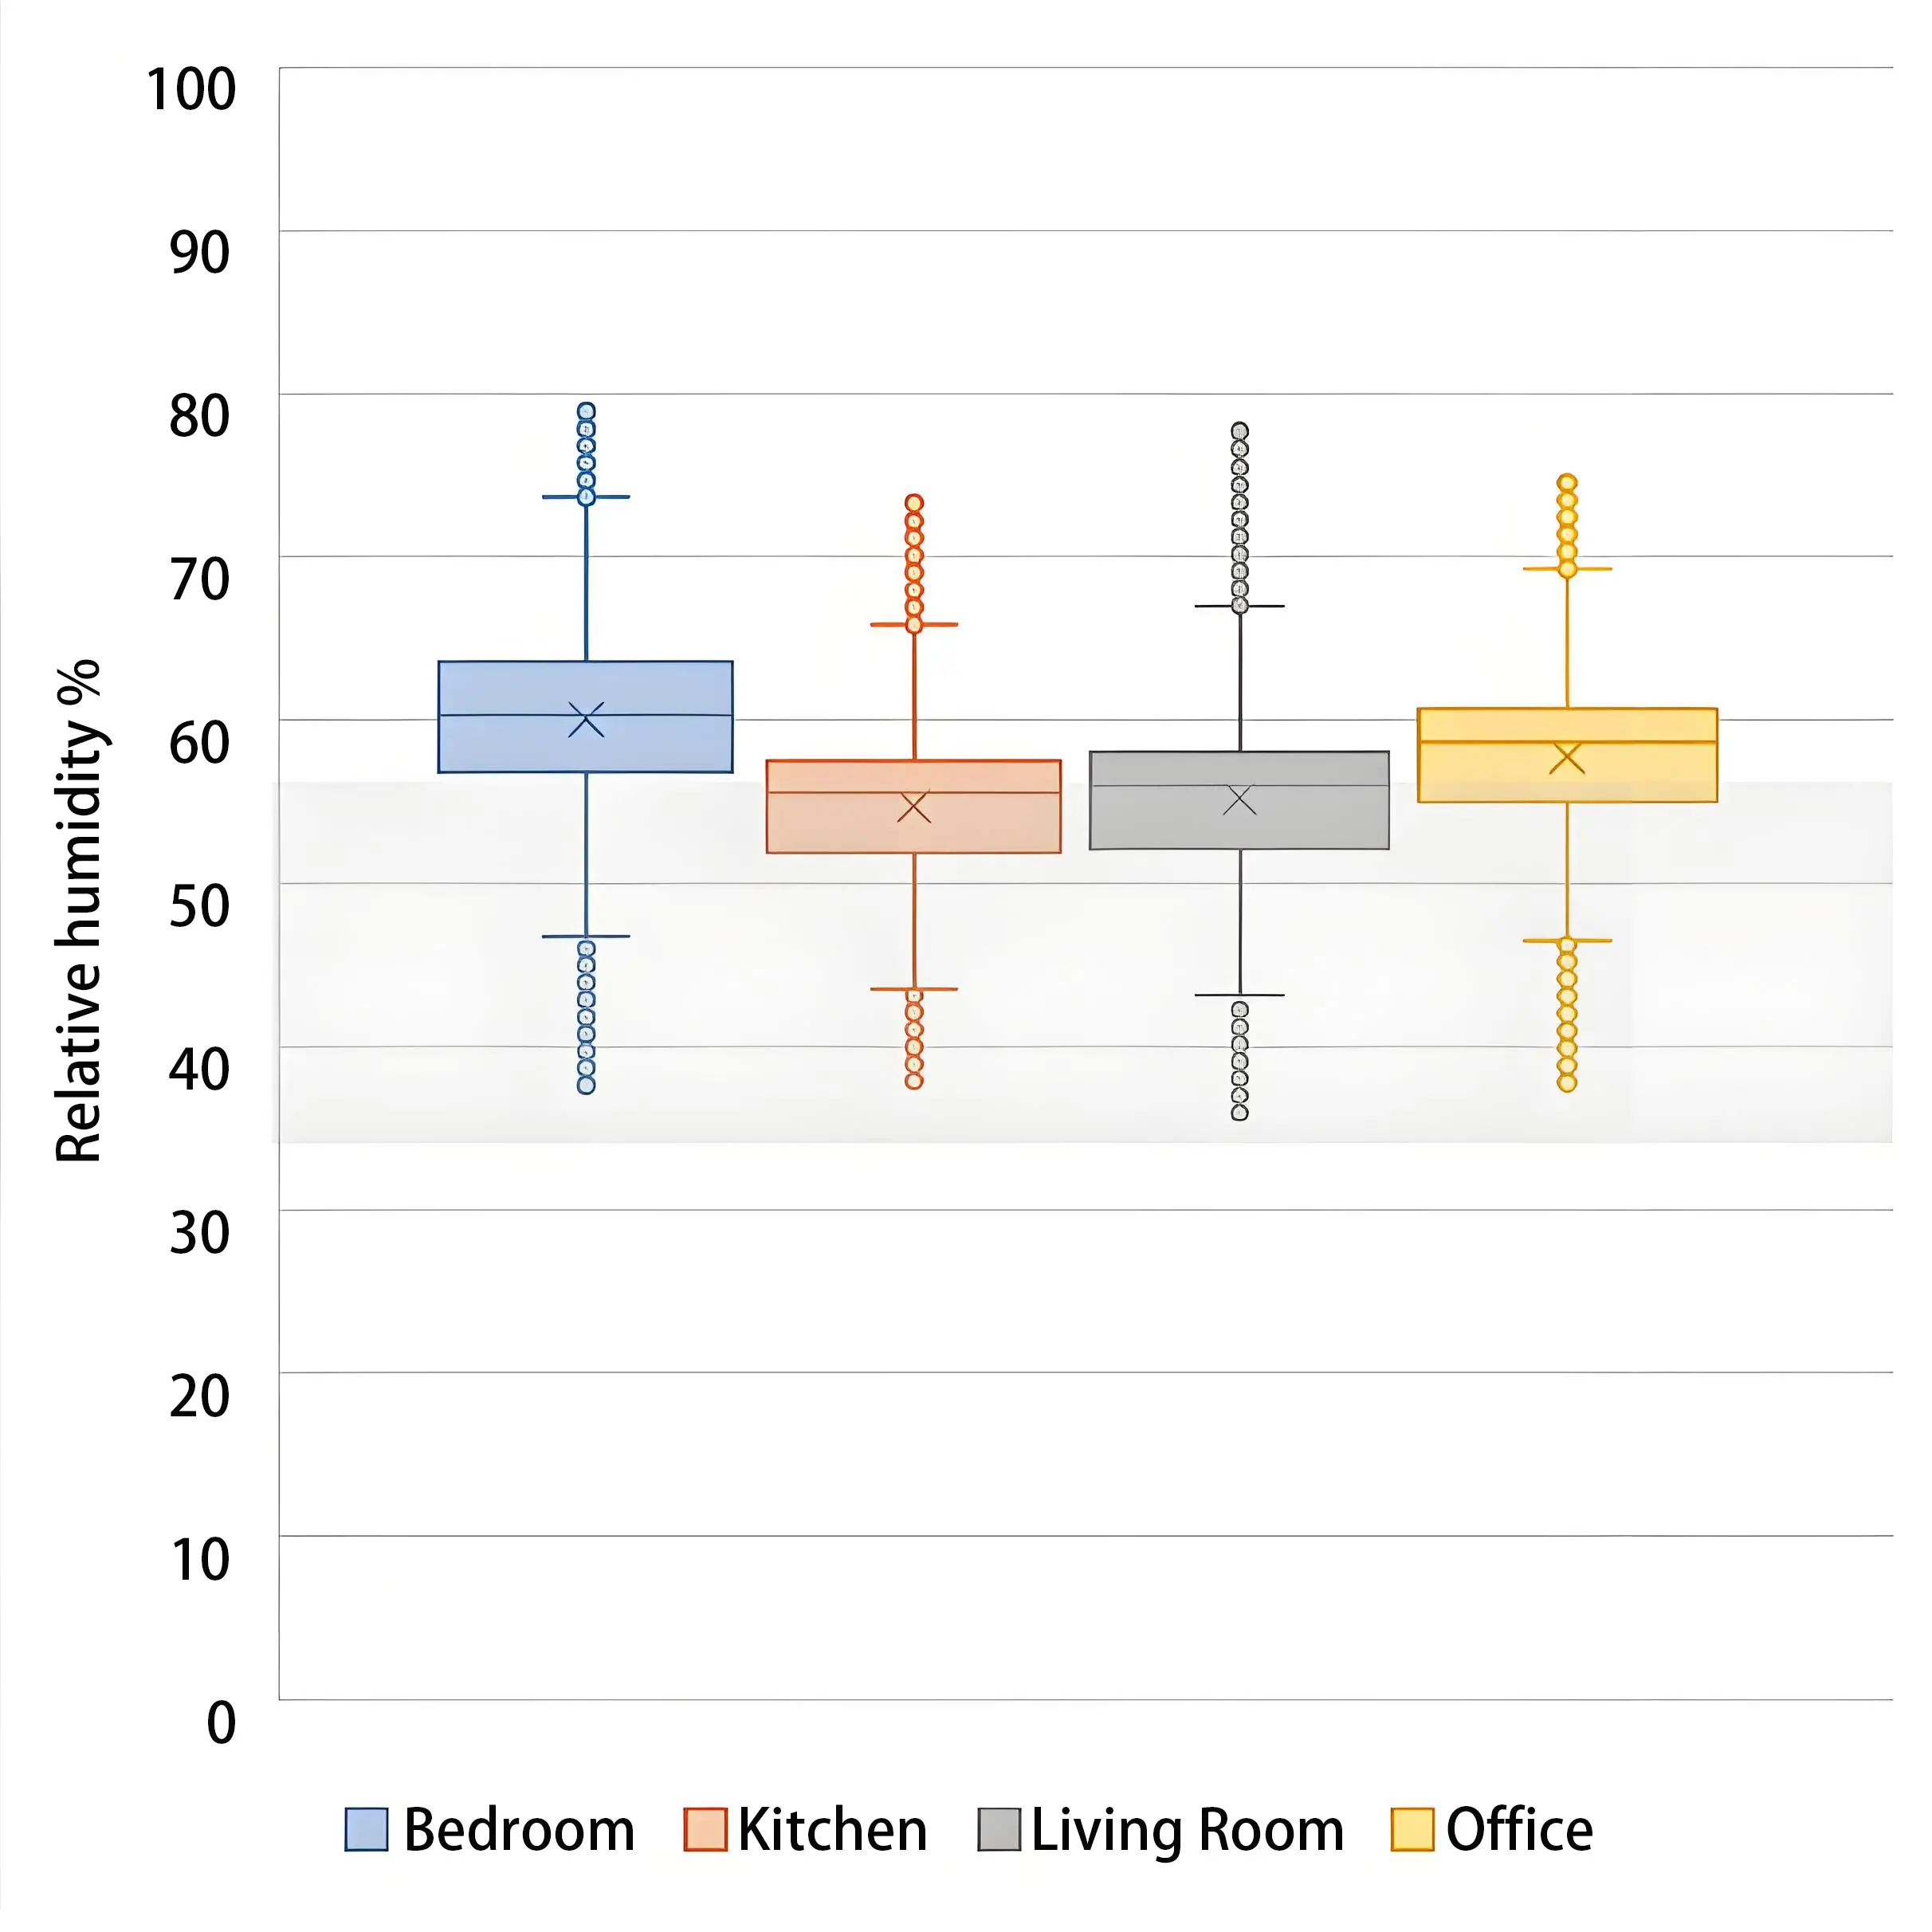
Figure 12. Indoor relative humidity range over 14-months plotted against comfort thresholds.
3.3 Total volatile organic compounds
TVOCs were measured as an indicator of IAQ within the household. The device used detects six common VOCs in indoor air and provides a combined TVOC reading at five-minute intervals. The data were analyzed against a threshold of 300 parts per billion (ppb) and an 8-hour average exposure guideline[46]. The mean TVOC concentrations over the entire monitoring period, presented in Table 4, remained within acceptable limits. However, maximum values indicate that TVOC levels occasionally exceeded the threshold, particularly in the living room and bedroom throughout the monitoring period. The minimum recorded TVOC values across all rooms were 125 ppb, which, although not specified in the manufacturer’s product data sheet, likely reflects the detection limit of the sensing equipment.
Table 4. Indoor total volatile organic compound concentrations measured in three periods of monitoring (ppb).
| 14-month period | Summer Diary Week | Winter Diary Week | ||||||||||
| Bedroom | Kitchen | Living Room | Office | Bedroom | Kitchen* | Living Room | Office | Bedroom | Kitchen | Living Room | Office | |
| Minimum | 125 | 125 | 125 | 125 | 125 | - | 125 | 125 | 125 | 125 | 125 | 125 |
| Maximum | 1858 | 804 | 1860 | 1312 | 905 | - | 1286 | 893 | 812 | 518 | 509 | 313 |
| Standard Deviation | 104 | 69 | 108 | 96 | 103 | - | 176 | 193 | 94 | 45 | 59 | 35 |
| Mean | 217 | 196 | 233 | 201 | 223 | - | 445 | 408 | 204 | 173 | 188 | 160 |
*: Data collection failed during the summer diary period.
Reviewing the week-long diary periods, the data for mean and maximum values during the summer were notably higher compared to the winter data. In particular, the mean values for the living room and office exceeded the threshold. This outcome was unexpected, given that the occupants reported more frequent ventilation of the dwelling through liberal window opening during the summer.
Figure 13 illustrates the trend throughout the monitoring period, showing significant fluctuations in TVOC concentrations over the year. Peak concentrations were more prominent and frequent in the bedroom and home office compared to other rooms. Notably, TVOC levels in the bedroom appeared lower during May, June, July, and August, while peaks in other rooms were higher. The highest peaks in the office occurred from May to October. Peaks in the living room were less frequent, with the highest concentrations coinciding with the warmer months.
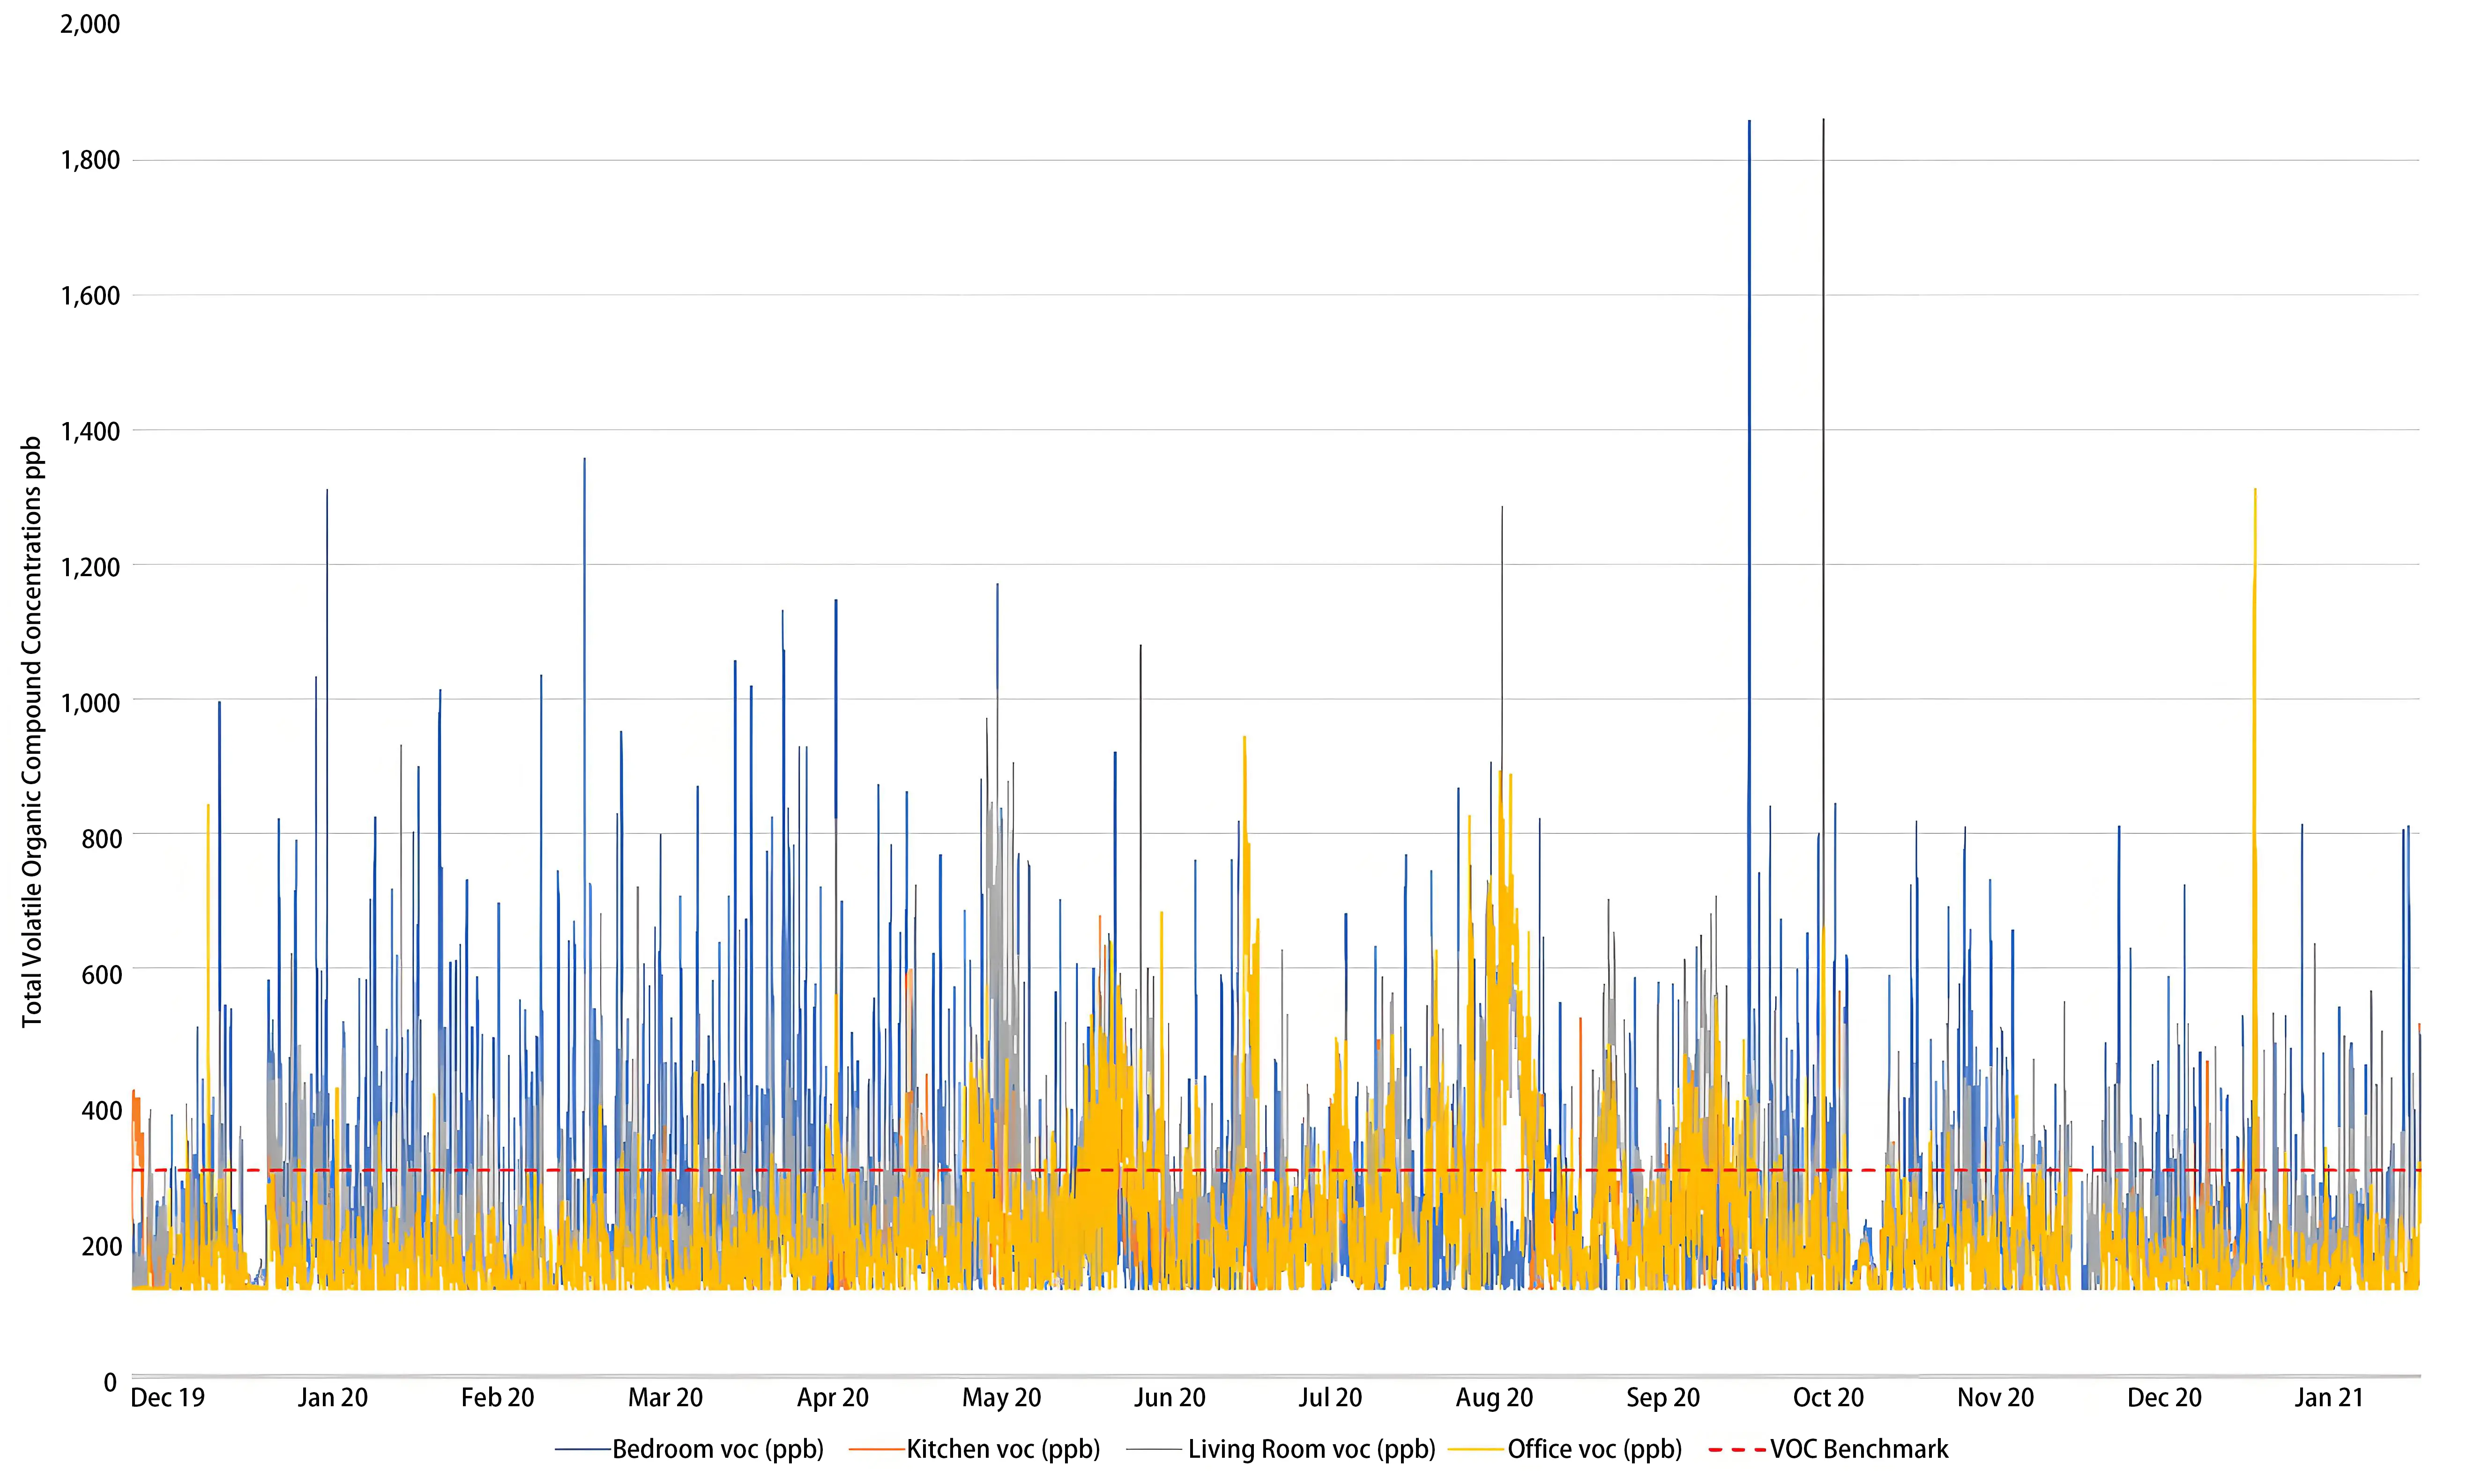
Figure 13. Total volatile organic compounds plotted against the UK building regulations benchmark.
Time-weighted averages were reviewed for three periods representing a typical day, evening, and night. Figure 14 shows that, across the 14-month monitoring period, TVOC concentrations consistently remained below the 300 ppb threshold, indicating acceptable levels despite the peak fluctuations observed in the detailed data. However, notable variations occurred at different times of day. Generally, TVOC levels in all rooms were lowest during the ‘day’ period (8 am to 4 pm), while the ‘evening’ periods consistently exhibited the highest concentrations.
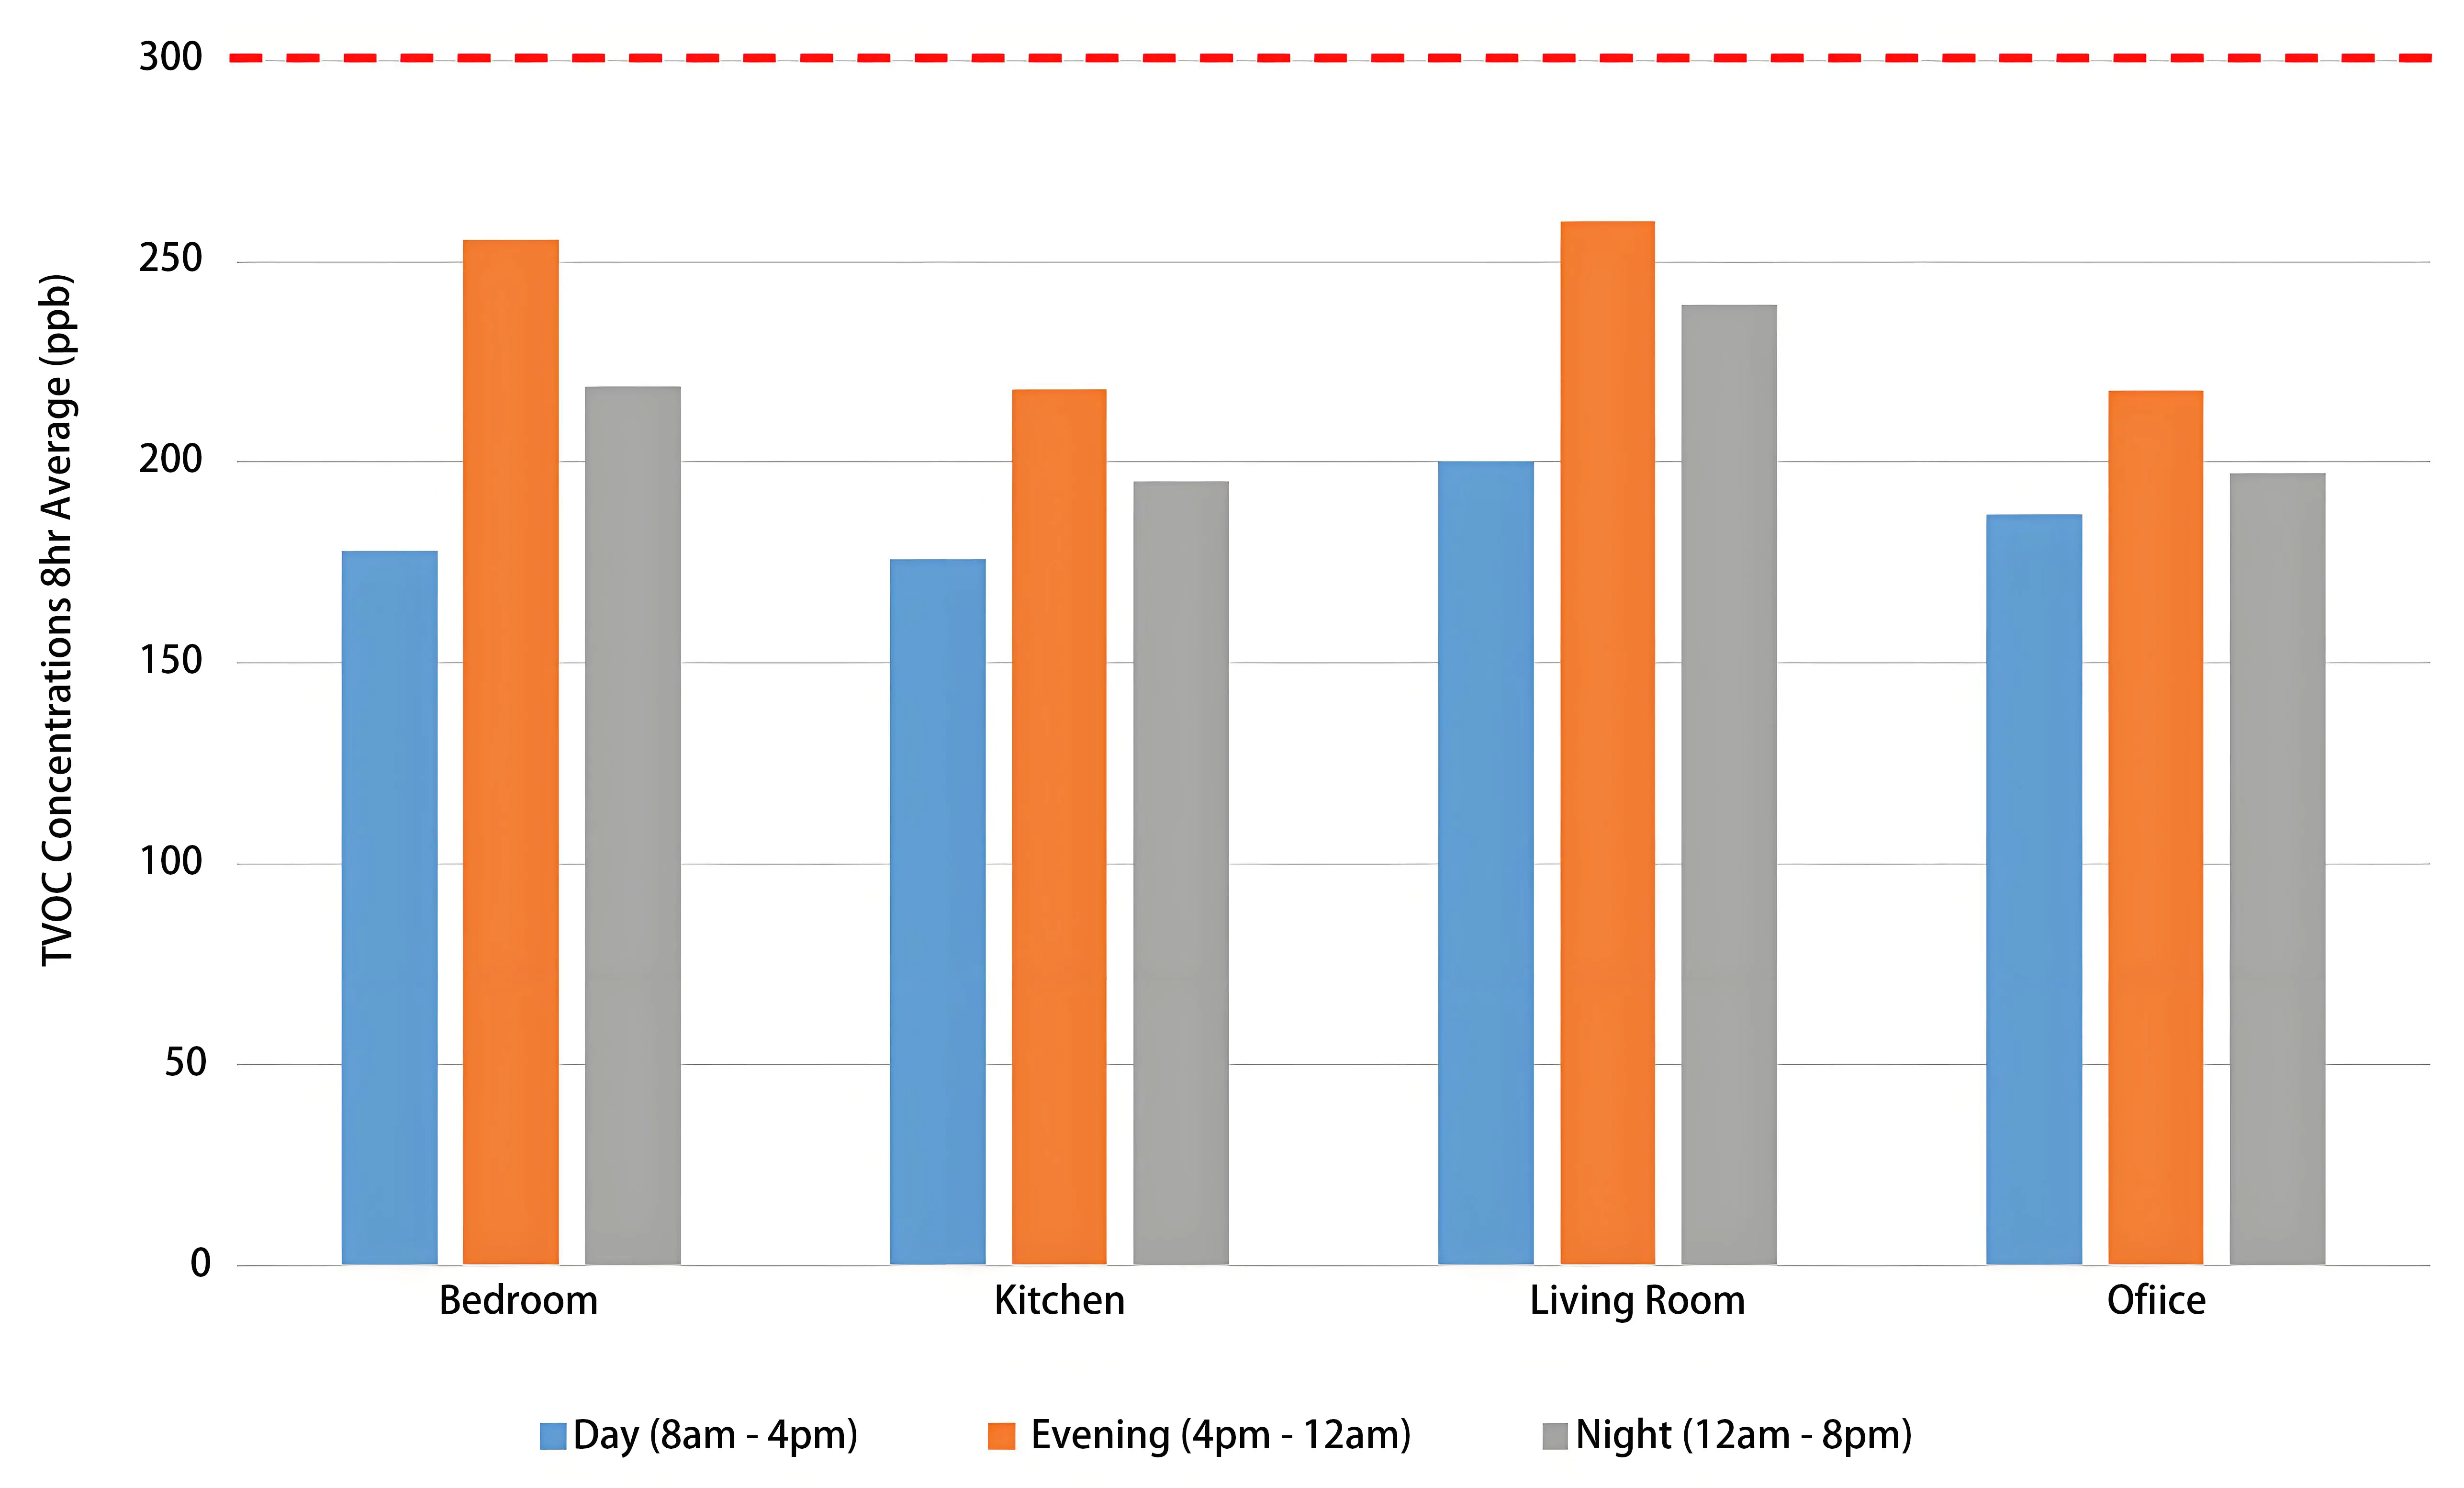
Figure 14. Total volatile organic compounds 8-hour averages over the 14-month monitoring period.
Seasonal time-weighted datasets for summer (Figure 15) and winter (Figure 16) highlight the maximum concentrations recorded. During summer, TVOC levels in the bedroom stayed below 300 ppb, but the threshold was consistently exceeded in the living room and office, with average concentrations increasing during the ‘night’ period to 552 ppb in the living room and 470 ppb in the office.
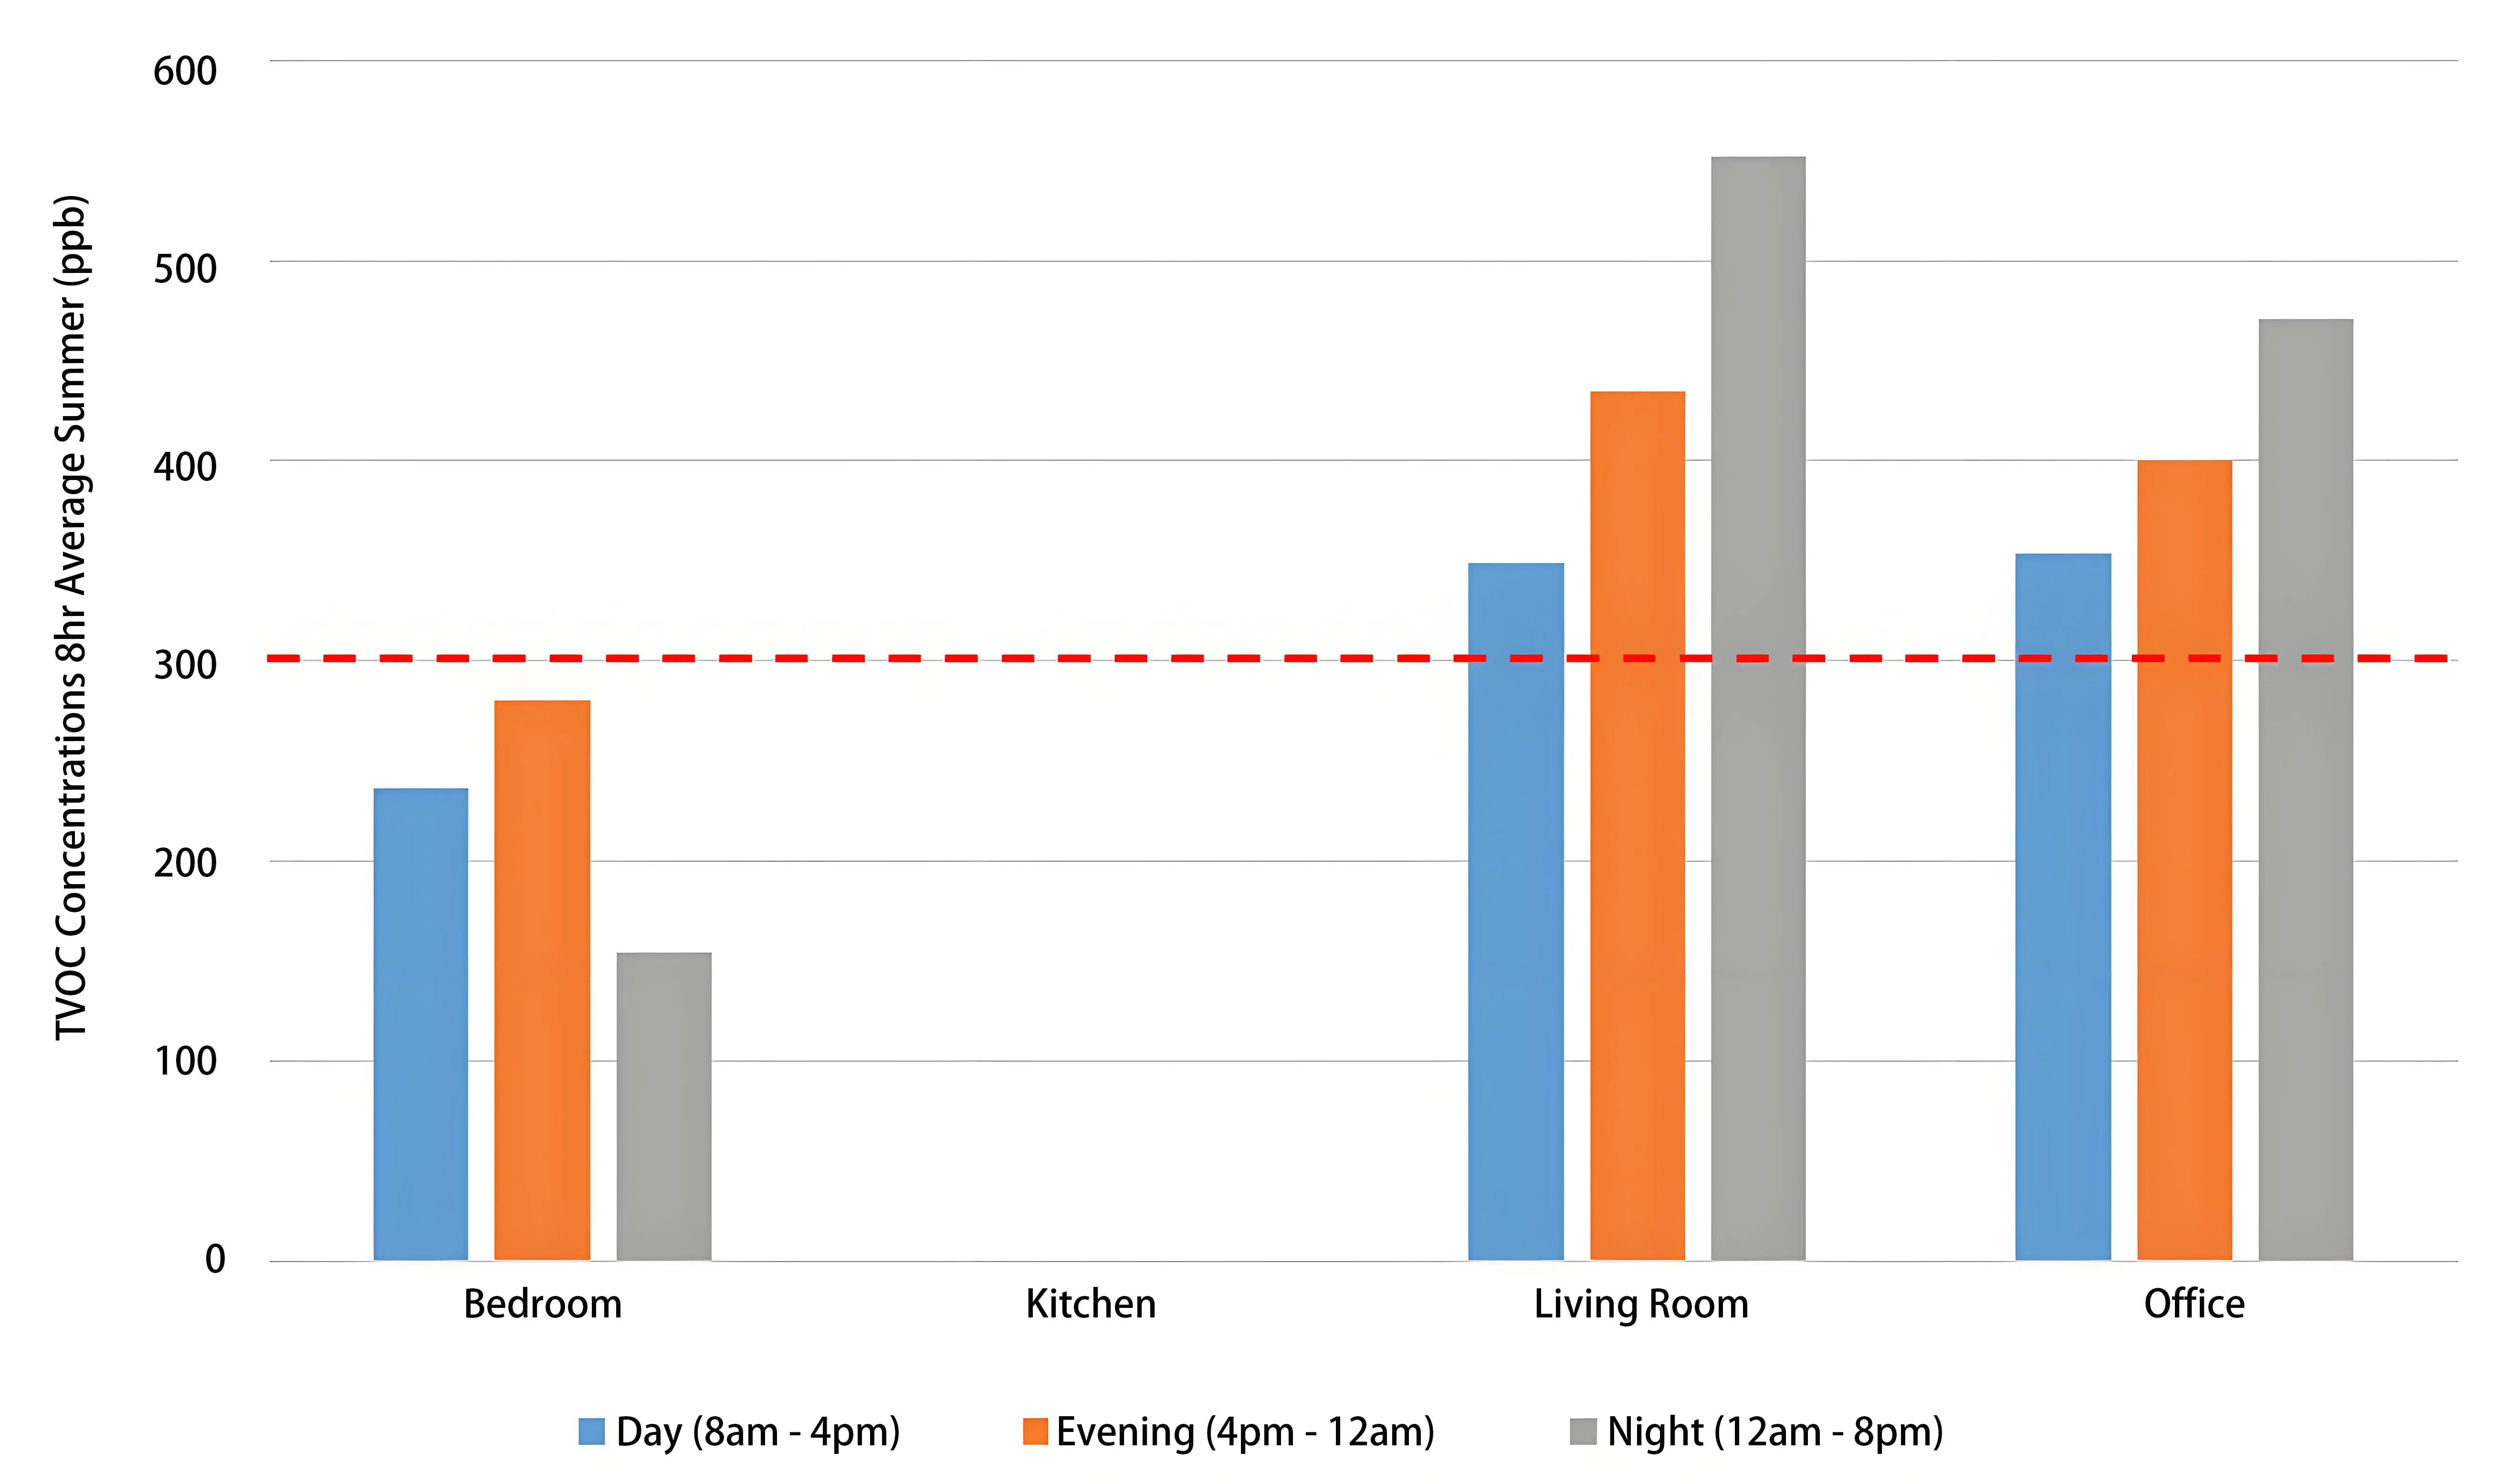
Figure 15. Total volatile organic compounds 8-hour averages over the summer monitoring period.
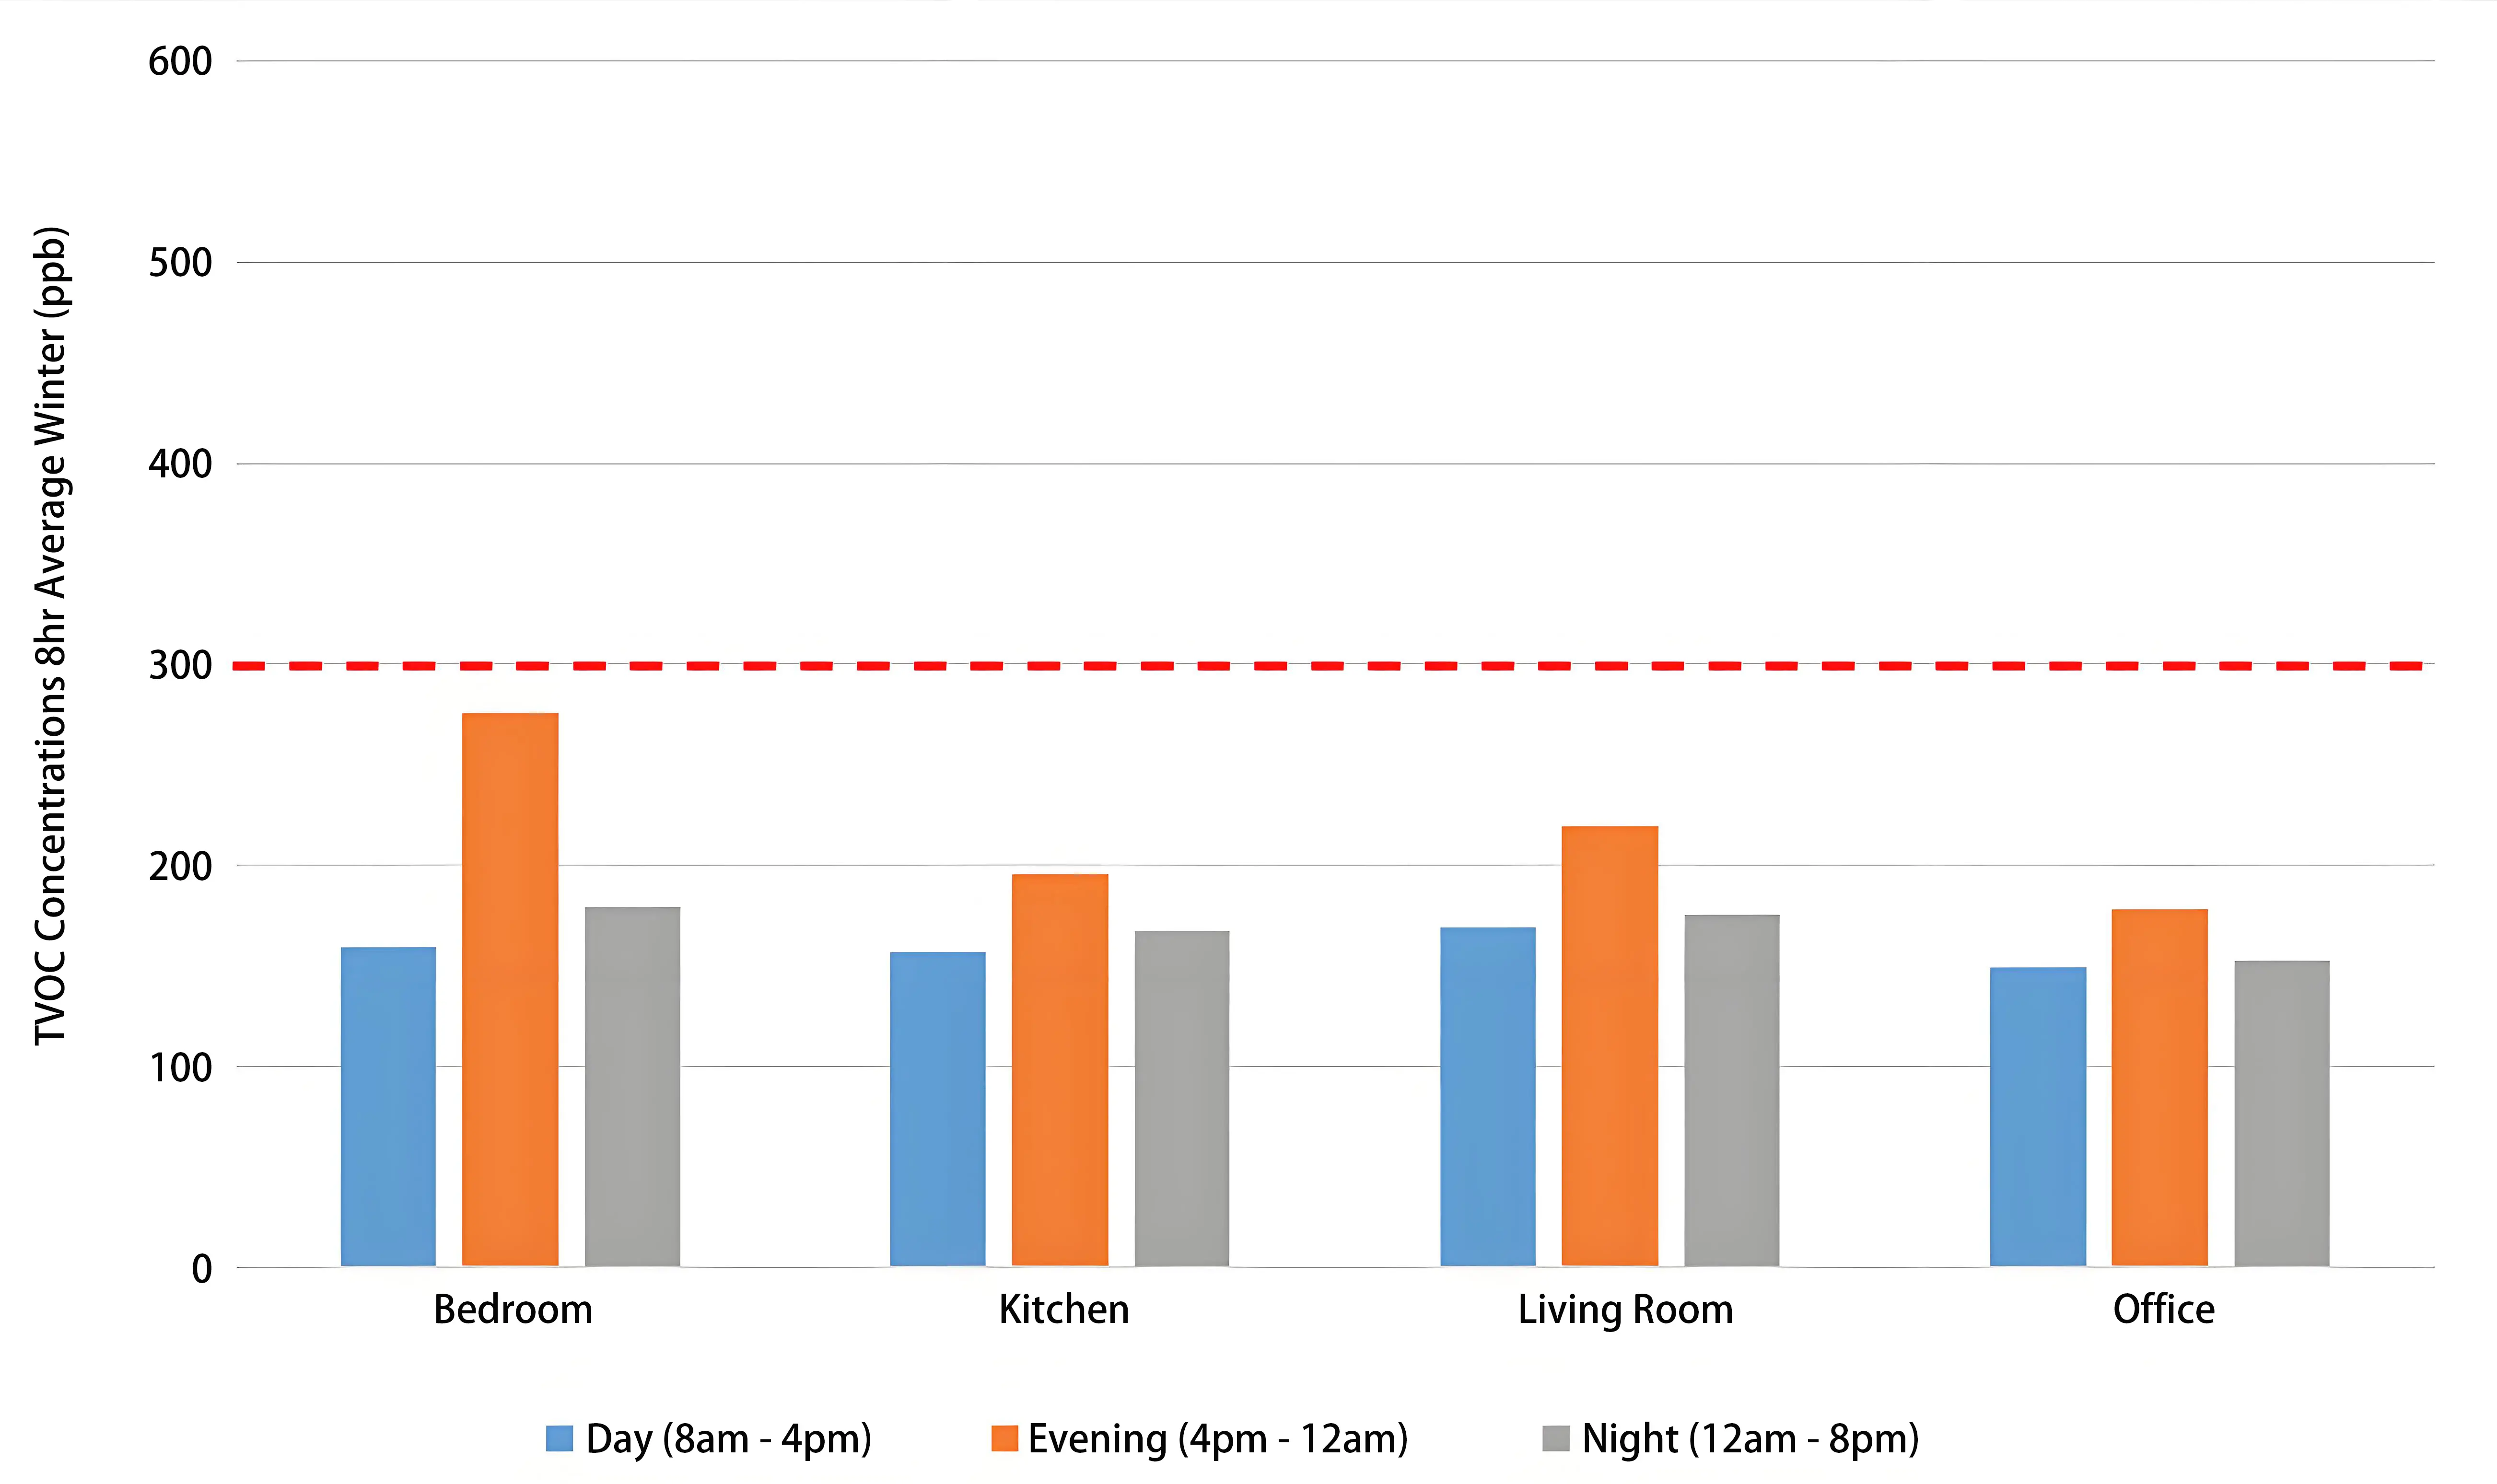
Figure 16. Total volatile organic compounds 8-hour averages over the winter monitoring period.
In contrast, during winter, concentrations remained below the threshold, generally around 200 ppb, except in the bedroom. A slight shift in daily patterns was observed, with the highest concentrations occurring in the ‘evening’ period.
4. Discussion
The findings produced noteworthy results, particularly regarding indoor temperature and TVOC levels. These aspects are discussed further in the following sections.
4.1 Indoor air temperature and ventilation
Indoor air temperatures in four rooms of the straw bale house were measured over 14 months, including detailed analysis of two separate weeks during contrasting summer and winter seasons. The data review showed that in winter, the internal diurnal air temperature variation remained consistently within 2-3 °C, despite significant fluctuations in external temperatures. The occupants reported minimal use of the primary heating system in the office and bathroom. A wood-burning stove was used in the evenings to maintain comfortable indoor temperatures in the living room, kitchen, and bedrooms. The stable indoor temperatures suggest that insulation, passive solar design, and low air permeability contributed to heat retention within the dwelling. These passive measures likely supported occupant thermal comfort while minimizing space heating energy consumption, aligning well with future net-zero emissions targets aimed at improving dwelling energy efficiency.
The summer data indicated no overheating in the home, even during a heatwave event. This outcome contrasts with previous studies highlighting overheating as a significant concern in energy-efficient homes in the UK, particularly for lightweight buildings and rooms located directly beneath a roof[21]. However, although straw bale dwellings possess lightweight characteristics, the findings of this study show stable indoor air temperatures similar to those observed in previous in-situ and simulated research on other lightweight buildings. These studies incorporated design features such as high internal ceiling heights, strategic window placement to promote stack and cross ventilation, and active occupant engagement with ventilation strategies[47].
The dwelling’s floor plan allows for independent ventilation in each room through windows and roof lights. The residents demonstrated a thorough understanding of how to operate this ventilation system, making deliberate choices to adjust the indoor environment according to their comfort preferences. A contrast in indoor temperature conditions was observed between rooms during the summer, with the bedroom maintained at comfortable temperatures. This outcome was partly due to the dwelling’s design but also depended on occupant actions, such as drawing blinds over roof lights and closing windows during the daytime to align with their preference for a cooler sleeping environment. These occupant behaviors for keeping cool are consistent with the recommendations outlined in the Heatwave Plan for England, UK[48]. Although the other rooms did not experience overheating, higher indoor temperatures were recorded, likely due to less occupant adherence to the heatwave plan advice. The occupants noted a reluctance to enclose themselves during the day, preferring to keep living spaces open to the outdoor environment, reflecting typical behaviour during warm weather events in the UK. If similar shading and window management had been applied in the living rooms as in the bedroom, peak indoor temperatures might have been reduced.
Although this case study reports findings from a single dwelling and therefore the results are not generalizable, they contribute to the existing literature and support the view that well-designed homes with high levels of insulation, airtight construction, and carefully planned ventilation strategies do not lead to overheating[49] and can provide comfortable conditions throughout the year. This is particularly important in homes such as this whole life home, where individuals with additional needs reside. The findings suggest that building design and occupant engagement may have a significant influence on reducing overheating. However, further research is needed through expanded in-situ studies that monitor indoor temperatures across multiple rooms, alongside detailed dwelling design factor including building materials, room volumes, occupancy rates, and comprehensive assessments of summer ventilation techniques. Such research would enhance understanding and support the development of policies that promote the adoption of low-energy, airtight homes constructed from sustainable materials, incorporating effective overheating mitigation strategies.
4.2 Total volatile organic compounds
The analysis indicated that TVOC emissions were most prevalent during the summer when indoor air temperatures were highest. This finding supports previous research on TVOC release rates, which showed that peak concentrations occur at higher temperatures[50]. Compared with this study’s findings, research conducted in Italy measured TVOCs over two-week periods in winter, spring, and summer using Foobot sensing equipment[38]. Consistent with the present study, their results showed higher summer TVOC levels than winter, and that summer bedroom TVOC concentrations were lower than those in kitchens. However, the TVOC values recorded in winter in the straw bale case study house were significantly lower than those recorded in the two homes from the Italian study. Notably, the Italian research did not disclose the building materials of their case study homes, so no clear associations can be made regarding the origins of TVOC emissions. Therefore, it remains unclear whether TVOC concentrations are lower in houses constructed from low-emitting building materials. Understanding whether emission characteristics of materials influence TVOC levels in winter is important since windows are more likely to be closed during this season. This is significant due to potential health implications associated with increased off-gassing in mainstream homes built using conventional synthetic materials, which may release VOCs at higher rates compared to straw bale buildings[27,29].
The fact that the occupant reported the home was well-ventilated in summer is noteworthy given the higher TVOC concentrations at that time. In the living room and office, TVOC rates were highest overnight, particularly between midnight and 8 am. In contrast, the occupied bedroom, maintained at a cooler temperature, showed the lowest overnight TVOC levels. This suggests temperature influences emission rates. Ventilation rates may also affect indoor TVOC accumulation, since windows in rooms with peak TVOC levels were likely closed at those times. The lower winter TVOC concentrations may also be related to temperature, as indoor temperatures were typically lower in this season. Additionally, RH was slightly lower in winter, which could reduce off-gassing of moisture-bound VOCs. Therefore, understanding VOC concentration dynamics relative to temperature and ventilation requires targeted research that assesses VOCs in relation to time of day, room occupancy, room volume, ventilation rates, building materials, and outdoor weather data. These factors are essential to identify indoor pollutant patterns and reduce occupant exposure risks.
A limitation of this study aspect was the inability to conduct air sampling for individual VOC identification through laboratory testing. Moreover, the lack of indoor CO2 concentration data means there is insufficient evidence to confirm that open windows and roof lights provided adequate air changes. This highlights the need for detailed indoor CO2 monitoring and individual VOC assessments, as emphasized in a previous study aiming to establish health-based VOC guidelines for the UK[28]. Advancing knowledge in this area can clarify whether elevated indoor summer VOCs result from increased material volatility, occupant-generated pollutants, outdoor pollutant ingress, or inadequate air exchange due to external weather conditions such as reduced wind pressure and minimal indoor-to-outdoor temperature differences. Reducing exposure to indoor VOCs is important to limit potential health effects on occupants. Symptoms can include respiratory issues, headaches, skin conditions, and a range of other complaints associated with poor indoor air quality, which is recognized as a leading contributory factor to ill health[51].
The floor area of the home, at 255 m2, may be considered relatively large and potentially influenced the results. However, this home is only slightly larger than a typical new detached four-bedroom home in the UK, which has an average floor area of 233 m2[52]. This case study home includes a separate utility room and an office, which could potentially serve as a fifth bedroom. It could therefore be argued that the floor area is representative of this housing typology. The generous ceiling heights likely contributed to the outcomes, as they enabled thermal stratification as well as cross and stack ventilation throughout all rooms in the house. The positive results of this study support previous literature discussing comfortable thermal conditions in other straw bale houses. However, overheating assessments in earlier studies often lack reference to critical design factors such as ceiling heights, shading strategies, construction materials, and floor area, all of which could influence IEQ outcomes. As such, a unified framework for future in-situ domestic overheating studies is needed to ensure that all research assesses and reviews the same criteria through comprehensive evaluations. This would ultimately support the industry in bridging the energy performance gap while creating healthy indoor environments. Such an approach may improve our understanding of how design factors can mitigate overheating without relying on energy-intensive technical interventions, especially since super insulation and airtightness are fundamental elements for reducing operational CO2 emissions in UK dwellings.
5. Conclusion
This study aimed to assess the IEQ of a case study straw bale house located in the south of England. Data were collected over a fourteen-month period, with the analysis encompassing an evaluation of seasonal indoor conditions. The findings indicated that generally good mean IEQ was maintained when assessed against recognised benchmarks for temperature, RH, and TVOCs. Notably, the analysis confirmed the absence of overheating throughout the monitoring period. This outcome can be attributed to several key features of the dwelling: airtight construction, high levels of insulation, the use of low-VOC-emitting materials, and a ventilation strategy that combined decentralised mechanical and natural ventilation techniques. Positive outcomes were also associated with active occupant engagement, including the effective use of passive design strategies, such as cross and stack ventilation, secure night-time ventilation, and solar shading in the bedrooms. However, the elevated TVOC levels observed during the summer months were unexpected and warrant further investigation.
Research on internal conditions in sustainable housing is increasingly relevant in today’s climate. The results of this study challenge the prevailing assumption that all new well-insulated and airtight dwellings in southern UK experience overheating. However, given the complexity of this issue, with numerous variables influencing indoor IEQ, comprehensive standards for building performance evaluations are needed to ensure researchers adopt a unified assessment methodology. Overheating assessments should incorporate information that improves understanding of overall dwelling design, seasonal performance, occupant behaviour, and their interaction with indoor environmental controls. Further comparative research between sustainable and conventional housing is essential. If evidence increasingly supports the benefits of sustainable buildings, industry upskilling will be necessary. An upskilled workforce would facilitate the wider adoption of sustainable construction materials, especially since currently “most builders aren’t interested in stacking and plastering bales with the attendant labor costs, re-training, and sourcing issues common with site built straw bale walls”[53].
Acknowledgements
The researchers would like to express gratitude to the actors who made this research possible. This includes Sam Foster Architects the architect, straw bale builder Barbara Jones of Straw Works Ltd and the Straw Works team; and last but not least, the occupants, the Harris family, for their assistance with the monitoring, diary keeping, and for making this research possible.
Authors contribution
Foster JA: Conception, investigation, study methodology, analysis, writing and editing.
Musau F: Study methodology, critical review and editing.
Conflict of interest
The authors declare no conflicts of interest.
Ethical approval
The homeowner contacted the researchers directly to initiate the study; therefore, ethical approval was not required for this research project. However, the authors conducted the research in accordance with their institutional ethics guidelines, ensuring that the homeowner was fully informed about the procedures involved prior to the commencement of in-situ monitoring.
Consent to participate
The occupants of the household consented to participate in the research and were fully informed about the study’s purpose, procedures and benefits before consenting to participate.
Consent for publication
Not applicable.
Availability of data and materials
Not applicable.
Funding
None.
Copyright
© The Author(s) 2025.
References
-
1. Wang R. The research on differences and policies of housing provision in UK cities before and after the WWII. Curr Urban Stud. 2022;10:718-739.
[DOI] -
2. Vagtholm R, Matteo A, Vand B, Tupenaite L. Evolution and current state of building materials, construction methods, and building regulations in the U. K.: Implications for sustainable building practices. 2023;13(6):1480.
[DOI] -
3. Tazmeen T, Mir FQ. Sustainability through materials: A review of green options in construction. Results Surf Interfaces. 2024;14:100206.
[DOI] -
4. UK Department for Business, Energy & Industrial Strategy. Annex: 2019 UK greenhouse gas emissions, final figures by end user and fuel type [Internet]. London: UK Government; 2021 [cited 2022 May 24]. Available from: https://assets.publishing.service.gov.uk/attachment_data.pdf
-
5. Rowe G, Rankl F, House of Commons Library. Housing and net zero [Internet]. London: UK Parliament; 2024 [cited 2025 May 19]. Available from: https://researchbriefings.files.parliament.uk
-
6. HM Government, Department for Business, Energy & Industrial Strategy (BEIS). Net Zero Strategy: Build back greener [Internet]. London: HM Government; 2021 [cited 2025 Jun 18]. Available from: https://www.gov.uk/government/publications/net-zero-strategy
-
7. Cousins S. ‘Part Z’ embodied carbon cap tabled by industry group [Internet]. 2021 [cited 2025 May 19]. Available from: https://www.ribaj.com/products/part-z-embodied-carbon-building-regulations-fcbs-whole-life-carbon-network
-
8. Rimbalová J, Vilcekova S, Estokova A. Indoor and outdoor air quality monitoring in hemp house—Case study. Pollack Period. 2011;6(3):63-72.
[DOI] -
9. Buzatu R, Muntean D, Ungureanu V, Ciutina A, Gireada M, Vitan D. Holistic energy efficient design approach to sustainable building using monitored energy management system. IOP Conf Ser: Earth Environ Sci. 2021;664:012037.
[DOI] -
10. Gondal IA, Athar MS, Khurram M. Role of passive design and alternative energy in building energy optimization. Indoor Built Environ. 2021;30:278-289.
[DOI] -
11. Marincioni V, Bradshaw F. A long-term monitoring study on the thermal comfort and durability of a straw bale Passivhaus cottage. In: Ooka R, editor. The 11th International Conference on Indoor Air Quality, Ventilation & Energy Conservation in Buildings (IAQVEC2023); 2023 May 20-23; Tokyo, Japan. France: EDP Sciences; 2023.
[DOI] -
12. Sun C, Gu J, Dong Q, Qu D, Chang W, Yin X. Are straw bales better insulation materials for constructions? A review. Dev Built Environ. 2023;15:100209.
[DOI] -
13. Lawrence M. Reducing the environmental impact of construction by using renewable materials. J Renew Mater. 2015;3(3):163-174.
[DOI] -
14. Jones B. Building with Straw Bales: A practical guide for the UK and Ireland. 2nd ed. London: Green Book Publishing Ltd; 2009.
-
15. Peng H. Structural characteristics of load bearing straw bale construction [dissertation]. Bath (UK): University of Bath; 2024 [cited 2025 May 19]. Available from: https://purehost.bath.ac.uk.pdf
-
16. D’Alessandro F, Bianchi F, Baldinelli G, Rotili A, Schiavoni S. Straw bale constructions: Laboratory, in field and numerical assessment of energy and environmental performance. J Build Eng. 2017;11:56-68.
[DOI] -
17. Koh CH, Kraniotis D. A review of material properties and performance of straw bale as building material. Constr Build Mater. 2020;259:120385.
[DOI] -
18. Ashour T, Georg H, Wu W. Performance of straw bale wall: A case of study. Energy Build. 2011;43(8):1960-1967.
[DOI] -
19. Gallegos-Ortega R, Magaña-Guzmán T, Reyes-López JA, Romero-Hernández MS. Thermal behavior of a straw bale building from data obtained in situ. A case in Northwestern México. Build Environ. 2017;124:336-341.
[DOI] -
20. Erens B, Williams L, Exley J, Ettelt S, Manacorda T, Hajat S, et al. Public attitudes to, and behaviours taken during, hot weather by vulnerable groups: results from a national survey in England. BMC Public Health. 2021;21:1-11.
[DOI] -
21. Lomas KJ, Porritt SM. Overheating in buildings: lessons from research. Build Res Inf. 2017;45(1-2):1-18.
[DOI] -
22. NICE. NICE guideline: Indoor air quality at home [Internet]. London: National Institute for Health and Care Excellence (NICE); 2020. Available from: https://www.nice.org.uk/guidance/ng149
-
23. Beizaee A, Lomas KJ, Firth SK. National survey of summertime temperatures and overheating risk in English homes. Build Environ. 2013;65:1-17.
[DOI] -
24. Bone A, Murray V, Myers I, Dengel A, Crump D. Will drivers for home energy efficiency harm occupant health? Perspect Public Health. 2010;130:233-238.
[DOI] -
25. Mulville M, Stravoravdis S. The impact of regulations on overheating risk in dwellings. Build Res Inf. 2016;44:520-534.
[DOI] -
26. Drury P, Watson S, Lomas KJ. Summertime overheating in UK homes: is there a safe haven? Build Cities. 2021;2(1):970-990.
[DOI] -
27. Persson J, Wang T, Hagberg J. Indoor air quality of newly built low-energy preschools-are chemical emissions reduced in houses with eco-labelled building materials? Indoor Built Environ. 2019;28:506-519.
[DOI] -
28. Shrubsole C, Dimitroulopoulou S, Foxall K, Gadeberg B, Doutsi A. IAQ guidelines for selected volatile organic compounds (VOCs) in the UK. Build Environ. 2019;165:106382.
[DOI] -
29. National Academies of Sciences, Engineering, and Medicine. Why Indoor Chemistry Matters. Washington: The National Academies Press; 2022.
[DOI] -
30. Institute of Air Quality Management. Indoor air quality guidance: assessment, monitoring, modelling and mitigation [Internet]. London: Institute of Air Quality Management; 2021. Available from: https://iaqm.co.uk/wp-content/uploads/2013/02/iaqm_indoorairquality.pdf
-
31. Bluyssen PM, De Richemont S, Crump D, Maupetit F, Witterseh T, Gajdos P. Actions to reduce the impact of construction products on indoor air: Outcomes of the European project healthy air. Indoor Built Environ. 2010;19(3):327-339.
[DOI] -
32. Bhoonah R, Maury-Micolier A, Jolliet O. Integrated empirical and modelled determination of the human health impacts of building material VOCs. Build Environ. 2023;242:110523.
[DOI] -
33. Nakanishi EY, Poulin P, Blanchet P, Dubuis ME, Drouin M, Rhéaume C, et al. A systematic review of the implications of construction materials on occupants’ physical and psychological health. Build Environ. 2024;257:111527.
[DOI] -
34. Kotzias D. Built environment and indoor air quality: The case of volatile organic compounds. AIMS Environ Sci. 2021;8(2):135-147.
[DOI] -
35. Xiong J, Wei W, Huang S, Zhang Y. Association between the emission rate and temperature for chemical pollutants in building materials: General correlation and understanding. Environ Sci Technol. 2013;47:8540-8547.
[DOI] -
36. MET Office. Climate averages for Southampton (1991–2020) [Internet]. Exeter: Met Office. Available from: https://www.metoffice.gov.uk/research/climate/maps-and-data/uk-climate-averages/gcp1844rg
-
37. Manibusan S, Mainelis G. Performance of four consumer-grade air pollution measurement devices in different residences. Aerosol Air Qual Res. 2020;20:217-230.
[DOI] -
38. Pietrogrande MC, Casari L, Demaria G, Russo M. Indoor Air Quality in Domestic Environments during Periods Close to Italian COVID-19 Lockdown. Int J Environ Res Public Health. 2021;18(8):4060.
[DOI] -
39. Moreno-Rangel A, Sharpe T, Musau F, McGill G. Field evaluation of a low-cost indoor air quality monitor to quantify exposure to pollutants in residential environments. J Sens Sens Syst. 2018;7(1):373-388.
[DOI] -
40. Butcher KJ. Environmental design: Guide A. 7th ed. London: CIBSE; 2006.
-
41. Chartered Institution of Building Services Engineers (CIBSE). The limits of thermal comfort: avoiding overheating in European buildings. CIBSE TM52. London: CIBSE; 2013. p. 1-25.
-
42. Southampton Weather. Daily/monthly weather history from Southampton Weather Station [Internet]. Available from: https://www.southamptonweather.co.uk/wxhistory.php?date=202008
-
43. Chartered Institution of Building Services Engineers (CIBSE). TM59 design methodology for the assessment of overheating risk in homes [Internet]. London: CIBSE; 2017. Available from: https://www.cibse.org/knowledge-research/knowledge-portal/technical-memorandum-59-design-methodology-for-the-assessment-of-overheating-risk-in-homes
-
44. Arundel AV, Sterling EM, Biggin JH, Sterling TD. Indirect health effects of relative humidity in indoor environments. Environ Health Perspect. 1986;65:351-361.
[DOI] -
45. Chartered Institution of Building Services Engineers (CIBSE). Guide A: Environmental design [Internet]. London: CIBSE; 2021. Available from: https://www.cibse.org/knowledge-research/knowledge-portal/guide-a-environmental-design-2015-updated-2021-pdf/
-
46. UK Department for Communities and Local Government. Approved Document F: Ventilation (Volume 1: Dwellings) [Internet]. 2021 [cited 2024 Nov 21]. Available from: https://assets.publishing.service.gov.uk.pdf
-
47. Adekunle TO, Nikolopoulou M. Thermal comfort, summertime temperatures and overheating in prefabricated timber housing. Build Environ. 2016;103:21-35.
[DOI] -
48. UK Health Security Agency. Heatwave plan for England: protecting health and reducing harm from severe heat and heatwaves [Internet]. London: UK Health Security Agency; 2022. Available from: https://www.cibse.org/knowledge-research/knowledge-portal/guide-a-environmental-design-2015-updated-2021-pdf/
-
49. Sassi P. Thermal comfort and indoor air quality in super-insulated housing with natural and decentralized ventilation systems in the south of the UK. Archit Sci Rev. 2017;60(3):167-179.
[DOI] -
50. Haghighat F, De Bellis L. Material emission rates: Literature review, and the impact of indoor air temperature and relative humidity. Build Environ. 1998;33(5):261-277.
[DOI] -
51. RCPCH and Royal College of Physicians. The inside story: Health effects of indoor air quality on children and young people [Internet]. London: Royal College of Paediatrics and Child Health; 2020. Available from: https://www.rcpch.ac.uk/sites/default/files/generated-pdf/document/The-inside-story%253A-Health-effects-of-indoor-air-quality-on-children-and-young-people.pdf
-
52. Ministry of Housing, Communities & Local Government. Floor space in English homes: Main report [Internet]. 2018. Available from: https://www.gov.uk/government/publications/floor-space-in-english-homes
-
53. Magwood C. Carbon smart straw bale structural insulated panels. Green Builder [Internet]. 2016. Available from: https://www.greenbuildermedia.com/blog/carbon-smart-straw-bale-structural-insulated-panels
Copyright
© The Author(s) 2025. This is an Open Access article licensed under a Creative Commons Attribution 4.0 International License (https://creativecommons.org/licenses/by/4.0/), which permits unrestricted use, sharing, adaptation, distribution and reproduction in any medium or format, for any purpose, even commercially, as long as you give appropriate credit to the original author(s) and the source, provide a link to the Creative Commons license, and indicate if changes were made.
Publisher’s Note
Science Exploration remains a neutral stance on jurisdictional claims in published maps and institutional affiliations. The views expressed in this article are solely those of the author(s) and do not reflect the opinions of the Editors or the publisher.
Share And Cite


Science Exploration Style
Foster JA, Musau F. Indoor Environmental Quality in an Occupied Whole Life Straw Bale House in England, UK. J Build Des Environ. 2025;3:202526. https://doi.org/10.70401/jbde.2025.0010
Tips
Copy completed.
Submit a Manuscript
Author Instructions
Cite this Article
Article Metrics
0
View
0
Download
Article Updates
