PIONEER: A structure-informed graph neural network for PE/PPE protein identification
Heyun Sun
1,2
,
Xudong Guo
2,3,*

,
Yi Hao
3
,
Xiaomin Li
4
,
Wenmin Li
3
,
Ming Liu
1,*
,
Fuyi Li
2,3,*
*Correspondence to:
Xudong Guo, College of Information Engineering, Northwest A&F University, Yangling 712100, Shaanxi, China.
E-mail: xudong.guo@nwafu.edu.cn
Ming Liu, School of Information Technology, Deakin University, Burwood, VIC 3125, Australia. E-mail: m.liu@deakin.edu.au
Fuyi Li, College of Information Engineering, Northwest A&F University, Yangling 712100, Shaanxi, China. E-mail: fuyi.li@nwafu.edu.cn
Ming Liu, School of Information Technology, Deakin University, Burwood, VIC 3125, Australia. E-mail: m.liu@deakin.edu.au
Fuyi Li, College of Information Engineering, Northwest A&F University, Yangling 712100, Shaanxi, China. E-mail: fuyi.li@nwafu.edu.cn
Comput Biomed. 2026;1:202608. 10.70401/cbm.2026.0016
Received: March 10, 2026Accepted: May 09, 2026Published: May 11, 2026
Abstract
Aims: The Pro-Glu (PE) and Pro-Pro-Glu (PPE) protein family of Mycobacterium tuberculosis plays a critical role in virulence, immune evasion, and host-pathogen interactions. However, the high guanine-cytosine-content and repetitive sequences of these proteins have long hindered accurate gene identification and functional annotation. This study aims to develop an effective computational framework to improve the identification of PE/PPE proteins.
Methods: We propose PIONEER, a structure-aware deep learning framework that integrates embeddings from the pre-trained protein language model ESM Cambrian (ESMC) with structural features. PIONEER represents proteins as residue-level graphs that encode both sequence semantics and three-dimensional topological structure, enabling effective modelling of hierarchical geometric relationships.
Results: Benchmarking demonstrates that PIONEER outperforms 16 traditional machine learning algorithms and the existing deep learning model across multiple evaluation metrics, including accuracy, Matthew’s correlation coefficient, and F1 scores. Ablation experiments confirm the complementary contributions of ESMC embeddings and secondary structure features to model performance. The t-SNE-based visualization results reveal the contributions of features across different network layers to the identification of PE/PPE proteins.
Conclusion: PIONEER improves the accuracy of PE/PPE protein identification by integrating sequence and structural information within a structure-aware graph learning framework. This method provides an effective computational tool for functional annotation, investigation of pathogenicity mechanisms, and vaccine target discovery in M. tb.
Keywords
PE/PPE protein, mycobacterial, deep learning, equivalence graph neural network
1. Introduction
Tuberculosis (TB) is a chronic infectious disease caused by Mycobacterium tuberculosis (M. tb). According to the World Health Organisation, there will be 10.7 million people worldwide infected with TB in 2024 and approximately 1.23 million deaths, marking a downward trend compared to previous years[1]. This encouraging trend reflects the collaborative efforts made globally in the control and prevention of TB, including the dedication of medical professionals, public health workers, and researchers. The continuous improvements in early diagnosis, patient management, and accessibility of treatment, along with the understanding of the pathogenic mechanisms of M. tb and the development of novel anti-tuberculosis drugs and vaccines, have substantially reduced the global burden of TB. A comprehensive understanding of M. tb’s pathogenic mechanisms and host-pathogen interactions is a critical scientific foundation for developing novel anti-TB drugs and vaccines[2-5]. M. tb is primarily found in the human lungs. Its activity is regulated by ESX-1, which is one of five specialised type II secretion systems. It disrupts the host membrane compartments, thereby remodelling the host immune cells and tissue structures, in order to establish a microenvironment conducive to the survival of bacteria within the host. ESX-5 is the product of four consecutive replications of the type VII secretion system, which is essential for the virulence of M. tb. Unlike other ESX systems that secrete small amounts of protein, ESX-5 has over 150 identified or predicted substrates, most of which belong to the PE and PPE protein families (Figure 1a)[5]. These proteins are named for their conserved N-terminal amino acid motifs, Pro-Glu (PE) and Pro-Pro-Glu (PPE)[6]. Based on sequence characteristics and domain organization, PE proteins can be further divided into several subfamilies, including PE-only, PE_unique, and PE-PGRS. The PPE proteins can also be categorized into multiple subclasses according to their C-terminal motifs and sequence patterns. Among these subfamilies, the PE-PGRS proteins constitute one of the most abundant and biologically important groups, characterized by glycine-rich repetitive regions and high sequence polymorphism. In M. tb, approximately 169 genes encode PE/PPE proteins, accounting for about 7-10% of the entire genome[7]. These genes have a high guanine-cytosine (GC) content (ranging up to 80%) and are highly expressed during infection in various animal models[6,8,9]. Recent studies have revealed that these PE/PPE proteins are not only abundant in quantity but also have been evolutionarily co-developed with the Type VII secretion systems, especially ESX-5. The ESX-5 system is exclusive to slow-growing, pathogenic mycobacteria and is critical for virulence. Comparative genomic analyses demonstrate that the expansion of the PE/PPE gene family coincided with the emergence of ESX-5, underscoring their role in immune evasion and host adaptation[4]. The PE/PPE proteins participate in diverse biological processes, including nutrient acquisition, protein secretion, lipase activity, and host-pathogen interactions[10,11]. They also regulate several crucial immune mechanisms, such as antigen presentation, phagosome maturation, and autophagy processes. Usually, they also interact with toll-like receptors (TLR2/TLR4) to modulate cytokine secretion and immune signalling[3]. These findings confirm that the PE/PPE family constitutes a functionally significant component of M. tb and plays a crucial role in regulating the host immune responses during infection[12]. Furthermore, PE/PPE proteins are rich in T-cell and B-cell epitopes, making them potential candidate targets for diagnostic applications and vaccine development[13]. In vivo functional profiling of more than 80 PE/PPE mutants has shown that nearly one-third are essential for full virulence in animal models, indicating nonredundant roles in M. tb survival and immune modulation[5]. Specific proteins, such as PE-PGRS33 and PPE26, have been proven to function synergistically in the immune regulation process. They activate the production of cytokines through the TLR2/MyD88-dependent pathways and disrupt the maturation process of phagosomes, thereby enhancing intracellular survival. Moreover, other family members, such as PE-PGRS47 and PE-PGRS62, modulate apoptosis and autophagy, while PPE18 suppresses macrophage activation. These factors collectively contribute to M. tb’s ability to persist within host macrophages[3,4].
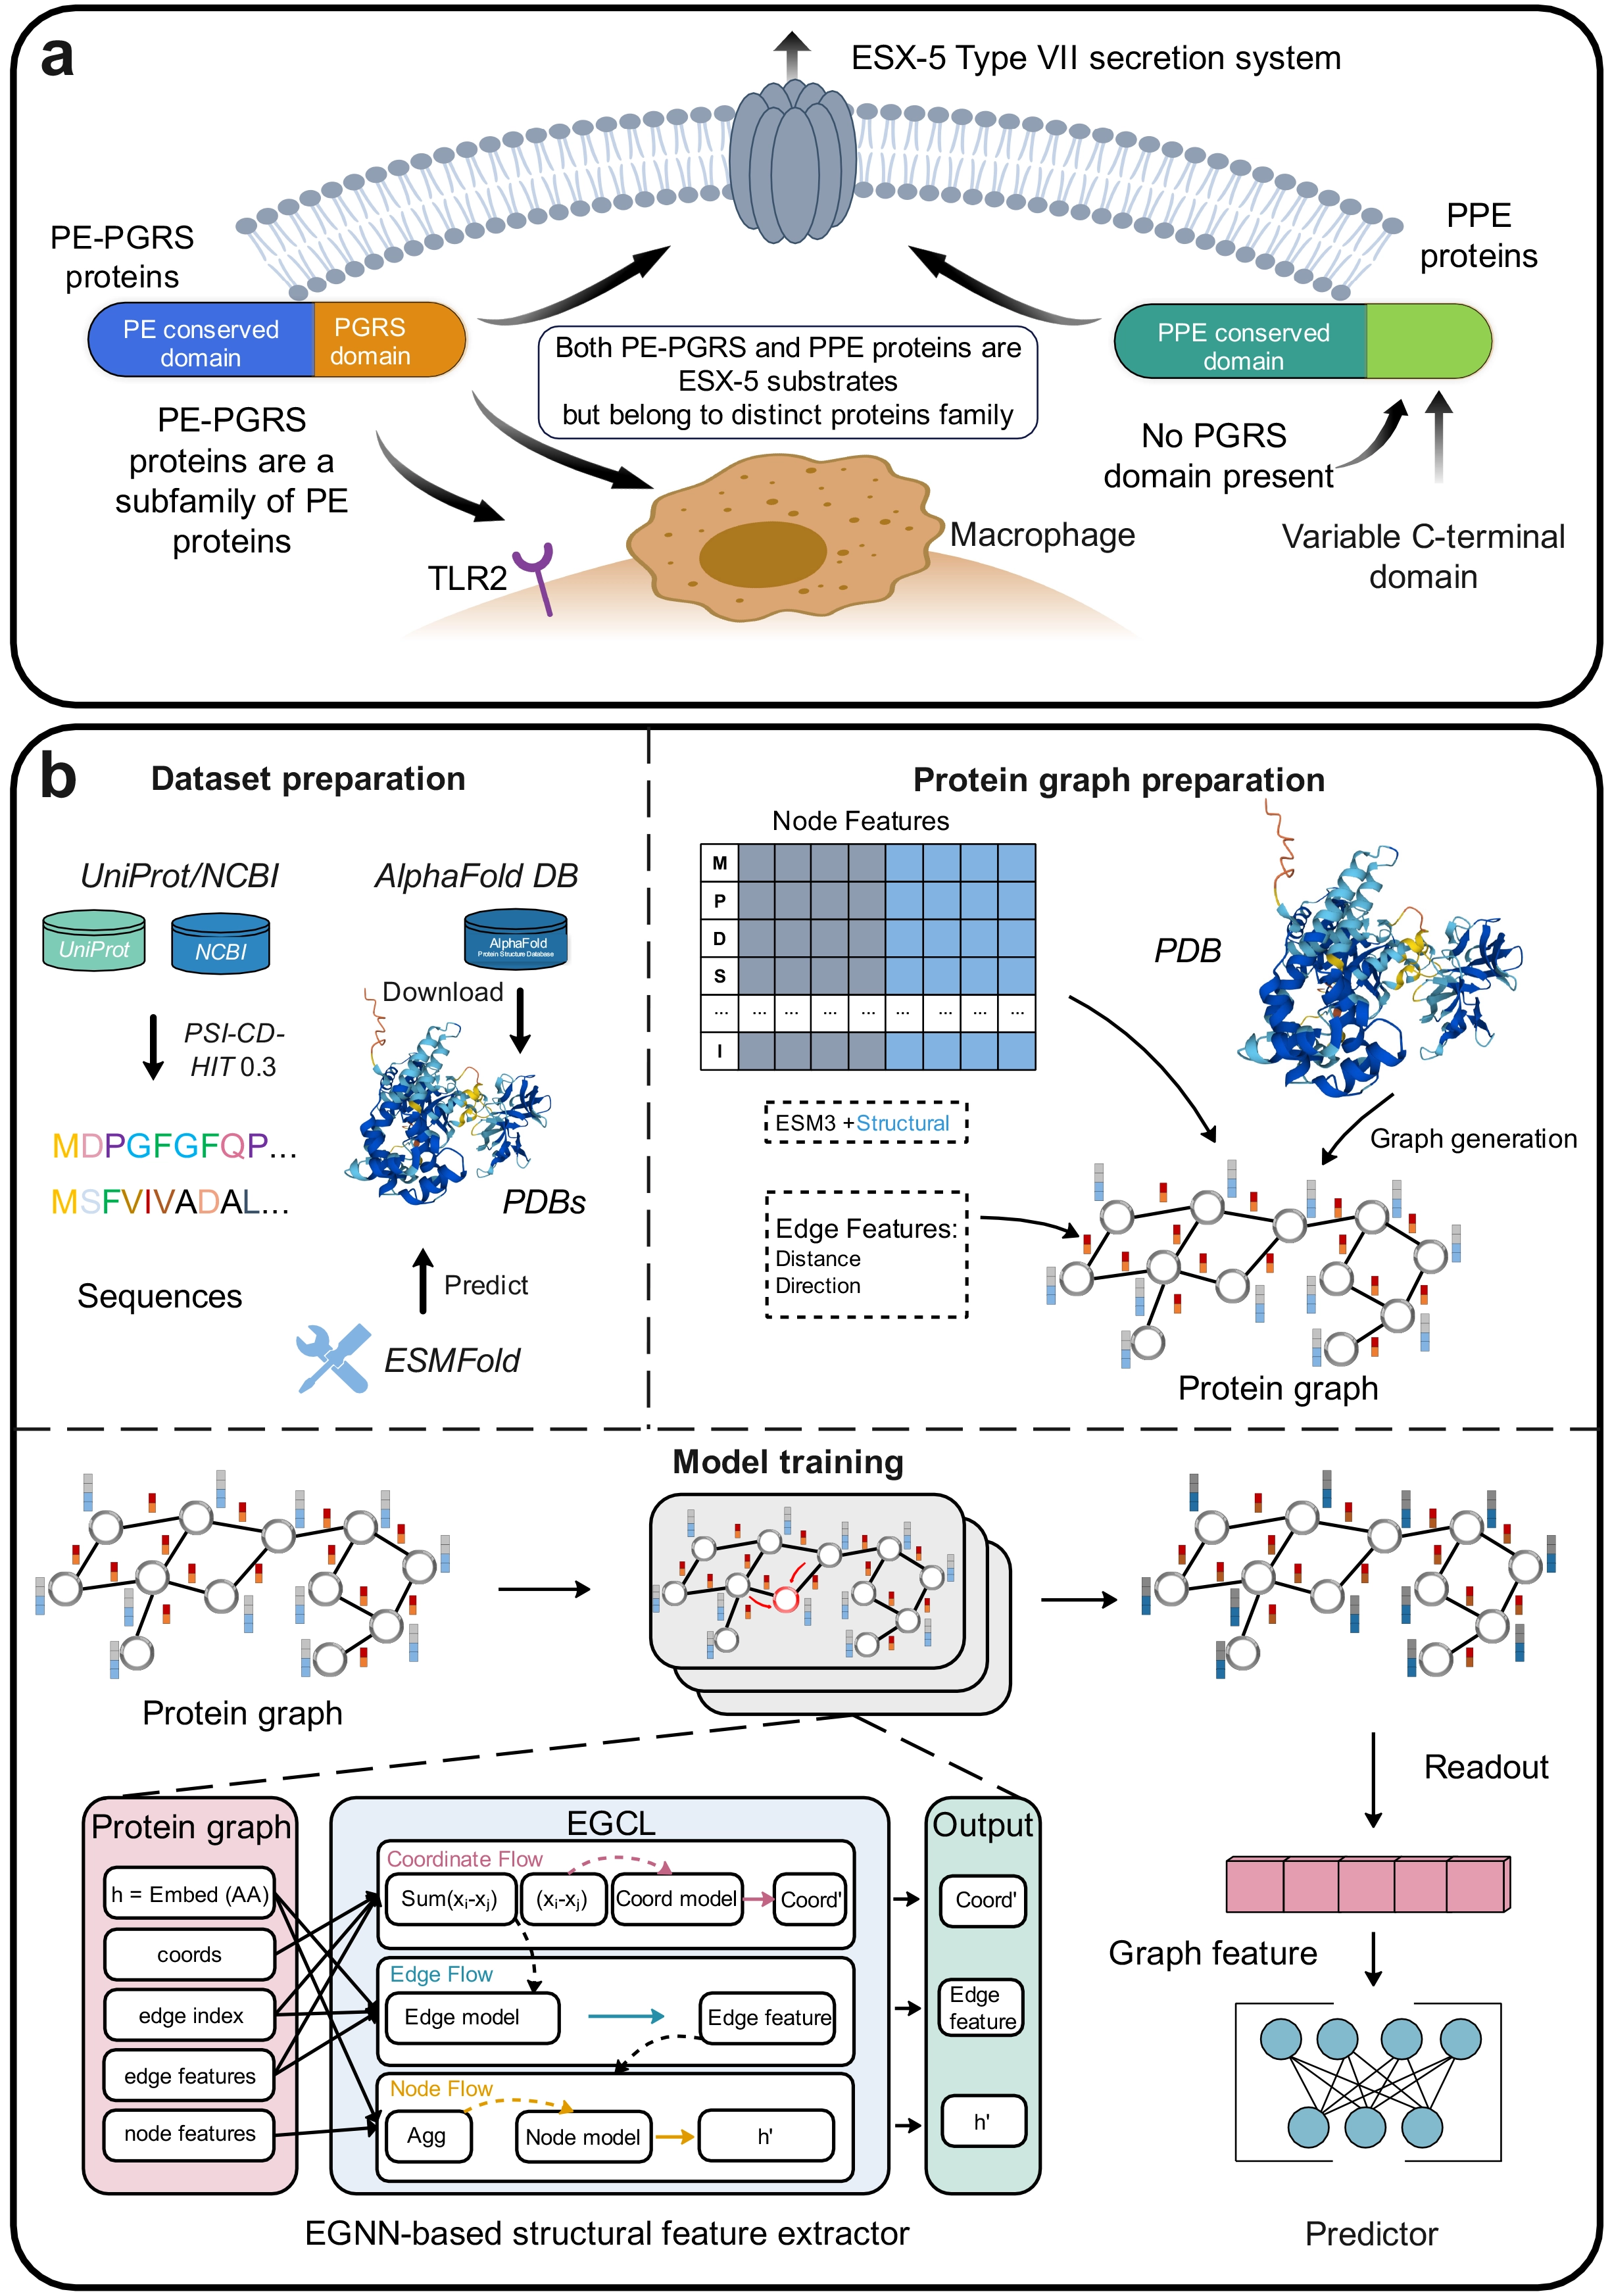
Figure 1. (a) Schematic diagram of PPE and PE-PGRS proteins; (b) The overall framework of PIONEER. PPE: Pro-Pro-Glu; PE: Pro-Glu; PGRS: polymorphic GC-rich repetitive sequence; TLR: toll-like receptors; NCBI: National Center for Biotechnology Information; PDB: protein three-dimensional structure data; EGCL: equivariant graph convolution layers; EGNN: equivariant graph neural network.
Despite extensive studies on specific PE/PPE subfamilies (e.g., PE-PGRS), the overall understanding of PE/PPE proteins remains limited due to their unique molecular characteristics. The high sequence similarity among family members, as well as the scarcity of the basic residues required for trypsin digestion, pose significant challenges for their identification and annotation via mass spectrometry[14]. Additionally, the presence of long low-complexity regions makes structural characterisation difficult, restricting insights into their conformational architecture and domain organisation[11,15]. Due to their highly repetitive structure and elevated GC content, PE-PGRS proteins exhibit substantial sequence variability, which presents significant challenges for conventional sequence alignment-based identification methods. As a result, these proteins are often excluded from large-scale genomic analyses, leading to limited functional understanding. Therefore, developing computational approaches capable of accurately identifying PE-PGRS proteins is crucial for facilitating large-scale functional annotation and improving our understanding of their biological roles. To address these challenges, several computational approaches have been proposed, including PEPPER[16] and Digerati[17]. PEPPER, developed by Li et al., is the first machine learning-based method for identifying PE-PGRS proteins. This method comprehensively evaluated 13 machine learning algorithms alongside various sequence and physicochemical features. Digerati is the first deep learning-based framework for identifying PE/PPE family proteins. It integrates multipath convolutional neural networks, bidirectional long short-term memory networks, and self-attention mechanisms to extract high-level features from protein sequences automatically. Compared to traditional alignment-based methods (BLASTP[18], PHMMER[19], HHsuite[20]), it achieves approximately 18-20% higher accuracy. However, both approaches primarily rely on sequence-based features, failing to fully leverage three-dimensional structural information and residue interaction patterns fully. For protein subtypes that share structural similarity but exhibit significantly different functions, sequence-based characterisation may prove insufficient to capture their functional essence, thereby limiting the model’s generalisation capability and biological interpretability.
To overcome these limitations, we develop a structure-aware model, PIONEER, for the identification of PE/PPE-related proteins by constructing a residue-level structural graph representation tailored to capture their complex structural characteristics. Unlike traditional convolutional networks, graph neural networks (GNNs) can simultaneously capture structural information at both the node (amino acid residue) and edge (interatomic interaction) levels, thereby naturally simulating hierarchical dependencies within molecular structures. The recently developed equivariant graph neural network (EGNN) preserves rotation and translation invariance[21,22], effectively learning geometric invariance of protein structures in 3D space[23]. It demonstrates outstanding performance in tasks such as protein function prediction, protein-protein interaction site prediction, and binding prediction[24-26]. This study further integrates protein language representations generated by ESM Cambrian (ESMC) (parallel model of ESM3) to provide a comprehensive characterisation of proteins[27,28]. Compared with traditional handcrafted features or one-hot encodings, ESMC-based embeddings more accurately reflect residue interactions, structural conformations, and evolutionary conservation. Consequently, this study employs ESMC-600M embedding vectors as node features for GNNs, achieving deep integration of sequence semantics and structural geometry. We integrate protein language model embeddings with structural graph representations to jointly model sequence semantics and spatial interactions, thereby enabling more effective characterisation of Mycobacterium PE/PPE family proteins. Results demonstrate that this framework outperforms existing deep learning and machine learning-based models in recognition accuracy and generalisation capability. It also improves the interpretability of protein functional features and provides new computational tools and biological insights for functional annotation, pathogenic mechanism analysis, and structure-based screening of M. tb-associated proteins as vaccine candidates.
2. Methods
2.1 Dataset construction
In this study, we formulated the prediction task as a three-class classification problem, where protein sequences are categorized into PE-PGRS, PPE, or Non-PE/PPE proteins. PE-PGRS represents a major subfamily within the PE protein family and plays an important role in host-pathogen interactions and immune modulation. These proteins exhibit high sequence polymorphism and repetitive motifs, which makes it particularly difficult to identify using traditional alignment-based approaches. By jointly modelling PE-PGRS, PPE, and Non-PE/PPE proteins, the proposed framework aims to capture discriminative structural features across these groups and improve the robustness of protein family identification. This study collected sequence data for PE/PPE family proteins from the National Center for Biotechnology Information (NCBI)[29] and UniProt databases[30] using the search terms “PE-PGRS” and “PPE”. For Non-PE/PPE proteins, sequences were retrieved from the UniProt database using the keyword “Mycobacterium”, excluding those annotated as “PE-PGRS” or “PPE”. To reduce sequence redundancy and avoid potential bias in model training, we applied the PSI-CD-HIT program with a strict sequence identity threshold of 30%[31]. Specifically, sequences sharing more than 30% identity were clustered, and redundant sequences were removed to ensure that the remaining sequences within the entire dataset were non-redundant.
Tertiary structure data for the proteins were sourced from the AlphaFold Protein Structure Database (AlphaFold DB)[32] and predicted from ESMFold[33]. For proteins with known structures, their protein tertiary structures were obtained from AlphaFold DB whenever available. However, some proteins included in our dataset were not present in the AlphaFold DB. To ensure that structural information was available for all proteins and to maintain a sufficiently large dataset for downstream analysis, we predicted the missing structures using a locally deployed ESMFold model. A total of 1964 tertiary structures were downloaded from AlphaFold DB, and an additional 5,125 structures were predicted using ESMFold. After excluding proteins with missing structural data, the final dataset comprised 2,344 PPE proteins, 2,781 PE-PGRS proteins, and 1,964 Non-PE/PPE proteins. These samples were subsequently divided into training and test sets at a 7:3 ratio, resulting in 4,961 and 2,128 samples, respectively. The independent test set was strictly reserved for final performance evaluation and was not involved in the model training process. To facilitate hyperparameter tuning and model selection, a validation set was further split from the training set during training (9:1 ratio). The validation set was used to monitor model performance during training and to guide hyperparameter optimisation. To further assess the model’s generalization capability, we employed a clustering-based validation strategy. Proteins were first grouped into clusters, and the dataset was partitioned accordingly, with entire clusters assigned exclusively to either the training or test set.
2.2 Protein graph representation
To characterise PE/PPE proteins from a structural perspective, we modelled the entire protein structure and represented each protein as a graph. By integrating sequence and spatial structural information, we aim to provide a more detailed representation of PE/PPE proteins. Specifically, for a given protein, we extract the Cα atoms of each residue and simulate the protein’s three-dimensional conformation based on spatial distances. This conformation is represented as a residue-level graph G = (V, E), consisting of nodes V and edges E. Each residue i is treated as a node vi ∈ V and described by two types of features: (i) sequence-based features, including residue embeddings derived from the ESMC-600M protein language model (Each residue is represented as a 1,152-dimensional embedding, serving as one of the node features.) and amino acid embeddings; (ii) structure-based features obtained using the Define Secondary Structure of Proteins (DSSP) program, including properties such as α-helix, β-sheet, and loop. The representation of residue i is defined as follows.
For an edge eij between residues i and j, we determine it by calculating the spatial distance between the residues. Specifically, an edge eij is established if the Euclidean distance between the Cα atoms of residues i and j is within 8 Å. This threshold is widely adopted in the field of bioinformatics[23,34-36]. Each edge is represented by a combination of a radial basis function distance expansion and a unit direction vector[37].
In summary, the entire protein structure is represented as a graph initialised by combining protein language model embeddings, secondary structure features, distance encoding, and direction vectors. Subsequently, an EGNN is employed to optimise this initial protein representation through iterative updates.
2.3 Neural network of PIONEER
In our model, we employed EGNN[22] as a core component to update the protein graph representation. Given a residue i with its initial feature representation hi, we apply GCL to refine residue features and edge features:
where
where H denotes the updated feature of the protein, and S denotes the number of residues. The resulting protein feature H is then used to calculate the probability of proteins PPE, PE-PGRS, and Non-PE/PPE:
where Predictor is composed of a multilayer perceptron, with the graph features of the protein as input and the predicted probability values for the three proteins as output.
2.4 PIONEER hyperparameters and training
PIONEER achieves hyperparameter tuning through iterative training on both training and validation sets. The learning rate and batch size are set based on experience, while other hyperparameters are tuned using the validation set to select the optimal model parameters. This study constructs a protein graph encoder based on the EGNN architecture, featuring 256 hidden units and an output dimension of 256. The input dimensions for the node and edge modules are set to 1,166 and 19, respectively, corresponding to the dimensions of node and edge features. Finally, PIONEER processes the protein graph representation using a fully connected (FC) layer with an input dimension of 256, 128 hidden units, and an output dimension of 3, classifying proteins into three categories (PPE, PE-PGRS, and Non-PE/PPE proteins).
PIONEER is implemented using PyTorch-1.13[38] with randomly initialised model parameters. To prevent overfitting, we applied layer normalization, Dropout (0.2), and early stopping (early stopping patience = 20). The network was trained using the Adam optimizer[39] with a learning rate of 0.003, a batch size of 32, and 300 training epochs, optimized via the cross-entropy loss function. All experiments were conducted on an NVIDIA GeForce RTX 3090 GPU with 24 GB of VRAM.
2.5 Performance evaluation
To evaluate the model, this study employed several widely used performance measures, including Accuracy, Recall, Precision, Matthew’s correlation coefficient (MCC), and F1[40,41]. These measures are calculated as follows:
where TP, TN, FP, and FN denote the numbers of true positives, true negatives, false positives, and false negatives, respectively. Moreover, we also calculate the area under the receiver operating characteristic curves (AUC) values.
3. Results
3.1 Overview of PIONEER
PIONEER identifies PE/PPE proteins by integrating pre-trained protein language model embeddings with protein structural features. Figure 1b illustrates PIONEER’s overall framework, comprising three main components: dataset preparation, protein graph representation, structural feature extractors, and the PE/PPE protein predictor. We curated datasets from UniProt[30] and NCBI databases[29] for model training and validation. Corresponding 3D structural data were sourced from the AlphaFold database[32] or predicted using a locally deployed ESMFold[33]. Protein sequence data were processed using the PSI-CD-HIT tool with a sequence similarity threshold of 30% to eliminate redundancy and ensure model reliability[31].
PIONEER is a GNN-based framework that represents proteins at the residue level as a graph G = (X, V). In this study, amino acids are represented as nodes X, whose initial values are initialised with embeddings derived from a protein language model (ESMC)[27] and structural features computed by DSSP[42]. Edges V are defined based on distances between Cα atoms of residues, with edge features consisting of distance encoding and direction vectors. Equivariant graph convolution layers (EGCL) are employed to extract informative features from the graph representation of proteins for identifying PE/PPE proteins.
As illustrated in Figure 1b, after passing through multiple EGCL layers, node and edge features undergo iterative updates. An output function then aggregates the graph-level representation, feeding it into a FC predictor to generate the final output. The raw protein input sequentially flows through three EGCL modules: coordinate flow, edge flow, and node flow. These modules iteratively update node features by aggregating information from neighbouring nodes. Finally, node features are summed to obtain the graph representation of the PE/PPE protein. These graph features are subsequently projected by the predictor into scalar probability values, representing the likelihood that the protein is a PE/PPE member.
3.2 Characterisation of PE-PGRS and PPE proteins
To investigate the sequence and structural differences between PPE and PE-PGRS proteins, we performed a visual analysis of the N-terminal regions (first 50 amino acids) of both protein classes (Figure 2). The sequence logo illustrates the overall trends and differences in amino acid composition between PPE and PE-PGRS proteins (Figure 2a). Although certain positions exhibit distinct amino acid preferences (such as a slight enrichment of glycine residues in PE-PGRS proteins), both protein classes demonstrate a strong preference for alanine (A), particularly at positions 13-16 and 26-34, where alanine frequencies are highest. Additionally, both PPE and PE-PGRS proteins contain conserved DEXS motif[16,43] (where X represents any amino acid) at positions 8-11 and 45-48, respectively. These observations indicate a high degree of sequence conservation and similarity between PPE and PE-PGRS proteins. Such similar sequence patterns may explain why sequence-based classification models often struggle to accurately distinguish between these two protein classes.
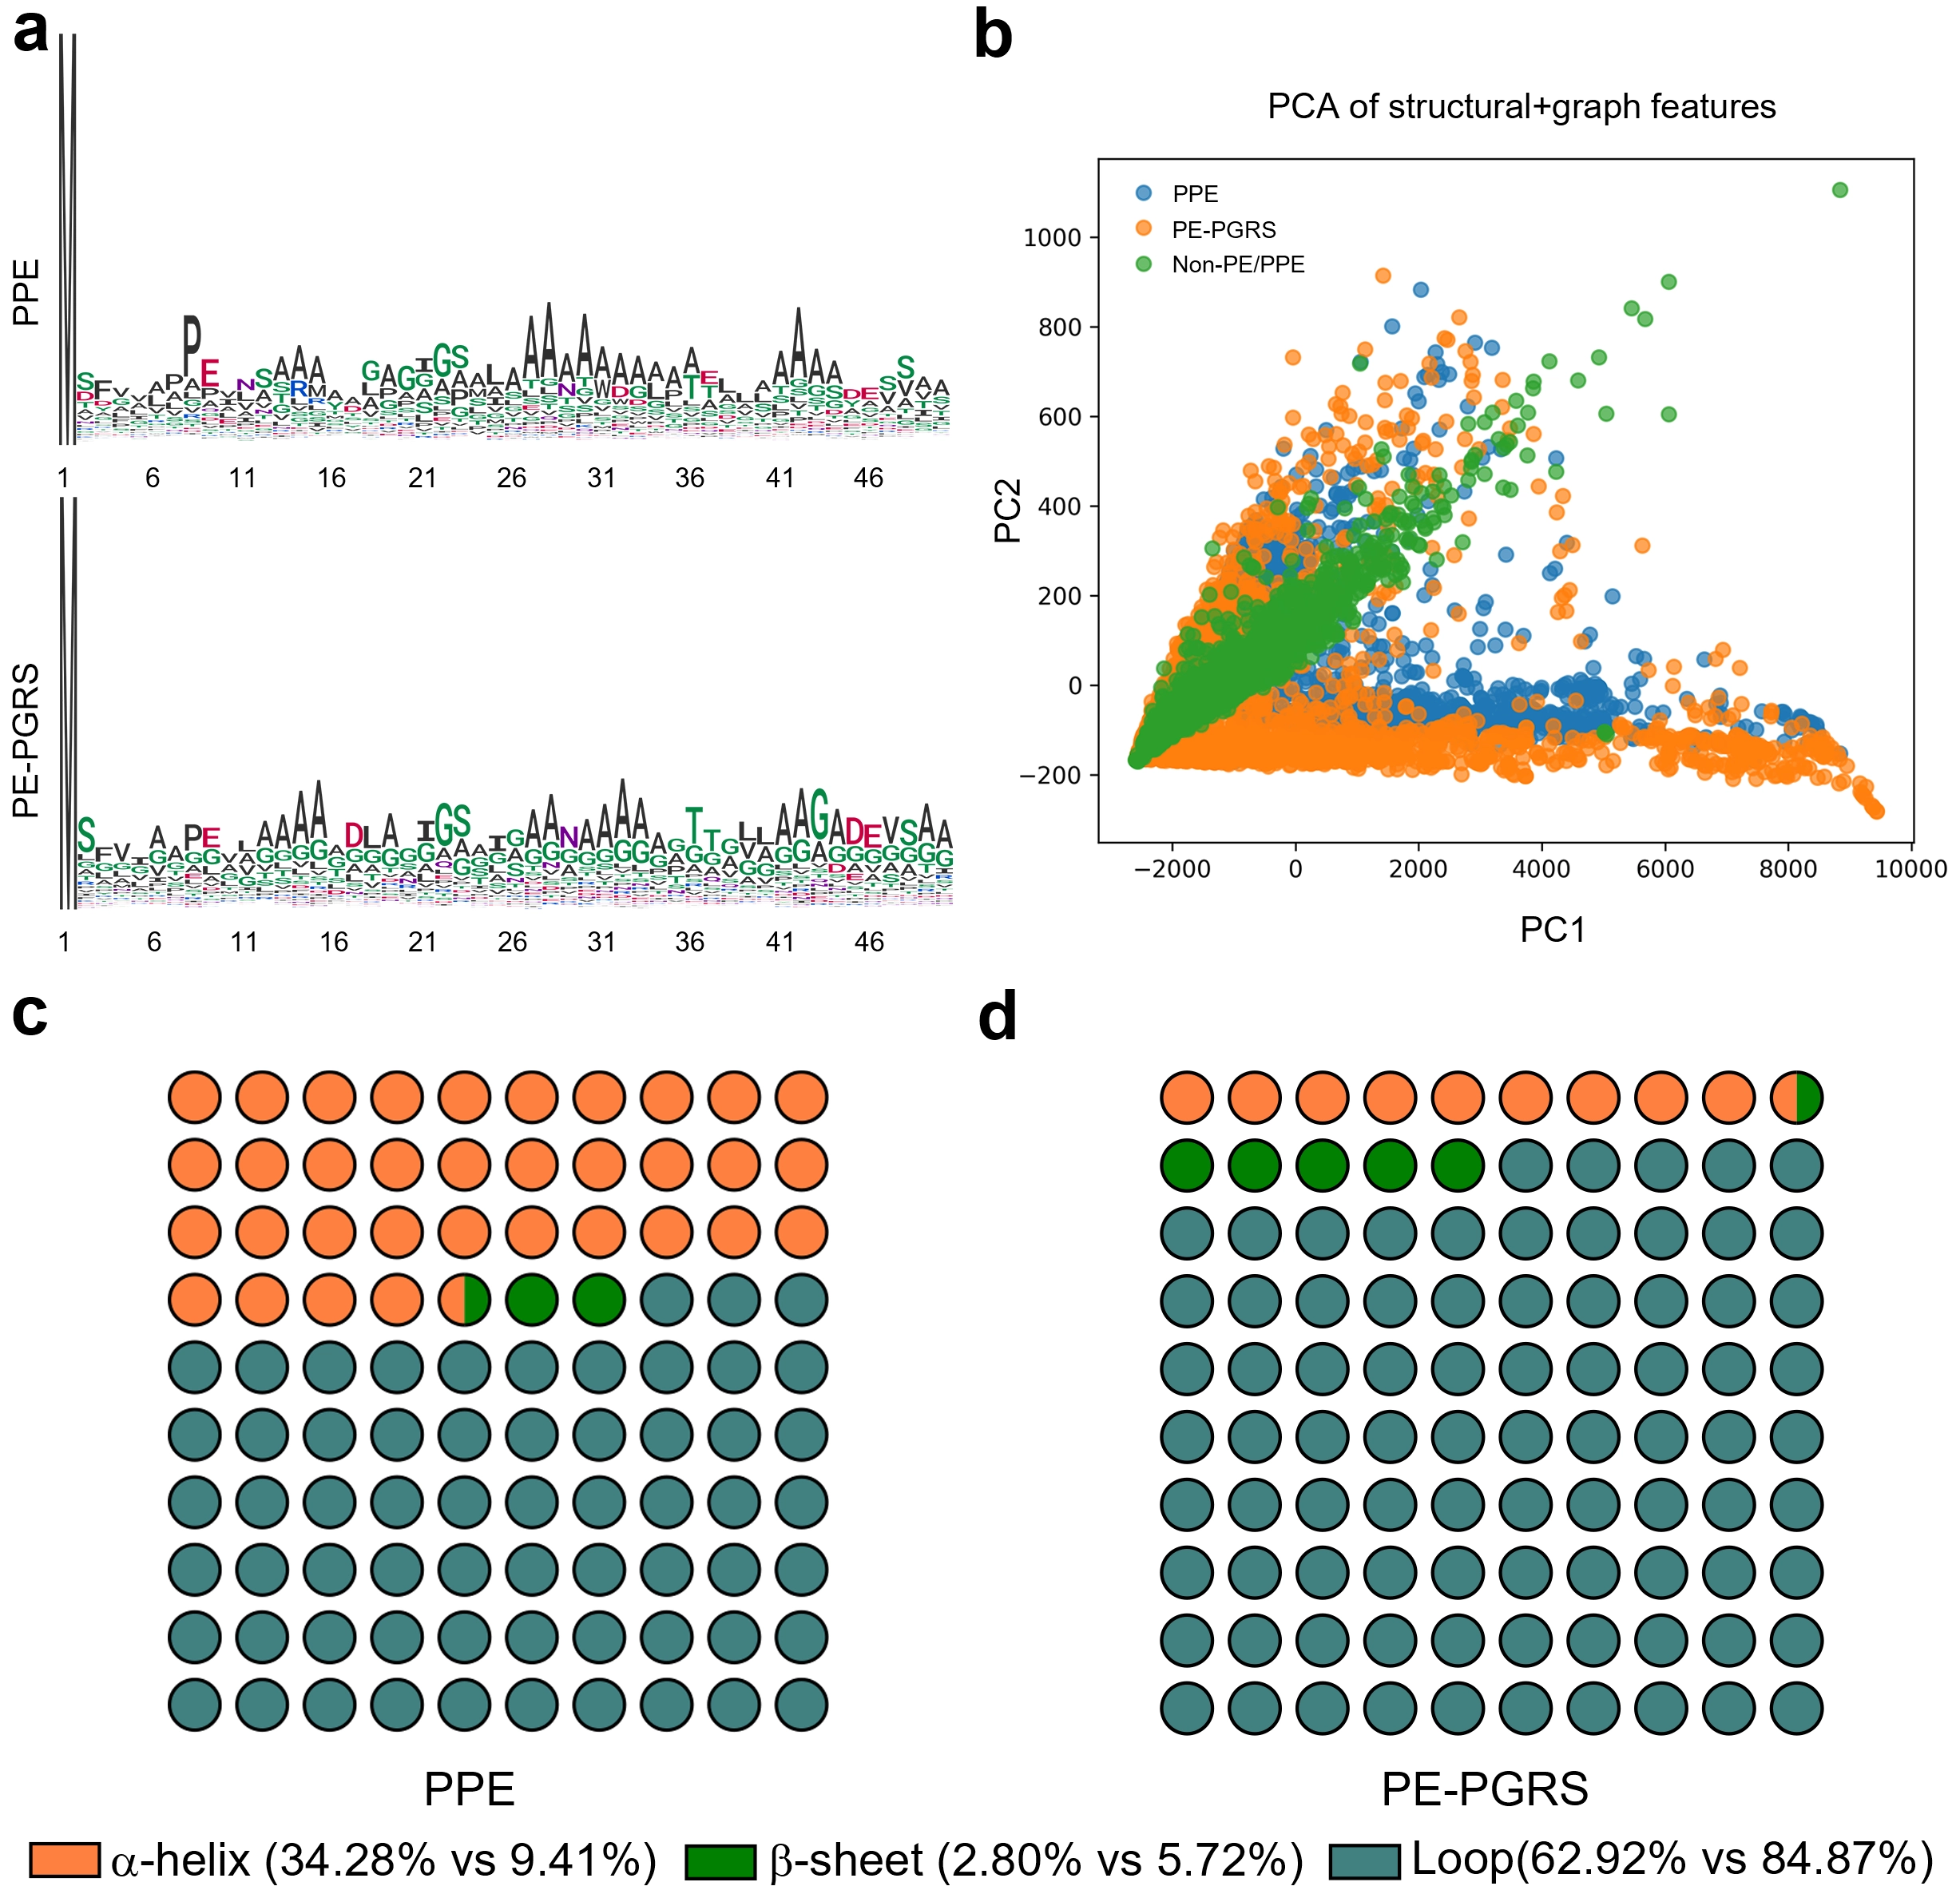
Figure 2. Comparative analysis of sequence composition and structural characteristics between PPE and PE-PGRS proteins. (a) Sequence logos of the N-terminal 50 amino acid residues from PPE and PE-PGRS proteins; (b) PCA projection based on structural and graph-derived descriptors, revealing distinct distributions among PPE (blue), PE-PGRS (orange), and Non-PE/PPE (green) proteins; (c-d) Proportional dot plots illustrating secondary structure composition. PPE: Pro-Pro-Glu; PE: Pro-Glu; PGRS: polymorphic GC-rich repetitive sequence; PCA: principal components analysis.
To further reveal structural differences, we analysed protein three-dimensional structure data and graph-based structural features encompassing topological and geometric information[44,45]. Extracted multidimensional attributes included node and edge counts, average degree, density, clustering coefficient, spectral radius, structural entropy, radius of gyration, α-helix proportion, β-sheet proportion, and loop proportion. Principal component analysis[46] was then applied to reduce the dimensionality of these high-dimensional graph features. As shown in Figure 2b, distinct separation among the three protein classes is evident in the structural feature space. Non-PE/PPE proteins (green) exhibit relative clustering, though scattered points reflect their structural diversity. In contrast, PPE (blue) and PE-PGRS (orange) proteins form partially overlapping yet distinguishable clusters in the principal component space, indicating that structural features possess stronger discriminative power than sequence features. Figure 2c,d further illustrate the differences in secondary structure composition between PPE and PE-PGRS proteins via scatter plots. PPE proteins exhibit significantly higher α-helix content than PE-PGRS proteins (34.28% vs. 9.41%), while PE-PGRS proteins contain a much higher proportion of loop regions (84.87% vs. 62.92%). Both protein classes exhibit relatively low β-sheet content, though PE-PGRS proteins show a slight advantage (5.72% vs. 2.80%). These compositional differences suggest PPE proteins tend toward more compact structures with abundant helical segments, whereas PE-PGRS proteins exhibit greater flexibility and intrinsic disorder, characterised by loop enrichment.
Overall, despite sequence similarities between PPE and PE-PGRS proteins, their differences in three-dimensional conformation and secondary structure composition provide more discriminative structural cues for the model. In this study, we utilised ESMC to extract sequence embeddings and employed them as node features in the protein graph, enabling the model to learn high-dimensional representations that integrate both sequence and structural information. PIONEER effectively captures the spatial topological relationships and geometric patterns of proteins, providing crucial structural information for accurately identifying PE/PPE family proteins.
3.3 Comparison with other modern predictors
We conducted comprehensive benchmarking of PIONEER on the test dataset and compared it with machine learning algorithms and existing deep learning approaches (Figure 3a,b). First, we systematically evaluated the three-class classification performance of 16 mainstream machine learning algorithms on the same dataset using a 10-fold cross-validation strategy (Table S1). These algorithms include: extreme gradient boosting (XGBoost), light gradient boosting machine (LightGBM), CatBoost classifier (CatBoost), gradient boosting classifier (GBC), random forest classifier (RF), ExtraTree classifier, ridge classifier, logistic regression, decision tree classifier, AdaBoost classifier, K-nearest neighbors classifier, naive bayes, support vector machine, linear discriminant analysis, dummy classifier, and quadratic discriminant analysis. Specifically, we encoded the dataset using nine encoding schemes (three groups, namely amino acid composition feature, composition/transition/distribution feature, and conjoint triad feature) from PEPPER[16] and employed five distinct random seeds. Model training and evaluation for all 16 algorithms were conducted using the low-code machine learning library PyCaret[47]. The top five algorithms on the validation set were LightGBM, CatBoost, XGBoost, GBC, and RF (Table S2). Among these, LightGBM, CatBoost, and XGBoost exhibited the highest classification accuracy, followed by GBC and Random Forest (Figure 3a). However, even the best-performing ML model (LightGBM) achieved a maximum accuracy of approximately 0.91, which plateaued across multiple runs. To further evaluate the relative performance of deep learning frameworks, five independent experiments with different random seeds were conducted on the same dataset, comparing PIONEER with the Digerati model and LightGBM (Figure 3b). PIONEER consistently achieved the best results across the three key evaluation metrics (ACC, MCC, and F1 score), significantly outperforming Digerati and LightGBM. The statistical comparison results indicate that the performance improvement of the proposed model is highly significant (t-test, p < 0.0001). Notably, while Digerati demonstrated competitiveness relative to machine learning methods, PIONEER’s advantage was particularly evident in MCC and F1 score, two metrics more sensitive to class imbalance, highlighting its superior generalisation and discriminative abilities. The confusion matrix and per-class performance analyses further demonstrate that POINEER achieves strong overall classification performance across the three protein categories (Figure 3c and Table S3). To further reduce the potential risk of homologous information leakage between the training and test sets, we additionally adopted a cluster-based dataset splitting strategy. The results under this cluster-based validation setting show that the proposed model maintains competitive performance (Figure 3d).
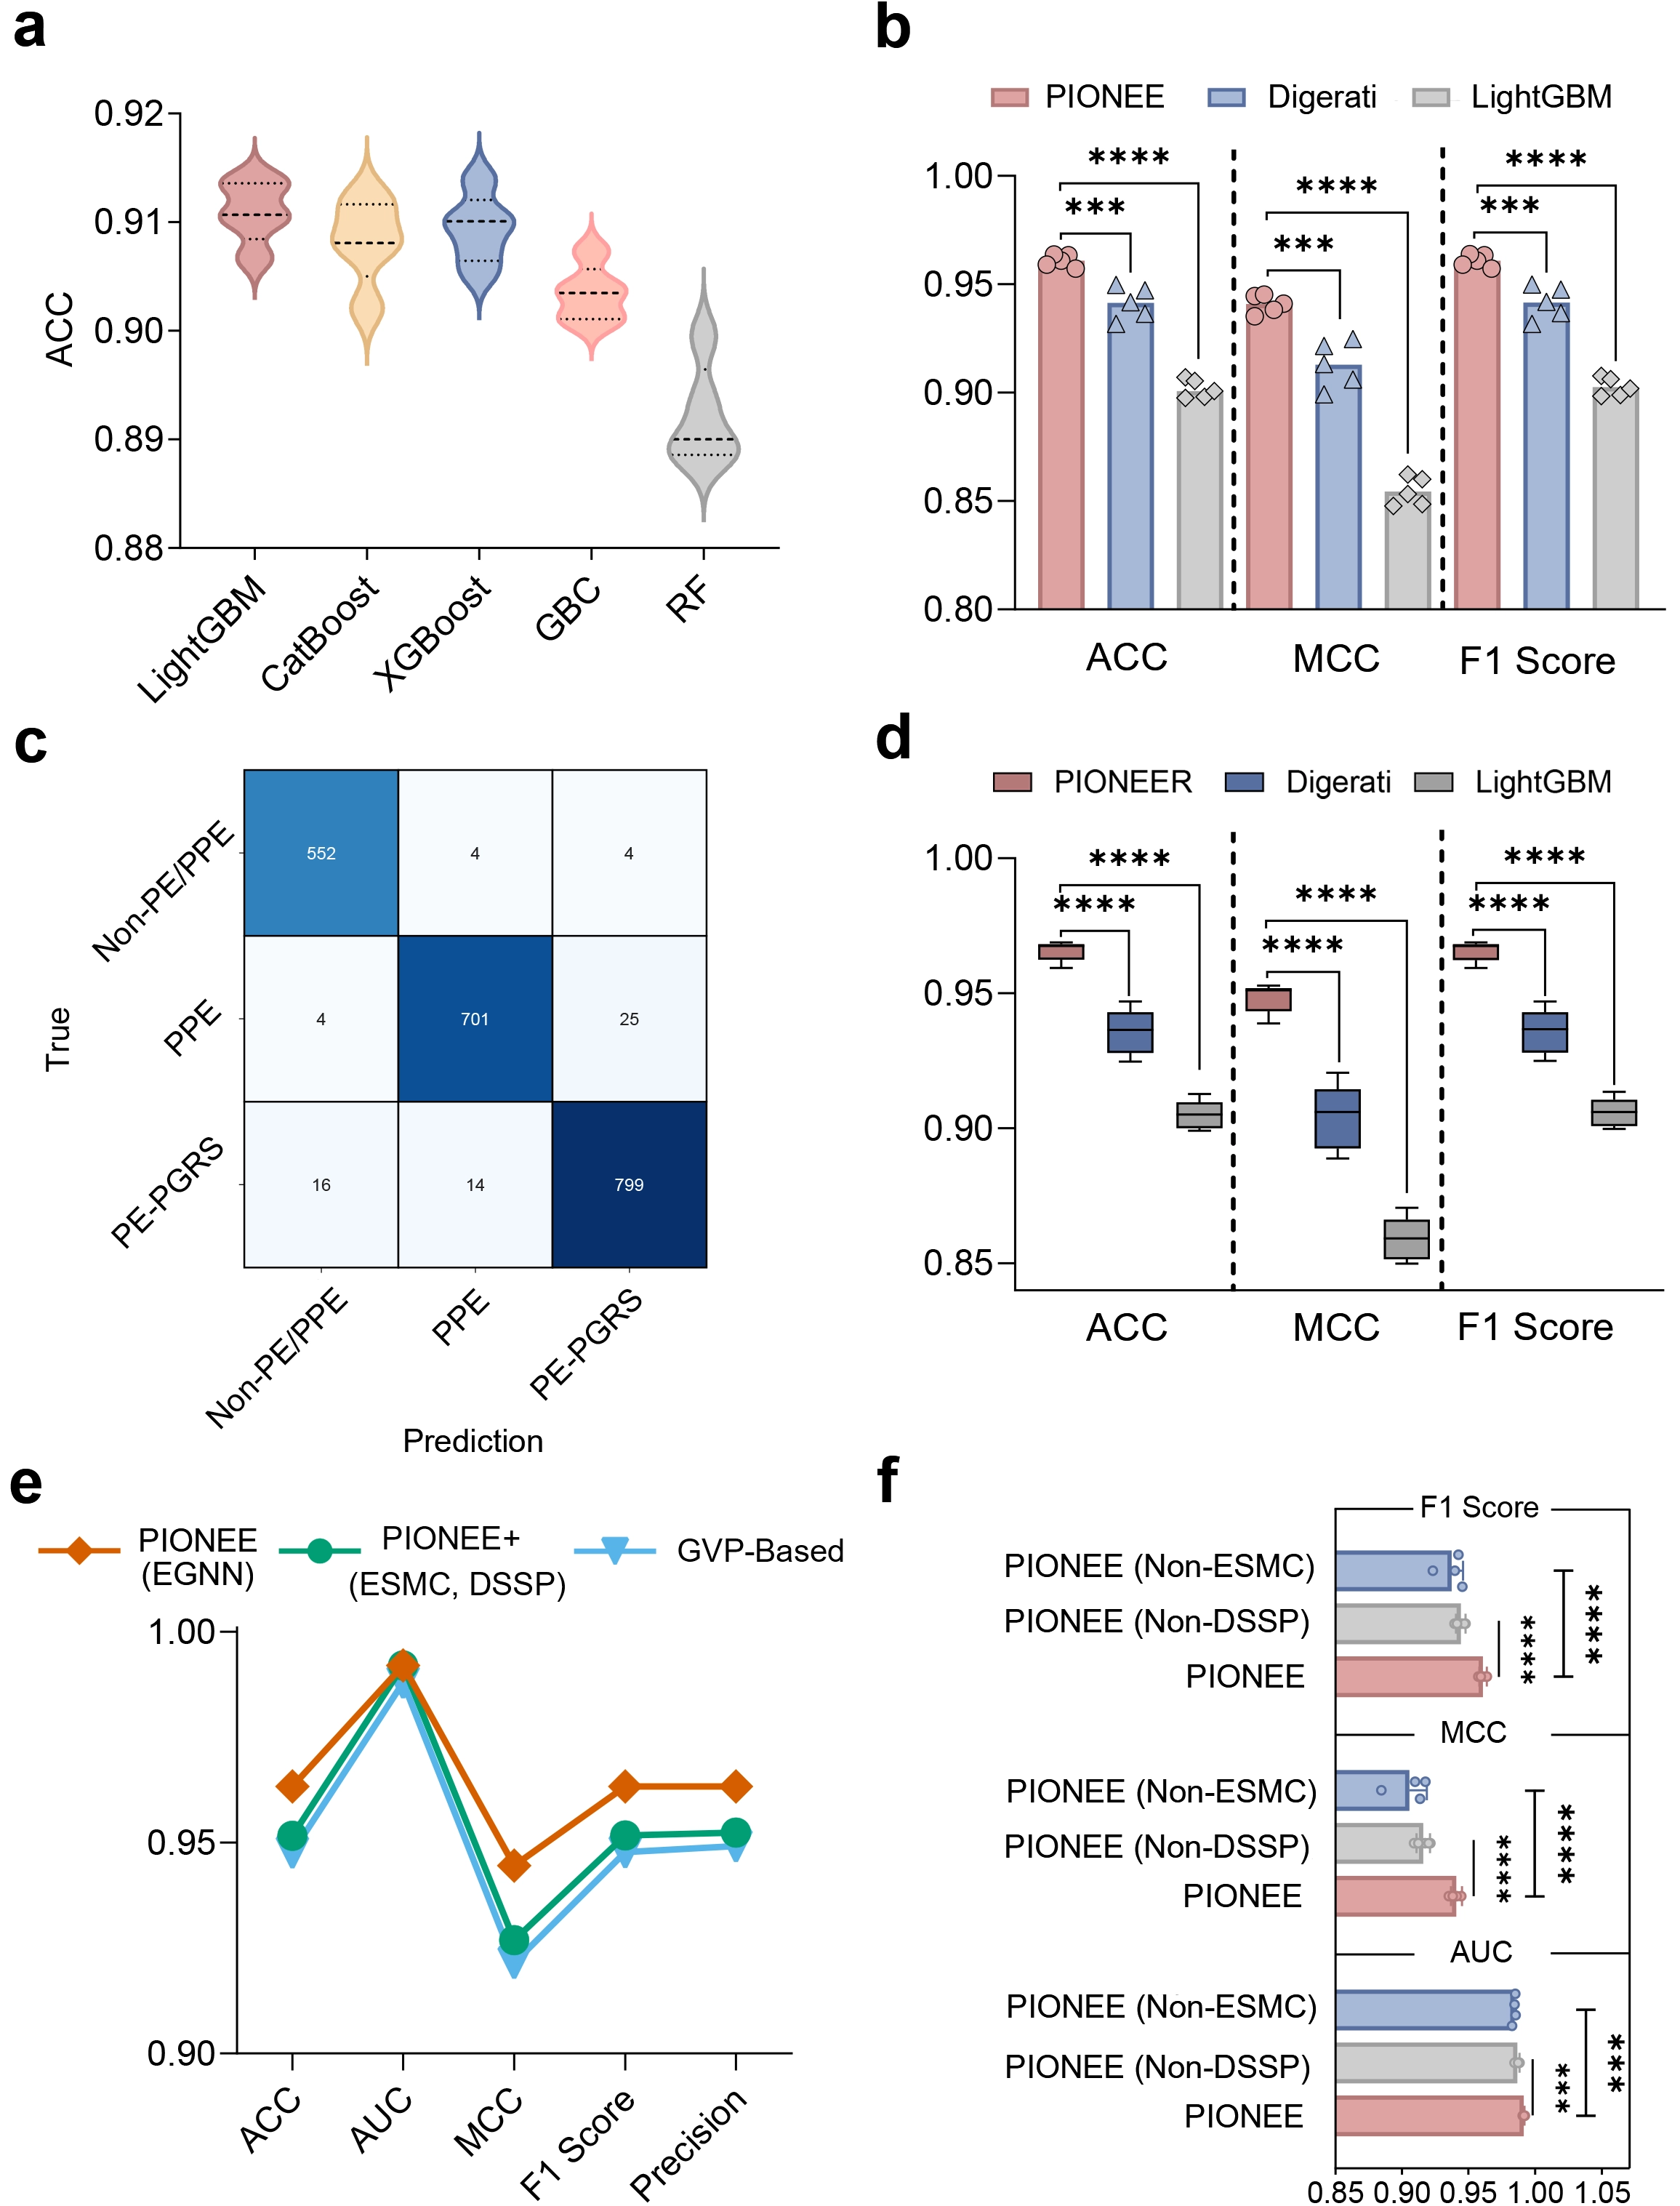
Figure 3. Performance comparison of the PIONEER on different methods and designs. (a) Comparison of the performance of mainstream machine learning algorithms in terms of ACC; (b) Comparison of the performance of PIONEER with existing methods in terms of ACC, MMC, and F1; (c) Confusion matrix on independent test sets; (d) Comparison of PIONEER with other methods. Under the clustering-based dataset partitioning strategy, the performance of PIONEER on the test set is evaluated against two other methods. Each model was trained and tested five times, utilizing different random seeds for each iteration; (e) Comparison of five metrics (ACC, AUC, MCC, F1, and Precision) across different PIONEER variants; (f) Comparison of three metrics (AUC, MCC, and F1) across different PIONEER variants. ACC: accuracy; MMC: Matthew’s correlation coefficient; AUC: area under the curve; GBC: gradient boosting classifier; RF: random forest classifier; PPE: Pro-Pro-Glu; PE: Pro-Glu; PGRS: polymorphic GC-rich repetitive sequence; GVP: geometric vector perceptrons; ESMC: ESM Cambrian; ESM: evolutionary scale modeling; DSSP: Define Secondary Structure of Proteins.
Furthermore, integrating structural data into PIONEER significantly enhances its performance beyond sequence-based approaches, indicating that capturing residue-level structural information is crucial for accurately identifying PE/PPE proteins. To further validate this, we conducted an architectural evaluation of different PIONEER variants to elucidate the contribution of individual design components (Figure 3e). Three versions were compared: (i) Standard PIONEER (using ESMC embeddings and secondary structure features as node features, with graph features as prediction input); (ii) a variant concatenating ESMC embeddings, secondary structure features, and graph features as prediction inputs; and (iii) a variant replacing EGNN with geometric vector perceptrons[48]. PIONEER consistently outperformed the other two variants across all evaluation metrics, including accuracy, AUC, MCC, F1 score, and precision, highlighting the effectiveness of its architecture. This suggests that the EGNN-based message-passing mechanism can capture fine-grained structural dependencies and effectively integrate residue context information and structural features.
We also validated the necessity of combining ESMC embeddings and secondary structure features as node features by comparing PIONEER with two ablation variants: one using only ESMC embeddings and another using only secondary structure features (Figure 3f). Across multiple replicate experiments, PIONEER consistently achieved higher AUC, MCC, and F1 scores than both variants. Collectively, these findings confirm that combining ESMC embeddings with secondary structure features as node inputs is crucial and further demonstrate that the PIONEER framework effectively captures structural information of PE/PPE proteins, significantly outperforming traditional machine learning and previous deep learning models; the EGNN-based structural encoder effectively utilises residue-level spatial relationships, thereby improving prediction accuracy and biological interpretability.
3.4 Feature representations learned by PIONEER
We further examined the effectiveness of different feature representation methods in distinguishing PPE and PE-PGRS proteins (Figure 4). Figure 4 presents t-SNE visualisations[49] of four feature representations: ESMC-based features extracted from the protein language model ESMC to capture sequence context information; DSSP-based features derived from the DSSP program to represent secondary structure properties; graph features learned from protein graph representations by PIONEER; and FC-based features obtained from the intermediate output of the FC layer used for final classification.
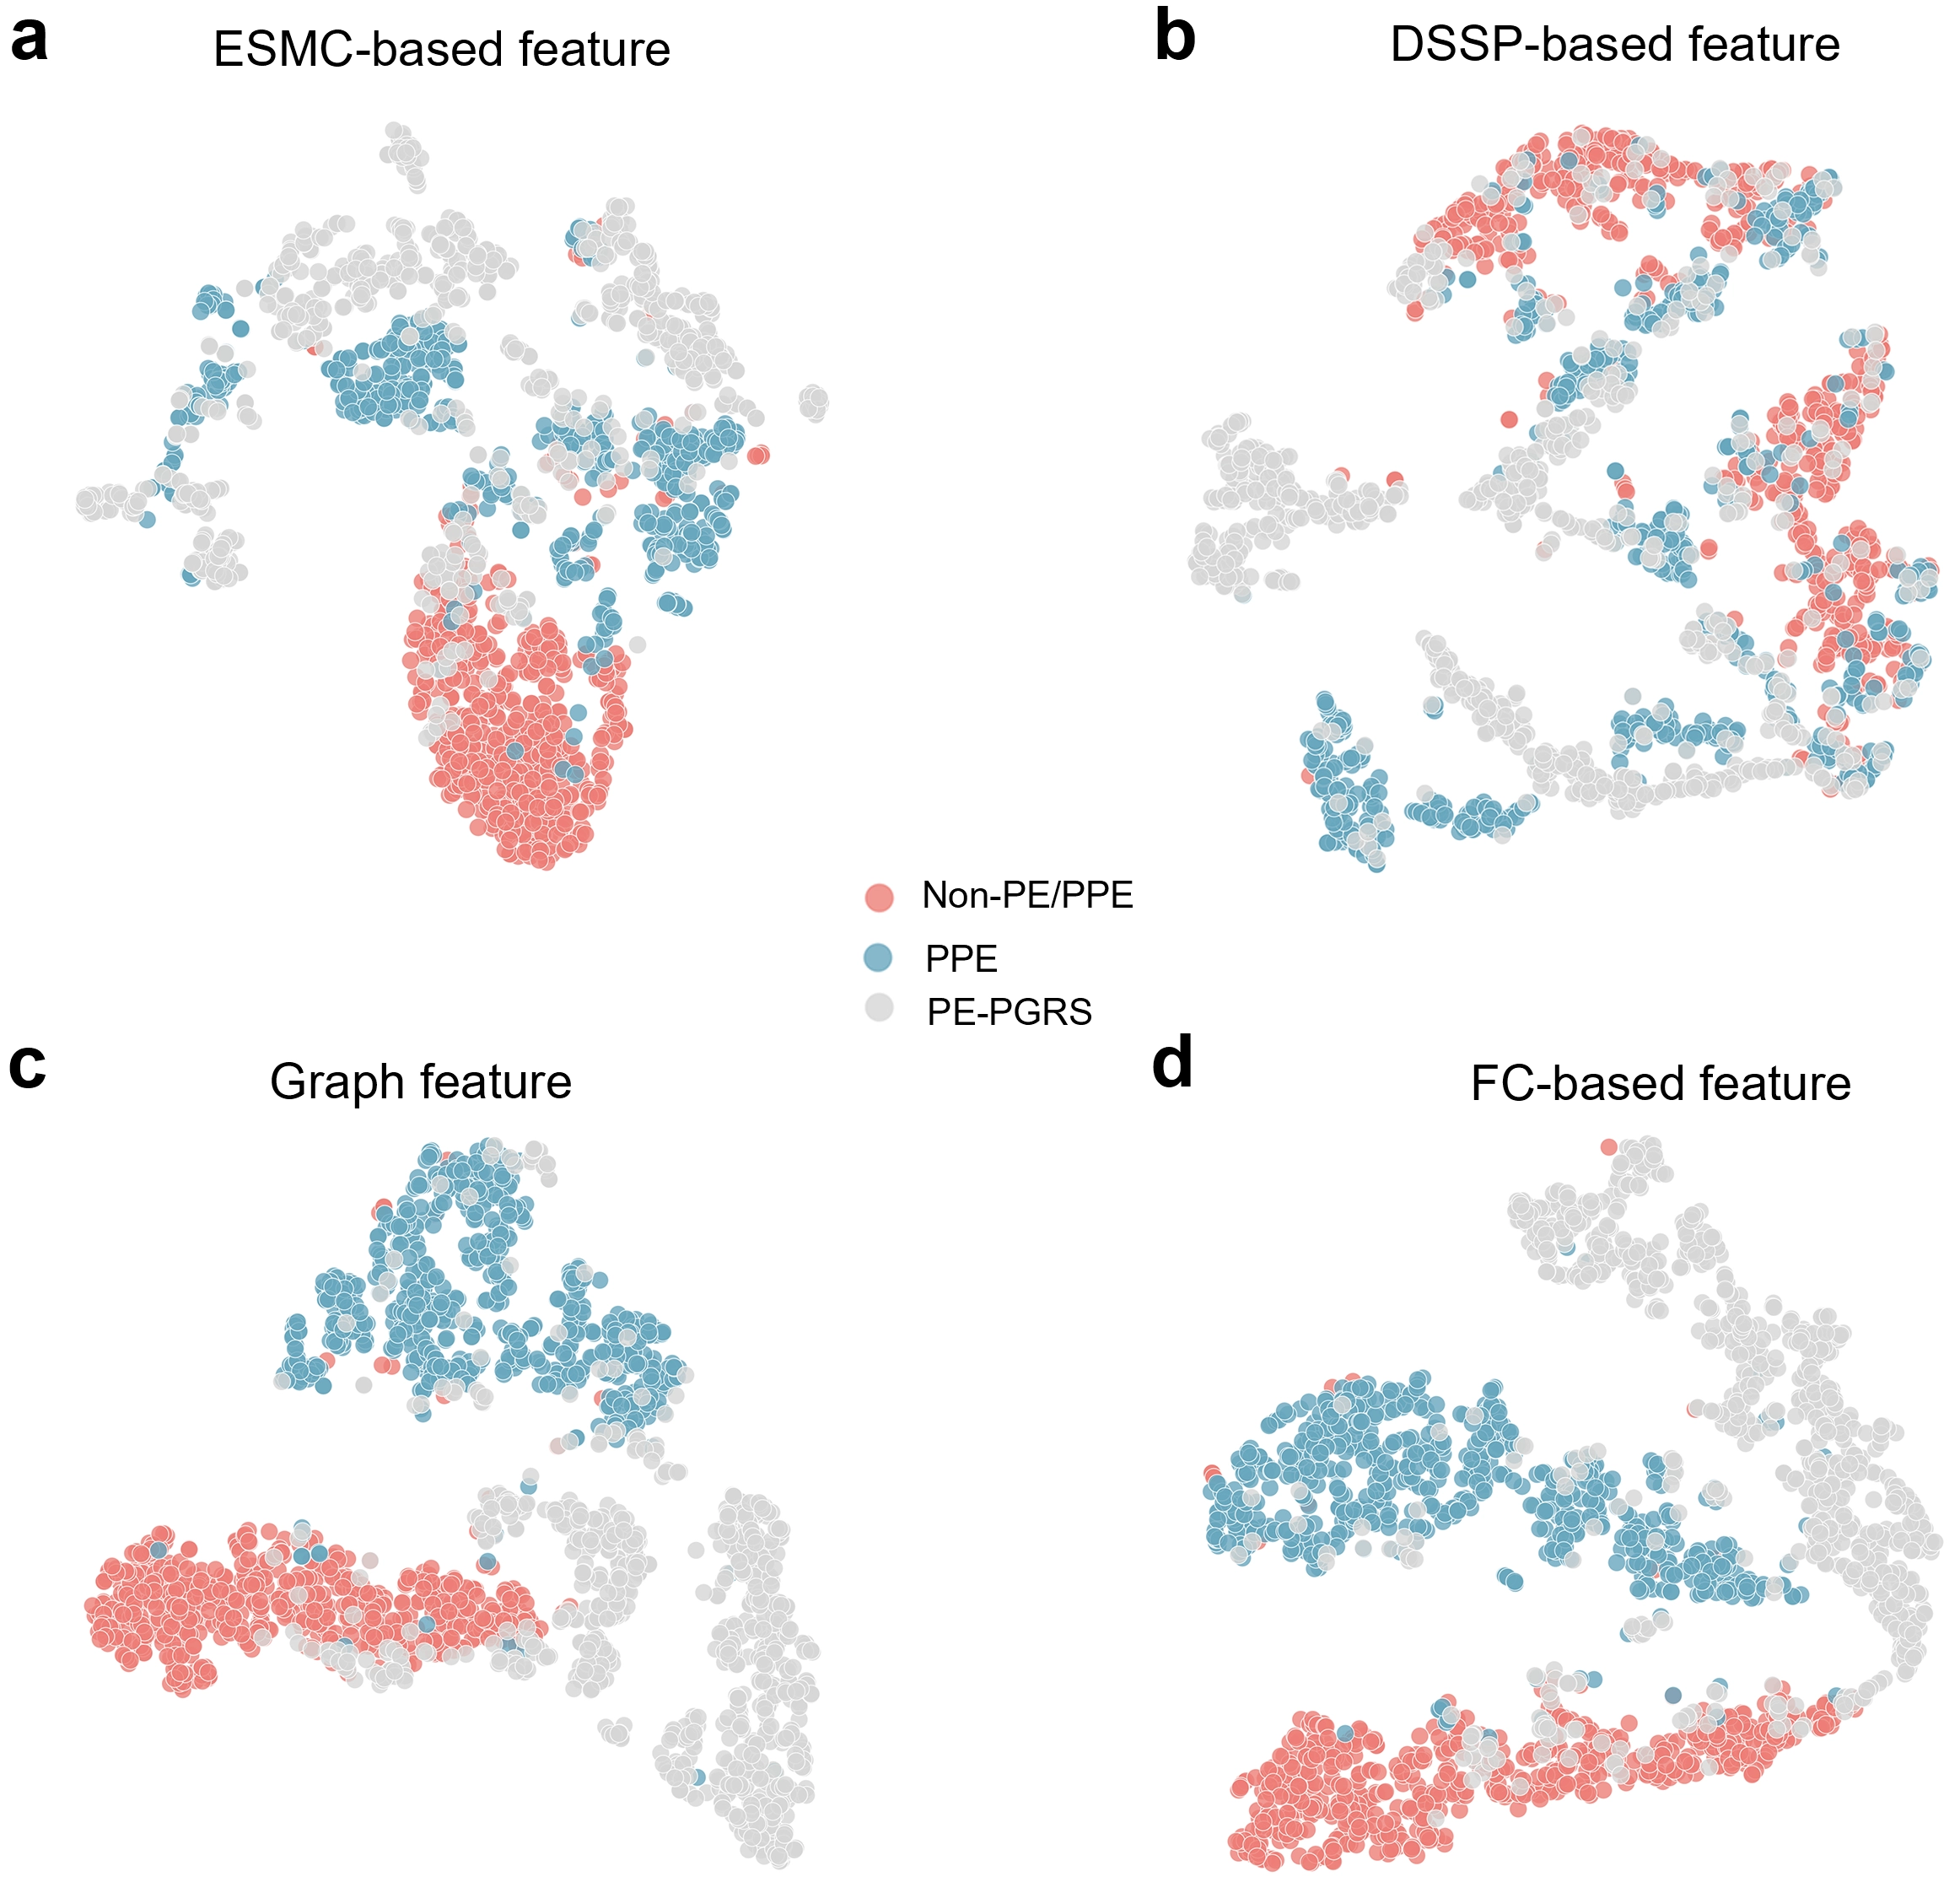
Figure 4. The t-SNE visualisation of different feature representations for PPE, PE-PGRS, and Non-PE/PPE proteins. (a-d) t-SNE plots showing the clustering patterns of three protein classes based on four different feature types: (a) ESMC-based features (sequence embeddings derived from a protein language model); (b) DSSP-based features (secondary structural features); (c) Graph features (graph representations integrating ESMC and structural information), and (d) FC-based features (intermediate features from the fully connected classification layer). Red, blue, and gray dots denote Non-PE/PPE, PPE, and PE-PGRS proteins, respectively. SNE: stochastic neighbor embedding; PPE: Pro-Pro-Glu; PE: Pro-Glu; PGRS: polymorphic GC-rich repetitive sequence; ESMC: ESM Cambrian; ESM: evolutionary scale modeling; DSSP: Define Secondary Structure of Proteins; FC: fully connected.
As illustrated in Figure 4a, ESMC-based features effectively distinguish PPE (blue) from Non-PE/PPE (red) proteins, forming compact clusters. This demonstrates the strong representational power of sequence context features extracted by ESMC, reflecting conserved sequence patterns within the PE/PPE family. Furthermore, compared to PPE and PE-PGRS proteins, Non-PE/PPE proteins exhibit a more compact distribution, indicating that ESMC embeddings capture significant sequence-level differences between Non-PE/PPE and the other two protein classes. The embeddings derived from ESMC encode long-range dependencies and evolutionary relationships between amino acid residues, enabling the model to exhibit functional awareness even in the absence of explicit structural information. This establishes a robust foundation for downstream multimodal feature fusion and classification. DSSP-derived features represent secondary structural elements such as α-helices, β-sheets, and loops. The distributions of these three protein classes are relatively mixed, with weak clustering (Figure 4b). This indicates that while secondary structure features partially reflect local folding patterns, they are insufficient to distinguish functionally similar or structurally related protein subfamilies. In highly homologous families like PE/PPE, DSSP-derived features lack sufficient discriminative power. GNNs learn graph features after modelling proteins as graphs, treating ESMC embeddings (sequence context) and DSSP features (secondary structure) as node attributes, while edges represent spatial contacts or residue interactions. PPE proteins and Non-PE/PPE proteins form clearly separated clusters, with class boundaries more distinct than those generated using ESMC- or DSSP-based features alone (Figure 4c). This demonstrates that the graph representation effectively integrates multidimensional sequence and structural information, enabling the model to capture both local topological relationships and global interaction patterns simultaneously. These results highlight the advantages of graph learning in combining multimodal features and extracting high-level semantic representations through message-passing mechanisms, thereby improving classification performance. Features derived from the intermediate output of the pre-classification FC layer represent high-dimensional semantic embeddings that integrate sequence context, structural relationships, and global information. As shown in Figure 4d, these features yield the clearest clustering and boundary separation, with all three protein categories forming compact and distinctly separated clusters. This demonstrates that after end-to-end training, PIONEER successfully learns latent representations that maximise inter-class separability.
Overall, the progressive enhancement of category separability from ESMC-based features to FC layer features reflects PIONEER’s incremental strengthening of its discriminative capability through feature extraction and fusion. These results confirm that PIONEER effectively captures the key structural information required to distinguish PE/PPE proteins.
3.5 Structural feature improves PPE/PE-PGRS protein discrimination
To further validate the importance of structural features in identifying PE/PPE family proteins, we conducted a case study on two PE-PGRS proteins from the test set: CML77305.1 and CML05348.1. Our proposed PIONEER model correctly classified both samples as PE-PGRS proteins, whereas other comparative models misclassified them. Figure 5 displays the three-dimensional structures of these proteins (left panel), alongside t-SNE visualisations based on structural features (middle panel) and sequence features (right panel).
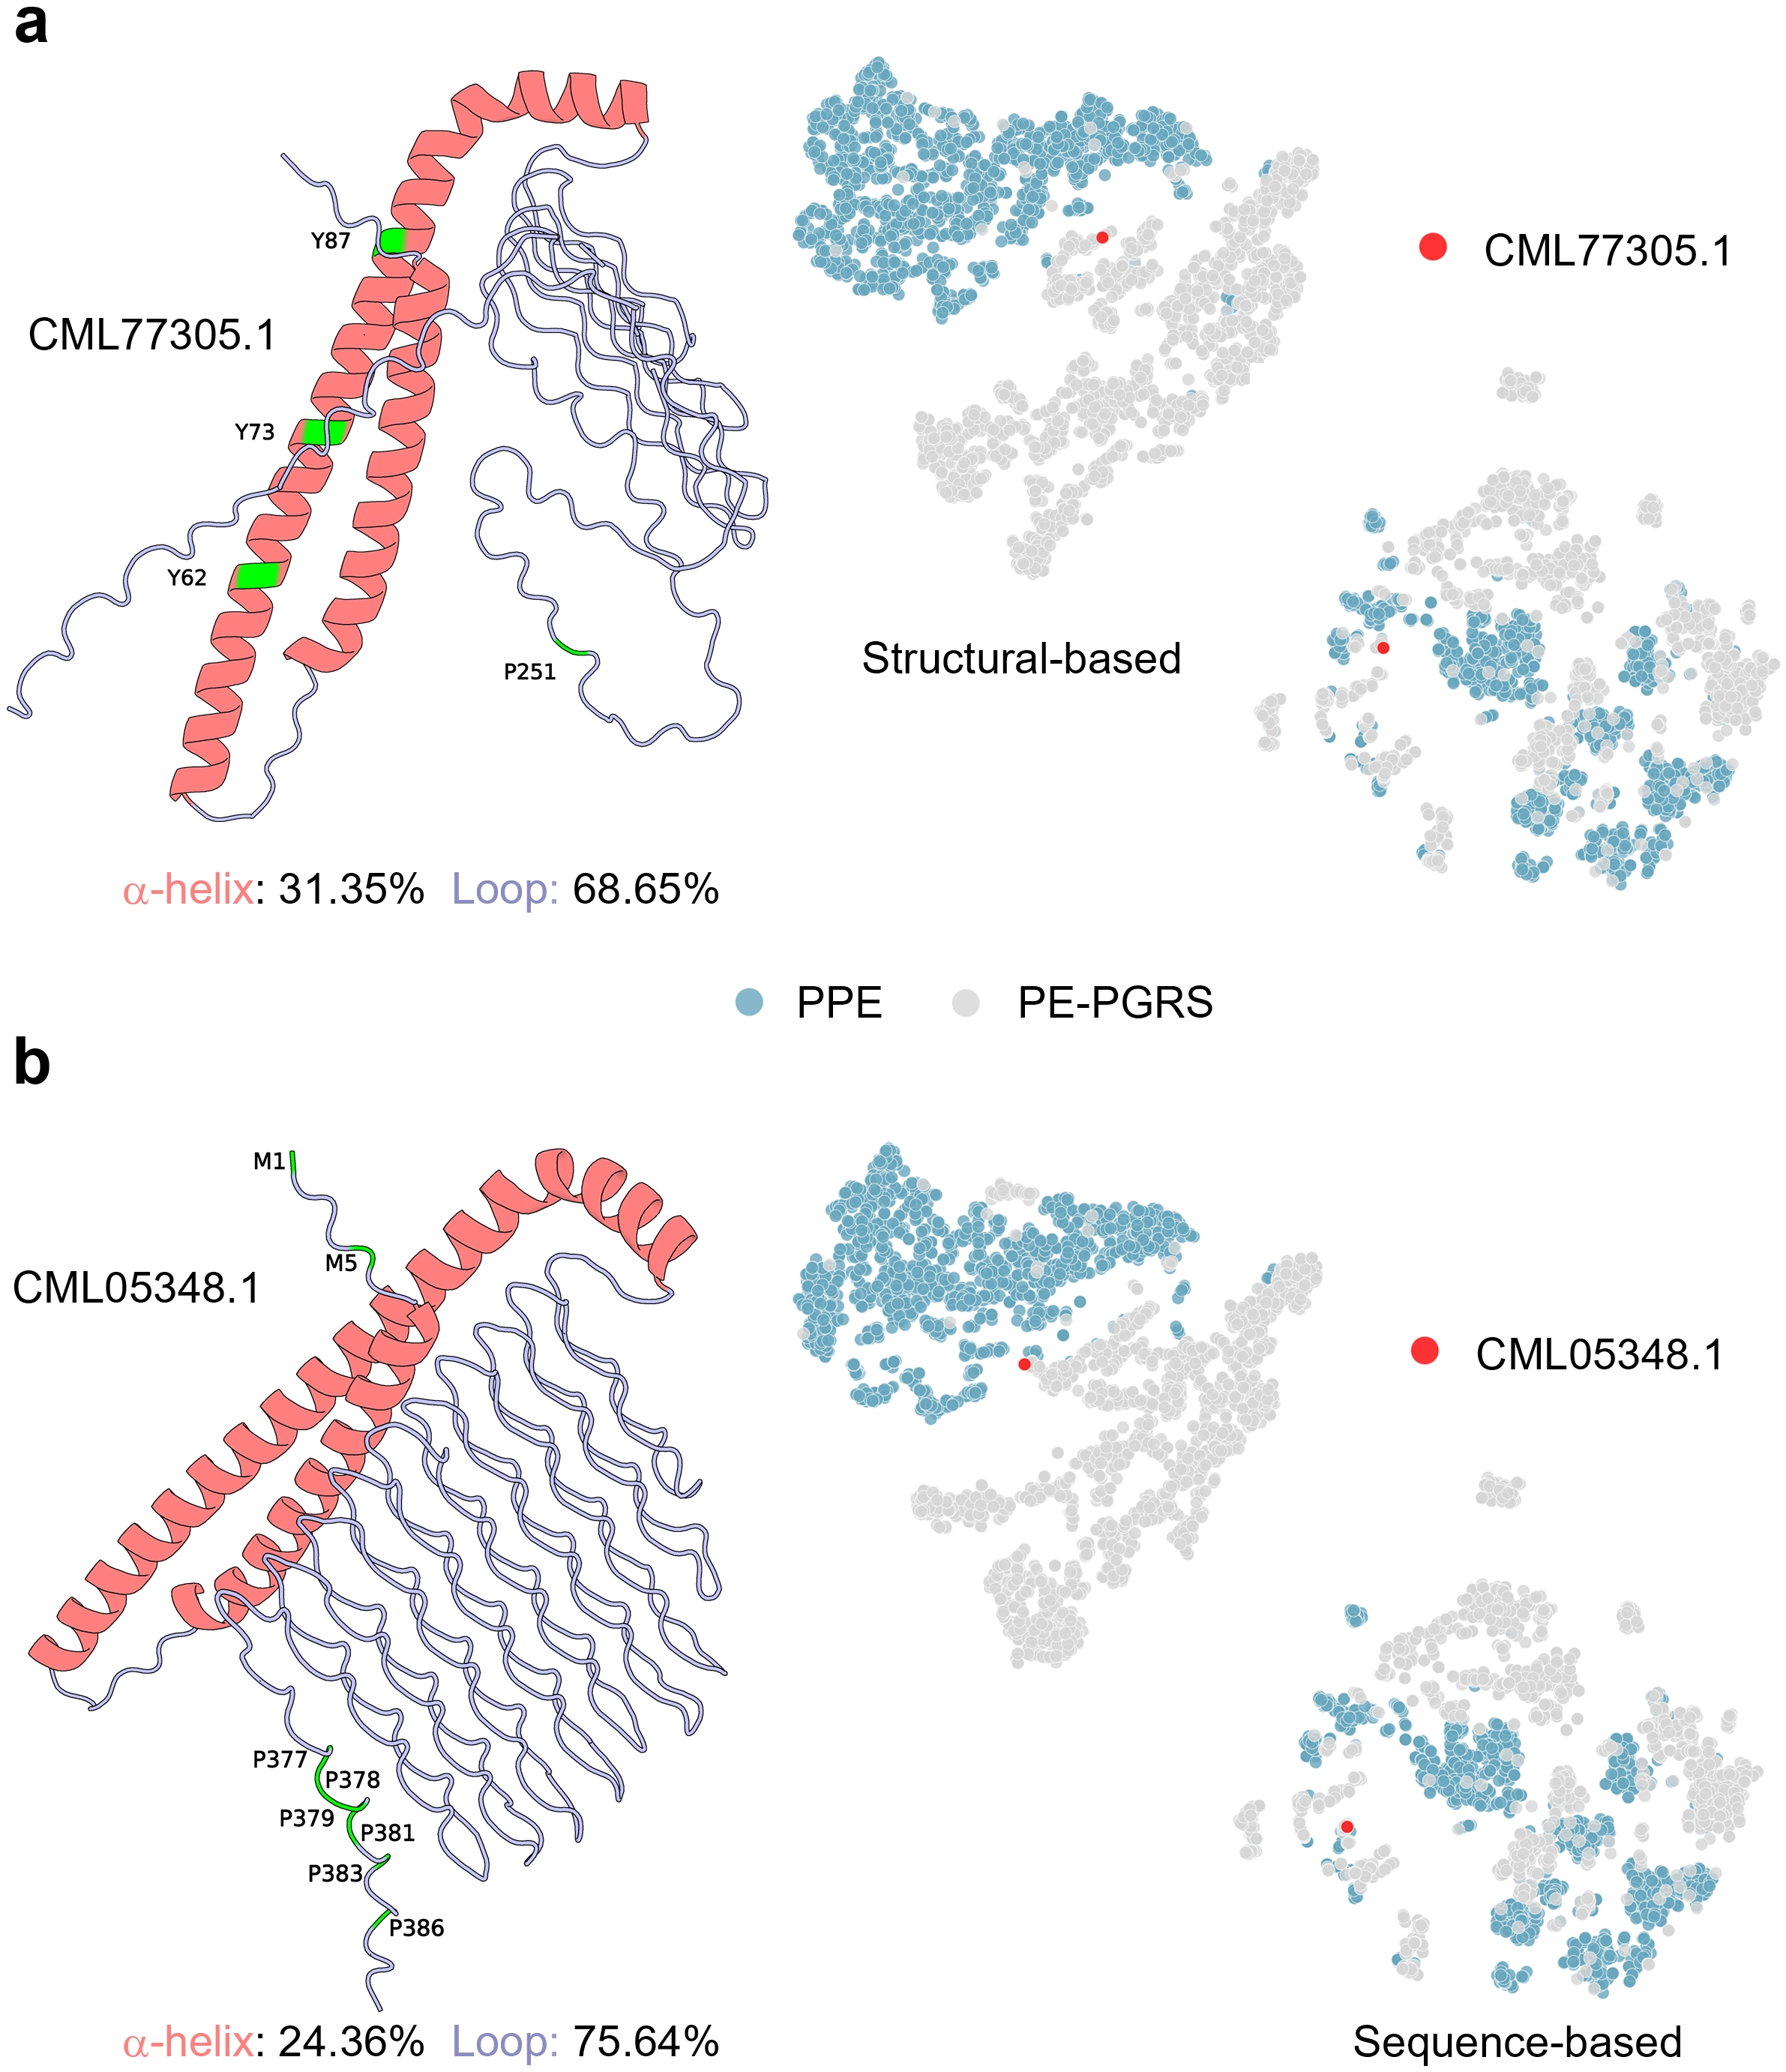
Figure 5. Case study illustrating the advantage of structure-based features in identifying PE-PGRS proteins. Examples of two representative proteins, CML77305.1 (a) and CML05348.1 (b), which were correctly classified by our model but misclassified by other approaches. Left panels show their 3D structures, where α-helices (red) and loops (purple) are indicated with corresponding proportions. Important residues are highlighted in green. Right panels display t-SNE embeddings based on structural (Structural-based) and sequence (Sequence-based) features; red dots indicate the target proteins. PE: Pro-Glu; PGRS: polymorphic GC-rich repetitive sequence; SNE: stochastic neighbor embedding; PPE: Pro-Pro-Glu.
As depicted in the structural visualisation on the left side of Figure 5, both proteins exhibit low α-helix proportions (31.35% and 24.36%, respectively) and high loop proportions (68.65% and 75.64%, respectively). This aligns with the flexible and disordered characteristics typically observed in PE-PGRS proteins (Figure 2d). In the t-SNE plot, red dots indicate the target protein’s position in the feature space. For CML77305.1 (Figure 5a), the protein is correctly clustered within the PE-PGRS region (grey cluster) in the structural feature embedding space. However, when sequence-based features are used, they are erroneously placed near the PPE cluster. Similarly, CML05348.1 (Figure 5b) is correctly clustered within the PE-PGRS cluster in the structural feature space, yet its position deviates when projected using sequence features. These results demonstrate that structural embeddings capture geometric and conformational differences difficult to represent at the sequence level, conferring a distinct advantage in distinguishing subfamilies with high sequence similarity.
To further investigate the key residues involved in model prediction, we performed a residue-level interpretability analysis. To quantify the contribution of each residue to the prediction, we applied integrated gradients (IG) to individual samples. In this approach, a zero vector was used as the baseline input, and gradients were accumulated along a path from the baseline to the actual input to compute the contribution of each residue feature to the target class output. By aggregating IG values across all feature dimensions for a given residue, a residue-level importance score was obtained. Furthermore, by separating IG scores according to feature sources, we were able to evaluate the relative contributions of sequence-based representations and structure-based features. To verify whether highly scored residues play a functional role in model predictions, we further performed residue occlusion analysis. Specifically, candidate key residues were occluded one at a time by setting their node features, residue types, and associated edge features to zero, followed by recalculating the model output. If occluding a residue led to a significant decrease in the target class score, the residue was considered to have a substantial role in model discrimination. As shown in Figure S1,S2, the case studies indicate that ESMC-based features generally contribute more strongly than DSSP-based structural features. Residue importance analysis further revealed that the C-terminal residues of CML77305.1 and CML05348.1 play critical roles in model discrimination. Among them, one of the top-ranked residues in CML77305.1, Y87, is located within the YXXXE motif, which has been reported to be associated with the ESX system[50]. Similarly, residue Y87 in CML05348.1 also shows notable importance in the model’s prediction.
In summary, this case study highlights the critical role of structure-aware modelling in identifying PPE and PE-PGRS proteins. Compared to models relying solely on sequence information, representations incorporating 3D structural features more effectively capture topological differences between protein families, significantly enhancing model robustness and generalisation capabilities. Furthermore, key residue analysis indicates that PIONEER is capable of capturing important residue information.
4. Discussion
Although PE and PPE proteins are known to contain conserved N-terminal motifs, the identification of these proteins in large-scale proteomic datasets remains challenging due to the highly repetitive sequences, high GC content, and substantial sequence polymorphism observed in these families. Traditional alignment-based approaches are often computationally intensive and may fail to detect distant homologs with low sequence similarity. In contrast, machine learning and deep learning methods can automatically learn high-level representations from raw protein sequences and structures, enabling more robust identification of complex protein families. Therefore, this study proposes a structure-aware deep learning framework, PIONEER, that integrates protein language model embeddings and spatial topological information to identify PE/PPE family proteins in M. tb. By incorporating three-dimensional structural information through EGNN, PIONEER effectively overcomes the limitations of previous sequence-based models, which primarily rely on linear sequence representations.
Comparative analyses demonstrate that PIONEER outperforms traditional machine learning and deep learning approaches in accuracy, robustness, and interpretability. The significant improvement in model performance is attributed to the integration of structural features, which capture residue-level spatial dependencies and geometric relationships. While the sequence embeddings from ESMC encode evolutionary and contextual semantics, combining them with DSSP-derived structural descriptors yields richer and more discriminative representations of protein properties. Ablation and visualisation analyses confirm that structural and sequence information are complementary, and their joint representation significantly enhances the model’s generalisation capability.
From a biological perspective, structural analysis further reveals distinct conformational preferences between PPE and PE-PGRS proteins. PPE proteins exhibit higher α-helical content and more compact folding, whereas PE-PGRS proteins display flexible structures rich in looped regions, consistent with their functional diversity and involvement in host interactions. The case study highlights that PIONEER can correctly identify proteins that are difficult to classify based on sequence similarity alone.
Despite the achievements of this study, several limitations should be acknowledged. First, the structural information used in this work is partially derived from predicted models (e.g., AlphaFold and ESMFold), which may introduce uncertainties due to potential prediction errors, particularly for proteins with flexible regions or low-confidence structures. These inaccuracies may affect the quality of the constructed structural representations and the model performance. Second, although this study focuses on the identification of PE/PPE-related proteins, it does not further distinguish finer-grained subfamilies within the PE protein family (e.g., PE-only, PE-PGRS, and PE_unique). A more detailed classification framework could provide deeper biological insights and improve the practical utility of the model. These limitations highlight directions for future work, including the incorporation of more reliable structural data and the development of models capable of finer-grained protein classification.
5. Conclusions
In summary, PIONEER provides an effective and structure-aware computational framework for identifying PE/PPE proteins in M. tb. By integrating protein language model embeddings with three-dimensional geometric learning, the proposed approach significantly improves classification accuracy and robustness while offering enhanced interpretability.
Beyond its application to PE/PPE protein identification, PIONEER represents a generalizable strategy for integrating sequence and structural information in protein prediction. By leveraging isometric geometry learning and protein language models, this study bridges the gap between structural bioinformatics and machine learning-based protein annotation. Future work will extend this framework to broader protein families and explore its applications in predicting protein-protein interactions and identifying vaccine targets for M. tb.
Supplementary materials
The supplementary material for this article is available at: Supplementary materials.
Authors contribution
Li F: Conceptualization, supervision, writing-original draft, writing review & editing.
Guo X: Conceptualization, methodology, software, investigation, writing-original draft, writing review & editing.
Liu M: Supervision, writing-original draft, writing review & editing.
Sun H: Investigation, software, writing-original draft, writing review & editing.
Hao Y, Li X, Li W: Data curation, formal analysis, writing-original draft, writing review & editing.
Conflicts of interest
Fuyi Li is an Editorial Board Member of Computational Biomedicine. The other authors declare no conflicts of interest.
Ethical approval
Not applicable.
Consent to participate
Not applicable.
Consent for publication
Not applicable.
Availability of data and materials
The benchmark dataset is collected from Uniprot (https://www.uniprot.org/) and NCBI (https://www.ncbi.nlm.nih.gov/gds). The predicted structures are downloaded from AlphaFold Protein Structure Database (https://www.alphafold.ebi.ac.uk/). The source codes are publicly available at: https://github.com/ABILiLab/PIONEER.
Funding
None.
Copyright
© The Author(s) 2026.
References
-
1. Global tuberculosis report 2025 [Internet]. Geneva: World Health Organization; 2025. Available from: https://www.who.int/teams/global-programme-on-tuberculosis-and-lung-health/tb-reports/global-tuberculosis-report-2025
-
2. An Y, Ni R, Zhuang L, Yang L, Ye Z, Li L, et al. Tuberculosis vaccines and therapeutic drug: Challenges and future directions. Mol Biomed. 2025;6:4.[DOI]
-
3. Ehtram A, Shariq M, Quadir N, Jamal S, Pichipalli M, Zarin S, et al. Deciphering the functional roles of PE18 and PPE26 proteins in modulating Mycobacterium tuberculosis pathogenesis and immune response. Front Immunol. 2025;16:1517822.[DOI]
-
4. Zhang Z, Dong L, Li X, Deng T, Wang Q. The PE/PPE family proteins of Mycobacterium tuberculosis: Evolution, function, and prospects for tuberculosis control. Front Immunol. 2025;16:1606311.[DOI]
-
5. Koleske B, Shen J, Gupta M, Bishai WR. In vivo profiling of the PE/PPE proteins of Mycobacterium tuberculosis reveals diverse contributions to virulence. Front Microbiol. 2025;16:1634229.[DOI]
-
6. Cole ST, Brosch R, Parkhill J, Garnier T, Churcher C, Harris D, et al. Deciphering the biology of Mycobacterium tuberculosis from the complete genome sequence. Nature. 1998;396(6707):190.[DOI]
-
7. Fishbein S, Van Wyk N, Warren RM, Sampson SL. Phylogeny to function: PE/PPE protein evolution and impact on Mycobacterium tuberculosis pathogenicity. Mol Microbiol. 2015;96(5):901-916.[DOI]
-
8. Hermans PW, Van Soolingen D, Van Embden JD. Characterization of a major polymorphic tandem repeat in Mycobacterium tuberculosis and its potential use in the epidemiology of Mycobacterium kansasii and Mycobacterium gordonae. J Bacteriol. 1992;174(12):4157-4165.[DOI]
-
9. Poulet S, Cole ST. Characterization of the highly abundant polymorphic GC-rich-repetitive sequence (PGRS) present in Mycobacterium tuberculosis. Arch Microbiol. 1995;163(2):87-95.[DOI]
-
10. Wang Q, Boshoff HIM, Harrison JR, Ray PC, Green SR, Wyatt PG, et al. PE/PPE proteins mediate nutrient transport across the outer membrane of Mycobacterium tuberculosis. Science. 2020;367(6482):1147-1151.[DOI]
-
11. D’Souza C, Kishore U, Tsolaki AG. The PE-PPE family of Mycobacterium tuberculosis: Proteins in disguise. Immunobiology. 2023;228(2):152321.[DOI]
-
12. Tiwari S, Dutt TS, Chen B, Chen M, Kim J, Dai AZ, et al. BCG-Prime and boost with Esx-5 secretion system deletion mutant leads to better protection against clinical strains of Mycobacterium tuberculosis. Vaccine. 2020;38(45):7156-7165.[DOI]
-
13. Musvosvi M, Huang H, Wang C, Xia Q, Rozot V, Krishnan A, et al. T cell receptor repertoires associated with control and disease progression following Mycobacterium tuberculosis infection. Nat Med. 2023;29(1):258-269.[DOI]
-
14. Ates LS. New insights into the mycobacterial PE and PPE proteins provide a framework for future research. Mol Microbiol. 2020;113(1):4-21.[DOI]
-
15. Ahmad J, Farhana A, Pancsa R, Arora SK, Srinivasan A, Tyagi AK, et al. Contrasting function of structured N-terminal and unstructured C-terminal segments of Mycobacterium tuberculosis PPE37 protein. MBio. 2018;9:e01712-e01717.[DOI]
-
16. Li F, Guo X, Xiang D, Pitt ME, Bainomugisa A, Coin LJM. Computational analysis and prediction of PE_PGRS proteins using machine learning. Comput Struct Biotechnol J. 2022;20:662-674.[DOI]
-
17. Li F, Guo X, Bi Y, Jia R, Pitt ME, Pan S, et al. Digerati–A multipath parallel hybrid deep learning framework for the identification of mycobacterial PE/PPE proteins. Comput Biol Med. 2023;163:107155.[DOI]
-
18. Ye J, McGinnis S, Madden TL. BLAST: Improvements for better sequence analysis. Nucleic Acids Res. 2006;34:W6-W9.[DOI]
-
19. Potter SC, Luciani A, Eddy SR, Park Y, Lopez R, Finn RD. HMMER web server: 2018 update. Nucleic Acids Res. 2018;46:W200-W204.[DOI]
-
20. Steinegger M, Meier M, Mirdita M, Vöhringer H, Haunsberger SJ, Söding J. HH-suite3 for fast remote homology detection and deep protein annotation. BMC Bioinform. 2019;20:473.[DOI]
-
21. Guo X, Ran Z, Li F. Kinase–inhibitor binding affinity prediction with pretrained graph encoder and language model. Brief Bioinform. 2025;26(4):bbaf338.[DOI]
-
22. Satorras VG, Hoogeboom E, Welling M. E(n) equivariant graph neural networks. In: Proceedings of the 38th International Conference on Machine Learning; 2021 Jul 18-24; Virtual Event: PMLR; 2021. p. 9323-9332.[DOI]
-
23. Ran Z, Guo X, Pan T, Bi Y, Hao Y, Sun H, et al. A scalable equivariant graph network framework for precise protein function prediction. Genome Biol. 2025;26:407.[DOI]
-
24. Roche R, Moussad B, Shuvo MH, Bhattacharya D. E(3) equivariant graph neural networks for robust and accurate protein-protein interaction site prediction. PLoS Comput Biol. 2023;19(8):e1011435.[DOI]
-
25. Boadu F, Cao H, Cheng J. Combining protein sequences and structures with transformers and equivariant graph neural networks to predict protein function. Bioinformatics. 2023;39:i318-i325.[DOI]
-
26. Dhakal A, Gyawali R, Cheng J. Predicting protein-ligand binding structure using E(n) equivariant graph neural networks. BioRxiv 552202 [Preprint]. 2023.[DOI]
-
27. ESM Cambrian: Revealing the mysteries of proteins with unsupervised learning [Internet]. New York: EvolutionaryScale; 2024. Available from: https://www.evolutionaryscale.ai/blog/esm-cambrian
-
28. Hayes T, Rao R, Akin H, Sofroniew NJ, Oktay D, Lin Z, et al. Simulating 500 million years of evolution with a language model. Science. 2025;387(6736):850-858.[DOI]
-
29. O’Leary NA, Wright MW, Brister JR, Ciufo S, Haddad D, McVeigh R, et al. Reference sequence (RefSeq) database at NCBI: Current status, taxonomic expansion, and functional annotation. Nucleic Acids Res. 2016;44:D733-D745.[DOI]
-
30. Consortium TU. UniProt: A worldwide hub of protein knowledge. Nucleic Acids Res. 2019;47:D506-D515.[DOI]
-
31. Fu L, Niu B, Zhu Z, Wu S, Li W. CD-HIT: Accelerated for clustering the next-generation sequencing data. Bioinformatics. 2012;28(23):3150-3152.[DOI]
-
32. Varadi M, Anyango S, Deshpande M, Nair S, Natassia C, Yordanova G, et al. AlphaFold Protein Structure Database: Massively expanding the structural coverage of protein-sequence space with high-accuracy models. Nucleic Acids Res. 2022;50:D439-D444.[DOI]
-
33. Lin Z, Akin H, Rao R, Hie B, Zhu Z, Lu W, et al. Evolutionary-scale prediction of atomic-level protein structure with a language model. Science. 2023;379(6637):1123-1130.[DOI]
-
34. Gider V, Budak C. A physics-informed graph neural network to approximate docking-based binding affinity for DYRK2 in Alzheimer’s drug repurposing. Sci Rep. 2026;16:8357.[DOI]
-
35. Liu H, Jian Y, Zeng C, Zhao Y. RNA-protein interaction prediction using network-guided deep learning. Commun Biol. 2025;8:247.[DOI]
-
36. Zhang X, Yin H, Ling F, Zhan J, Zhou Y. SPIN-CGNN: Improved fixed backbone protein design with contact map-based graph construction and contact graph neural network. PLoS Comput Biol. 2023;19(12):e1011330.[DOI]
-
37. Song Y, Yuan Q, Zhao H, Yang Y. Accurately identifying nucleic-acid-binding sites through geometric graph learning on language model predicted structures. Brief Bioinform. 2023;24(6):bbad360.[DOI]
-
38. Paszke A, Gross S, Massa F, Lerer A, Bradbury J, Chanan G, et al. PyTorch: An imperative style, high-performance deep learning library. In: Wallach H, Larochelle H, Beygelzimer A, d’Alché-Buc F, Fox E, Garnett R, editors. Advances in neural information processing systems. San Diego: NeurIPS Foundation; 2019. p. 8024.[DOI]
-
39. Kingma DP, Ba J. Adam: A method for stochastic optimization. arXiv:1412.6980 [Preprint]. 2014.[DOI]
-
40. Chen R, Li F, Guo X, Bi Y, Li C, Pan S, et al. ATTIC is an integrated approach for predicting A-to-I RNA editing sites in three species. Brief Bioinform. 2023;24(3):bbad170.[DOI]
-
41. Li F, Wang C, Guo X, Akutsu T, Webb GI, Coin LJM, et al. ProsperousPlus: A one-stop and comprehensive platform for accurate protease-specific substrate cleavage prediction and machine-learning model construction. Brief Bioinform. 2023;24(6):bbad372.[DOI]
-
42. Kabsch W, Sander C. Dictionary of protein secondary structure: Pattern recognition of hydrogen-bonded and geometrical features. Biopolymers. 1983;22(12):2577-2637.[DOI]
-
43. Xie Y, Zhou Y, Liu S, Zhang XL. PE_PGRS: Vital proteins in promoting mycobacterial survival and modulating host immunity and metabolism. Cell Microbiol. 2021;23(3):e13290.[DOI]
-
44. Chakrabarty B, Parekh N. NAPS: Network analysis of protein structures. Nucleic Acids Res. 2016;44:W375-W382.[DOI]
-
45. Giuliani A, Krishnan A, Zbilut J, Tomita M. Proteins as networks: Usefulness of graph theory in protein science. Curr Protein Pept Sci. 2008;9(1):28-38.[DOI]
-
46. Maćkiewicz A, Ratajczak W. Principal components analysis (PCA). Comput Geosci. 1993;19(3):303-342.[DOI]
-
47. Ali M. PyCaret: An open source, low-code machine learning library in Python. Version 1.0 [Software]. 2020. Available from: https://pycaret.gitbook.io/docs?utm_source=chatgpt.com
-
48. Jing B, Eismann S, Suriana P, Townshend RJL, Dror R. Learning from protein structure with geometric vector perceptrons. arXiv:2009.01411 [Preprint]. 2020.[DOI]
-
49. Van der Maaten L, Hinton G. Visualizing data using t-SNE. J Mach Learn Res. 2008;9(11):2579-2605. Available from: https://www.jmlr.org/papers/volume9/vandermaaten08a/vandermaaten08a.pdf
-
50. Daleke MH, Van der Woude AD, Parret AHA, Ummels R, de Groot AM, Watson D, et al. Specific chaperones for the type VII protein secretion pathway. J Biol Chem. 2012;287(38):31939-31947.[DOI]
Copyright
© The Author(s) 2026. This is an Open Access article licensed under a Creative Commons Attribution 4.0 International License (https://creativecommons.org/licenses/by/4.0/), which permits unrestricted use, sharing, adaptation, distribution and reproduction in any medium or format, for any purpose, even commercially, as long as you give appropriate credit to the original author(s) and the source, provide a link to the Creative Commons license, and indicate if changes were made.
Publisher’s Note
Science Exploration remains a neutral stance on jurisdictional claims in published
maps
and institutional affiliations. The views expressed in this article are solely those
of
the author(s) and do not reflect the opinions of the Editors or the publisher.
Share And Cite


Science Exploration Style
Sun H, Guo X, Hao Y, Li X, Li W, Liu M, et al. PIONEER: A structure-informed graph neural network for PE/PPE protein identification. Comput Biomed. 2026;1:202608. https://doi.org/10.70401/cbm.2026.0016
Tips
Copy completed.
Submit a Manuscript
Author Instructions
Cite this Article
Article Metrics
0
View
0
Download
Cited
Article Updates

Science Exploration Style
Sun H, Guo X, Hao Y, Li X, Li W, Liu M, et al. PIONEER: A structure-informed graph neural network for PE/PPE protein identification. Comput Biomed. 2026;1:202608. https://doi.org/10.70401/cbm.2026.0016
copy
Share Link
copy