Sequence-based HLA genotyping identifies six candidate alleles associated with human longevity in Germans

Nicolás Mendoza-Mejía

Daniel Kolbe
Onur Özer
Janina Dose
Guillermo G. Torres
Andre Franke
Almut Nebel
*
*Correspondence to:
Almut Nebel, Institute of Clinical Molecular Biology, Kiel University, Kiel 24105, Germany.
E-mail: a.nebel@mucosa.de
Geromedicine. 2026;2:202619. 10.70401/Geromedicine.2026.0039
Received: March 25, 2026Accepted: September 11, 2026Published: September 11, 2026
Abstract
Aims: Human leukocyte antigen (HLA) polymorphism influences immunity by balancing protection against pathogens with the preservation of self-tolerance. This balance has been proposed to affect longevity, and associations with HLA variants have been reported. However, studies in this field have often yielded inconsistent findings due to small sample sizes and low-resolution genotyping methods. We aimed to identify HLA alleles linked to longevity while overcoming these previous limitations.
Methods: We performed high-resolution HLA genotyping using targeted sequencing (HLA-seq) in 1,265 long-lived individuals (long-lived individuals (LLI); ≥ 94 years) from Germany and compared their HLA allele frequencies with those of a large control population of 3.4 million individuals from the German Bone Marrow Donor Registry (DKMS) using χ2 (chi-square) tests.
Results: Six HLA alleles were significantly associated with longevity. Of those, two exhibited the most robust associations: A*01:01g (odds ratio (OR) = 0.87; 95% confidence interval (CI): 0.80-0.95; adj. P = 0.02) and DRB1*13:02g (OR = 1.24; 95% CI: 1.10-1.41; P = 0.01). DRB1*13:02g was replicated in the UK Biobank after Bonferroni correction, whereas A*01:01g showed directionally concordant nominal support but did not remain significant after multiple-testing correction.
Conclusion: Both DRB1*13:02g and A*01:01g have previously been implicated in dementia-related phenotypes. These observations support the hypothesis that HLA variation may influence longevity partly through pathways linked to neurodegeneration. This study provides a high-resolution (2-field) HLA dataset for a longevity cohort, which should be valuable for future investigations.
Keywords
Longevity, autoimmunity, healthy aging, human leukocyte antigen, dementia, neuroinflammation, viral infections
1. Introduction
The human leukocyte antigen (HLA) system comprises a group of genes that encode molecules involved in the recognition of foreign peptides, the first step in initiating an adaptive immune response. The high degree of polymorphism in HLA genes causes substantial variation in peptide-binding capacity across individuals[1]. This diversity leads to differences in immune competence that can influence survival, especially in late life[2]. In the context of human longevity, studies over the past decades have investigated the effects of HLA variability[3], first using antibody-based serological assays[3,4] and later DNA tests[5-7]. Research in the 1990s compared the frequencies of serotypes between elderly (aged > 60 years) and younger individuals[3]. Serotypes are a classification of HLA molecules based on their antibody-mediated recognition. These early studies often yielded contradictory results, primarily due to methodological constraints such as small sample sizes, the relatively young age of cases and the low-resolution of the serotyping method[3]. This technique is by design restricted to 1-field resolution, since it can only recognise groups of alleles (e.g., HLA-A*01) but is unable to distinguish specific alleles at 2-field resolution (e.g., HLA-A*01:01 vs. HLA-A*01:02), which define specific HLA proteins. With the advent of high-throughput DNA technologies, studies have progressed to genome-wide association approaches, which have identified three single-nucleotide polymorphisms (SNPs) in the HLA region associated with longevity[5-7]. Nevertheless, these findings have not been replicated, and because the SNPs are not known to tag specific HLA alleles or haplotypes, they cannot be linked to functionally relevant HLA variants.
Previously, we improved resolution by imputing HLA alleles from SNP panels, revealing a male-specific effect of an HLA allele (HLA-DRB1*15:01) on longevity[8]. This finding was observed in three northern European populations, suggesting that methods capable of differentiating individual HLA alleles can provide robust and more generalisable results. This imputation approach is only powerful when a tag SNP exists for a given allele, which was the case for DRB1*15:01, but is otherwise less accurate. A much more reliable method to obtain high-resolution alleles is sequence-based typing (SBT), which is used in critical applications such as bone marrow transplant compatibility testing[9]. Notably, one study using SBT reported a higher prevalence of HLA alleles with superior binding affinity against human endogenous retrovirus K (HERV-K) peptides in individuals from the United States aged 90 years and older compared to younger controls[10]. This finding highlights that certain alleles may promote a longer lifespan by reducing infection-related mortality through enhanced immune clearance. However, this study included only 22 nonagenarians, and the observed HLA allele frequency differences were only nominally significant.
To overcome the two main limitations of earlier studies, i.e., small sample sizes and low-resolution HLA typing, we performed an association study of high-resolution HLA alleles from a large German longevity sample. Long-lived individuals (LLI) were defined as those aged 94 years or older, placing them within the top 5% of survivors of their birth cohorts. HLA alleles from 1,265 German LLI were obtained by applying SBT to HLA-targeted sequencing (HLA-seq) data. The allele frequencies were then compared with those from the German Bone Marrow Donor Registry (Deutsche Knochenmarkspenderdatei; DKMS), which includes data from 3.4 million individuals genotyped with a comparable SBT technique. This approach, combining extensive and well-defined cohorts with high-resolution typing, represents the most comprehensive analysis of HLA and longevity to date and thus provides a unique resource for future investigations.
2. Methods and Materials
2.1 Study population
The study population consisted of 1,265 German LLI. Individuals were considered long-lived if they were 94 years or older, a threshold that corresponds to the 95th percentile of the age-at-death distribution in their birth cohorts. The mean age at recruitment was 98.8 years (range: 94-110 years). This group included 562 centenarians and had an overall female-to-male ratio of 2.64:1. Key recruitment criteria for LLI included the absence of overt signs of major age-related diseases and generally good physical and mental health. More details on this cohort can be found in a prior study[11]. HLA-seq data from 200 of these LLI were previously published in a study by our group[8].
Written informed consent was obtained from all LLI, and the project, including the recruitment protocol, was approved by the Ethics Committee of the Medical Faculty of Kiel.
Individuals from the DKMS served as a control population[9]. This cohort comprised a total of 3,456,066 unrelated volunteer donors of self-reported German descent, recruited between 18 and 55 years of age. This donor pool exhibits a distinct age distribution with a higher representation of younger individuals (18-35 years), since the number of registered donors generally declines with increasing age[12]. This skewed demographic reflects the preference for donors younger than 35 years of age[13].
2.2 HLA genotyping
2.2.1 HLA genotyping in controls
The HLA genotype data from 3,456,066 DKMS donors were obtained from the DKMS registry. These alleles were called using an established high-resolution molecular typing protocol detailed previously[9]. Briefly, typing focused on HLA-A, -B, -C, -DRB1, -DQB1, and -DPB1 loci. A targeted amplicon-based next-generation sequencing (NGS) method was used, aiming at exons 2 and 3 for HLA class I genes and exon 2 for class II genes. Notably, both LLI and DKMS datasets were generated using NGS-SBT, rendering them suitable for comparative statistical analysis of HLA allele frequencies.
2.2.2 HLA sequencing of cases
To obtain highly accurate HLA genotypes for LLI, SBT of eight HLA loci (HLA-A, -B, -C, -DRB1, -DQA1, -DQB1, -DPA1, and -DPB1) was performed. This approach was chosen for its superior specificity and sensitivity compared to serological methods or HLA allele imputation. Genomic DNA was extracted from peripheral blood samples of 1,289 LLI using the QIAamp DNA Blood Mini Kit (Qiagen, Hilden, Germany) following the manufacturer’s instructions.
High-resolution HLA typing was performed using a targeted NGS method as described previously[14]. Briefly, genomic DNA was randomly fragmented, followed by DNA library preparation with the NEBNext® Ultra™ DNA Library Prep Kit for Illumina® (New England Biolabs, Ipswich, MA, USA). A custom biotinylated RNA bait (myBaits Custom 1-20K; BioCat GmbH, Heidelberg, Germany) was used for HLA target enrichment. The enriched DNA was sequenced on the Illumina NovaSeq 6,000 platform (2 × 150 bp read length) at the Competence Centre for Genome Analysis Kiel (CCGA Kiel).
2.2.3 Genotyping of cases
HLA alleles were called from sequencing reads using an established in-house pipeline (https://github.com/ikmb/hla), which integrates five well-known SBT software packages specialised in HLA genotyping: HLA-HD, xHLA, HLAscan, Optitype and Hisat. Given that Optitype supports only class I typing, class II alleles were called using the remaining four tools. Notably, integrating results from multiple typing tools is challenging because different tools often report alleles at varying resolutions, incompatible abundance scores, and sometimes more than two alleles per locus. These inconsistencies obscure the true diploid genotype. To reconcile the outputs from the five HLA genotyping tools, we developed a novel consensus algorithm, publicly available as the command-line tool called alleleTools (https://github.com/nmendozam/alleleTools). The algorithm employs a search tree, a hierarchical data structure composed of nodes connected by branches, to model the nested structure of HLA allele nomenclature. In this context, the root of the tree is the gene (e.g., HLA-A), and each subsequent level represents an increasing field of resolution. The algorithm operates in three steps as illustrated in Figure S1. The process begins by constructing the tree, where solution trees are built from the reported alleles of each genotyping tool (Figure S1A,B). Every path from the root to a node represents a specific allele call (e.g., A*01:01 is represented by a single path A→01→01). These individual trees are then merged into a single unified tree (Figure S1C). Each node in this merged tree tracks how many tools support that specific allele call. Finally, the algorithm performs consensus calling, traversing the unified tree to identify a pair of high-resolution alleles that meet a user-defined threshold. For instance, in this study, we set the threshold at 0.6, because it represents the minimum value for a majority agreement. Therefore, alleles are required to be supported by at least 60% of genotyping tools (i.e., 3 out of 5) to be considered in the final diploid genotype (Figure S1D).
For each locus, the alleles which were reported by most algorithms were assigned. This approach enhances reliability, as consistent results across multiple tools are more likely to reflect the correct allele[15]. After obtaining the consensus alleles, we applied further quality control by excluding genotypes from any gene with a sequencing coverage below 25x, using the --min_coverage flag from alleleTools. Any sample with more than eight missing alleles was excluded from subsequent analysis. Alleles were then truncated to 2-field resolution and grouped by HLA g-groups to match those reported by the DKMS. This process yielded HLA genotypes at 2-field resolution for 1,265 LLI, which were used in the association analysis.
2.3 Haplotype estimation
Hapl-o-Mat was used to estimate haplotype frequencies in LLI, ensuring comparability with the DKMS control dataset, which was previously analysed with the same method[9]. The threshold for stopping the algorithm was set to ε = 10-8.
2.4 Association analysis
Allele frequency distributions between cases and controls were compared using the χ2 (chi-square) test, with Bonferroni correction applied where appropriate. To ensure sufficient statistical power, only alleles with a frequency greater than 5% in LLI were included. Associations were considered significant if the adjusted P-value was below 0.05.
To evaluate the results, we generated a quantile-quantile (QQ) plot to visualise the distribution of P-values across the tested alleles. While not a formal test, the QQ plot provides a useful way to assess deviation from the expected null distribution, as true associations are expected to appear as outliers. For the haplotype analysis, associations were tested using Fisher’s exact test due to the lower frequency of haplotypes.
2.5 Sex-stratified analysis
To evaluate whether the significant associated alleles (adjusted P < 0.05, n = 6) exhibited sex-specific effects, allele frequencies were analysed separately for long-lived males and long-lived females. Odds ratios (ORmales and ORfemales) and their corresponding 95% confidence intervals were calculated using the overall population control dataset as a shared reference. To formally test whether the magnitude of effect significantly differed between biological sexes, we performed the Breslow-Day test for homogeneity of odds ratios (H0: ORmales = ORfemales). To control the family-wise Type I error rate, nominal P-values from the sex-specific analyses were independently adjusted for multiple testing across the six candidate alleles using Bonferroni correction, with an adjusted P < 0.05 considered statistically significant.
Because sex-stratified allele counts were unavailable for the reference control cohort, the aggregate population frequency was used as a shared baseline for both male and female case groups. This analytical framework assumes that baseline HLA allele frequencies in the general population do not differ systematically by sex. This assumption is grounded in three well-established biological and empirical considerations. First, given that HLA genes are autosomal (not sex-linked), both sexes inherit them equally from both parents. Second, no sex differences have been reported in adult European populations, such as the French[4]. Likewise, a bone marrow registry from Saudi Arabia and a study on 2,000 Korean adults reported no significant differences in HLA frequencies between males and females[16,17]. Third, a study of 1,000 Korean newborns found no significant differences[16], indicating that there is no sex-specific in utero selection of HLA alleles. Overall, considering these points and given that the DKMS did not report any sex-based differences in allele frequencies, we assume that no substantial differences exist and therefore consider the reported allele frequencies suitable for sex-stratified analysis in our dataset.
2.6 Tag SNP analysis
To assess whether subtle ancestry differences between cases and controls could confound the observed HLA allele associations with longevity, we performed an additional analysis using a high-density SNP dataset where global ancestry could be modeled. This was necessary because the HLA-seq data are restricted to the MHC region, providing insufficient genomic coverage for ancestry inference. To that end, we used an Immunochip (Illumina, Inc., CA) dataset from a population consisting of 1,463 unrelated German LLI and 6,464 geographically matched younger controls, which was published in a previous study[18]. The LLI had a mean age at recruitment of 99.0 years (range: 94-110 years, > 95th age-at-death percentile of birth cohort), including 695 centenarians, with an overall female-to-male ratio of 2.75:1. Out of these 1,463, 981 LLI overlapped with the cases from the HLA-seq cohort. The younger control group had a mean age of 57.2 years (range: 18-83 years) with a female-to-male ratio of 1.05:1. To ensure a population-representative sample, the inclusion of controls was not based on the presence or absence of any specific disease[11]. Quality control was performed using the R package plinkQC[19]. Individuals were removed based on missing genotype rate (> 0.03), heterozygosity rates (-5 > Z > 3), and relatedness (identity-by-descent > 0.18). To account for population stratification, we performed principal component analysis (PCA) on the full ImmunoChip SNP set (anchored with HapMap 3 as the reference population and excluding high linkage disequilibrium [LD] regions). Individuals with divergent ancestry were also excluded.
Subsequently, we extracted three specific tag SNPs as proxies for the associated HLA alleles: rs1611635(T) for A*01:01, rs16899214(C) for C*12:03, and rs28375404(T) for DRB1*13:02. rs1611635(T) was previously reported as a tag SNP for A*01:01[20], while rs16899214(C) and rs28375404(T) were estimated to be in high LD with C*12:03 and DRB1*13:02 based on measurements taken from the CEU population of the 1,000 Genomes Project[21]. Associations between these tag SNPs and longevity were tested via logistic regression under an additive genetic model, using the top three principal components (PCs) derived from the PCA of the quality control stage as covariates to adjust for subtle population structure. The appropriate number of PCs was determined with the scree plot method.
2.7 Replication in the UK Biobank
To replicate the significant associations observed in the German cohort, imputed HLA alleles from the UK Biobank were used. For each inferred allele, this database reports the output of HLA:IMP*02 as the weighted sum of absolute posterior probabilities Q = P (A1|D) + 2* P(A2|D, A1). Given that Q is mathematically equivalent to the imputed allele dosage ranging from 0 to 2, individuals were considered homozygous if they carried an allele with Q > 1.4. Additionally, following the recommendations available in the notes for researchers (biobank.ctsu.ox.ac.uk/ukb/ukb/docs/HLA_imputation.pdf), alleles with Q ≤ 0.7 were excluded from the analysis. Finally, as a validation step, we verified that all individuals classified as homozygous for a specific allele did not carry a second allele in the same locus with Q > 0.7.
Parental age at death was used to classify children of long- and non-long-lived parents. Since offspring of long-lived parents inherit a combination of genetic variants that enabled their parents to achieve longevity, they tend to live longer than offspring of shorter-lived parents and show a lower incidence of age-related diseases[22]. Therefore, parental longevity has been employed as a valuable proxy for studying healthy aging in several prior studies[5,6]. We analysed the distribution of the ages at which parents died and defined 95 years of age (99th percentile) as the threshold for parental longevity (Figure S2). Hence, individuals with at least one parent older than 95 years (long-lived parents) were defined as cases. Controls were defined as individuals whose parents both died between 40 and 90 years of age. In contrast, individuals whose parents had an unknown age at death or died before 40 years were excluded to reduce the influence of non-natural causes of death, such as accidents and war, as in previous longevity studies[5]. A logistic regression model was used to replicate prior findings. To ensure sufficient statistical power, alleles with a frequency of 5% or below were excluded. We adjusted for the first three principal components to correct for population stratification. Associations were considered significant if the P-value was below 0.05.
Additionally, to account for artifacts arising from HLA imputation, rs1611635(T) was again used as a tag SNP for A*01:01g, and rs28375404(T) for DRB1*13:02g. SNP genotype data were extracted from the same set of individuals included in the HLA-based association analysis. Association testing and correction for population stratification were performed using the same logistic regression framework as described above.
2.8 Comparison of HLA repertoire sizes
Based on the results of the association analysis described above, we investigated whether the associations with longevity might be mediated by susceptibility to pathogenic infections. This analysis was motivated by previous evidence suggesting that allele-specific differences in immune responses to viral pathogens may contribute to the influence of HLA variation on lifespan[10]. Given that a narrower HLA repertoire of binding peptides could potentially limit the immune responsiveness, we compared repertoire sizes between the significantly associated allele and all other alleles of the same locus. To that end, qualitative peptide–HLA binding data were obtained from the Immune Epitope Database (IEDB), which collects results of in vitro assays. Our analysis focused exclusively on HLA class I molecules, as they primarily present virus-derived peptides. To ensure statistical robustness, we excluded loci with low experimental coverage (< 1,000 reported assays), such as HLA-C. Subsequently, reports were clustered by source species of the epitope for each locus. To ensure sufficient coverage, only species with more than one thousand binding assays were analysed.
For each species, qualitative binding outcomes were visualised using stacked bar plots, contrasting results for A*01:01 with those for all other HLA-A alleles combined. Binding outcomes were then grouped into two categories: binding (positive-high, positive-medium, and positive) and low/non-binding (low-positive and negative). Differences in the proportion of low/non-binding peptides between A*01:01 and other HLA-A alleles were assessed for each viral species using Fisher’s exact test. Results were corrected for multiple testing using Bonferroni correction.
3. Results
We generated HLA genotypes for 1,265 LLI using targeted sequencing and an in-house pipeline that integrated five SBT tools. The consensus of their calls provided high-confidence HLA alleles at 2-field resolution, covering three HLA class I genes (A, B, and C) and five class II genes (DRB1, DQA1, DQB1, DPA1, and DPB1). To ensure compatibility with the DKMS control dataset, alleles were clustered into g-groups, which are sets of HLA alleles, denoted by a -g suffix that encode the same antigen-binding domain[23]. The allele calling rate was high, with an average of 15 alleles identified per individual out of a possible 16. This high success rate reflects the efficiency of the genotyping protocol across the targeted loci. A detailed breakdown of allele counts per gene is provided in Supplementary Table S1. Allele frequencies in LLI were estimated and contrasted with χ2 tests against those of the control group (Table S2).
3.1 Six alleles showed associations with longevity
Association tests revealed six HLA alleles with significantly different frequencies between German LLI and the DKMS control population after correcting for multiple testing (Table 1). These signals diverged markedly from the null expectation in a QQ plot, each falling well above the 95% confidence band (Figure 1). In contrast, the remaining test results (Table S3) aligned tightly with the diagonal despite the size of the control group.
Table 1. HLA alleles significantly associated with longevity.
| Allele | HLA class | Odds ratio | Adjusted P-value | Tag SNP | Odds ratio | Adjusted P-value |
| A*01:01g | I | 0.88 (0.81-0.95) | 2.33 × 10⁻² | rs1611635(T) | 0.86 (0.77-0.97) | 0.04 |
| C*12:03g | I | 1.25 (1.12-1.39) | 1.44 × 10⁻³ | rs16899214(C) | 0.86 (0.77-0.97) | 0.04 |
| DRB1*04:01g | II | 1.19 (1.08-1.31) | 7.28 × 10⁻³ | - | - | - |
| DRB1*13:02g | II | 1.24 (1.10-1.41) | 1.74 × 10⁻² | rs28375404(T) | 1.29 (0.94-1.36) | 0.58 |
| DPB1*03:01g | II | 0.82 (0.74-0.90) | 6.19 × 10⁻⁴ | - | - | - |
| DPB1*04:01g | II | 1.10 (1.04-1.16) | 1.93 × 10⁻² | - | - | - |
Summary statistics from χ2 association tests for the six alleles showing significant frequency differences between LLI and controls after Bonferroni correction for multiple testing. Available tag SNPs are listed; alleles without a reliable tag SNP are indicated by “-”. HLA: human leukocyte antigen; SNP: single-nucleotide polymorphism; LLI: long-lived individuals.
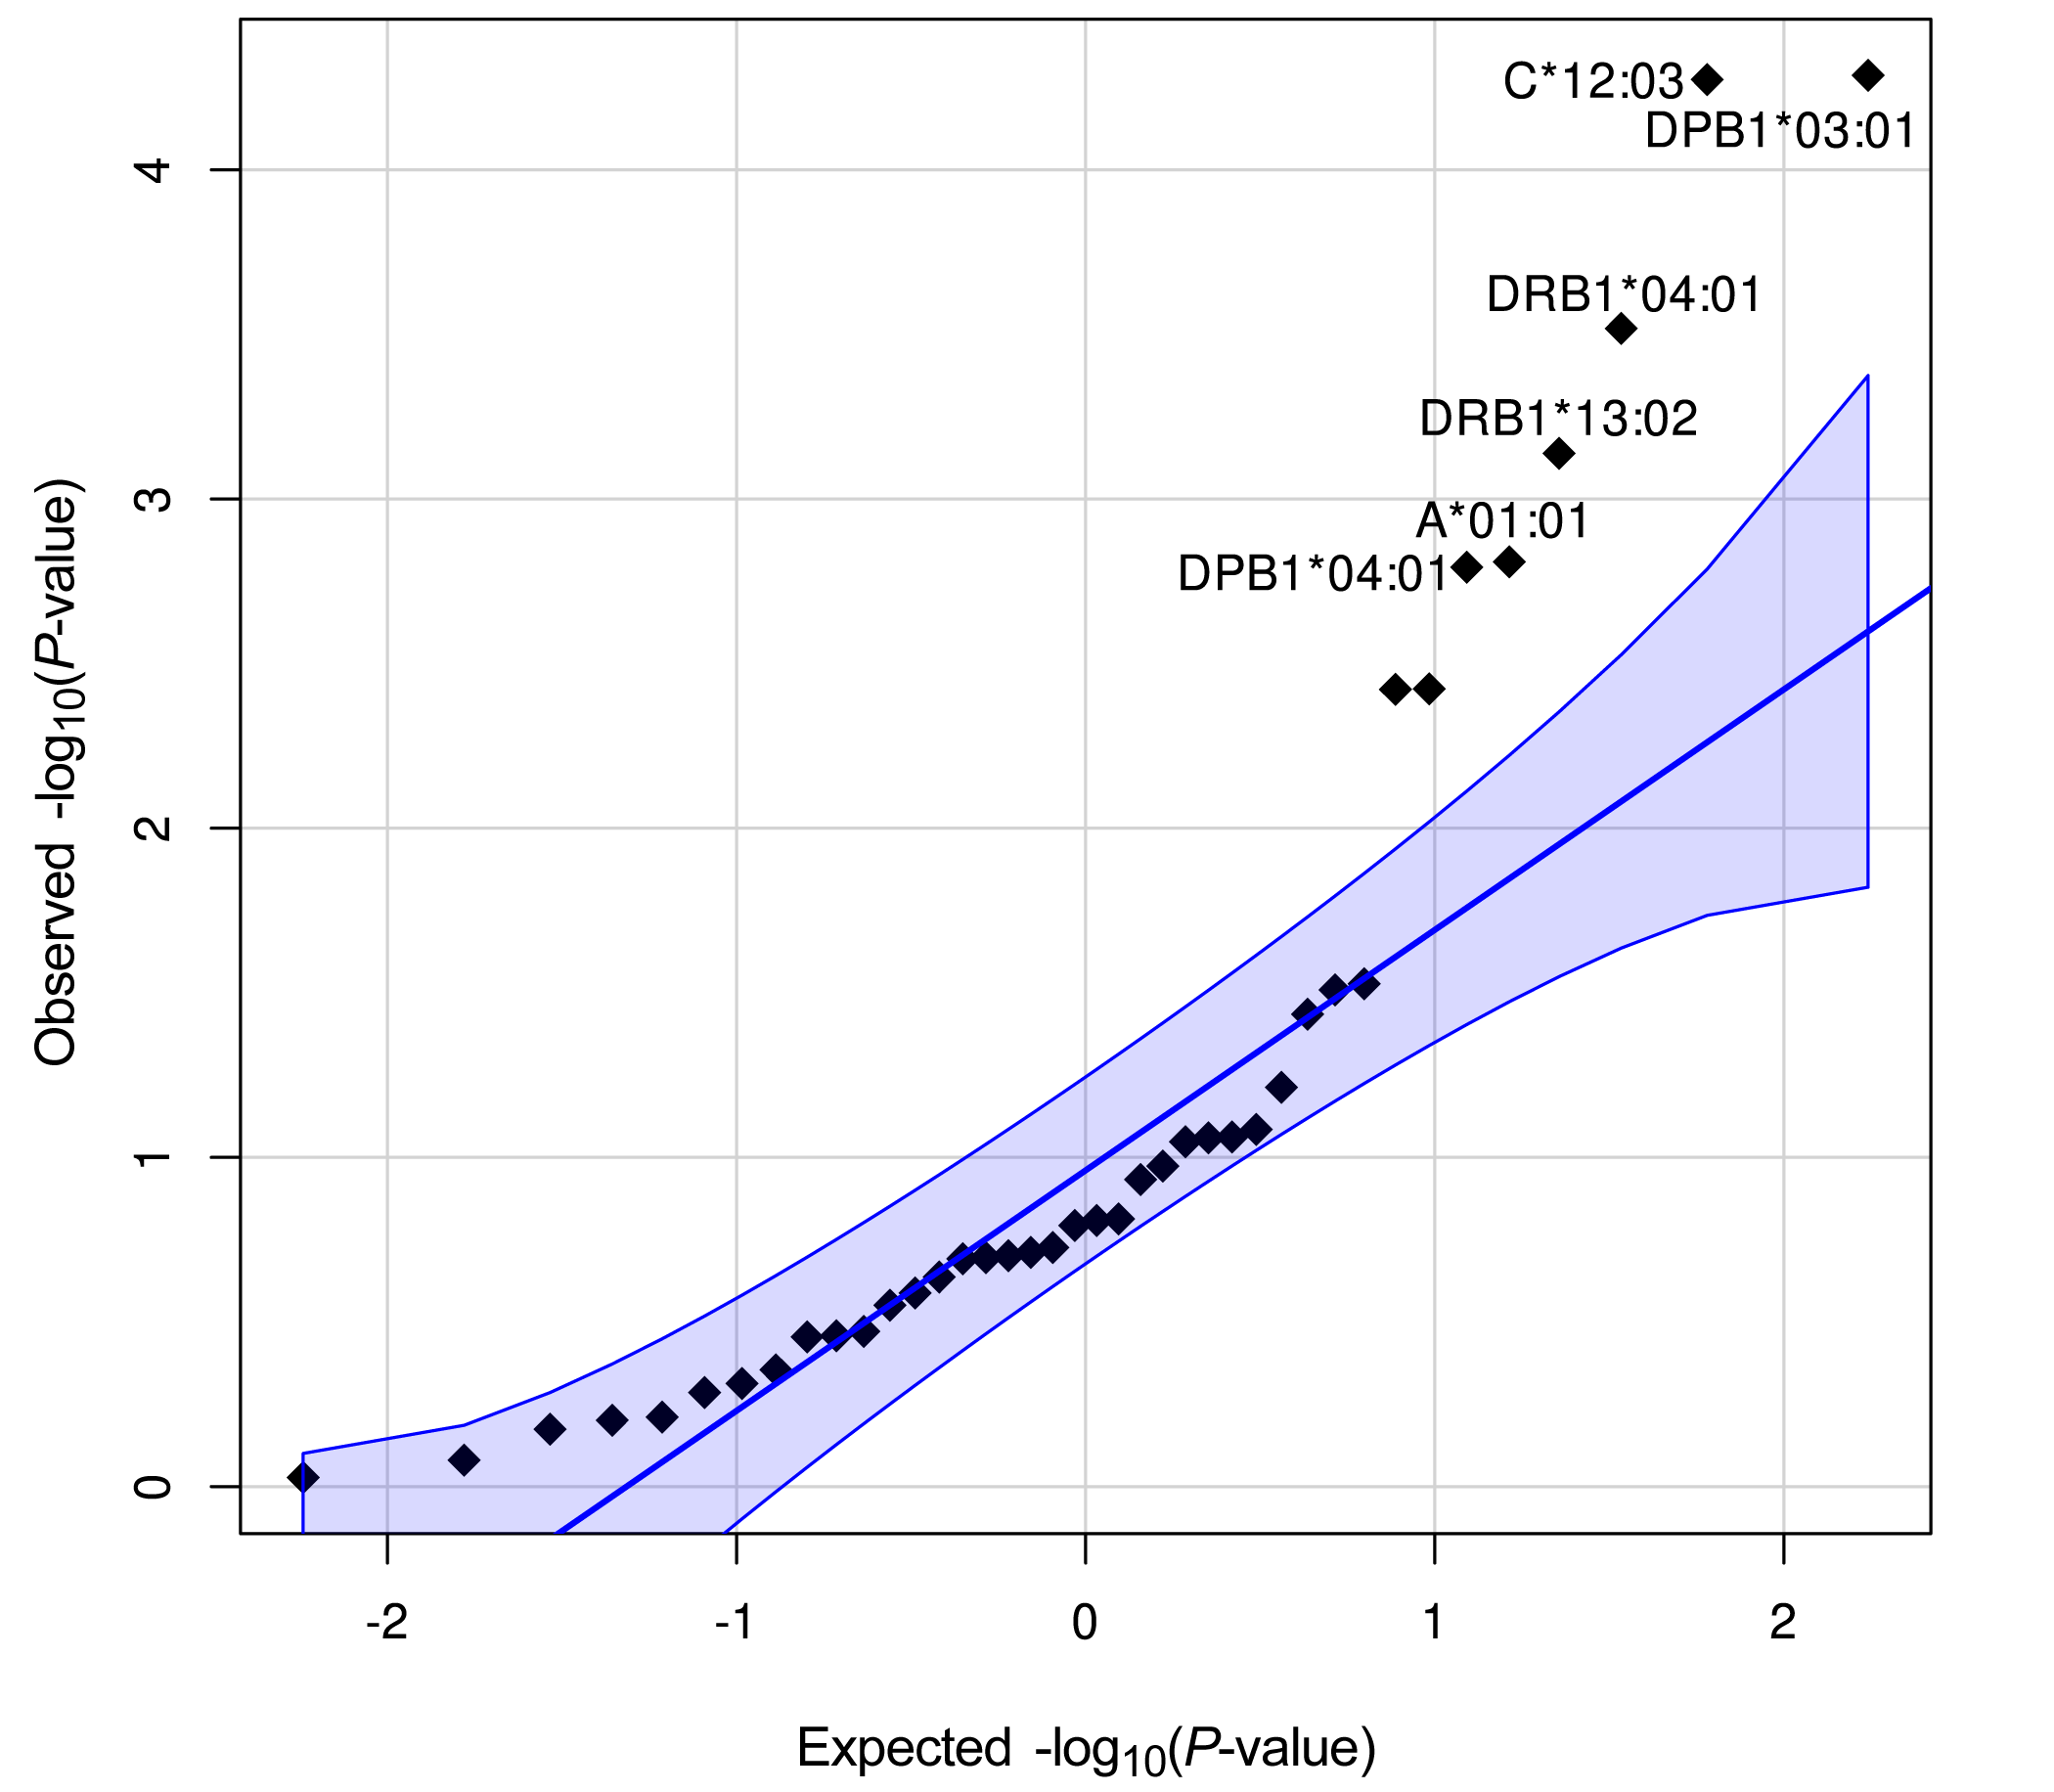
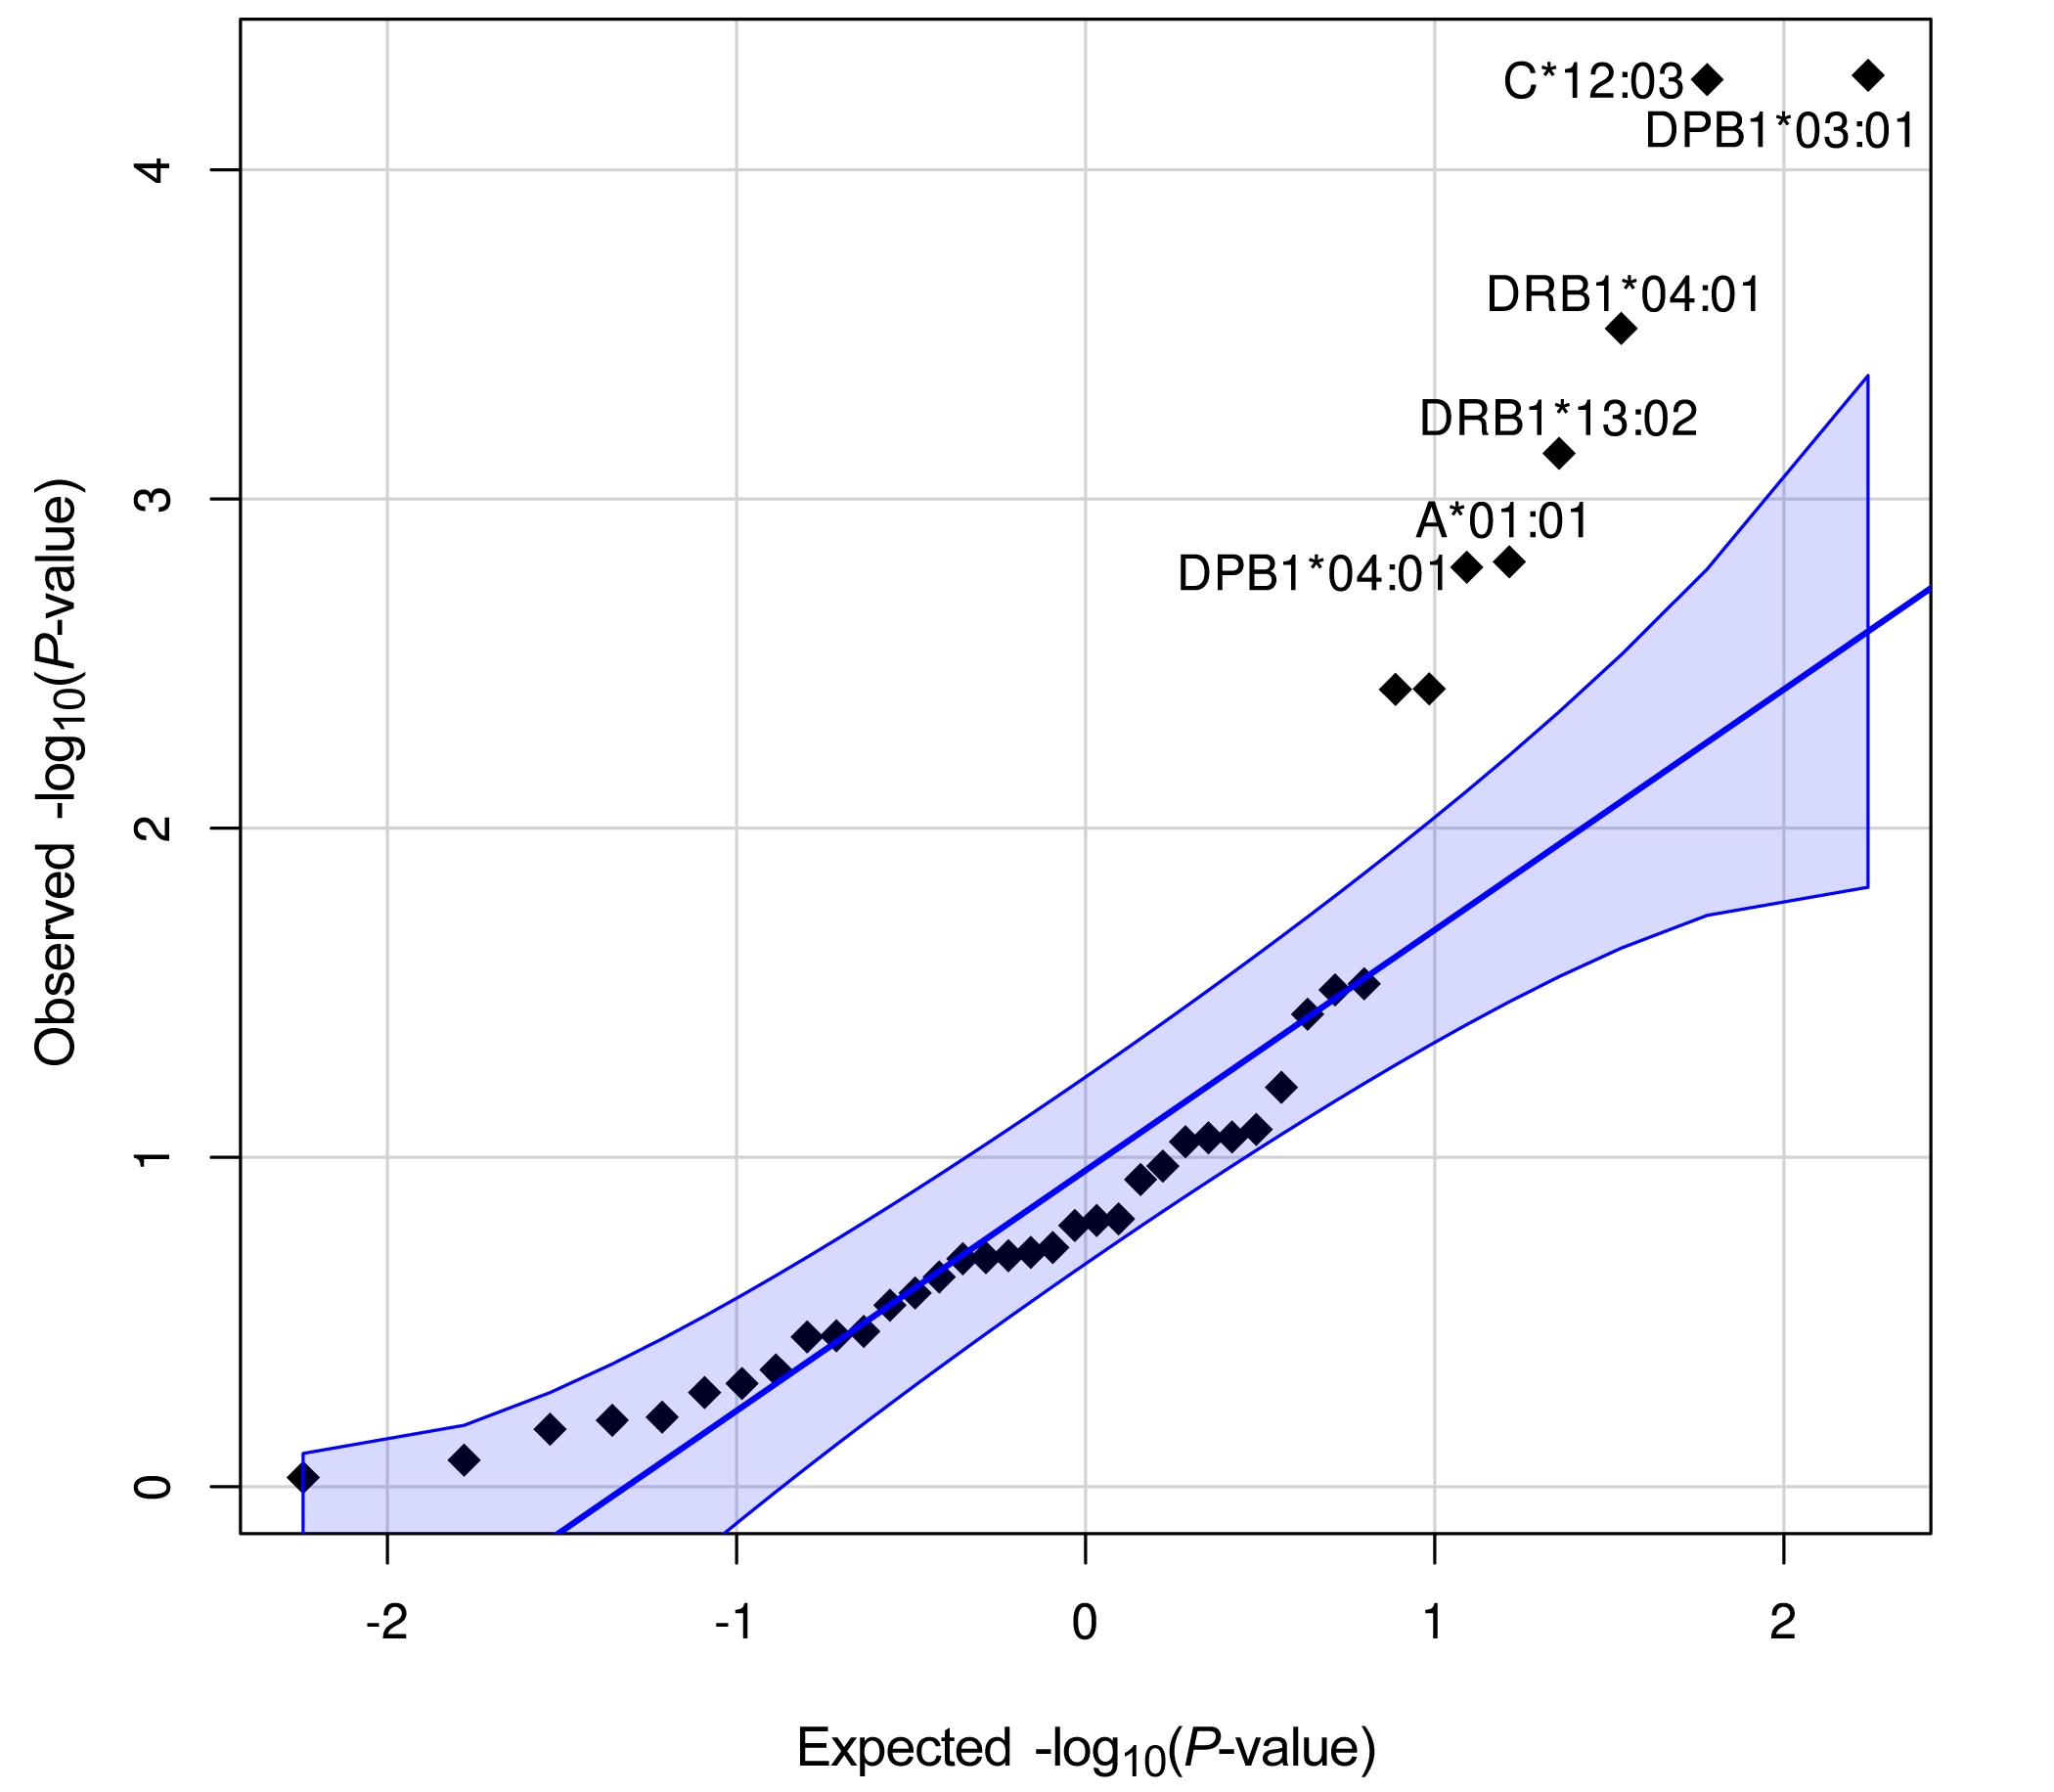
Figure 1. QQ plot of P-values from the HLA association analysis. The y-axis represents the observed -log10(P-values) from the χ2 test comparing HLA allele frequencies between LLI and the DKMS population. The x-axis represents the expected -log10(P-values) under the assumption of a uniform distribution of P-values. Each point corresponds to a single HLA allele tested. The solid diagonal line indicates the expected normal distribution of P-values and the blue area is the 95% confidence envelope. The deviation of the points from this area, particularly at the top right, is consistent with alleles showing stronger frequency differences than expected by chance. QQ: quantile-quantile; HLA: human leukocyte antigen; LLI: long-lived individuals; DKMS: Deutsche Knochenmarkspenderdatei.
3.2 DPB1*04:01 might exhibit a female-specific effect
To evaluate potential sex-specific differences among the six candidate HLA alleles that passed the primary significance screening, we performed the Breslow–Day test for homogeneity of odds ratios. Following Bonferroni correction across all six candidate alleles, a statistically significant sex interaction was observed for DPB1*04:01 (adjusted P = 0.04, female OR: 1.15, male OR: 0.96). The longevity association with this allele appears to be driven by a sex-specific enrichment in long-lived females (ORfemales = 1.15, 95% CI: 1.08-1.23). In contrast, no significant association was detected in long-lived males, with the 95% confidence interval crossing unity (ORmales = 0.96, 95% CI: 0.86-1.07). None of the remaining five evaluated alleles demonstrated significant heterogeneity in effect size between sexes after adjustment (adj. P > 0.05; Table S5).
3.3 The majority call algorithm provided robust frequency estimates
Subsequently, we evaluated the effect of the consensus HLA-calling strategy on the associations. To that end, frequencies of the six significantly associated alleles were estimated with each of the five genotyping algorithms separately (Table S6). High variability was observed across tools, with allele-specific standard deviations ranging from ±0.04% (DRB1*04:01g) to ±7.23% (DPB1*04:01g), indicating considerable algorithm- and allele-dependent uncertainty. Alleles showing low variability (SD < ±2%) had reliable tag SNPs (Table 1), except for DRB1*04:01g. This suggests that the local recombination structure may affect genotyping performance. In sum, although high-accuracy algorithms were used, the consensus-based approach appears to have mitigated tool-specific biases, reducing the influence of outlier frequency estimates.
3.4 Tag SNP analysis supported two associations beyond population stratification
Given that ancestry principal component analysis (aPCA) was unavailable for the DKMS dataset, we evaluated the influence of ancestry differences using a SNP-based approach. We repeated the association tests using SNP alleles reported to be in high LD with three of the associated HLA alleles (Table 1), correcting for population structure (Table S4). The analyses used a published Immunochip dataset with a different control group[18]. The rs1611635(T) allele, tagging A*01:01g, was negatively associated with longevity (odds ratio (OR) = 0.86; 95% confidence interval (CI): 0.77-0.97; adj. P = 0.04), which is in line with the HLA-allele-based result. In contrast, the tag SNP for DRB1*13:02g, rs28375404(T), did not reach statistical significance (OR = 1.29; 95% CI: 0.94-1.36; adj. P = 0.58). DRB1*13:02g is rare in Germans with an allele frequency of 3.91%, which likely reduced the statistical power. Analysis of rs16899214(C), tagging C*12:03g, identified an association (OR = 0.86; 95% CI: 0.77-0.97; adj. P = 0.04) in the opposite direction to that observed in the SBT data (OR = 1.25), suggesting either that the C*12:03g association is an artifact or that the tag SNP lacks reliability in this population. This investigation was not possible for the other four significantly associated alleles due to the lack of reliable tag SNPs.
3.5 One association was replicated in the UK Biobank
To assess whether the findings observed in the German cohort extend to other European populations, we tested the six significantly associated alleles in the UK Biobank. For this analysis, we used imputed HLA alleles and parental age at death as a proxy for longevity. Summary statistics are reported in Table S7. Of the six alleles tested, DRB1*13:02g was replicated, remaining statistically significant after Bonferroni correction (OR = 1.08; 95% CI: 1.02-1.15; P = 8.2 × 10⁻³; adj. P = 4.92 × 10⁻²). Its tag SNPs, rs28375404(T), was also nominally significant with a concordant effect direction (OR = 1.07; 95% CI: 1.01-1.14; P = 1.39 × 10⁻²). In contrast, A*01:01g was nominally replicated (OR = 0.96; 95% CI: 0.93-0.99; P = 1.74 × 10⁻²), but did not remain significant after multiple testing correction (adj. P = 1.04 × 10⁻¹). Its tag SNP, rs1611635(T), was also nominally significant (OR = 0.96; 95% CI: 0.93-0.99; P = 1.03 × 10⁻²). Overall, the reduced effect size in the UK Biobank compared to the German association can probably be attributed to methodological differences, such as the use of parental age at death as a proxy for longevity. Additionally, the higher misclassification of imputation-based genotyping compared to SBT might have further decreased the strength of the association signal in this dataset.
3.6 The well-known haplotype of A*01:01g was not significantly associated
Notably, A*01:01g is part of the ancestral haplotype 8.1 (AH8.1). Considering that LD patterns in the HLA region may affect the allele’s association, we investigated whether the entire haplotype may influence longevity, rather than only the individual allele. The classical AH8.1 consists of six alleles A*01:01 ~ B*08:01 ~ C*07:01 ~ DRB1*03:01 ~ DQA1*05:01 ~ DQB1*02:01[24]. However, the DQA1 locus was not genotyped in the DKMS donors, so we analysed the partial haplotype without this locus (Table S8). The frequency of the truncated AH8.1 did not exhibit a significant difference between the LLI and the control population (OR = 0.90; 95% CI: 0.75-1.09; adj. P = 0.29). Nonetheless, a potential link between AH8.1 and longevity should not be dismissed, as the OR aligns with the A*01:01g association. The lack of significance may be attributable to limited statistical power, potentially due to the exclusion of DQA1, reducing the overall signal, as well as using a haplotype which is less frequent than the individual allele, thereby lowering the effective sample size.
3.7 A*01:01 exhibited a small repertoire of virus-binding peptides
A previous study has suggested that HLA associations with longevity may be mediated by differences in binding affinities with viral peptides[10]. Therefore, we assessed whether the significant HLA class I alleles exhibit narrower repertoires of binding peptides, which may hinder the immune responses against pathogens. Only HLA class I was analysed because it predominantly presents viral antigens. However, this analysis was not possible for C*12:03g, due to the insufficient number of reported binding assays, potentially stemming from its low allele frequency. Using in vitro binding assay data from the IEDB, we compared the repertoire size of A*01:01g to that of all other HLA-A alleles combined, focusing on peptides from viral species with sufficient experimental coverage (> 1,000 reported assays).
Across five viral species, A*01:01g displayed a significantly smaller repertoire of binding peptides than other HLA-A alleles (Figure 2). These species included Alphainfluenzavirus influenzae (Influenza A; OR = 4.60; 95% CI: 3.25-6.69; P = 3.43 × 10⁻²³), Betacoronavirus pandemicum (severe acute respiratory syndrome coronavirus 2 (SARS-CoV-2); OR = 2.09; 95% CI: 1.87-2.71; P = 1.34 × 10⁻¹⁸), Lentivirus humimdef1 (HIV; OR = 6.67; 95% CI: 3.38-14.36; P = 1.55 × 10⁻⁹), and Orthoflavivirus denguei (Dengue virus; OR = 10.58; 95% CI: 8.00-14.15; P = 4.44 × 10-80). In contrast, Vaccinia virus was the sole exception, showing a significantly lower proportion of low/non-binding epitopes for A*01:01 (OR = 0.33; 95% CI: 0.26-0.43; P = 5.23 × 10⁻¹⁹).
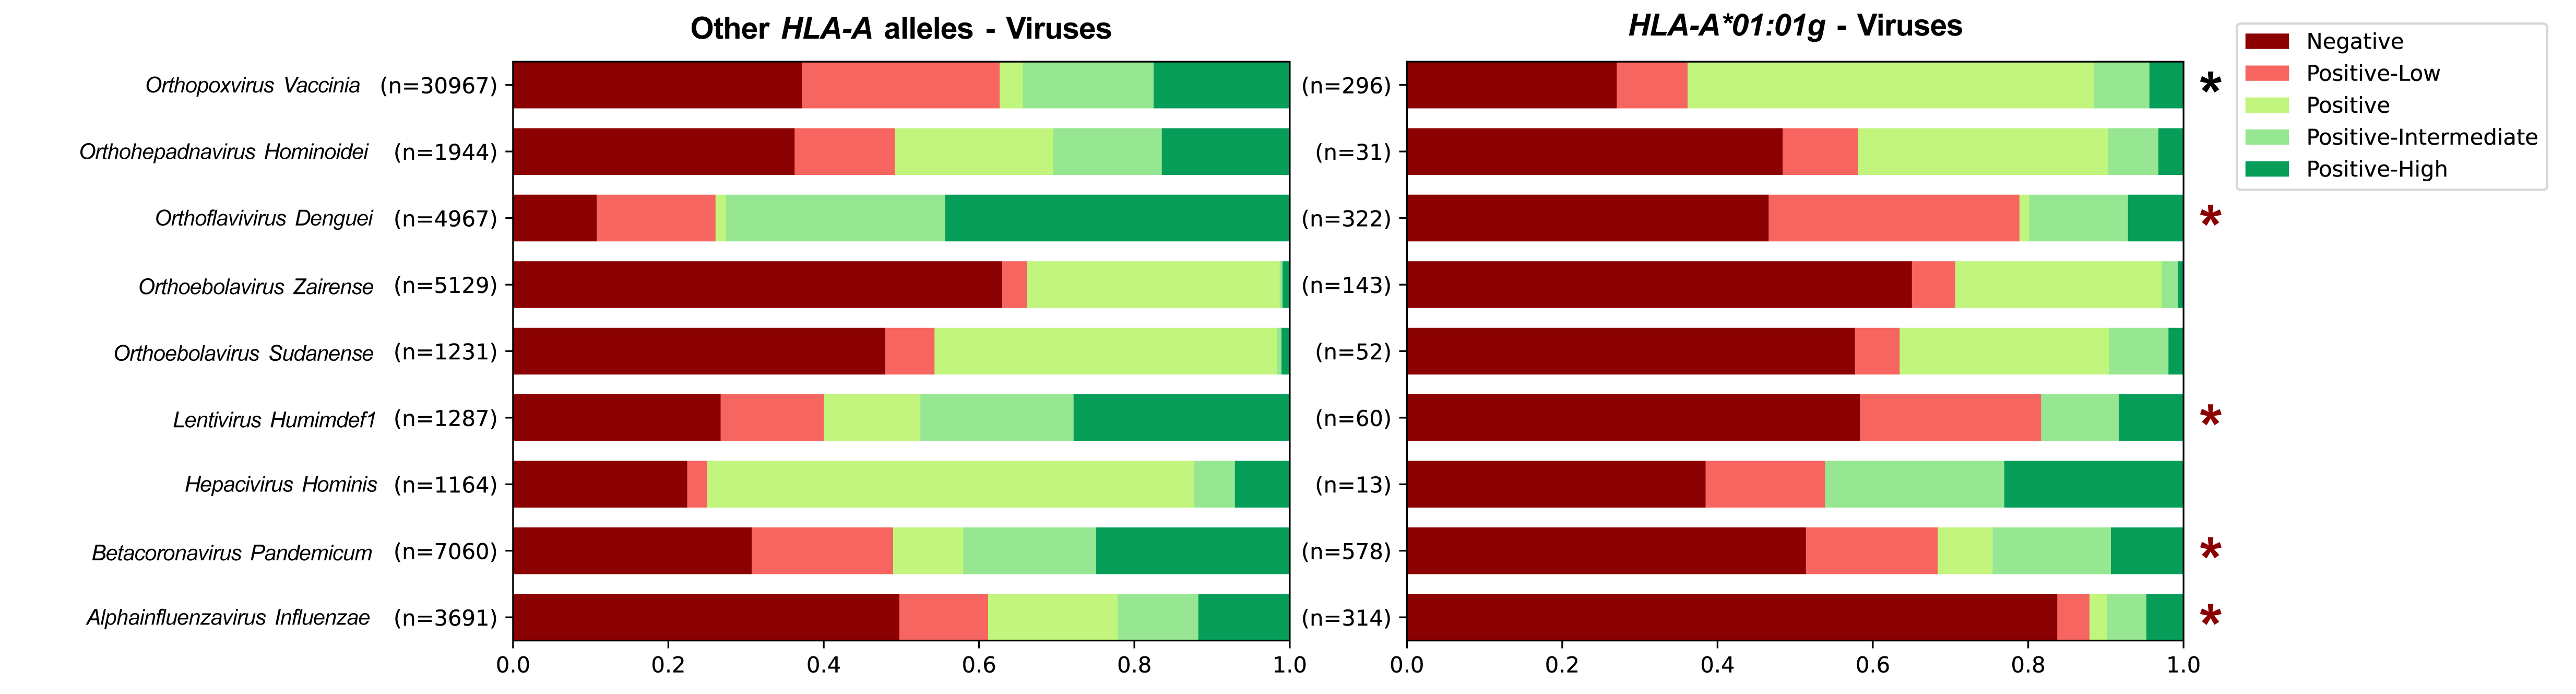
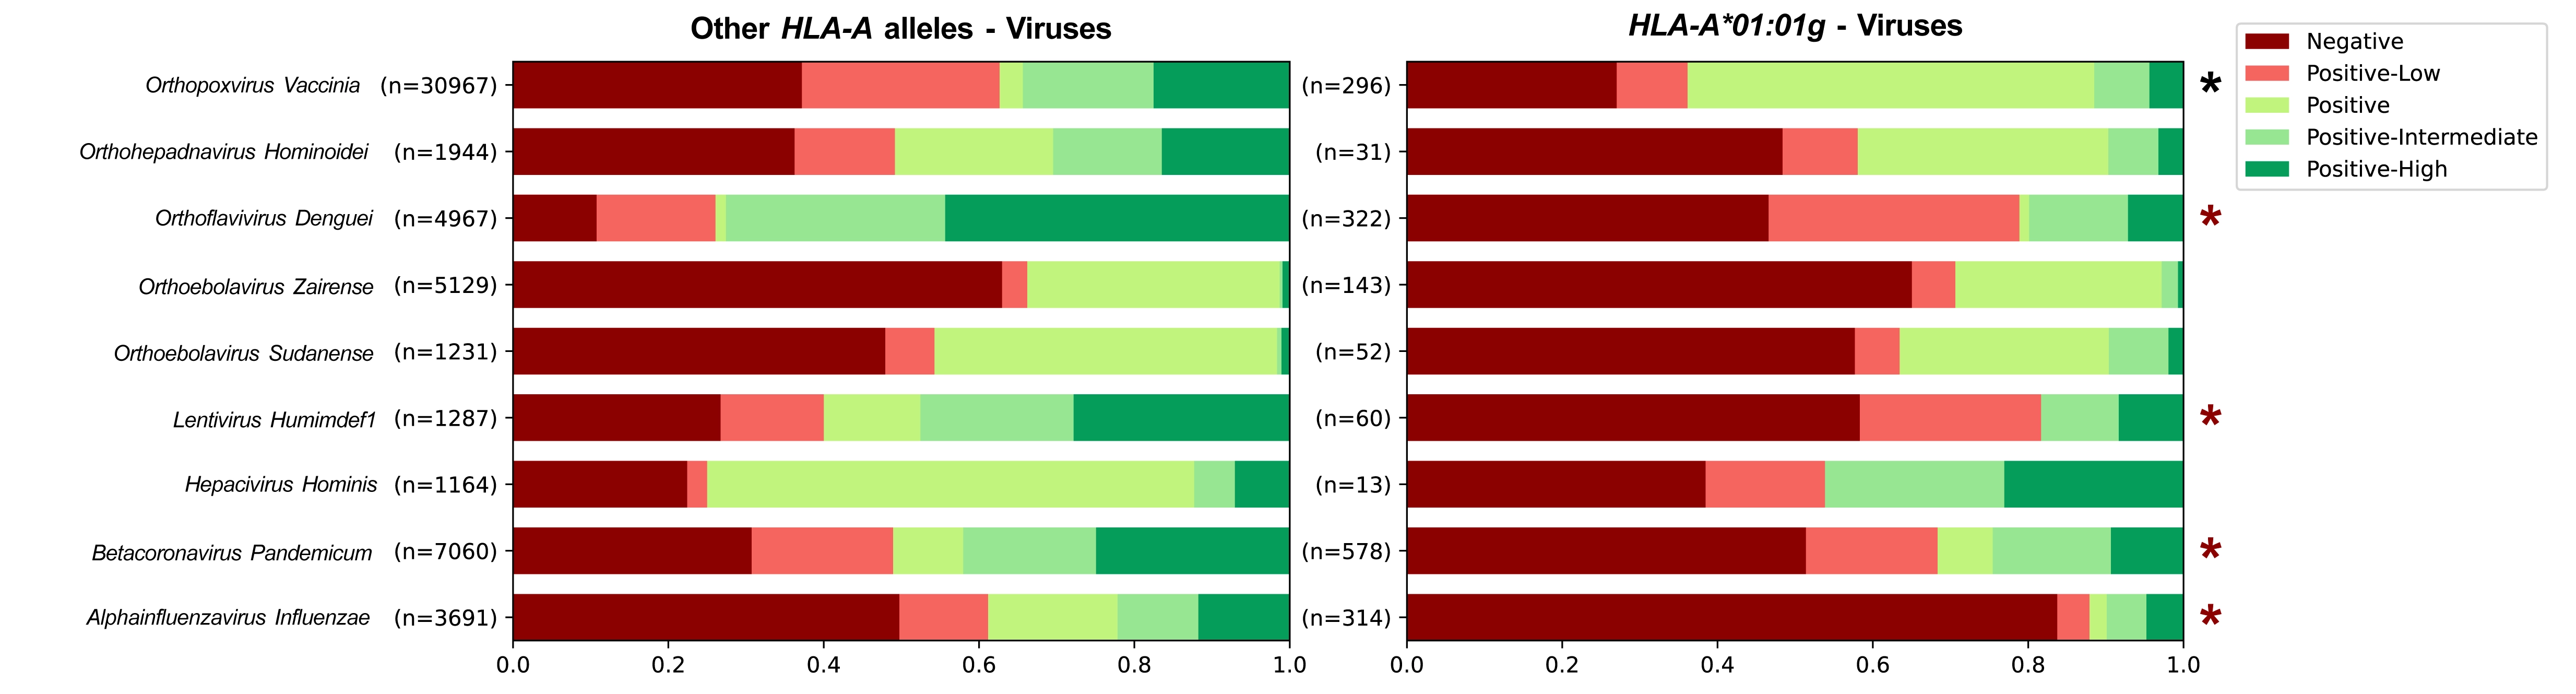
Figure 2. Viral epitope binding assays comparing HLA-A*01:01g to other HLA-A alleles. Stacked bar plots of the relative proportions of qualitative peptide-HLA binding outcomes derived from experimentally validated binding assays curated in the IEDB. Results are shown separately for HLA-A*01:01g (right) and other HLA-A alleles (left) across viral species with enough coverage. Number of reported assays are indicated in parentheses for each pathogen/antigen combination. Asterisks denote viral species for which the proportion of low/non-binding epitopes differs significantly. The colour of the asterisk indicates the direction of the effect size: red is risk and black protection. IEDB: Immune Epitope Database; HLA: human leukocyte antigen.
4. Discussion
This study investigated the link between HLA variation and longevity. To overcome the main limitations of previous research in this field, we genotyped HLA alleles from 1,265 German LLI using a highly accurate SBT method (HLA-seq). Because SBT is the standard in critical applications such as tissue transplantation, large high-quality databases of HLA allele frequencies are available, including the DKMS, which contains data from approximately 3.4 million German donors[9]. Since the HLA alleles reported in this dataset were also based on SBT, it served as a suitable control population for the LLI cohort.
We acknowledge some limitations in our study design. First, differences in the recruitment processes between the DKMS and the LLI samples may introduce artifacts due to geographic disparities. Although we performed additional validations using tag SNPs for significantly associated alleles and corrected for population stratification, subtle differences in demographic structure cannot be entirely ruled out. Furthermore, only aggregate allele frequencies were available for the DKMS, preventing the evaluation of allele interactions or full haplotype effects, particularly since the DQA1 locus was absent in the control data. Finally, because sex-stratified allele frequencies were unavailable in the control group, we utilized aggregate population frequencies for each sex. However, this approach could overlook sex-specific associations if allele frequencies differed between sexes at the population level. Despite these constraints, comparing the allele frequencies of LLI with those of the DKMS provided a major advantage over earlier studies, which often relied on smaller cohorts and less precise methods such as serotyping or imputation.
Our analysis identified six alleles associated with longevity. Of these, A*01:01g exhibited the most robust evidence, as its association was supported by a tag SNP analysis and nominally replicated in the UK Biobank. Although this replication did not remain significant after correction for multiple testing, the consistency indicates that there may be a link between A*01:01g and longevity that extends beyond Germans to other European populations. Notably, an enrichment of A*01:01 was reported in patients older than 74 years with late-onset Alzheimer’s disease (AD)[25]. Although A*01:01 carriers may initially benefit from healthier white matter integrity[26] leading to a postponed AD onset, they nevertheless appear to develop AD disease at advanced ages. Previously, we have proposed that anti-longevity HLA alleles may increase mortality rates at advanced ages via the AD link, thereby reducing the likelihood of living past 94 years[8].
In addition, three of the other alleles identified in this study have been reported to influence dementia, including the pro-longevity allele DRB1*13:02, which was replicated in the UK Biobank. It has been reported to confer protection against dementia[27]. Moreover, DPB1*03:01, which exhibited an anti-longevity association in our analysis, showed previously a suggestive association with dementia risk, whereas DPB1*04:01, identified here as a pro-longevity allele, exhibited a protective trend[28]. Taken together, these observations suggest that a subset of longevity-associated HLA variants may promote (A*01:01, DPB1*03:01) or slow down (DRB1*13:02, DPB1*04:01) neurodegeneration and thus dementia-related mortality, which is one of the leading causes of death in older adults[29].
Alternatively, although enhanced antiviral immunity has been linked to certain HLA alleles that influence longer lifespan[10], compromised immunity may reduce survival. In this context, A*01:01, which exhibited an anti-longevity association in our cohort, has been shown to increase the risk of several viral infections such as HIV, dengue, Epstein–Barr virus (EBV)-positive Hodgkin lymphoma and COVID-19[30-34]. This is in line with the narrower peptide-binding repertoires exhibited by A*01:01 when compared with other HLA-A alleles across various clinically relevant viral species (Figure 2), as shown by our analysis of the binding assays available in the IEDB[35]. The smaller repertoire has been reported to impair the ability of the allele to initiate immune responses in transgenic mice expressing human A*01:01 when exposed to viral peptides[36]. Such limitations in viral antigen presentation may pose a particular threat to survival at advanced ages, when immune competence declines as a consequence of immunosenescence, which is one of the hallmarks of aging[37]. For instance, elderly carriers of A*01:01 exhibited higher mortality rates during SARS-CoV-2 infections[34]. Therefore, the significantly lower frequency of A*01:01g in LLI might reflect elevated infection-related mortality risk throughout life, which is further amplified by aging, thereby reducing the likelihood of reaching longevity.
This observation prompts the evolutionary question of why anti-longevity HLA alleles have remained so prevalent in modern populations. The current investigation, together with prior research[8], indicates that the two HLA alleles A*01:01 and DRB1*15:01 are associated with a reduced likelihood of achieving longevity. This finding is particularly noteworthy given that both alleles are relatively common in Europeans (15% and 13%, respectively) and seem to have increased in frequency rapidly within the last few millennia (Figure S3 and Figure S4). These trajectories are consistent with positive selection for an advantageous trait. In particular, protection against bacterial infections has already been proposed as a major selective advantage contributing to the increase in DRB1*15:01[38,39]. Furthermore, AH8.1 has also been associated with resistance against bacteria[40]. Ancestral haplotypes are highly conserved long stretches of DNA characterised by extended LD[24]. This LD pattern stems from recent positive selection on one or more genes, which carried the entire haplotype to higher frequencies – an effect known as genetic hitchhiking. The allele frequency of A*01:01 in the ancestral populations (Figure S3) mirrors the trajectory of DQB1*02[39]. Given that both alleles are part of AH8.1, it seems that A*01:01 increased in frequency due to this hitchhiking effect. In comparison to the advantage provided by this haplotype, any detrimental effects of A*01:01, particularly those manifesting late in life, would have exerted little selective pressure given the relatively short life expectancy in ancient populations.
This haplotype structure confounds the association analysis, making it difficult to identify individual causal alleles. Even though previous studies investigated the link between AH8.1 and longevity in Europeans[3,41], they employed low-resolution serotyping methods and reported contradictory results. Among them, the study with the largest sample size (171 cases and 405 controls) documented a reduced frequency of AH8.1 in elderly Greek individuals (75-104 years)[41], which supports our results. Here, however, we narrowed down this association to a single allele, A*01:01, underscoring the importance of using large datasets and high-resolution genotyping, such as SBT, to analyse links between HLA polymorphisms and longevity.
5. Conclusion
This study identified six HLA alleles that may influence the likelihood of achieving longevity. Among these, one showed a robust association, as it was replicated in the UK Biobank. The remaining associations are suggestive but should not be disregarded, given that the imputed UK Biobank alleles and tag SNPs are less precise and may introduce misclassification. In addition, four of these six alleles have been reported to be associated with dementia, providing additional support for our findings and suggesting that their role in longevity may operate, at least in part, through the modulation of neurodegeneration. To the best of our knowledge, one allele with a suggestive association, DRB1*04:01g, has not yet been linked to a longevity-related phenotype. Overall, future research in large longevity cohorts with SBT-HLA data will be essential to confirm these associations in other populations.
Supplementary materials
The supplementary material for this article is available at: Supplementary materials.
Acknowledgements
For the replication in the British population, this research has been conducted using the UK Biobank Resource under application number 139525.
Authors contribution
Nebel A: Conceptualization, investigation, supervision, writing-review & editing.
Mendoza-Mejía N: Conceptualization, data curation, formal analysis, methodology, writing-original draft, writing-review & editing.
Dose J: Investigation, resources.
Torres GG, Franke A: Data curation, resources.
Kolbe D: Conceptualization, writing-review & editing.
Özer O: Supervision.
All authors have critically read and revised the manuscript.
Conflicts of interest
The authors declare that they have no conflicts of interest.
Ethical approval
The study was conducted in accordance with the approval A156/03 from the Ethics Committee of the Medical Faculty of Kiel University and complies with the rules in the General Data Protection Regulation.
Consent to participate
All participants gave written informed consent to participate in the study.
Consent for publication
Not applicable.
Availability of data and materials
A list of all the estimated HLA allele frequencies (AF) in German LLIs is available in Table S2. The AF of HLA alleles from DKMS donors is accessible in the supplementary materials of the original paper[9]. The data that support the findings of this study are available from the corresponding author upon reasonable request.
Funding
We acknowledge financial support from the Deutsche Forschungsgemeinschaft (DFG, German Research Foundation) through the Research Training Group for Translational Evolutionary Research (RTG 2501) (Grant No. 400993799) and the Excellence Cluster Precision Medicine in Chronic Inflammation (EXC 2167) (Grant No. 390884018).
Copyright
© The Author(s) 2026.
References
-
3. Caruso C, Candore G, Colonna Romano G, Lio D, Bonafè M, Valensin S, et al. HLA, aging, and longevity: A critical reappraisal. Hum Immunol. 2000;61(9):942-949.[DOI]
-
8. Mendoza-Mejía N, Kolbe D, Özer O, Dose J, Torres GG, Franke A, et al. HLA-DRB1*15:01 is associated with a reduced likelihood of longevity in northern European men. Genome Med. 2025;17(1):125.[DOI]
-
11. Nebel A, Croucher PJP, Stiegeler R, Nikolaus S, Krawczak M, Schreiber S. No association between microsomal triglyceride transfer protein (MTP) haplotype and longevity in humans. Proc Natl Acad Sci U S A. 2005;102(22):7906-7909.[DOI]
-
13. Schetelig J, Baldauf H, Rave C, Bug G, Mueller LPH, Wagner Drouet E, et al. Unrelated donors below 35 years of age should be preferred over HLA-matched sibling donors older than 50 years for patients with myeloid malignancies. Blood. 2023;142(Suppl 1):1046.[DOI]
-
14. Wittig M, Juzenas S, Vollstedt M, Franke A. High-resolution HLA-typing by next-generation sequencing of randomly fragmented target DNA. In: Boegel S, editor. HLA typing: Methods and protocols. New York: Humana Press; 2018. p. 63-88.[DOI]
-
15. Claeys A, Merseburger P, Staut J, Marchal K, Van den Eynden J. Benchmark of tools for in silico prediction of MHC class I and class II genotypes from NGS data. BMC Genomics. 2023;24(1):247.[DOI]
-
19. Meyer HV. meyer-lab-cshl/plinkQC: plinkQC 0.3.2. Version v0.3.2 [software]. Zenodo. 2020.[DOI]
-
22. Dutta A, Henley W, Robine JM, Llewellyn D, Langa KM, Wallace RB, et al. Aging children of long-lived parents experience slower cognitive decline. Alzheimers Dement. 2014;10(5S):S315-S322.[DOI]
-
23. Robinson J, Barker DJ, Marsh SGE. 25 years of the IPD-IMGT/HLA Database. HLA. 2024;103(6):e15549.[DOI]
-
28. James LM, Charonis SA, Georgopoulos AP. Association of dementia human leukocyte antigen (HLA) profile with human herpes viruses 3 and 7: An in silico investigation. J Immunol Sci. 2021;5(3):7-14.[DOI]
-
29. Collaborators GBD 2019. Global mortality from dementia: Application of a new method and results from the Global Burden of Disease Study 2019. Alzheimers Dement. 2021;7(1):e12200.[DOI]
-
31. Monteiro SP, do Brasil PEAA, Cabello GMK, De Souza RV, Brasil P, Georg I, et al. HLA-A*01 allele: A risk factor for dengue haemorrhagic fever in Brazil’s population. Mem Inst Oswaldo Cruz. 2012;107(2):224-230.[DOI]
-
32. Niens M, Jarrett RF, Hepkema B, Nolte IM, Diepstra A, Platteel M, et al. HLA-A*02 is associated with a reduced risk and HLA-A*01 with an increased risk of developing EBV+ Hodgkin lymphoma. Blood. 2007;110(9):3310-3315.[DOI]
-
37. López-Otín C, Blasco MA, Partridge L, Serrano M, Kroemer G. Hallmarks of aging: An expanding universe. Cell. 2023;186(2):243-278.[DOI]
Copyright
© The Author(s) 2026. This is an Open Access article licensed under a Creative Commons Attribution 4.0 International License (https://creativecommons.org/licenses/by/4.0/), which permits unrestricted use, sharing, adaptation, distribution and reproduction in any medium or format, for any purpose, even commercially, as long as you give appropriate credit to the original author(s) and the source, provide a link to the Creative Commons license, and indicate if changes were made.
Publisher’s Note
Science Exploration remains a neutral stance on jurisdictional claims in published
maps
and institutional affiliations. The views expressed in this article are solely those
of
the author(s) and do not reflect the opinions of the Editors or the publisher.
Share And Cite


Science Exploration Style
Mendoza-Mejía N, Kolbe D, Özer O, Dose J, Torres GG, Franke A, et al. Sequence-based HLA genotyping identifies six candidate alleles associated with human longevity in Germans. Geromedicine. 2026;2:202619. https://doi.org/10.70401/Geromedicine.2026.0039
Tips
Copy completed.
Submit a Manuscript
Author Instructions
Cite this Article
Article Metrics
0
View
0
Download
Cited
Article Updates

- Abstract
- Keywords
- 1. Introduction
- 2. Methods and Materials
- 3. Results
- 4. Discussion
- 5. Conclusion
- Supplementary materials
- Acknowledgements
- Authors contribution
- Conflicts of interest
- Ethical approval
- Consent to participate
- Consent for publication
- Availability of data and materials
- Funding
- References
- Copyright
 Get citation
Science Exploration Style

Mendoza-Mejía N, Kolbe D, Özer O, Dose J, Torres GG, Franke A, et al. Sequence-based HLA genotyping identifies six candidate alleles associated with human longevity in Germans. Geromedicine. 2026;2:202619. https://doi.org/10.70401/Geromedicine.2026.0039
copy
Share Link
copy