Abstract
Architectural form design is crucial to building indoor and outdoor natural ventilation, and elevated building design is one of the methods for improving the outdoor wind environment. Through Integrating computational fluid dynamics (CFD) simulation with architectural design, an informed decision for architectural design is provided for better architectural design schemes. CFD simulation was used to explore the impacts of elevated heights on the XJTLU Central Building’s wind environment at the pedestrian height around the building. Results show that the elevated design of the building has a good effect on improving the wind environment at the pedestrian height of 1.5 m around the building. For this study case and similar height buildings, the elevated design can increase the wind speed of the 1.5 m pedestrian height in the windward area of the building when the elevated height is 2.4~3.0 m. When the elevated design height is above 3.0 m, the elevated design has little impact on the 1.5 m height wind speed at the windward area of the building. On this basis, the impact of various building heights and elevated widths on the pedestrian height wind speeds were explored. Results show that when the building height is between 24 and 72 m, increasing the building height can increase the wind speed at pedestrian height in the high wind speed area of the windward area, and gradually reduce the wind speed of the pedestrian height in the low wind speed at the windward area of the building. When the total height of the building and the elevated height is unchanged, results show that increasing the elevated width of the building can increase the pedestrian height wind speeds in the high wind speed area of the windward area and has no significant impact on the pedestrian height wind field distribution in the low wind speed area of the windward area.
Keywords
1. Introduction
The elevated design of buildings can relieve the pressure of surrounding traffic, provide public activity areas for people, and provide good natural ventilation for indoor and outdoor buildings[1,2]. This form has been used in South China and Southeast Asia for a long time[3]. In summer, Niu et al.[4] obtained through investigation that in the central urban area where buildings are concentrated, elevated design can provide better ventilation and shading for buildings and their surrounding areas and improve people’s thermal comfort buildings. Xia et al.[3] selected overhead buildings in subtropical regions for wind tunnel tests and obtained the buildings’ flow field distribution. Recently, Liu et al.[5] used a large eddy simulation (LES) method to study the turbulence intensity field and gust wind speed field around the overhead building. Results indicate that the wind speed amplification phenomenon exists in the elevated building area’s semi-outdoor space, improving the wind speed and thermal comfort of pedestrian height in various cases. Then they used the outdoor thermal comfort test method of measured thermal parameters and simulated wind speed. They compared the computational fluid dynamics (CFD) simulation results and wind tunnel test data of the wind speed around the single building with or without the overhead design. The results showed that the overhead design only improves thermal comfort in a limited adjacent area. But in the summer, the overhead design can provide better thermal comfort for the surrounding space[6]. In a recent study[7], based on a wind tunnel test and CFD simulation, the ground pedestrian-level aerodynamics of several elevated building blocks were studied. It was found that the area under the overhead building has a higher wind amplification rate than the area around the building. Indicators such as PMV[8], UCB model[9], PET, and UTCI had been used to evaluate the outdoor thermal comfort of elevated buildings in subtropical cities[10,11].
CFD combine fluid dynamics with computer science[12]. Because CFD has the advantages of convenient operation, accurate results, and low cost, it was initially widely used in the engineering technology industry. In architectural design, CFD can simulate and analyze the building’s indoor and outdoor wind environment conditions, and the results are fed back to the designer to optimize the architectural design fuether[13]. CFD simulation results’ accuracy largely depends on the turbulence model, model establishment, mesh division, and boundary condition settings.
XJTLU is located in Suzhou Industrial Park, Jiangsu Province. It is divided into two campuses in the north and south. The XJTLU Center Building (Figure 1) is located on the north campus. The design was inspired by the “Taihu Stone” produced in Taihu Lake. The building has 14 floors above ground, with a total height of 61 meters, of which there are two floors on the platform, and the tower has a series of holes that can provide lighting and ventilation for the interior of the building. The northwest wind prevails in Suzhou in winter, so the northwest facade of the building was not designed with holes, and the connection between the tower and the second-floor platform was designed as elevated. The authors repeatedly observed and experienced the summer outdoor wind environment on the second-floor platform of the XJTLU Center Building and found that the outdoor wind speed on the second-floor platform of the building has significantly increased in summer and shoulder seasons, and the local wind environment has effectively improved the sultry environment around the building. Then selected the building as the research object to discuss the impact of the building’s elevated design on the outdoor wind environment[14].
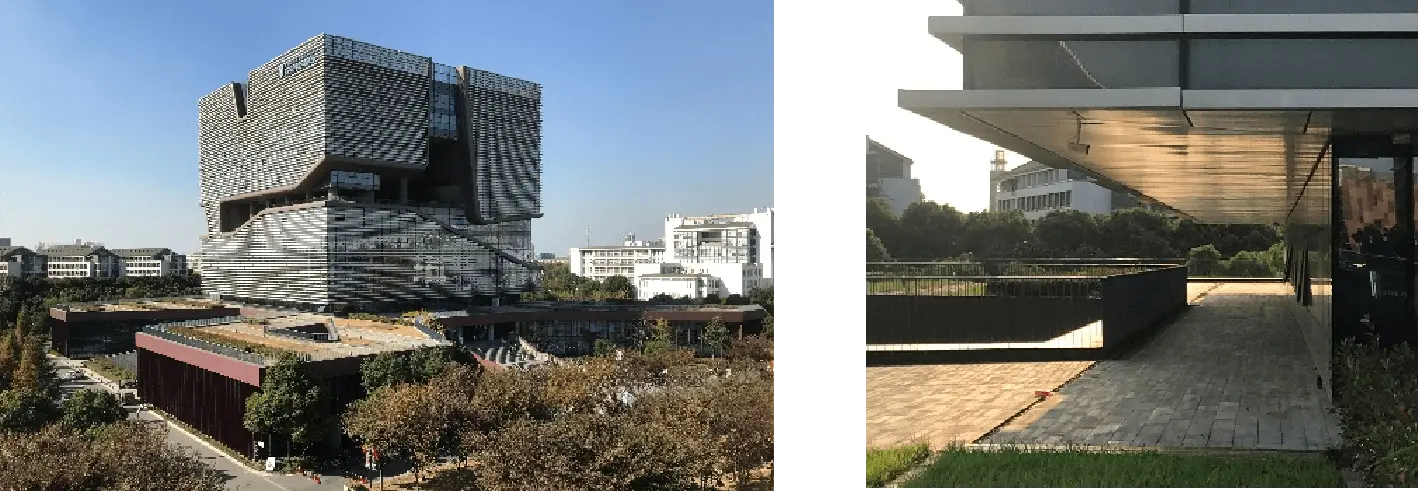
Figure 1. The Southeast panorama of the XJTLU Center Building and the elevated platform.
This article aims to take the XJTLU Center Building as an example and uses the CFD method to explore whether the building is elevated and the impact of different elevated heights h on the building’s pedestrian height wind environment. Further, explore the impact of changing building height H on the pedestrian height wind environment in the elevated area when the elevated height h remains unchanged (2.7 m); Explore the impact of changing the elevated width w on the pedestrian height wind environment in the elevated area when controlling the building height H (61 m) and the elevated height h unchanged (2.7 m).
2. Methodology
2.1 Choice of calculation software
At present, there is many mainstream CFD software, and each has its characteristics. When CFD is used for numerical simulation calculation, three kinds of discretization methods: finite-element method, finite-volume method, and finite-difference method[15]. The difference between the physical meanings of the three is that the finite-element method is based on the principle of extreme value (variational or weighted residual method), the central idea of the finite-difference method is based on differentiation, and the finite-volume method is based on the principle of physical conservation[16].
The Vent 2020 software (based on OpenFoam calculating engine), a widely used engineering and consulting CFD software in China, uses the finite volume method. The pressure correction method (SIMPLE) is used to process the continuity equation. Vent uses the second-order upwind formula to discretize the equations. The accuracy of the second-order upwind formula can meet the requirements of general fluid simulation analysis and calculation of enterprises[17]; at the same time, it can meet the requirements of the simulation control algorithm in Building Design Ventilation Effect and Test and Evaluation Work Standard (JGJ/T 309-2013)[18].
The Butterfly is a CFD plugin that uses the Python code library and the Open Foam calculating engine based on the Rhino and Grasshopper modeling and parametric simulation platform. It can help architects, planners, landscape, and engineers to calculate indoor and outdoor ventilation environments and circumvent the difficulties of using text-based Open Foam. Compared with other CFD software, it is an emerging tool with significant advantages. It is entirely built-in in Grasshopper and can be visualized programming with Grasshopper, which makes the modification and adjustment of the model more convenient; through the Ladybug Tools component, you can quickly customize the display effect; It can realize the parameterized automatic control modification of the scheme, which is convenient for repeated calling and later extraction, and the work efficiency is significantly improved compared with traditional software.
2.2 Turbulence models and building model
The core of using the CFD method to correctly simulate the distribution of indoor and outdoor wind fields in buildings is to choose a suitable turbulence model[19]. The LES model and the two-equation model are the two most used mathematical models[20]. Since the indoor and outdoor air of the building belongs to the low-speed turbulent flow field and cannot be compressed, the k - ε Model in the two-equation model is more accessible to operate than other models, the grid is stable and not easy to produce fluctuations, so the k - ε Model is selected as the turbulence for this simulation Model[21]. Standard k - ε Model, renormalization group (RNG) k - ε Model, and realizable k - ε Model are the three primary forms of k - ε Model, among which Standard k - ε Model is the most basic model, and the latter two are improved k - ε Models[22]. This study uses the k - ε Model for outdoor flow field analysis calculation.
The XJTLU Center Building is close to the city’s main road, the surrounding area is primarily multi-story buildings, and tall buildings do not block the direction of the wind. To facilitate the simulation and analysis, the building components and the contours that have little impact on the indoor and outdoor wind environment are ignored, and the influence of the surrounding buildings and the near-ground environment on the research model is not considered. The model is appropriately simplified to obtain a schematic diagram of the structure. The model is shown in Figure 2A,B,C. Figure 2A shows 16 reference points (RP). The coordinates of each point are shown in Table 1. The overall dimensions of the building are W × D × H = 147.7 × 123.84 × 61 m. The elevated design is located at the junction of the second floor of the podium and the tower. The platform’s height is 11.1 m, the elevated height h is 2.7 m, and the elevated width w is 4.2 m. The raised ground area accounts for 30% of the superstructure area. Table 2 lists the overhead design height of the building studied in this paper.
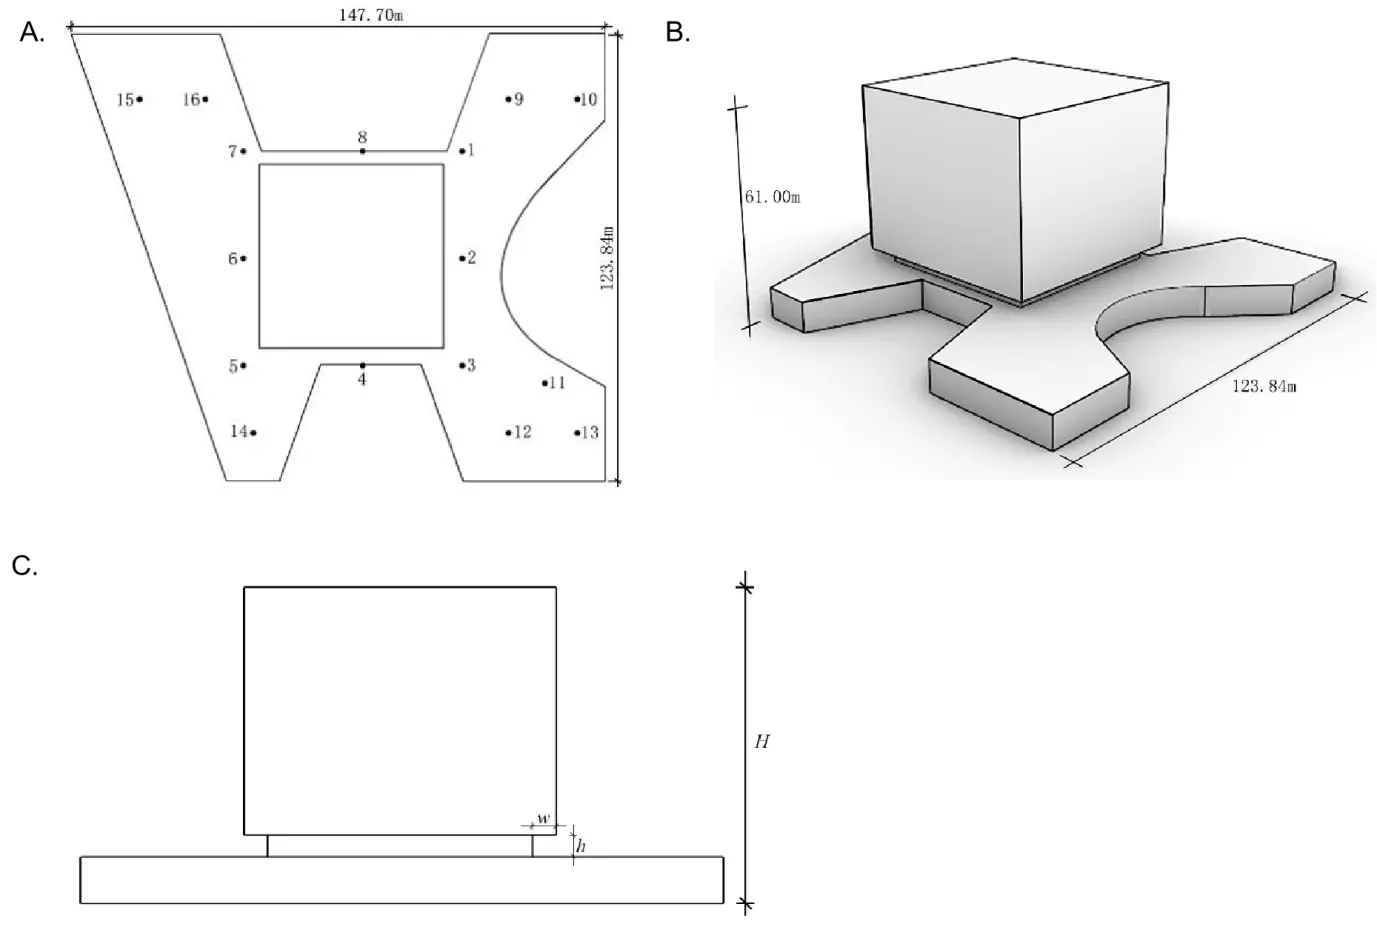
Figure 2. Simplified model of XJTLU center building. (A) The pedestrian height cross-section of the second-floor platform and each reference point; (B)Three-dimensional view; (C) West elevation view.
| RP number | X | Y | Z | RP number | X | Y | Z |
| 1 | -220 | 108 | 12.6 | 9 | -210 | 118 | 12.6 |
| 2 | -220 | 77.5 | 12.6 | 10 | -192 | 118 | 12.6 |
| 3 | -220 | 47 | 12.6 | 11 | -200 | 44 | 12.6 |
| 4 | -250.5 | 47 | 12.6 | 12 | -210 | 30 | 12.6 |
| 5 | -281 | 47 | 12.6 | 13 | -192 | 30 | 12.6 |
| 6 | -281 | 77.5 | 12.6 | 14 | -273 | 30 | 12.6 |
| 7 | -281 | 108 | 12.6 | 15 | 313 | 118 | 12.6 |
| 8 | -250.5 | 108 | 12.6 | 16 | -293 | 118 | 12.6 |
RP: reference points.
| Case | 1 | 2 | 3 | 4 | 5 | 6 | 7 | 8 | 9 | 10 | 11 |
| Elevated height h(m) | 0 | 2.4 | 2.7 | 3.0 | 3.3 | 3.6 | 3.9 | 4.2 | 6.0 | 6.9 | 8.1 |
CFD: computational fluid dynamics.
2.3 Calculate regions and meshing
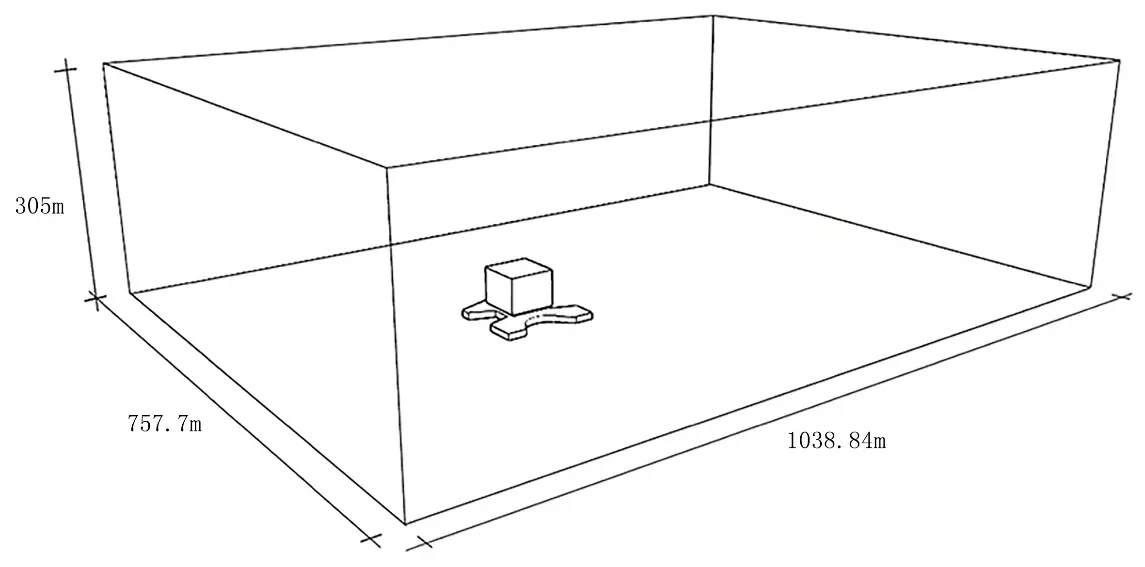
The accuracy of the simulation results has a significant relationship with the boundary size of the calculation area. It meets the following requirements: the horizontal distance between the entrance boundary and the outer edge of the building or the building group shall not be less than 5 H (H is the distance from the ground to the highest point of the building), the horizontal distance between the exit boundary and the outer edge of the building or building group should not be less than 10 H, and the vertical height from the highest point of the building or building group to the boundary should not be less than 5 H, and the distance between the outer edge of the building group and the side of the calculation area boundary shall not be less than 5 H[23]. That is, the size of the calculated area is 757.70 × 1,038.84 × 305 m (L × D × H), as shown in (Figure 3).
The grid is the smallest unit in CFD simulation and the geometric carrier of simulation and result analysis. The success of the simulation results has a lot to do with the quality of the grid. Too dense grids will take up too many computer resources; too sparse grids will cause errors in the calculation results. There are two main types of commonly used grids: structural grids and unstructured grids. When a single building is numerically simulated, the building’s windward side’s grid division requirements are relatively low. The meshing requirements for the top and the leeward side are higher. All simulations in this paper use structural grids, and the computational grids are composed of rectangular unit grids, which are encrypted around the building.
2.4 Boundary conditions and wind environment parameters
In the CFD simulation, to show the impact of overhead design on the surrounding wind environment more clearly, this paper only considers the impact of wind pressure on ventilation. It ignores thermal pressure on ventilation. In the setting of CFD simulation boundary conditions, the outlet boundary is the pressure boundary, the inlet boundary is set as the ideal atmospheric boundary layer, and the top and sides are zero gradient conditions. In the atmospheric boundary layer, terrain roughness affects the formation of gradient wind.
There are four types of ground roughness in Building Structure Load Code (GB 50009-2012)[24,25]: Maritime, rural, urban, and metropolitan centers. The process of airflow flowing through the ground will be affected by ground friction. When the distance from the ground is about 300-500 m or more, the influence of ground roughness on wind speed is negligible, and a free-flowing state is achieved.
The XJTLU Center Building is located in the Suzhou Industrial Park. There are many colleges and universities around it, and the building density is relatively low. There is no tall building obstructing the direction of the wind. The ground roughness classification belongs to Class C, with a ground roughness index of 0.22. The convergence criterion for all calculation examples is that the residual of each parameter is less than 10-4.
According to Suzhou meteorological data, the wind environment data in winter and summer are shown in Table 3. Combining Rhino + Ladybug to analyze the meteorological data in the Suzhou area, and explore the potential of natural ventilation in the Suzhou area. When the wind speed is greater than 1 m/s, the outdoor temperature is between 15 and 33 ℃, and the relative humidity (RH%) is between 30% and 80%, Suzhou has a good ventilation potential for 21.77% of the year. In 8,760 hours, 1,907 hours can adjust the indoor temperature through natural ventilation.
| Season | Average outdoor wind speed (m/s) | Most wind direction | Average wind speed in most wind directions (m/s) | Frequency of the most wind direction | Atmospheric pressure (Pa) |
| Winter | 3.5 | N | 4.8 | 16% | 102,410 |
| Summer | 3.5 | SE | 3.9 | 15% | 100,370 |
3. Results and Discussions
3.1 Validation of the turbulence model
When the building has no elevated design and the elevated design height is 2.7 m, the Vent simulation and the Butterfly simulation results are compared. The consistency between the two is further evaluated through correlation analysis (Figure 4). The coefficient of determination R2 can be used to assess whether the trend between Vent simulation and Butterfly simulation is consistent, and its value is between 0 and 1. When the value of R2 approaches 1, Vent and Butterfly’s simulation results are more similar; otherwise, the greater the deviation between the two works. The dots in Figure 5A,B indicate the correspondence between the results of Vent simulation and Butterfly simulation, and the solid line indicates y = x. Through calculation, it is obtained that R2 = 0.9743 when the design is without elevated, and R2 = 0.902 when the design height is 2.7 m, which shows that the Vent simulation and the Butterfly simulation are in good agreement, and the model can be used for subsequent analysis and simulation.
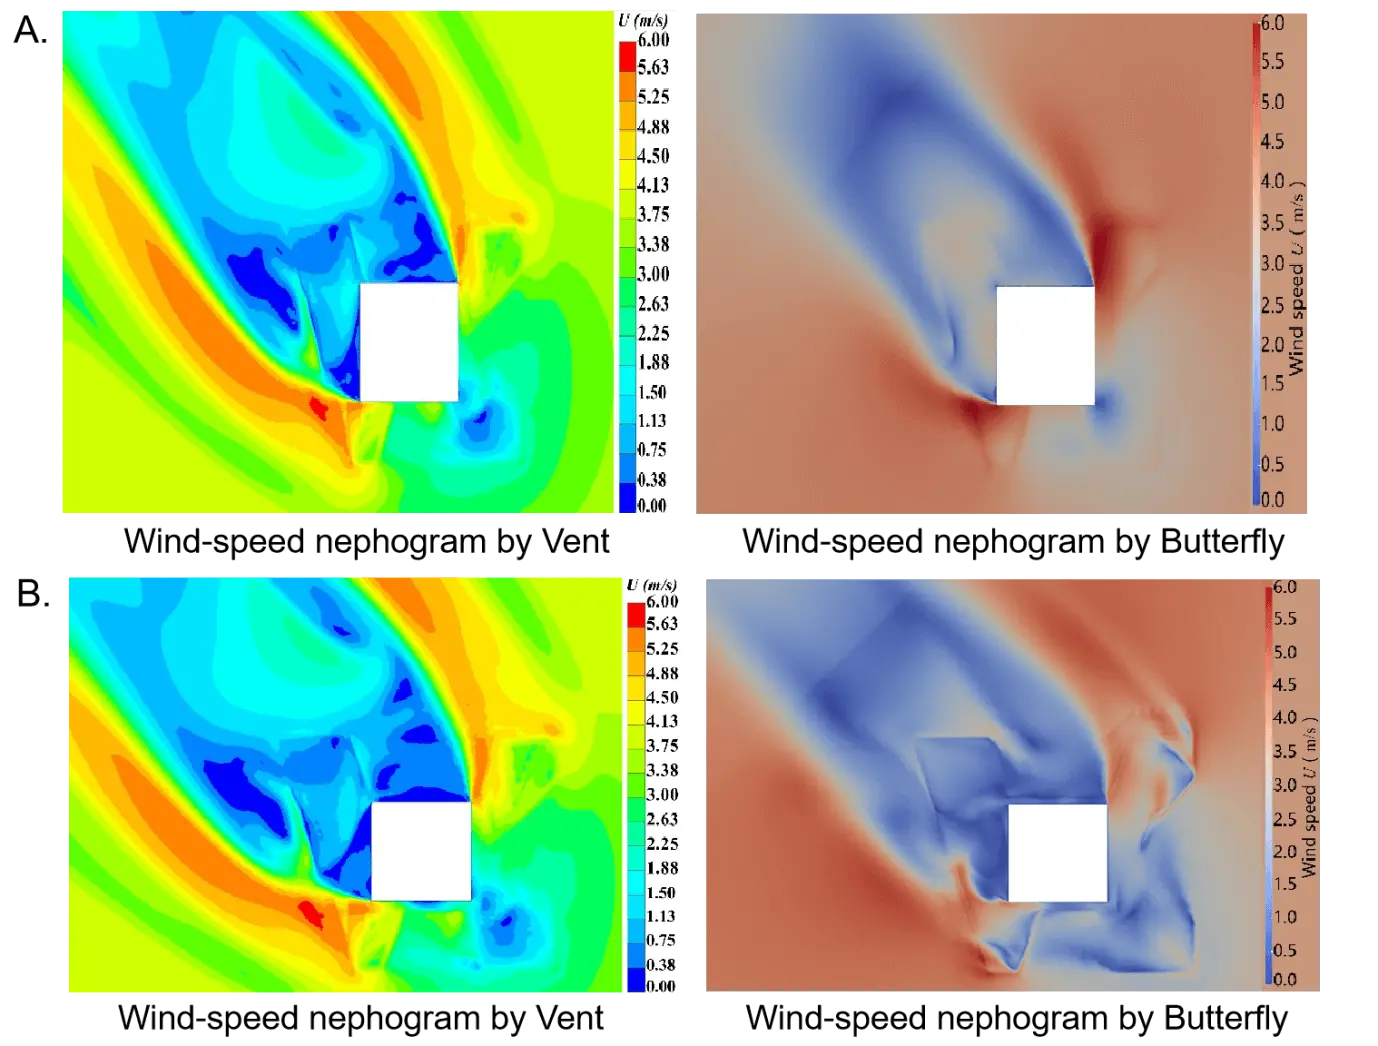
Figure 4. Comparison of vent and butterfly simulation results. (A) Simulation comparison of buildings without elevated; (B) Contrast building simulation is overhead 2.7 m.
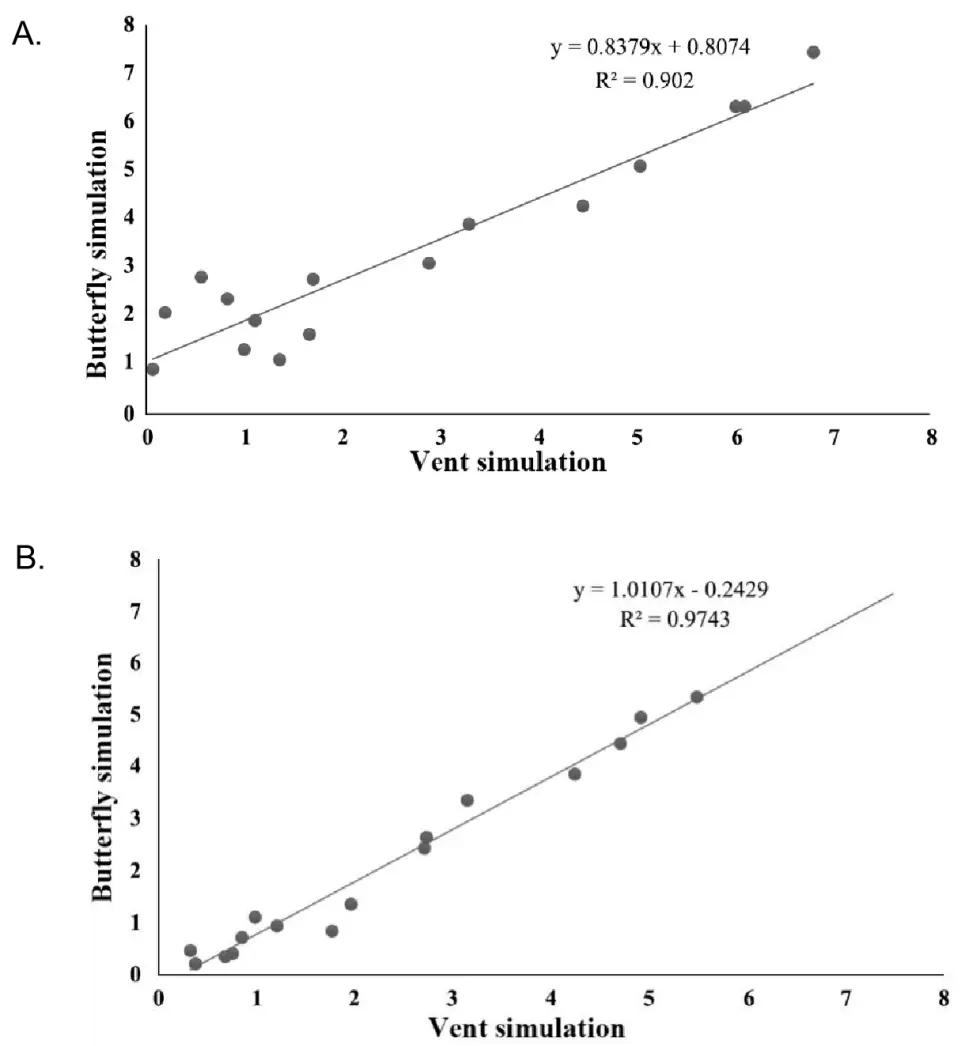
Figure 5. Validation of the turbulence model. (A) Fitting of vent and butterfly simulation results without elevated; (B) Fitting of simulation results between vent and butterfly at 2.7 m elevated.
3.2 Influence of overhead buildings on outdoor wind environment
Figure 6A,B,C,D,E shows the current elevated design (2.7 m, case 3) and the no elevated design of the two-story platform pedestrian height wind speed and the research object’s pressure distribution results in this paper. It can be seen from (Figure 6) that the flow field of natural airflow through the building (including with and without elevated layer) can be visualized under all test conditions, including the low wind speed area on the windward side and leeward side of the building, and the high wind speed area on both sides of the building and under the elevated layer.
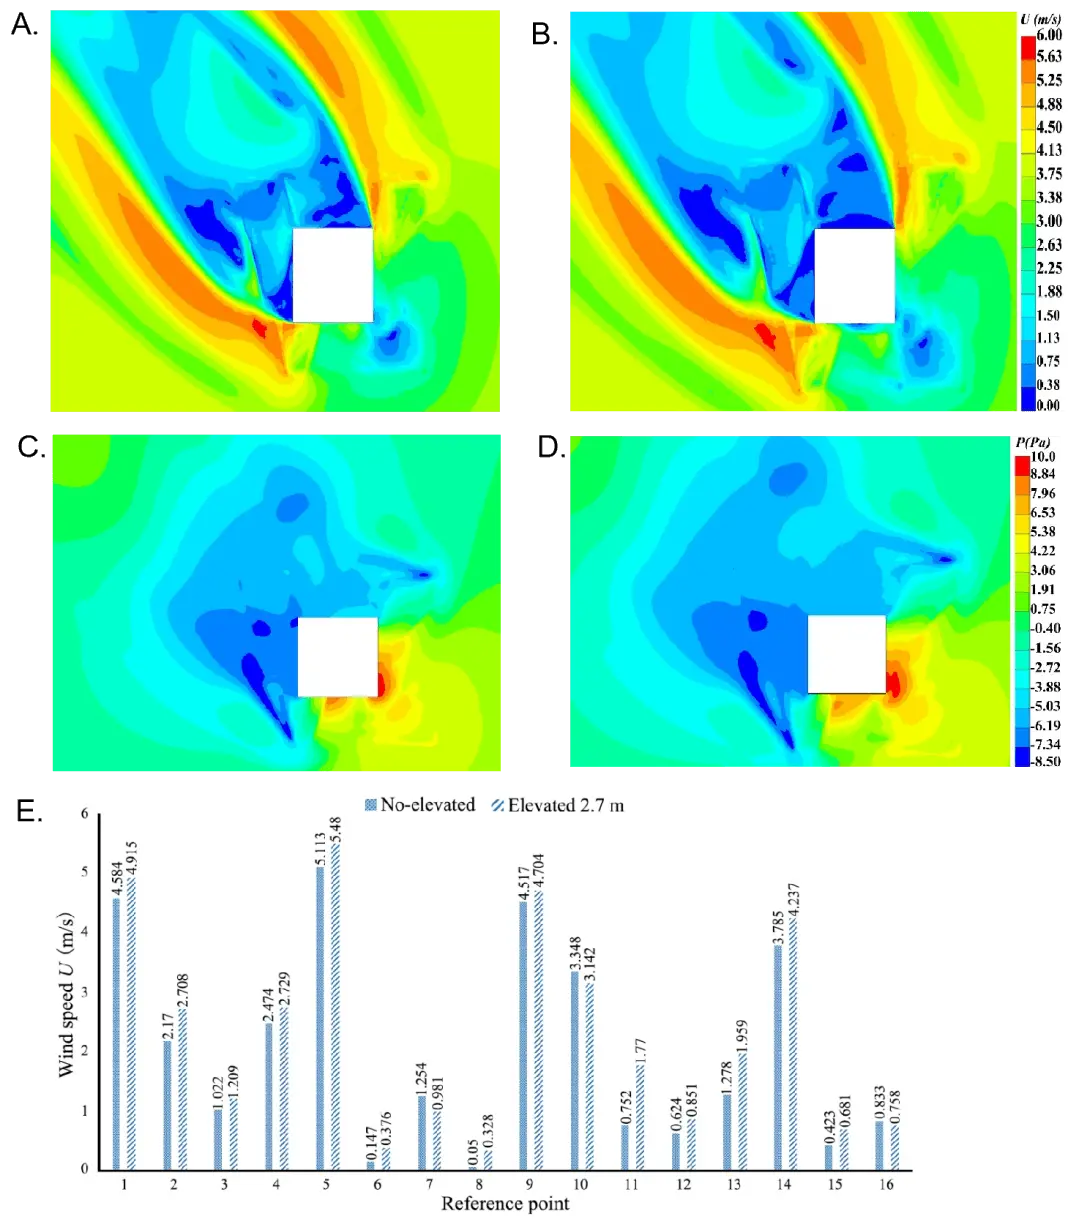
Figure 6. Comparison of results of non-elevated and existing elevated height (2.7 m). (A) No-elevated wind-speed nephogram; (B) Elevated 2.7 m wind-speed nephogram; (C) No-elevated pressure nephogram; (D) Elevated 2.7 m pressure nephogram; (E) Wind velocity contrast.
Through the wind speed and pressure distribution diagrams and numerical analysis of each working condition in Figure 5, it can be seen that after the elevated design of the XJTLU Center Building, the wind speeds of more than 80% of the reference points are significantly improved compared with the non-elevated design (Table 4). This is because the bottom of the building adopts an elevated design to form an open space so that the wind can flow freely. When the wind flows through the elevated area, the “Venturi effect” is generated between the bottom of the elevated layer, sidewalls, and the ground. The wind speed passing through the site is locally amplified, optimizing the wind environment around the building.
| RP number | Wind speed increment (m/s) | Wind speed changes (%) | RP number | Wind speed increment (m/s) | Wind speed changes (%) |
| 1 | 0.331 | 7.2 | 9 | 0.187 | 4.1 |
| 2 | 0.538 | 24.8 | 10 | -0.206 | -6.2 |
| 3 | 0.187 | 18.3 | 11 | 1.018 | 135.4 |
| 4 | 0.255 | 10.3 | 12 | 0.227 | 36.4 |
| 5 | 0.367 | 7.2 | 13 | 0.681 | 53.3 |
| 6 | 0.229 | 155.8 | 14 | 0.452 | 11.9 |
| 7 | -0.273 | -21.8 | 15 | 0.258 | 61 |
| 8 | 0.278 | 556 | 16 | -0.075 | -9.0 |
A positive value represents an increase in wind speed, a negative value represents a decrease in wind speed. RP: reference points.
3.3 Influence of different elevated height designs on outdoor pedestrian height wind environment
Figure 7 shows the wind environment distribution of 1.5 m horizontal height around the building with XJTLU central building as the prototype at different elevated design heights h. Figure 8 shows the wind speed change curve of each reference point windward area with various elevated heights. Table 5 lists the wind speed at each RP in the windward area when the elevated height is 2.7 m and 3.0 m and the sensitivity analysis of the wind speed increment and maximum values. The wind speed changes of the reference points to the windward area tend to be flat, so Figure 7 and Figure 8 only list the results between h = 2.4 ~ 3.9 m.
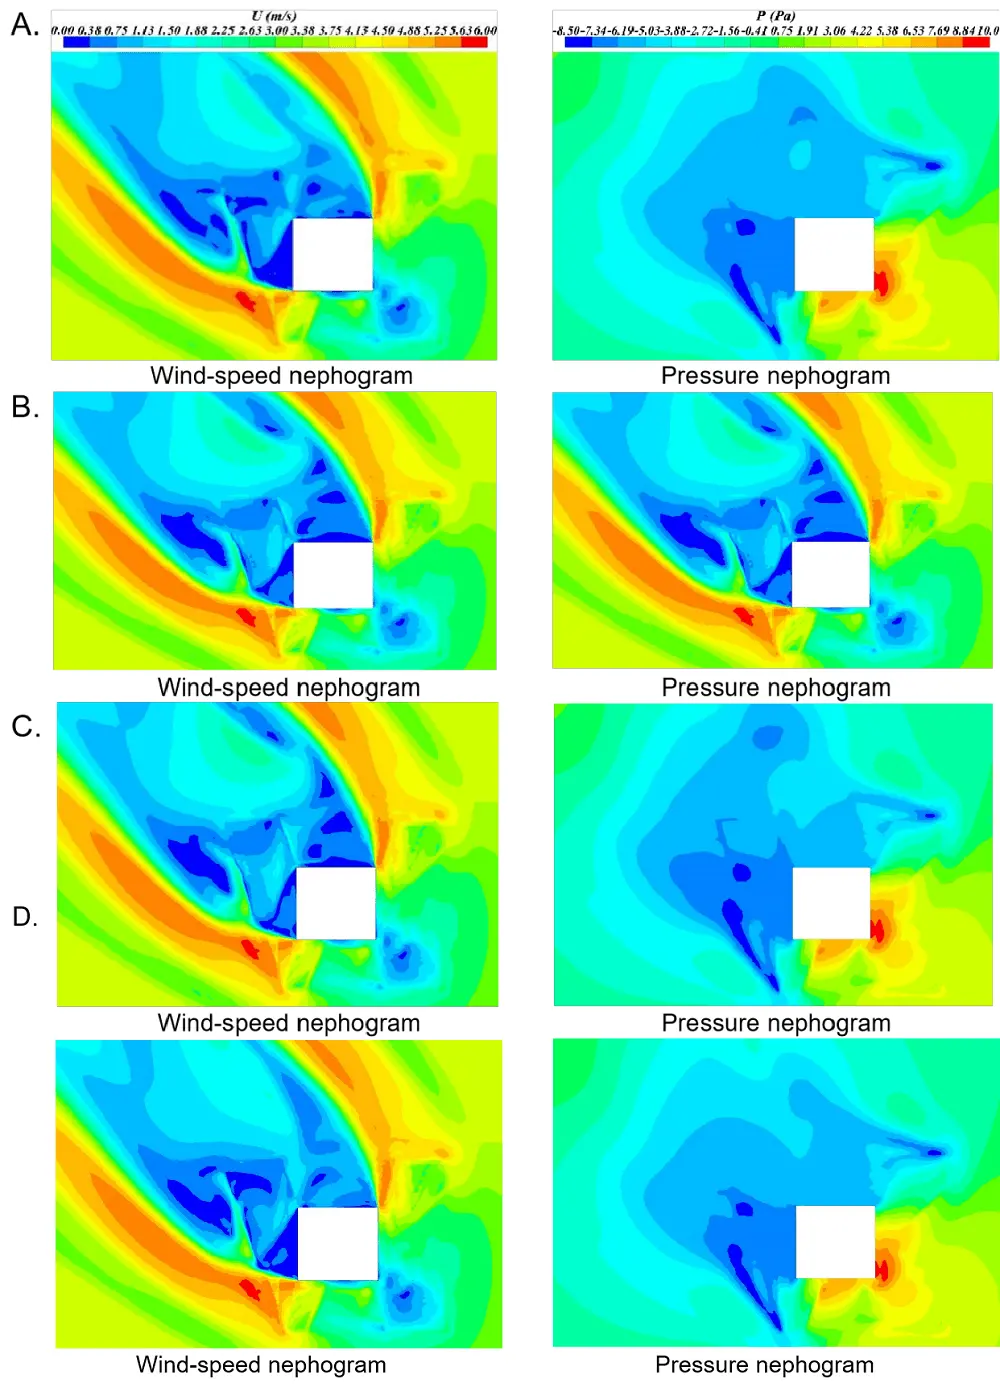
Figure 7. Influence of elevated height h on the wind environment at the pedestrian height. (A) h = 2.4 m; (B) h = 2.7 m; (C) h = 3.0 m; (D) h = 3.3 m.

Figure 8. Wind speed of reference points in the windward area at a different elevated height. RP: reference points.
| RP | 2.7 m elevated wind speed (m/s) | 3.0 m elevated wind speed (m/s) | 3.3 m elevated wind speed (m/s) | The absolute value of the difference between 3.0 m and 3.3 m elevated (m/s) | Ratio (%) |
| RP 1 | 4.915 | 4.835 | 4.814 | 0.021 | 0.43 |
| RP 2 | 2.708 | 2.524 | 2.618 | 0.094 | 3.59 |
| RP 3 | 1.209 | 0.928 | 0.881 | 0.047 | 5.06 |
| RP 4 | 2.729 | 2.648 | 2.709 | 0.061 | 2.25 |
| RP 5 | 5.48 | 5.235 | 5.36 | 0.125 | 2.33 |
| RP 9 | 4.704 | 4.413 | 4.397 | 0.016 | 0.36 |
| RP 10 | 3.33 | 3.142 | 3.329 | 0.187 | 5.62 |
| RP 11 | 1.77 | 0.857 | 0.887 | 0.03 | 3.38 |
| RP 12 | 0.851 | 0.726 | 0.741 | 0.015 | 2.02 |
| RP 13 | 1.959 | 1.361 | 1.364 | 0.003 | 0.22 |
| RP 14 | 4.237 | 3.843 | 3.814 | 0.029 | 0.75 |
RP: reference points.
From Table 5, the wind speed and pressure distribution diagram in Figure 7, and the wind speed change curve in Figure 8, we can see the wind speed changes at each reference point. In the windward zone, the elevated design height h is between 2.4 m and 2.7 m. With the increase of the elevated height, the wind speed at the horizontal height of 1.5 m around the building also gradually increases, and the elevated design height h is between 2.7 m and 3.0 m. Simultaneously, the 1.5 m wind speed increment at the horizontal height around the building becomes smaller as the elevated height increases. When the elevated design height h is more than 3.0 m, the wind speed at the pedestrian height around the building has no significant change than the wind speed at the 3.0 m elevated height. In the leeward area, eddy currents will be generated at different elevated heights, resulting in irregular wind speed changes at the leeward area’s reference points.
3.4 Influence of varying building height on outdoor pedestrian height wind environment with the same elevated height
Taking the XJTLU Central Building as a prototype, only the building’s height was changed to explore its impact on the pedestrian height (1.5 m) wind environment in the elevated area. Table 6 lists the building height corresponding to each case. Figure 9 shows the wind environment distribution of pedestrian height (1.5 m) in elevated building areas at different building heights h. Figure 10 shows the wind speed change curve of each reference point in the windward area of different building heights, high wind speed area, and low wind speed area.
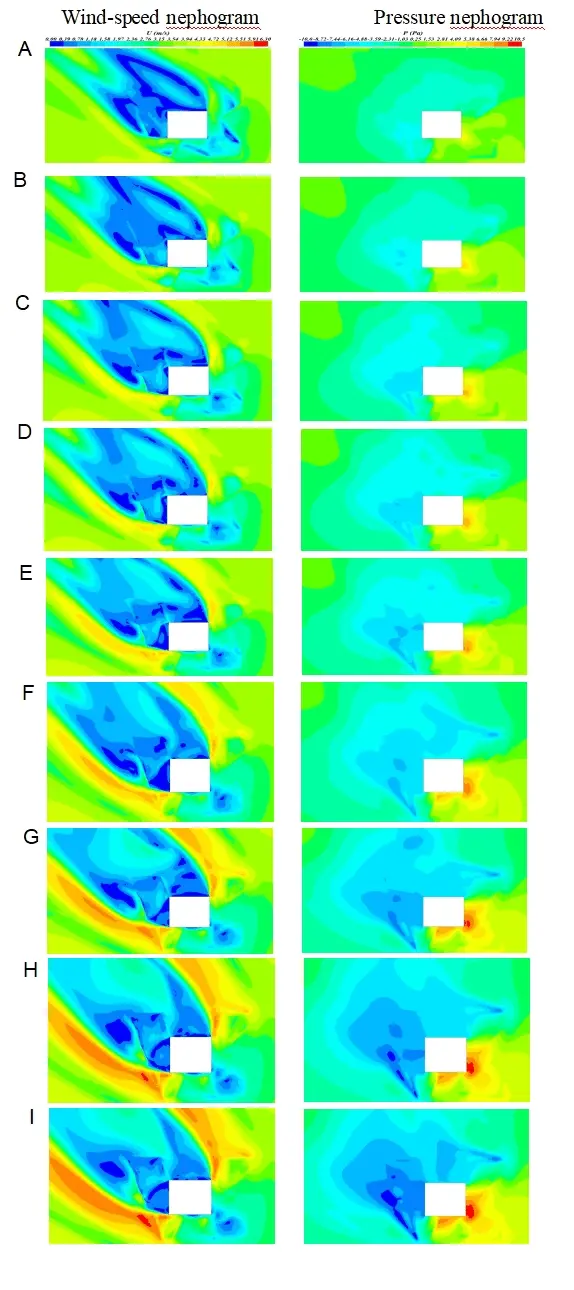
Figure 9. Influence of building height h on the wind environment of pedestrian height in the elevated area. (A) H = 24 m; (B) H = 30 m; (C) H = 36 m; (D) H=39m; (E) H = 45 m; (F) H = 51 m; (G) H = 61 m; (H) H = 66 m; (I) H = 72 m.
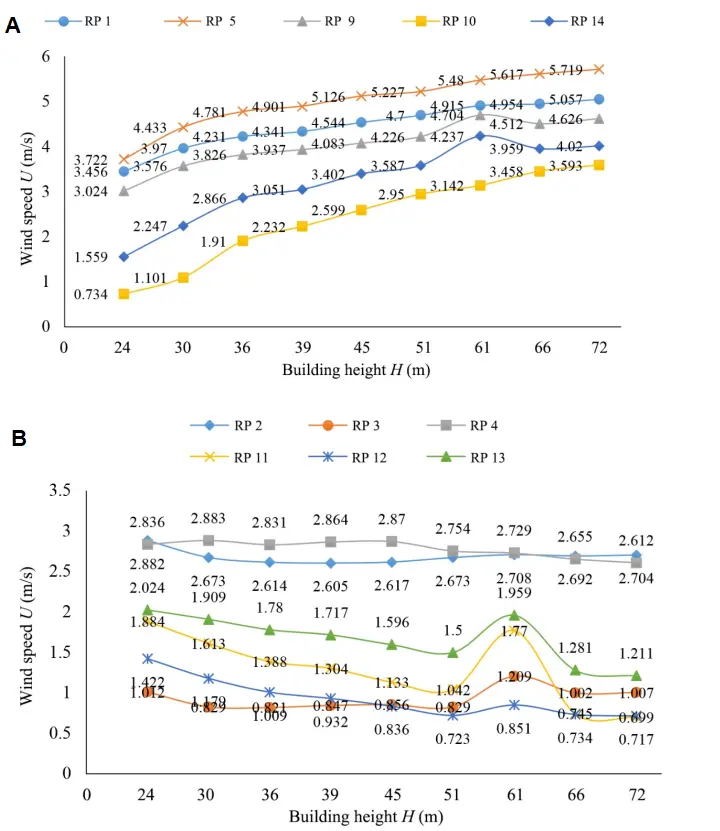
Figure 10. Wind speed variation curve of each reference point in the windward area with different building height. (A) Wind speed curve of reference points at the high wind speed area; (B) Wind speed curve of reference points at the low wind speed area. RP: reference points.
| Case | 1 | 2 | 3 | 4 | 5 | 6 | 7 | 8 | 9 |
| Elevated height h (m) | 2.7 | 2.7 | 2.7 | 2.7 | 2.7 | 2.7 | 2.7 | 2.7 | 2.7 |
| Building height H (m) | 24 | 30 | 36 | 39 | 45 | 51 | 61 | 66 | 72 |
CFD: computational fluid dynamics.
From the wind speed and pressure distribution in Figure 9 and the wind speed change curve in Figure 10, it can be seen that the wind speed changes at each reference point. In the windward high wind speed area (RP Number: 1, 5, 9, 10, 14), the building height h is between 24 m and 72 m, with the increase of the building height, the wind speed of each reference point in the elevated building area shows a gradually increasing trend; In the low wind speed area in the windward area (RP Number: 2, 3, 4, 11, 12, 13), the building height h is between 24 m and 72 m, with the increase of the building height, the wind speed of each reference point in the elevated area of the building presents a gradually decreasing trend. Different building heights will produce eddy currents in the leeward area, which leads to the irregular change of wind speed in the leeward area.
3.5 Influence of varying ratio of elevated height to elevate width of outdoor pedestrian height and wind environment
Taking the XJTLU center building as the prototype, the paper explores the influence of different elevated height-width ratios on the wind environment of pedestrian height (1.5 m) in the elevated area when the elevated design height h (2.7 m) is the same and the elevated width w is changed. Table 7 lists the corresponding elevated width w in each working condition. Figure 11 shows the wind environment distribution of pedestrian height (1.5 m) in the elevated area under different elevated height to width ratios, and Figure 12 shows the wind speed change curve of each reference point in the windward high wind speed area and low wind speed area under different elevated height to width ratio.
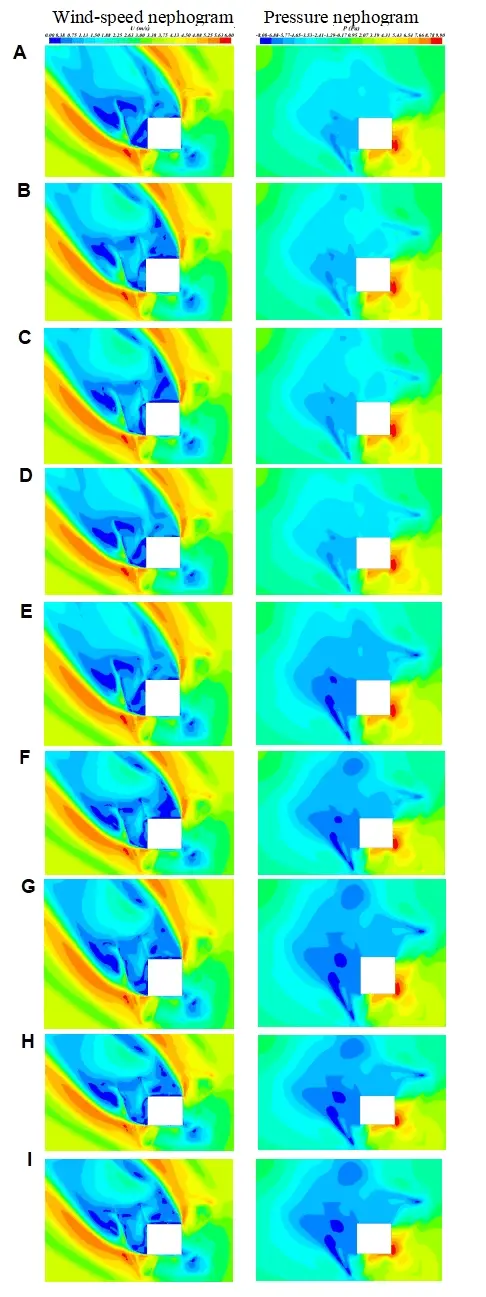
Figure 11. Effect of height-width ratio on pedestrian height and wind environment in the elevated area. (A) h/w = 0.64; (B) h/w = 0.67; (C) h/w = 0.72; (D) h/w = 0.78; (E) h/w = 0.86; (F) h/w = 1.0; (G) h/w = 1.2; (H) h/w = 1.38; (I) h/w = 1.5.
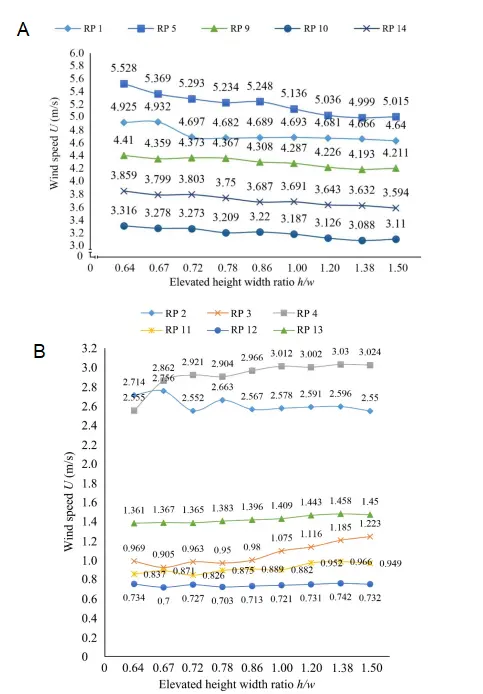
Figure 12. Wind speed variation curve of each reference point in the windward area with a different elevated height-width ratio. (A) Wind speed curve of reference points in the high wind speed area; (B) Wind speed curve of reference points in the low wind speed area. RP: reference points.
| Case | 1 | 2 | 3 | 4 | 5 | 6 | 7 | 8 | 9 |
| Elevated height h (m) | 2.7 | 2.7 | 2.7 | 2.7 | 2.7 | 2.7 | 2.7 | 2.7 | 2.7 |
| Elevated width w (m) | 4.20 | 4.05 | 3.75 | 3.45 | 3.15 | 2.70 | 2.25 | 1.95 | 1.8 |
| The ratio of height to width of elevated h/w | 0.64 | 0.67 | 0.72 | 0.78 | 0.86 | 1.0 | 1.2 | 1.38 | 1.5 |
CFD: computational fluid dynamics.
From the distribution of wind speed and pressure in Figure 11 and the wind speed curve in Figure 12, we can see the change in wind speed at each reference point. In the windward area with high wind speed (RP Number: 1, 5, 9, 10, 14), the height-width ratio of elevated buildings is between 0.64 and 1.5. With the increase of the height-width rate of elevated buildings, the wind speed of each reference point in the elevated area gradually decreases; In the low wind speed area of the windward area (RP Number: 2, 3, 4, 11, 12, 13), the height-width ratio of elevated buildings is between 0.64 and 1.5, and the wind speed of more than 67% of the reference points in elevated areas increases gradually, but the changing trend is not apparent. Different building heights will produce eddy currents in the leeward area, which leads to the irregular change of wind speed in the leeward area.
4. Conclusions
This study takes a typical high-rise public building in hot summer and cold winter areas as an example to study the impact of building elevated design on the outdoor wind environment and discusses the impact of building height H, elevated height h, and elevated width w on the wind environment of pedestrian height around the building. It provides data support for the design of the outdoor wind environment of high-rise public buildings in hot summer and cold winter areas and other climate areas and has certain reference significance.
In this paper, Vent 2020 software is used to study the impact of the building with or without elevated and different elevated heights on the pedestrian height wind environment around the building based on the standard k - ε model. The results show that:
1) When the height H of the building model and the elevated width w is kept constant, the elevated design height h is more significant than 2.4 m. The elevated design can improve the wind speed of the pedestrian height in the building’s windward area. When the elevated height is between 2.4 m and 3.0 m, the wind speed at the pedestrian height of 1.5 m around the building is more significant than that no-elevated design. When the elevated height is 2.7 m (the existing elevated height), the effect of improving the wind speed of pedestrian height in the windward area of the building is the best. When the elevated height is more excellent than 3.0 m, the influence of elevated design on the wind speed at 1.5 m in the building’s windward area tends to be flat.
2) When the height h and the width w of the building model remain unchanged, and the building height H varies between 24 m and 72 m, with the increase of the height of the building, the wind speed of each reference point at the windward area and the high wind speed area of the elevated area increases gradually; The height H of the building is between 24 m and 72 m, with the rise in the height of the building, the wind speed of the reference points at the windward area and the low wind speed area of the elevated site gradually decreases.
3) When the height H of the building model and the elevated height h is kept unchanged, and the overhead width w is changed, at the windward area with high wind speed, the height-width ratio of elevated buildings is 0.64 ~ 1.5. Increasing the width of elevated buildings w can increase the wind speed of each reference point in the elevated area; at the low wind speed area of windward area, the ratio of height to width of elevated buildings is 0.64 ~ 1.5, and more than 67% of the wind speed in the reference points of elevated buildings increases gradually. Still, the changing trend is not significant, which indicates that increasing the width of elevated buildings has no significant effect on each reference point’s wind speed change in this area.
Eddy current is generated in the leeward area of buildings, making the wind speed of pedestrian height in the leeward area of elevated site change irregularly.
In this paper, under ideal conditions, the influence of a single variable on the wind environment at the height of 1.5 m around the elevated building is considered. Due to space limitations, this paper only studied the influence of different elevated design heights on the wind environment of pedestrian height around the building but does not study the impact of the ratio of elevated area and superstructure plane area on the wind environment of pedestrian height around the building. At the same time, this paper selected the angle between the two sides of the building model’s windward side to be 90°. It does not consider the impact of the pedestrian height wind environment in the building’s elevated area when the angle between the two sides is other angles. These will be discussed in subsequent studies.
Authors contribution
All authors contributed equally to this work.
Conflicts of interest
The authors declare that there are no conflicts of interest.
Ethical approval
Not applicable.
Consent to participate
Not applicable.
Consent for publication
Not applicable.
Availability of data and materials
Not applicable.
Funding
The research described in this paper was supported by the Suzhou Housing and Urban-Rural Development Bureau ([2020]3, [2019]4).
Copyright
© The Author(s) 2022.
References
-
1. Liu J, Niu J, Ming MC, Xia Q. Detached eddy simulation of pedestrian-level wind and gust around an elevated building. Build Environ. 2017;125:168-179.[DOI]
-
2. Stathopoulos T, Wu H, Bédard C. Wind environment around buildings: A knowledge-based approach. J Wind Eng Ind Aerodyn. 1992;44(1-3):2377-2388.[DOI]
-
3. Xia Q, Liu X, Niu J, Kwok KCS. Effects of building lift-up design on the wind environment for pedestrians. Indoor Built Environ. 2017;26(9):1214-1231.[DOI]
-
4. Niu J, Liu J, Lee TC, Lin Z, Mark C, Tse KT, et al. A new method to assess spatial variations of outdoor thermal comfort: Onsite reference results and implications for precinct planning. Build Environ. 2015;91:263-270.[DOI]
-
5. Liu J, Zhang X, Niu J, Tse KT. Pedestrian-level wind and gust around buildings with a lift-up design: Assessment of influence from surrounding buildings by adopting LES. Build Simul. 2019;12:1107-1118.[DOI]
-
6. Liu J, Niu J, Xia Q. Combining measured thermal parameters and simulated wind velocity to predict outdoor thermal comfort. Build Environ. 2016;105:185-197.[DOI]
-
7. Tse KT, Zhang X, Weerasuriya AU, Li SW, Kwok KCS, Mak CM, et al. Adopting ‘lift-up’ building design to improve the surrounding pedestrian-level wind environment. Build Environ. 2017;117:154-165.[DOI]
-
8. Fanger PO. Thermal comfort: analysis and applications in environmental engineering. Copenhagen: Danish Technical Press; 1972.
-
9. Zhang H, Arens E, Huizenga C, Han T. Thermal sensation and comfort models for non-uniform and transient environments, part III: Whole-body sensation and comfort. Build Environ. 2010;45(2):399-410.[DOI]
-
10. Fang Z, Feng X, Liu J, Lin Z, Mak CH, Niu J, et al. Investigation into the differences among several outdoor thermal comfort indices against field survey in subtropics. Sustainable Cities Soc. 2019;44:676-690.[DOI]
-
11. Xie Y, Huang T, Li J, Liu J, Niu J, Mak C, et al. Evaluation of a multi-nodal thermal regulation model for assessment of outdoor thermal comfort: sensitivity to wind speed and solar radiation. Build Environ. 2018;132:45-56.[DOI]
-
12. Yoshine R, Mochida A, Tominaga Y, Kataoka H, Harimoto K, Nozu T, et al. Cooperative project for CFD prediction of pedestrian wind environment in the Architectural Institute of Japan. J Wind Eng Ind Aerodyn. 2007;95(9-11):1551-1578.[DOI]
-
13. Janssen WD, Blocken B, van Hooff T. Pedestrian wind comfort around buildings: Comparison of wind comfort criteria based on whole-flow field data for a complex case study. Build Environ. 2013;59:547-562.[DOI]
-
14. Du Y, Ming Mak C, Liu J, Xia Q, Niu J, Kwok KCS. Effects of lift-up design on pedestrian level wind comfort in different building configurations under three wind directions. Build Environ. 2017;117:84-99.[DOI]
-
15. Ding Y, Wang Q. ANSYS ICEM CFD: From beginners to masters. Tsinghua University Press; 2013.
-
16. Yang J, Wang Z, Tian Z. Comparative study on ventilation effect of high-rise residential buildings based on CFD simulation: A case study of Sui Wo Court in Hongkong. J Suzhou Uni Sci Technol. 2018;31(3):57-62. Available from: https://m.fx361.com/news/2018/1015/16159852.html
-
17. GBSWARE. Vent user manual, Beijing GBSWARE company; 2016.
-
18. Ministry of Housing and Urban-Rural Development of the People’s Republic of China. JGJ/T 309-2013, Building ventilation effective test and evaluation standard. Beijing: China Construction Industry Press; 2013.
-
19. Liu J, Niu J. CFD simulation of the wind environment around an isolated high-rise building: An evaluation of SRANS, LES and DES models. Build Environ. 2016;96:91-106.[DOI]
-
20. Hooff T, Blocken B, Tominaga Y. On the accuracy of CFD simulation of cross-ventilation flows for a generic isolated building: Comparison of RANS, LES and experiments. Build Environ. 2017;114:148-165.[DOI]
-
21. Blocken B. LES over RANS in building simulation for outdoor and indoor applications: A foregone conclusion? Building Simulation. 2018;11(5):821-870.[DOI]
-
22. Tominaga Y, Stathopoulos T. Numerical simulation of dispersion around an isolated cubic building: comparison of various types of k - ε Models, Atmos Environ. 2009;43:3200-3210.[DOI]
-
23. Franke J, Hellsten A, Schlünzen H, Carissimo B. Best practice guideline for the CFD simulation of flows in the urban environment, COST Action 732 Quality assurance and improvement of microscale meteorological models. Meteorological Inst; 2007. Available from: https://www.researchgate.net/publication/257762102_Best_Practice_Guideline_for_the_CFD_Simulation_of_Flows_in_the_Urban_Environment_COST_Action_732_Quality_Assurance_and_Improvement_of_Microscale_Meteorological_Models
-
24. China Engineering Construction Standardization Association. GB 50009-2012, Building structure load code. Beijing: China Construction Industry Press; 2012. Available from: https://www.chinesestandard.net/PDF.aspx/GB50009-2012
-
25. Ministry of Housing and Urban-Rural Development of the People’s Republic of China. GB 50736-2012, Design Code for Heating Ventilation and Air Conditioning of Civil Buildings [S]. Beijing: China Construction Industry Press; 2012. Available from: https://www.chinesestandard.net/PDF.aspx/GB50736-2012
Copyright
© The Author(s) 2024. This is an Open Access article licensed under a Creative Commons Attribution 4.0 International License (https://creativecommons.org/licenses/by/4.0/), which permits unrestricted use, sharing, adaptation, distribution and reproduction in any medium or format, for any purpose, even commercially, as long as you give appropriate credit to the original author(s) and the source, provide a link to the Creative Commons license, and indicate if changes were made.
Publisher’s Note
Share And Cite

