Abstract
Dense buildings in modern cities make street pollutants more and more difficult to disperse, and the exposure level of urban residents to pollutants has increased significantly. This study focuses on the spatial and temporal distribution of ambient air pollution in urban streets and the relationship between street morphology and pollutant dispersion, and explores ways to reduce ambient air pollution in streets through spatial design. The study used the CityGrid urban grid data monitoring station to conduct an empirical study on an urban trunk road in Wuhan during the winter of 2020 to 2021, monitoring pollutants including NO2, O3, PM2.5, and PM10. The results showed that pollutant concentration changes in the near-road environment are affected by a combination of meteorological elements and traffic flow characteristics. The wind parallel to the road is more favorable to evacuate pollutants inside the street canyon, and the ambient wind above the canyon perpendicular to the road causes vortices in the canyon that cause gaseous pollutants to accumulate on the leeward side of the canyon. The distribution of particulate pollutants is mainly related to the distance of road pollutant sources. Building access ventilation can effectively evacuate street pollutants, and NO2 and O3 decay to stable levels in shorter distance from the road than PM2.5 and PM10 in downwind direction. The future urban street planning can effectively alleviate street pollution levels through strategies such as street canyon morphology control, green landscape facilities arrangement, increasing the building interface opening, and building bottom overhead.
Keywords
1. Introduction
With the rapid development of economy and the advancement of urbanization, urban air pollution is becoming increasingly serious[1]. In 2019, the number of deaths caused by ambient air pollution reached 4.5 million globally[2]. Urban streets are important activity places for urban residents, and also the areas with the highest concentration of pollutants emitted by motor vehicles[3]. In high-density cities, especially in central urban areas, buildings on both sides of roads are continuously distributed to form street canyons[4]. The blocking of buildings causes a cumulative effect of pollutants, exposing pedestrians and residents to higher air pollution[5]. Epidemiology and toxicology have shown that long-term exposure to high concentrations of polluted air can seriously damage people’s health, leading to cardiovascular and chronic respiratory diseases, and even lung cancer[6-7].
Since the Ministry of Ecology and Environment of China issued the new ambient air quality standard (GB3095-2012) in 2012, nitrogen oxides (NOX), ozone (O3), particulate matter (PM) and other pollutants have become the main pollutants for urban air pollution control. The main source of NOX and PM in the street environment is vehicle exhaust emission[8], among which NO2, PM2.5 and PM10 have high content and great harm to human body. NO2 is a red-brown respiratory irritant gas, PM2.5 and PM10 are particulate matter with a diameter of 2.5 and 10 microns or less, respectively. O3 is a secondary pollutant, which is generated by a series of chemical reactions of NOX, carbon monoxide (CO), volatile organic compounds (VOCs) and other precursors[9].
The investigation of air pollution in urban street environment has always been a difficult task due to the diverse arrangement of buildings, the uncertainty of the location of pollution sources and the complex turbulence characteristics of urban canopies[10]. Model simulation and field measurement are two main methods applied to the study of urban street air pollution[11]. In model simulation studies, urban street environment is often idealized, and there are unexpected differences between the results of numerical models and the actual situations[12]. The field measurement results can truly reflect the distribution of pollutants, which can also provide parameters for the numerical model and evaluate the output results of the numerical model[13].
Many studies have studied the horizontal and vertical distribution characteristics of air pollutants in street canyons based on field measurements[14,15]. The flow field and pollutant distribution inside streets show spatial variations due to the various geometric characteristics of street canyons[16], which also affect the interaction between indoor and outdoor air of street buildings. Especially for naturally ventilated buildings, street air pollution is a key factor affecting indoor air quality[17,18]. Studying the air pollution characteristics of street canyons is conductive to provide references for the ventilation design of street buildings. Since the street is not closed, its internal pollutants will spill out and form the “road impact zone”[19]. People within 100-500 m from the main road will still be directly affected by vehicle emissions[20,21], and the diffusion characteristics of various pollutants on both sides of the road are also very different[22].
As for the influencing factors of street air pollution, previous studies focused on traffic conditions[23,24], meteorological elements[25,26], street spatial forms[27,28], street facilities[29,30], etc. Street pollution levels are closely related to traffic flow[31,32]. Freight vehicles, especially heavy diesel vehicles, are the main emission sources of traffic pollutants[33]. In terms of meteorological elements, wind, air pressure, atmospheric stability, precipitation, temperature and humidity can all affect the formation, diffusion, migration and transformation of pollutants[34,35]. The good ventilation environment is an effective factor to promote the rapid diffusion of pollutants in streets. Street ventilation is affected by meteorological conditions, topography and geometric structure of streets. Relevant street shape variables include aspect ratio (H/W, H is the building height and W is the street width), symmetry (h1/h2, h1, h2 are the heights of buildings on both sides of the street respectively), sky visibility factor, etc.[36,37]. To study the influence of street geometric characteristics on street air pollution characteristics, and improve street ventilation through street form planning becomes an effective means to improve the quality of street air environment.
The microscopic distribution characteristics of pollutants in typical street scenes still need to be further revealed. In addition, few studies focus on the difference of pollution characteristics of various pollutants. In this research, a typical trunk road in Wuhan was selected to conduct a measured study on four pollutants, NO2, O3, PM2.5 and PM10. This study revealed the differences in pollution characteristics between the near road environment and the background environment, analyzed the temporal variation of pollutants and their influence by traffic and meteorological factors. The spatial distribution of pollutants in street canyon and building access was revealed through multiple groups of measurement points arrangement, and the method of comparing the pollution levels of measurement points under different simultaneous measurements was proposed. In addition, the influence of wind environment on the street pollution was further discussed. Based on the spatial characteristics of pollutants, the optimization strategies of street geometry and ventilation of the roadside buildings were proposed.
2. Materials and Methods
2.1 Sampling points and times
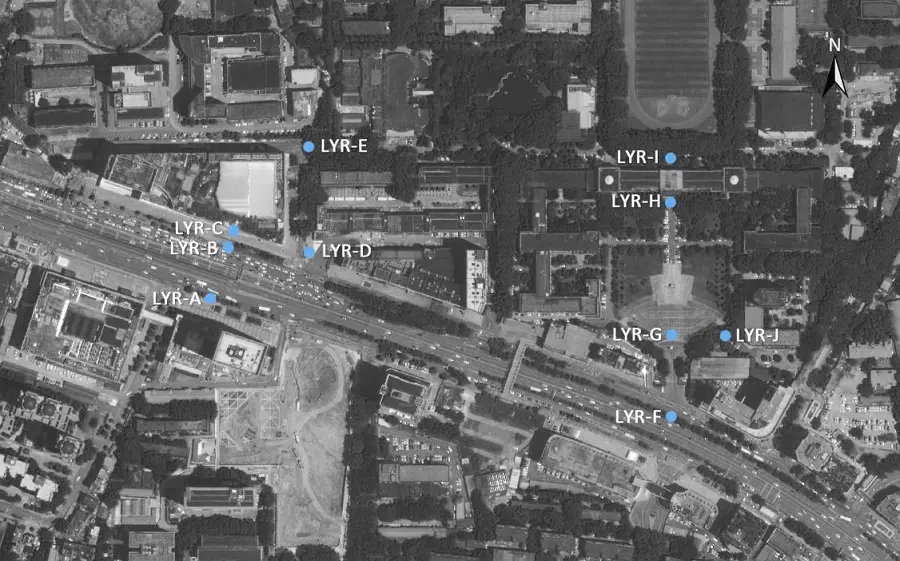
This study was conducted during November 2020 to January 2021 on Luoyu Road in Wuchang District, Wuhan City, which is an important east-west traffic artery. The measured area is located in the center of the city and there are no large industries around, and the main source of pollution is motor vehicle emissions. The arrangement of measurement points is shown in Figure 1. LYR-A, LYR-B and LYR-C are arranged along the road section inside the street canyon. Among them, LYR-A and LYR-B are respectively located at the edge of the motorway on the south and north sides of Luoyu Road, LYR-C is adjacent to the building on the north side. LYR-D is located at the entrance of a building access, LYR-E is located 90m north of LYR-D, and there is a pedestrian channel between the two points, with street trees planted on both sides. LYR-F, LYR-G, LYR-H and LYR-I are located in another building access on the north side of the road, which are arranged 0m, 80m, 220m and 250m away from the road edge respectively. LYR-J is arranged parallel to LYR-G, but there is a building barrier between it and the road.
A key factor in evaluating the incremental contribution of street air pollution is the estimation of background concentrations[38]. The background concentration is affected by the combined effect of urban integrated pollution emissions, geographical environment and climatic conditions. The monitoring data near and upwind of the study area is generally chosen to represent the background concentration[39]. In this study, a measurement point (BG-LJM) far from the city road is selected as the background measurement point. The dominant wind direction in winter in Wuhan is north and northeast, and this measurement point is located in the northeast of the measured area, at a distance of about 1.6 km from Luoyu Road, which can well reflect the variation of background pollutant concentration.
The field measurements were conducted from November 30 to December 4, 2020 and from January 11 to January 15, 2021. Taking into account the differences in air pollution characteristics due to road traffic conditions between weekdays and rest days, all measurements were conducted on weekdays, and the daily measurement period was from 6:00 to 20:00. The basic information of measurement points is shown in Table 1.
| Monitoring points | Distance from the road edge | Monitoring height | Actual measurement time |
| LYR-A | 1 m | 1.5 m | 2020.11.30-2021.12.4 |
| LYR-B | 1 m | 1.5 m | 2020.11.30-2021.12.4 |
| LYR-C | 15 m | 1.5 m | 2020.11.30-2021.12.4 |
| LYR-D | 15 m | 1.5 m | 2021.1.11-2021.1.12 |
| LYR-E | 105 m | 1.5 m | 2021.1.11-2021.1.12 |
| LYR-F | 1 m | 1.5 m | 2021.1.13-2021.1.15 |
| LYR-G | 80 m | 1.5 m | 2021.1.13-2021.1.15 |
| LYR-H | 220 m | 1.5 m | 2021.1.13-2021.1.15 |
| LYR-I | 250 m | 1.5 m | 2021.1.13-2021.1.15 |
| LYR-J | 90 m | 1.5 m | 2021.1.13-2021.1.15 |
| BG-LJM | 1.6 km | 3.0 m | 2020.11.30-2021.12.4 2021.1.11-2021.1.15 |
2.2 Data measurement and processing
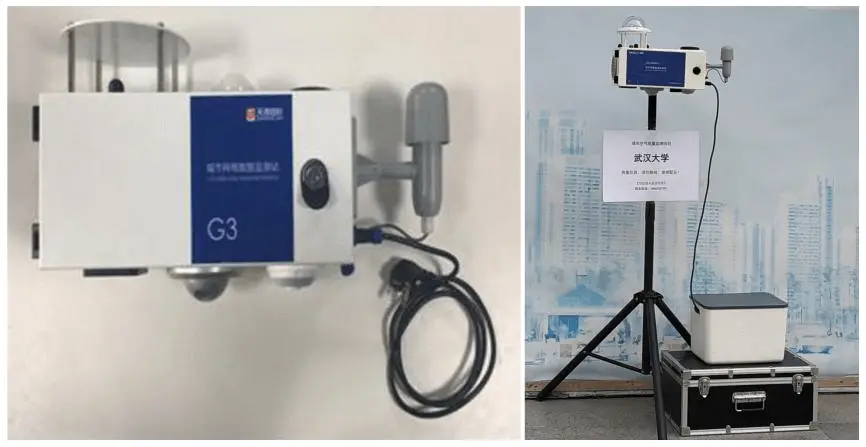
This experiment uses the CityGrid urban grid data monitoring station (version G3.2) to monitor road air pollutants and related meteorological data, as shown in Figure 2. CityGrid is the third-generation upgraded outdoor unit product launched by Beijing Xiangsu Technology Co., LTD. It adopts integrated software and hardware design, intelligent online data uploading and cloud data management. The device can monitor 20 parameters at the installation: light, UV, temperature, humidity, water level, wind direction, wind speed, atmospheric pressure, noise, PM2.5, PM10, NO2, SO2, CO, CO2, O3, VOC, pedestrian flow, vehicle flow, vehicle speed, etc. The built-in sensors have a wide measurement range and are calibrated by a high-precision laboratory to collect environmental data effectively and accurately, with a maximum data acquisition frequency of 100 ms per time. In this study, four pollutant mass concentrations of NO2, O3, PM2.5, PM10 and six meteorological data of temperature, humidity, illumination, air pressure, wind speed and wind direction were collected with a data generation frequency of 1 item/minute.
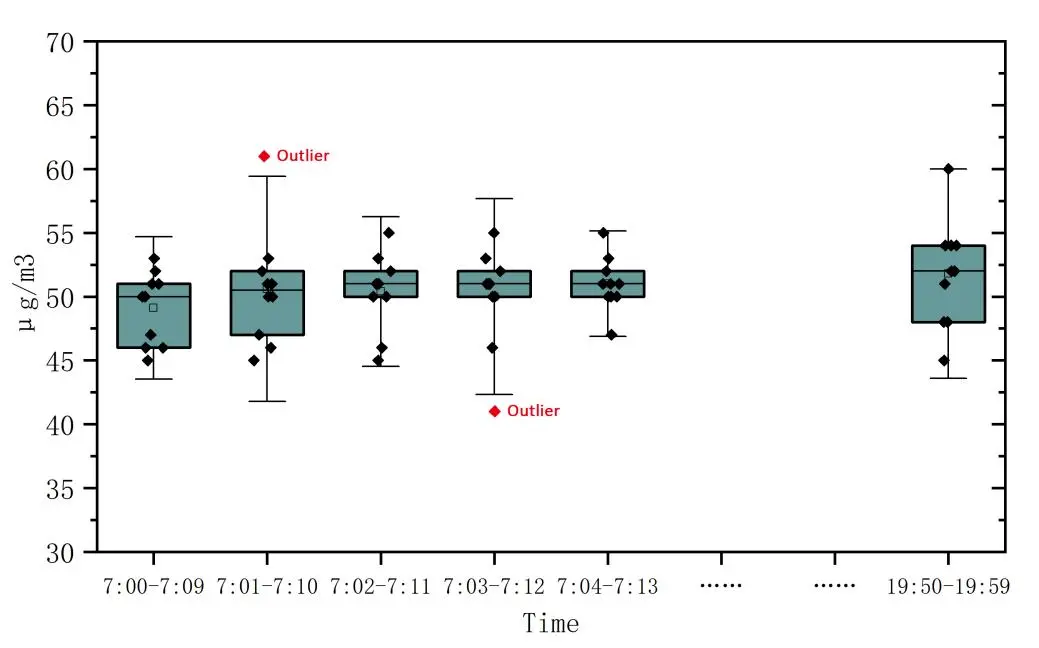
The raw data collected had erroneous or abnormal data that needed to be removed due to the influence of CityGrid instruments themselves or external forces. The pollutant mass concentration data and meteorological element data of each measurement point were pre-processed using SPSS software. The changes of pollutants and meteorological elements at each measurement point were plotted in time series order, and the missing and fixed values of various pollutants and meteorological data were screened out. The screening of data extremes is shown in Figure 3, with a 10-minute sliding window for continuous checking along the time axis, setting a confidence interval of 95% for the mean value of the statistic, and determining the location of the extremes and the time point at which the data are located[40]. The missing and fixed values in the original data were uniformly treated as non-zero null values. The maximum or minimum value is replaced by the average value of 5 minutes before and after the point at which the extreme value is located
2.3 Data analysis
2.3.1 Descriptive analysis
The coordinates of the monitoring points were projected onto the general horizontal axis Mercator 49N area. The vertical distance between the monitoring point and the road edge was calculated, and the monitoring points were divided into “near road” (< 30 m), “middle” (30-100 m) and “long distance” (> 100 m). The wind speed is classified into three levels (< 3 m/s, 3-5 m/s, > 5 m/s). The road wind angle is calculated by subtracting the road deflection angle from the wind direction. If the absolute value of the angle is less than or equal to 30°, the wind is considered parallel to the road. If the absolute value of the angle is between 60-90°, the wind is considered perpendicular to the road. It can further determine whether the monitoring point is in the upwind or downwind direction.
Descriptive analysis depicts the street pollution level, meteorological characteristics and traffic conditions, and examines the differences of pollution level caused by the spatial environment of the street, wind direction, and the distance from the road. The results are shown in line chart, histogram, and box diagram, and the indicators used include average concentration and normalized concentrations (see below).
2.3.2 Correlation analysis
In this study, the Pearson correlation coefficient method was used to test the correlation between pollutant concentrations and meteorological elements, in which the ground meteorological elements include temperature, humidity, lightness, air pressure and wind speed. In order to consider the influence of road traffic conditions on pollutants, the influence of background concentration needs to be excluded. The study uses the average hourly concentration of pollutants at road monitoring points minus the background concentration to obtain the corrected pollutant concentration, and performs correlation analysis on it and traffic indicators.
2.3.3 Normalization method
The monitored pollutant concentrations reflect the combined contribution of many emission sources, such as regional traffic, industry, and long-range sources. And they are influenced by meteorological and traffic conditions, with large fluctuations over time, even when monitored at the same measurement point. The pollutant concentrations at each measurement point monitored at the same time can be used to directly compare, because the effects of various factors on different measurement points in a small distance range can be considered consistent. But the pollutant concentrations at each measurement point monitored at different times cannot be used for direct comparison. Related studies usually normalize the monitored pollutant concentrations based on wind speed or traffic volume[41,42], but the data are relatively difficult to obtain. In this study, two normalization methods were used. The first method normalizes to the background concentration, dividing the observed near-road pollutant concentration by the background pollutant concentration to obtain the index of relative pollution level. The second method normalizes to the road edge concentration, which compares the concentration of pollutants near the road with the concentration measured at the expected point of maximum pollutant impact (road edge).
These two normalization methods are used to analyze the attenuation characteristics of near-road pollutants. Normalization to background concentration gives a clear indication of whether and where the measured pollutant drops to background levels. When the value is close to 1, the monitored pollutant concentration approaches the background concentration. Normalized to the road edge concentration provides a visual representation of the pollutant decay rate. When the normalized value reaches a steady-state value, ideally the monitored pollutant concentration is close to or reaches the background concentration. But due to unknown local pollutant sources and the uncertainty of time variability and measurements[43], the pollutant concentration usually drops to a stable level above the background concentration.
3. Results
3.1 Meteorological and pollutant concentration monitoring
According to the meteorological data of Wuhan, the weather was mainly sunny and cloudy during the measurement period, with good air quality and wind class 3 (3.3-5.4 m/s) or less. The meteorological conditions of each monitoring point are shown in Table 2.
| Measurement points | Statistical values | Temperature(℃) | Humidity(%RH) | Light level (Lux) | Atmospheric pressure(hpa) | Wind path angle frequency (%) | Wind speed frequency (%) | ||||
| 0-30° | 30-60° | 60-90° | 0-3m/s | 3-5m/s | > 5m/s | ||||||
| LYR-A | AVE | 7.6 | 70.3 | 3,947.9 | 1,028.5 | 72.6 | 22.5 | 4.9 | 12.0 | 24.6 | 63.4 |
| MIN | 3.8 | 36.8 | 0.0 | 1,022.6 | |||||||
| MAX | 14.8 | 92.9 | 18,063.0 | 1,033.3 | |||||||
| LYR-B | AVE | 9.1 | 61.6 | 5,331.3 | 1,028.1 | 46.0 | 29.4 | 24.6 | 29.7 | 29.1 | 41.3 |
| MIN | 3.9 | 21.9 | 0.0 | 1,022.1 | |||||||
| MAX | 19.1 | 88.4 | 39,628.0 | 1,032.8 | |||||||
| LYR-C | AVE | 8.5 | 65.9 | 6,884.1 | 1,027.7 | 56.7 | 15.4 | 27.9 | 82.6 | 14.4 | 2.9 |
| MIN | 3.7 | 26.1 | 0.0 | 1,021.7 | |||||||
| MAX | 17.4 | 92.3 | 42,762.0 | 1,032.4 | |||||||
| LYR-D | AVE | 8.3 | 29.8 | 12,156.9 | 1,025.1 | 27.6 | 21.2 | 51.2 | 42.2 | 30.0 | 27.8 |
| MIN | 1.6 | 11.7 | 4.0 | 1,016.3 | |||||||
| MAX | 15.3 | 62.9 | 54,927.0 | 1,033.7 | |||||||
| LYR-E | AVE | 6.2 | 36.7 | 391.7 | 1,024.7 | 76.2 | 16.7 | 7.2 | 58.8 | 33.5 | 7.7 |
| MIN | 1.4 | 19.8 | 0.0 | 1,015.9 | |||||||
| MAX | 12.0 | 61.6 | 14,653.0 | 1,033.2 | |||||||
| LYR-F | AVE | 13.1 | 42.0 | 3,165.6 | 1,014.3 | 38.4 | 27.9 | 33.7 | 24.2 | 27.2 | 48.6 |
| MIN | 2.3 | 16.7 | 24.0 | 1009.6 | |||||||
| MAX | 20.1 | 92.7 | 34,836.0 | 1,017.5 | |||||||
| LYR-G | AVE | 13.2 | 38.6 | 14,517.3 | 1,013.1 | 20.1 | 40.8 | 39.0 | 30.2 | 25.4 | 44.4 |
| MIN | -0.3 | 14.7 | 0.0 | 1,008.5 | |||||||
| MAX | 23.7 | 90.5 | 60,825.0 | 1,016.4 | |||||||
| LYR-H | AVE | 13.4 | 38.3 | 8,355.9 | 1,013.4 | 18.8 | 74.3 | 7.0 | 84.2 | 13.3 | 2.6 |
| MIN | 2.8 | 14.2 | 0.0 | 1,008.7 | |||||||
| MAX | 24.6 | 75.3 | 59,351.0 | 1,016.6 | |||||||
| LYR-I | AVE | 11.6 | 43.6 | 2,012.0 | 1,013.7 | 43.2 | 9.2 | 47.7 | 91.4 | 7.2 | 1.5 |
| MIN | 2.2 | 22.6 | 5.0 | 1,009.0 | |||||||
| MAX | 16.9 | 79.3 | 5,483.0 | 1,017.2 | |||||||
| LYR-J | AVE | 12.7 | 43.8 | 3,100.1 | 1,013.7 | 42.8 | 25.1 | 32.0 | 55.8 | 30.2 | 14.0 |
| MIN | 0.4 | 11.4 | 3.0 | 1,008.9 | |||||||
| MAX | 27.1 | 90.2 | 21,473.0 | 1,017.1 | |||||||
LYR: Luoyu Road; AVE: Average; MIN: Minimum; MAX: Maximum.
The average temperature at measurement points A-E was maintained at 5-10 °C with high air pressure, while the average temperature at measurement points F-J was above 10 °C with low air pressure. The air humidity at measurement points A-C was above 60% RH, while the air humidity at the remaining measurement points was below 50% RH. The light intensity at each measurement point varied greatly. Some measurement points were blocked by buildings or trees from direct sunlight or receive direct sunlight for a short time. During the measurement period, the ambient wind in the street canyon of Luoyu Road was mainly parallel to the road. The wind speed at measurement points A and B was higher than that at measurement point C, which means that the wind speed at the center of the street canyon was higher than that at the corner. Among the measurement points arranged at different distances from the road, the wind speed was relatively higher at the roadside measurement points, which were easily affected by both the ambient wind and the turbulence caused by vehicles. The measurement points at the entrance of the building access were obviously affected by the wind from the access direction, and the wind speed at the measurement points located next to the building or surrounded by lush vegetation was generally low.
According to the Ambient Air Quality Standards (GB 3095-2012), the 24-hour average concentration limits of NOx, PM2.5 and PM10 in urban residential areas are 100 μg/m3, 75 μg/m3 and 150 μg/m3, respectively, and the daily maximum 8-hour average concentration limit of O3 is 160 μg/m. The daily maximum 8-hour average concentration limit value of O3 is 160 μg/m3. The daily average concentrations of pollutants at the near-road measurement points and the background measurement points during the measurement period are shown in Figure 4.
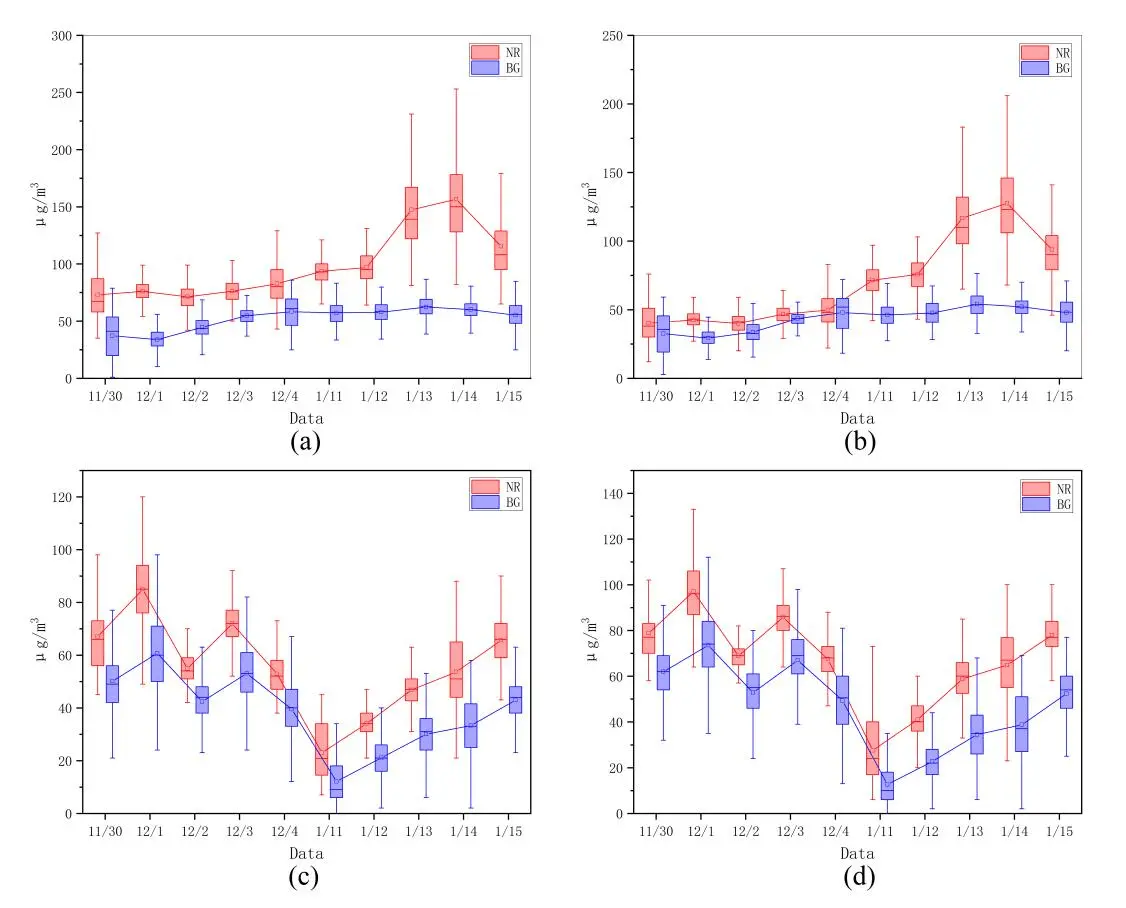
Figure 4. Changes in daily average mass concentrations of (a) NO2; (b) O3; (c) PM2.5; (d) PM10 at near-road and background measurement points. NO2: Nitrogen dioxide; O3: Ozone.
The background NO2 and O3 concentrations were always maintained at low levels, and the NO2 concentrations at the near-road measurement points were slightly higher than the background concentrations by 10-30 μg/m3 from November 30 to December 4 and from January 11 to January 12, but always lower than the concentration limits. The difference between the near-road measurement points and the background concentrations of O3 was smaller and much lower than the concentration limits. NO2 and O3 concentrations rose sharply at the near-road measurement points from January 13 to 15, with NO2 concentrations breaking the concentration limit and O3 concentrations approaching the concentration limit. The PM2.5 and PM10 concentrations at the near-road and background measurement points showed a synergistic trend, with the difference in concentrations stabilizing at 10-30 μg/m3. The PM2.5 concentration at the peak was higher than the concentration limit, and the PM10 concentration was always lower than the concentration limit. Overall, the NO2 and PM2.5 pollution in the near-road environment of Luoyu Road was more serious. Studies have found that the daily average concentrations of pollutants in the near-road area show a cyclical trend of “formation-accumulation-diffusion”, with a period of 5-7 days[44]. The measurement time was relatively short, but the pollutant concentration changes still showed the characteristics of a certain phase of this cyclical trend.
3.2 Time-varying characteristics of near-road environmental pollution
Under the influence of source emissions, atmospheric mixing, and pollutant transport, the near-road pollutant mass concentrations show a daily variation pattern, as shown in Figure 5. The changes of NO2 and O3 concentrations at the LYR-A/B/C/D measurement points show an increasing trend. The NO2 emitted by motor vehicles and the O3 generated by the optical chemical reactions continuously accumulate, and the pollutant diffusion and photolysis rate are less than the pollutant accumulation rate. The NR-LYR-F measurement point is located between the main road and the auxiliary road. Under the direct influence of vehicle exhaust emissions, the concentrations of NO2 and O3 reach a high level in the morning rush hour of commuting, and then decrease with the combined effect of decreasing vehicle flow and expanding atmospheric boundary layer. In the afternoon, the concentrations of NO2 and O3 begin to rise. On the one hand, it’s due to the increase of traffic flow, and on the other hand, NOX and other precursor compounds are decomposed into NO2 and O3 under photochemical reactions. The contraction of the atmospheric boundary layer at night is not conducive to the diffusion of pollutants, so the concentrations of NO2 and O3 in the street continue to rise, and will reach the peak at midnight and then continue to decline until the next morning.
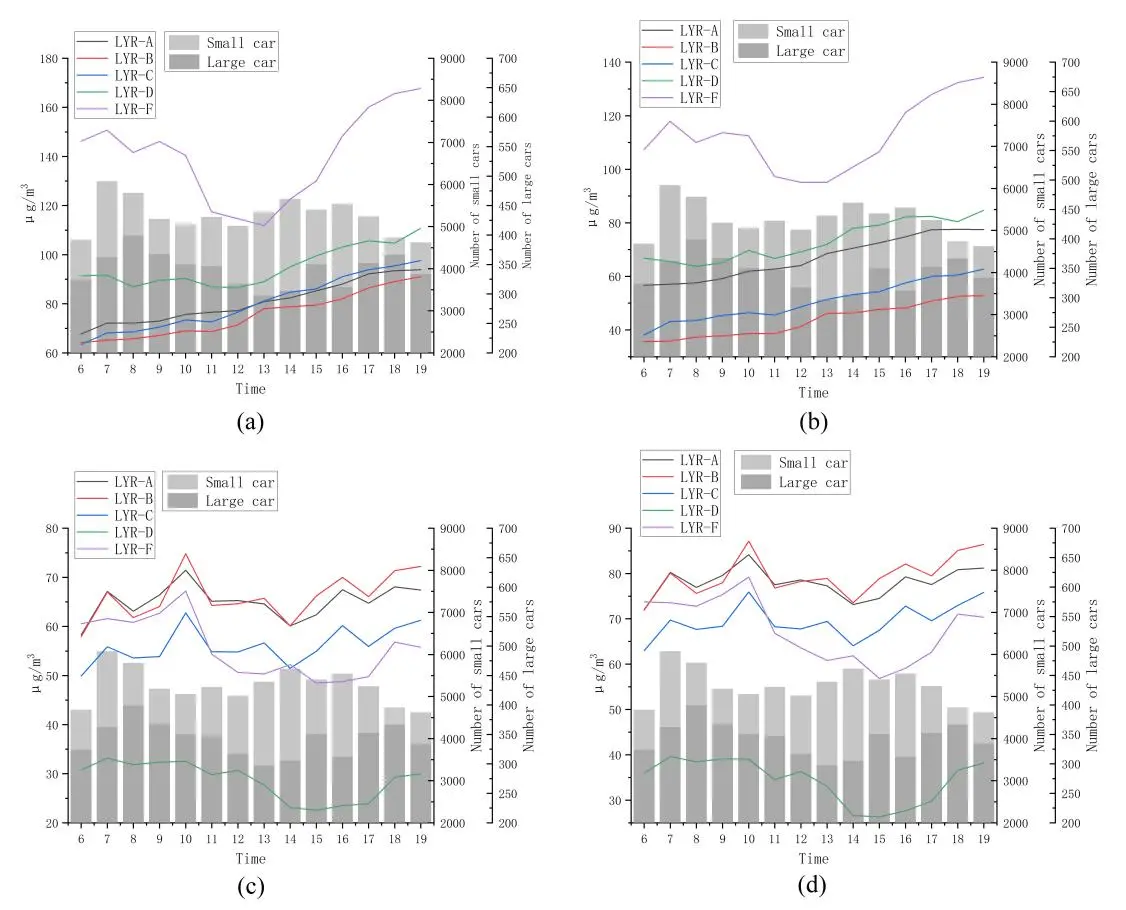
Figure 5. Time by time variation of (a) NO2; (b) O3; (c) PM2.5; (d) PM10 concentrations at near-road measurement points. LYR: Luoyu Road; NO2: Nitrogen dioxide; O3: Ozone.
The change characteristics of PM2.5 and PM10 are similar at all measurement points. With the rapid increase of traffic flow after sunrise, the concentrations of both show an increasing trend and reach the first peak at 7 o’clock. Due to the accumulation of pollutants in the streets during the morning rush hour, the PM2.5 and PM10 concentrations reach a second and higher peak at 10 o’clock, and there is a certain lag effect of the morning peak traffic on PM2.5 and PM10 pollution. As the temperature rises, the atmospheric boundary layer rises, and the concentrations of PM2.5 and PM10 begin to decline. In the afternoon, the concentrations of PM2.5 and PM10 show a continuous upward trend under the influence of rising traffic and shrinking atmospheric boundary layer.
The ratio of pollutant concentrations at the near-road measurement points to the background concentration was calculated, and the time variation was shown in Figure 6. The ratio of NO2 and O3 concentrations to the background concentration shows a clear trend of first rising, then falling and then rising. The value in the morning peak hour is usually highest, the road pollution level increases rapidly relative to the background pollution due to the large amount of motor vehicle emissions. After that, the overall trend of the ratio decreases until around 15:00. The increase of traffic flow in the afternoon causes the ratio to rise again, but the increase is lower than the previous decrease, and the ratio of LYR-A/B/C/D reaches a stable value around 17:00. As the pollutants gradually diffuse at night, the street pollution level tends to be close to the background pollution level, and the ratio will gradually decrease until the next morning. The ratio of PM2.5 and PM10 concentrations to the background concentration shows horizontal fluctuation changes, 8:00, 11:00, 14:00 and 16:00 are the peak of fluctuation, which corresponds to the rush hours of people’s work days. The continued increase of the ratio after 18:00 is associated with the accumulation of street pollutants.
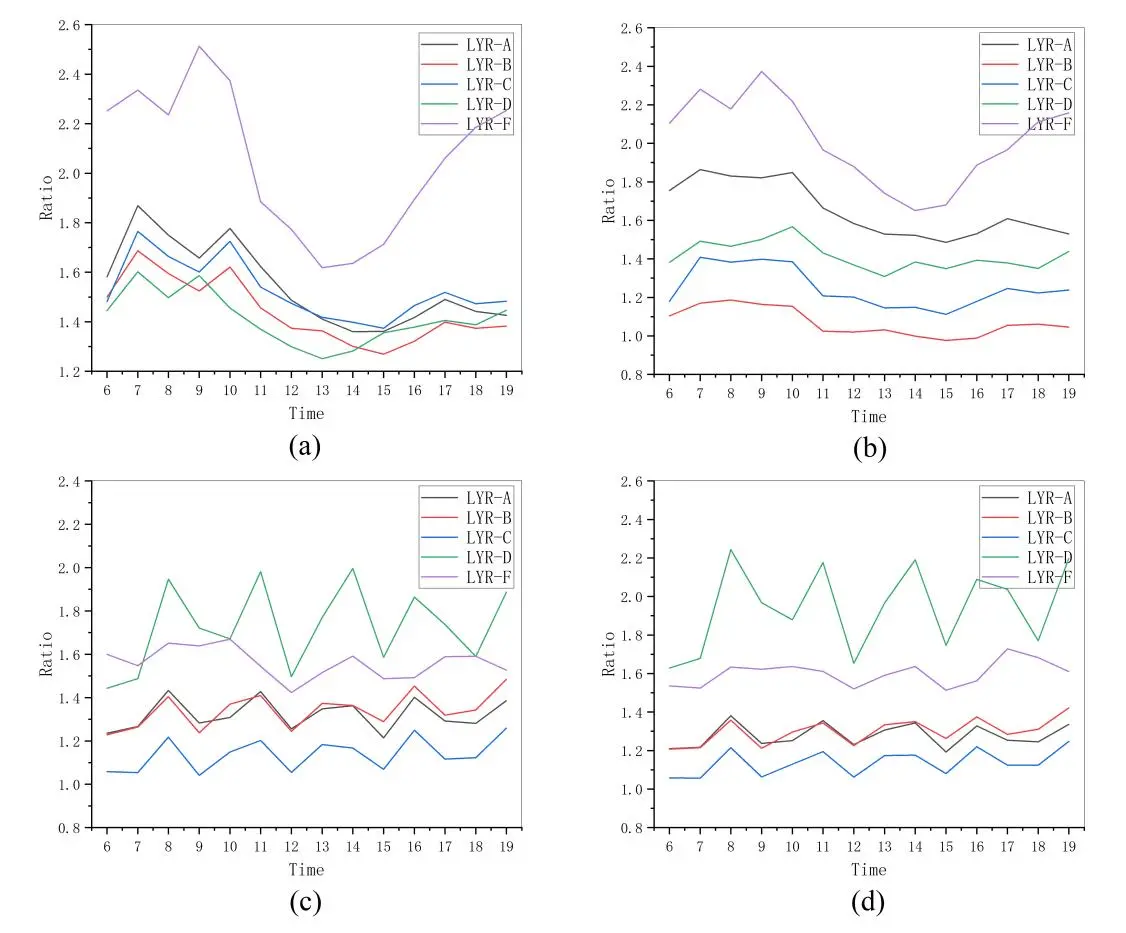
Figure 6. Changes in the ratio of (a) NO2; (b) O3; (c) PM2.5; (d) PM10 mass concentrations to background concentrations at near-road measurement points. LYR: Luoyu Road; NO2: Nitrogen dioxide; O3: Ozone.
In order to explore the influencing factors of pollutant concentration change in the near-road environment, the correlation between pollutant concentrations and meteorological elements, motor vehicle flow and traffic speed was analyzed, as shown in Table 3.
| Contaminants | NO2 | O3 | PM2.5 | PM10 | Temperature | Humidity | Illumination | Atmospheric pressure | Wind speed | Traffic | Traffic speed |
| NO2 | 1 | .568** | .140** | .054** | -.028* | .258** | -.098** | -.321** | -.164** | -0.143 | -.071* |
| O3 | 1 | .122** | .050** | -.152** | .340** | -.134** | -.136** | -.113** | -0.148 | -.059 | |
| PM2.5 | 1 | .903** | -.034* | .154** | -.056** | -.041** | -0.016 | .172** | -.107** | ||
| PM10 | 1 | -0.01 | .031* | -0.022 | -.046** | -0.017 | .215** | -.156** |
**: Significant correlation at the 0.01 level; *: Significant correlation at the 0.05 level (two-tailed); NO2: Nitrogen dioxide; O3: Ozone.
The correlation between PM2.5 and PM10 is close to 1, reflecting their homologous characteristics. The correlation coefficient between NO2 and O3 is 0.568, due to the photochemical cycle between NOX and O3[45]. NO2, O3 and PM2.5 concentrations are all negatively correlated with temperature and lightness. The increase of temperature leads to the expansion of the atmospheric boundary layer thus promoting the diffusion of pollutants. All four pollutant concentrations are positively correlated with humidity. Relative humidity affects the radiation conditions in photochemical reactions. A critical value of photochemical reaction intensity exists around 80% relative humidity, and NOx mass concentration shows a process of first increasing and then decreasing[46]. In addition, when the air humidity is low, it is not enough to produce gravitational sedimentation, and water vapor will act as a condensation nucleus to adsorb chemical and physical molecules in the air, which is easy to generate particulate matter[47]. All four pollutants are negatively correlated with atmospheric pressure. When the ground is dominated by low-pressure field strength, the atmospheric turbulence is relatively stable and the wind speed near the ground is small leading to poorer conditions for pollutant dispersion[48]. NO2 and O3 concentrations were significantly negatively correlated with wind speed, while the correlation between PM2.5 and PM10 concentrations and wind speed did not pass the significance test, indicating that wind is more likely to evacuate gaseous pollutants.
The correlation between NO2 and O3 and traffic flow is not significant, which shows that their concentration changes are mainly influenced by meteorological factors. PM2.5 and PM10 are significantly positively correlated with traffic flow, both of which are direct emission products of vehicle exhaust. In addition, vehicle tire wear and road dust will also increase the concentration of particulate matter. NO2, PM2.5, and PM10 are significantly negatively correlated with traffic flow speed, the smaller the traffic flow speed reflects the more serious road congestion, and the repeated stopping and accelerating of motor vehicles will emit more pollutants.
3.3 Comparison of street canyon and building access pollution characteristics
There are significant spatial differences in the distribution of pollutants in the street environment. The continuous tall buildings on both sides of the road form narrow street spaces, that is street canyons. However, the buildings along the street are not continuous, and there are many building openings in the middle, which also serve as important ventilation corridors. The spatial distribution characteristics of pollutants under the two different microscopic scenarios of street canyon and building access were compared, as shown in Figure 7.
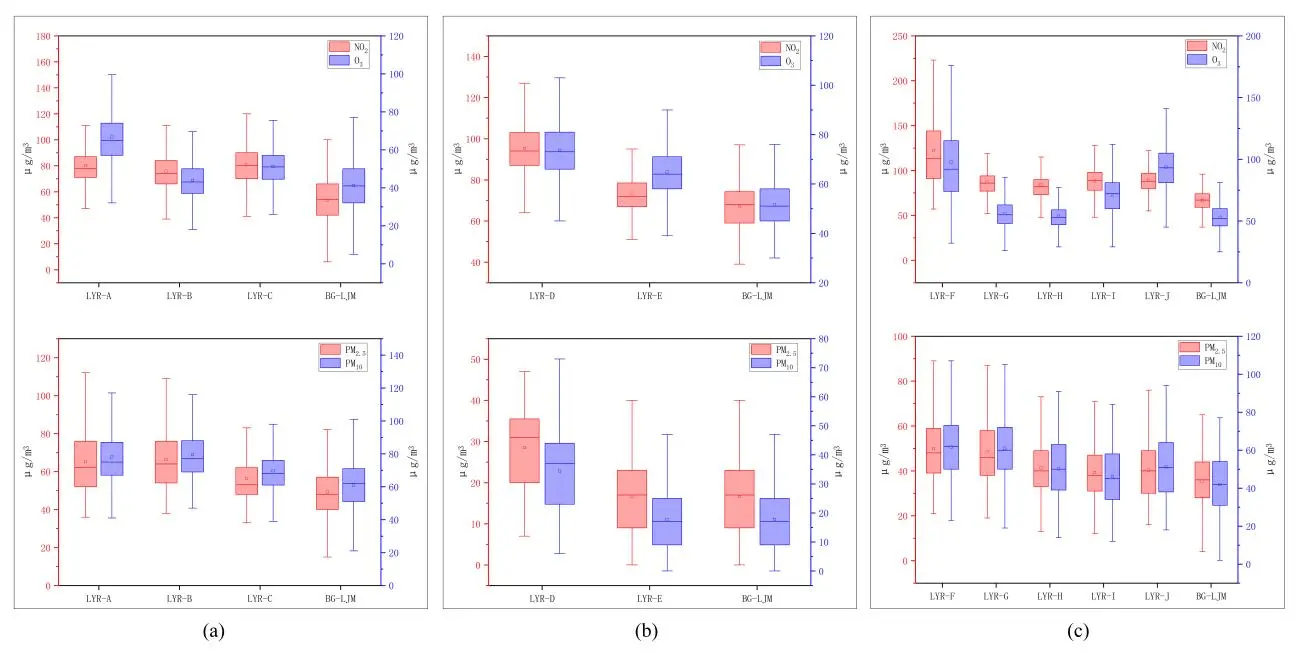
Figure 7. Comparison of overall pollutant concentrations at street canyon and building access measurement points. (a) street canyon; (b) building access 1; (c) building access 2. LYR: Luoyu Road.
The concentrations of NO2 and O3 at LYR-A are higher than those at LYR-B, while the differences in PM2.5 and PM10 concentrations between the two points are not significant. The NO2 and O3 concentrations at LYR-C next to the building were higher, while PM2.5 and PM10 concentrations were significantly lower compared to LYR-B on the roadside. The dominant wind direction above the canyon during the measurement period tends to form vortices in the canyon, and gaseous pollutants are more likely to accumulate in the building corners on the leeward side of the canyon. The particulate pollutants are less affected by the vortices, and their pollution levels are mainly related to the distance of roadside pollution sources. The concentration levels of various pollutants in the building channel are significantly attenuated with the increase of road distance. LYR-G and LYR-J are at the same horizontal distance from the road, but LYR-J and the road are blocked by the building. It is found that the PM2.5 and PM10 concentrations are significantly lower at LYR-J, but the NO2 concentrations are comparable between the two measurement points, and the O3 concentration at LYR-J is higher than that at LYR-G. The buildings can effectively block the diffusion of particulate pollutants, and the obstructive effect on gaseous pollutants is not obvious.
The differences in pollution levels between the street canyon and building access under the wind direction of parallel and vertical roads were further compared, as shown in Figure 8. The pollution levels at each measurement point in the street canyon under the wind direction of the vertical road are higher than those under the wind direction of the parallel road, and the gaseous pollutants show more obvious characteristics relative to the particulate pollutants. When the wind direction is 0° that is parallel to the street, the main way of air pollution transmission in the street canyon is horizontal transport parallel to the street, which is more favorable to the diffusion of pollutants. When the wind direction is 90° that is perpendicular to the street, vortices are formed in street canyon, and the pollutants in the canyon are mainly transported horizontally in the vertical road direction and diffused vertically, with relatively low diffusion efficiency. Building access measurement points have lower pollution levels in the vertical road wind direction. As an important ventilation opening for the street, the building access is the input channel of fresh air, and the wind from the access can effectively reduce the pollution level of the street at the entrance of the building access.
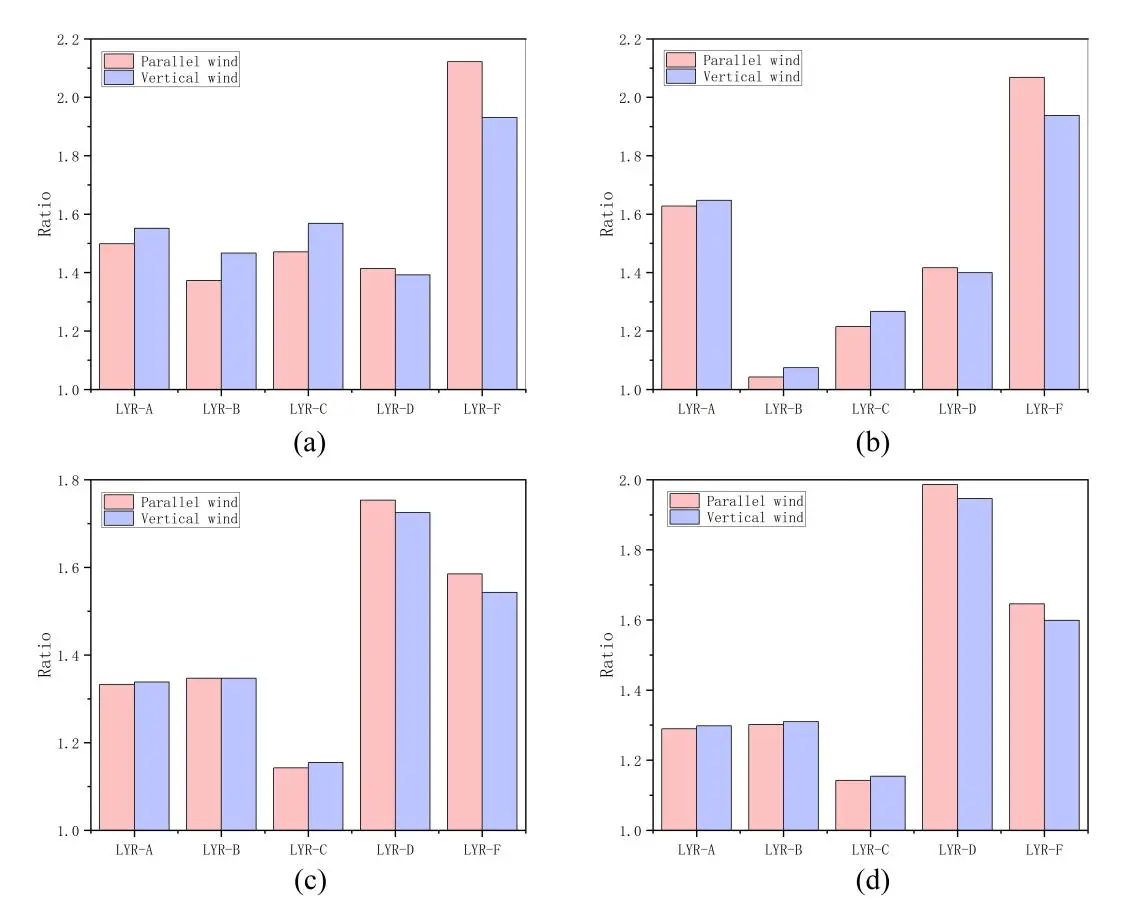
Figure 8. Comparison of (a) NO2; (b) O3; (c) PM2.5 and (d) PM10 pollution levels at street canyons and building access measurement points under parallel and perpendicular road wind directions. LYR: Luoyu Road; NO2: Nitrogen dioxide; O3: Ozone.
3.4 Road different distance pollutant concentration downwind attenuation characteristics
Two normalization methods were used to analyze the attenuation characteristics of NO2, O3, PM2.5 and PM10 in the downwind condition, i.e., when the wind direction is parallel to the building access blowing from the road to the measurement point, as shown in Figure 9.
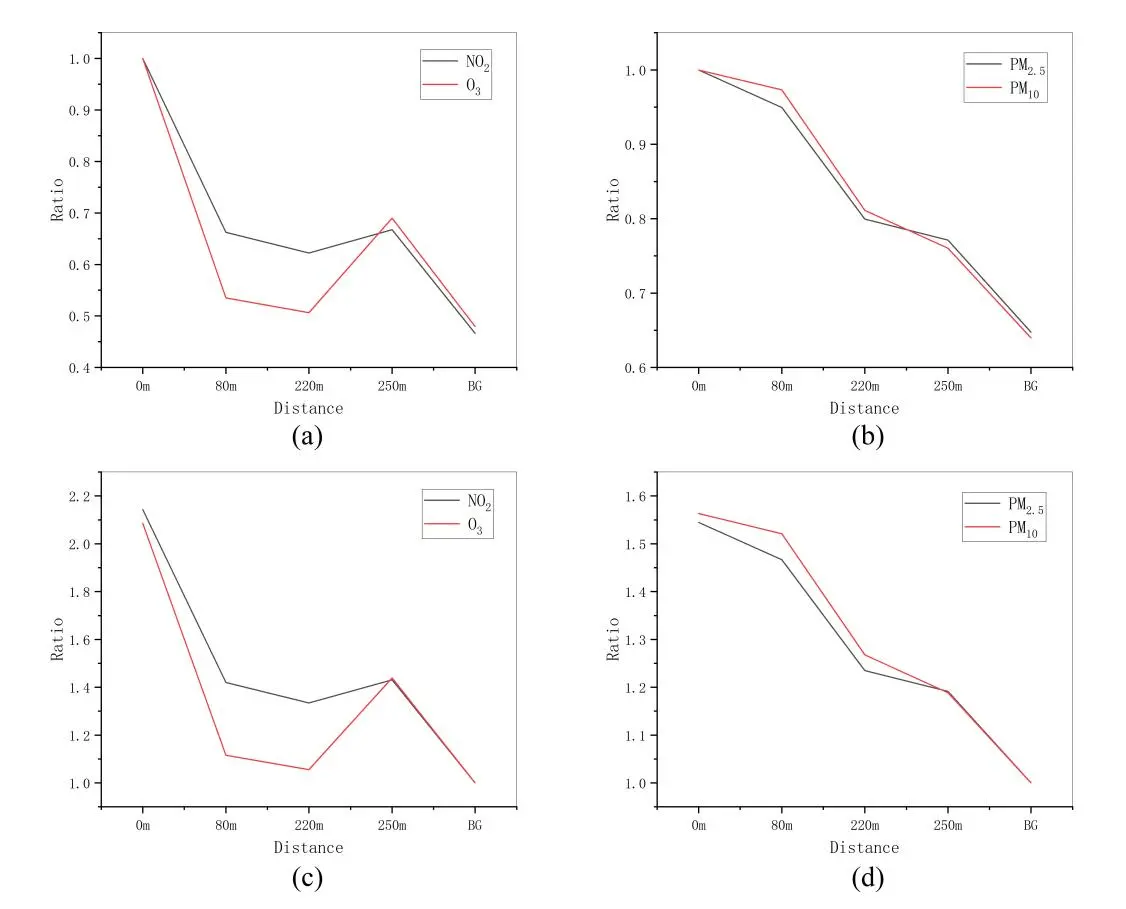
Figure 9. Attenuation of (a) NO2; (b) O3; (c) PM2.5 and (d) PM10 pollution levels with road distance. NO2: Nitrogen dioxide; O3: Ozone.
There are significant differences in the attenuation characteristics of gaseous pollutants and particulate pollutants with the distance from the road. The pollution level of gaseous pollutants shows a sharp decline within a short distance from the road, while the pollution level of particulate pollutants shows the characteristic of gradually decreasing from the edge of the road to the background measurement point. In the range of 0 to 80 m, NO2 and O3 attenuate to 66.24% and 53.49% of the road edge concentration, and decreases from more than twice the background concentration to 1.42 and 1.12 times of the background concentration, respectively. PM2.5 and PM10 decay slowly, and the road edge concentration was 1.54 and 1.56 times of the background concentration, and drop to 94.95% and 97.31% of the road edge concentration at 80 m, respectively. In the range of 80-220 m, NO2 and O3 decline slowly, and O3 is close to the background pollution level. PM2.5 and PM10 decrease to 79.95% and 81.12% of the roadside concentration, which are 1.23 and 1.27 times of the background concentration, respectively. In the range of 220-250 m, NO2 pollution levels continue to fluctuate horizontally, O3 pollution levels may rise abnormally due to the special environmental influence, and PM2.5 and PM10 further decrease slowly.
The effects of wind speed on the decay of NO2, O3, PM2.5 and PM10 pollution levels with road distance were further analyzed, as shown in Figure 10. The decay patterns of the four pollutants with road distance don’t differ much between wind speed 0-3 m/s and wind speed 3-5 m/s. NO2 and O3 decay to stable levels at about 1.5 times and 1.2 times of the background concentration, respectively, PM2.5 and PM10 pollution levels continue to decline to about 1.2 times of the background concentration at 250 m. When the wind speed is greater than 5 m/s, the pollution level of pollutants at all measuring points decreases obviously. When NO2 and O3 decay to a stable level, NO2 is about 1.3 times of the background concentration, and O3 is almost the same as the background concentration. The decay rates of PM2.5 and PM10 increase and approach stable levels at 220 m. In summary, only when the wind speed reaches a certain threshold can it have a significant impact on the pollutant attenuation law, which is mainly reflected in the reduction of the overall pollution level and the increase of the pollutant attenuation speed.
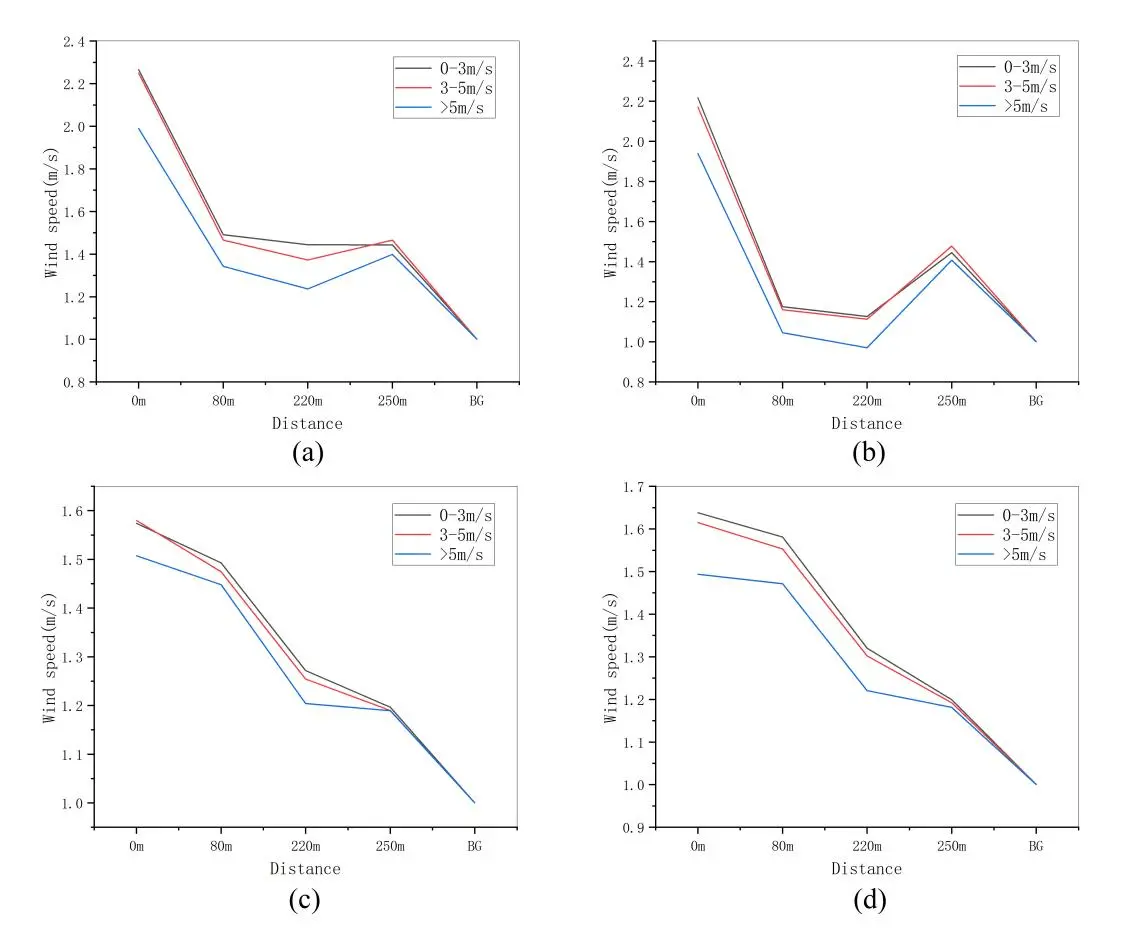
Figure 10. Effect of wind speed on the attenuation of (a) NO2; (b) O3; (c) PM2.5 and (d) PM10 pollution levels with road distance. NO2: Nitrogen dioxide; O3: Ozone.
4. Discussion
This study characterized the temporal changes of NO2, O3, PM2.5, and PM10 in the urban near-street environment. NO2 and O3 accumulate gradually in the street environment, with the most severe pollution levels in the evening. PM2.5 and PM10 pollution levels are higher in the morning. The peak hours of street air pollution are coupled with the morning and evening travel times of commuters, in which travelers on foot will suffer the greatest pollutant exposure levels of the day. Residents should reasonably avoid traveling during the peak hours of pollution, change their travel patterns or take certain protective measures. Second, traffic control is the most direct strategy for urban street air pollution management. Research results show that PM2.5 and PM10 are significantly and positively correlated with vehicle traffic flow, and traffic congestion leading to slower traffic flow can further increase pollutant emissions. The development of low emission zones and congestion charge are two effective measures to control the worsening traffic emission problem.
The pollutants have obvious spatial distribution characteristics in street canyons. The main modes of air pollution transport in street canyons are vertical exchange and horizontal transport, and the diffusion process of pollutants is closely related to the wind direction, various incoming winds generate different structural flow fields and turbulent kinetic energy fields in street canyons[49]. The Luoyu Road street canyon in this study belongs to the shallow street canyon (H/W < 1) and near-symmetric canyon (h1 = h2), and this spatial pattern is common in the urban trunk roads. Related studies have shown that pollutants tend to accumulate in canyon corners when the aspect ratio is too small, and that too large an aspect ratio is not conducive to the exchange of air flow between the upper and lower layers. It is advisable to control the aspect ratio between 0.6 and 1.2 in planning[50], which is conducive to the formation of the main vortex in the canyon to transport pollutants to the high altitude.
When the wind direction is perpendicular to the street, vortices are formed inside the canyon, and gaseous pollutants are more likely to gather in the building corners on the leeward side of the canyon. This has guiding significance for the functional layout of buildings on both sides of urban streets. Urban public buildings are relatively closed and generally use artificial ventilation, i.e. public buildings have higher tolerance to outside air pollution. Residential buildings are mainly naturally ventilated and have close contact with outside airflow and air quality. Therefore, residential buildings should be arranged in the downwind direction of the street valley, while public buildings are suitable to be arranged in the upwind direction of the street valley[51]. Particulate pollutants are less affected by eddy currents, and their pollution levels are related to the distance of road pollution sources. With the isolation and purification effect of green trees and hedge walls, particulate pollution levels at breathing heights on both sides of urban street valleys can be significantly reduced.
Roads are important ventilation corridors in cities, and the angle between the street orientation and wind direction has a significant effect on the diffusion of air pollution. The “narrow tube effect” is formed when the ambient wind is parallel to the street canyon, and the flow velocity increases after the air enters the street canyon, which is more conducive to the evacuation of pollutants. The study by Kastner-Klein et al.[52] found a general trend of increasing pollution concentration during the wind direction from 0° to 90°. However, the accumulation of pollutants in a long road section may cause the concentration to increase. Therefore, in street planning, the angle between the dominant urban wind direction and the road should be considered, and the block scale should not be too large.
Building accesses are important vents of urban streets, the wind from the access can evacuate the pollutants more effectively than the wind parallel to the road. In the street planning, the openings of the street building interface should be reserved appropriately or the green open space should be increased. In addition, the street buildings can also take the form of bottom overhead, and the bottom of the building can be used as the air inlet, which can effectively alleviate the street pollution. However, the building access will make the street pollutants spread to a longer distance. The decay rate of particulate matter along with road distance is lower than that of gaseous pollutants, and their influence ranges can reach more than 200 meters. Therefore, buildings within the influence of road pollution should also give full consideration to ventilation orientation and try to avoid opening windows facing the road for a long time.
Due to the limitation of the number of experimental equipment, this study adopted the method of group measurement, and it was difficult to compare the pollution level of the measurement points monitored at different time periods. In addition, more measurement points should be arranged to reveal the spatial distribution characteristics of pollutants in streets. In the future, the vertical distribution characteristics of pollutants in street canyons and the detailed attenuation characteristics of pollutants on both sides of roads can be further explored.
5. Conclusion
This study aims to reveal the spatial and temporal distribution of urban street air pollution and its influencing factors, explore the relationship between street form and pollutant diffusion, and find ways to reduce street air pollution through spatial design. The main conclusions are as follows:
(1) In the near road environment, NO2 and O3 gradually accumulate and reach the highest pollution levels in the evening, but the ratio of NO2 and O3 to the background concentration is the largest during the morning rush hour. PM2.5 and PM10 pollution levels are higher in the morning, the ratio of PM2.5 and PM10 to the background concentration showed a horizontal fluctuation trend.
(2) The low temperature, high humidity and low pressure environment will aggravate the street air pollution. Compared with PM2.5 and PM10, the evacuation effect of wind on NO2 and O3 is more obvious. PM2.5 and PM10 are significantly positively correlated with vehicle flow, and traffic congestion can further aggravate air pollution.
(3) In shallow and symmetrical street canyons, NO2 and O3 are more likely to gather in the building corners on the leeward side of canyons under the influence of eddy currents. PM2.5 and PM10 pollution levels are mainly related to the distance of road. The aspect ratio of street canyon should be controlled around 1.
(4) The ambient wind parallel to the road is conducive to the evacuation of pollutants in the street canyon. Building accesses are important vents of urban streets, and the wind from the access is effective to evacuate street pollutants.
(5) The decay rate of gaseous pollutants along with road distance is significantly faster than that of particulate matter. The pollution levels of NO2 and O3 drop sharply within a distance of 80 meters from the road, and the influence range of PM2.5 and PM10 can reach over 200 meters. Buildings within the influence range of road pollution should fully consider the ventilation orientation.
Authors contribution
Yang S: Proposed the research concept, designed the experiments, conducted data analysis, composed the manuscript.
Zhan Q: Designed the framework, manuscript editing.
Liu W: Participated in the experimental design, reviewed the manuscript.
Conflicts of interest
Qingming Zhan is an Editorial Board member of Journal of Building Design and Environment, and other authors declare no conflict of interest.
Ethical approval
Not applicable.
Consent to participate
Not applicable.
Consent for publication
Not applicable.
Availability of data and materials
Not applicable.
Funding
The research was financed by National Natural Science Foundation of China (No. 51878515 and 52078389) and Key Laboratory of Monitoring, Evaluation Early Warning of Territorial Spatial Planning Implementation of Ministry of Natural Resources, China (No. 401147).
Copyright
© The Author(s) 2023.
References
-
1. Boppana VBL, Wise DJ, Ooi CC, Zhmayev E, Poh HJ. CFD assessment on particulate matter filters performance in urban areas. Sustain Cities Soc. 2019;46:101376.[DOI]
-
2. Fuller R, Landrigan PJ, Balakrishnan K, Bathan G, Bose-O’Reilly S, Brauer M, et al. Pollution and health: A progress update. Lancet Planet Health. 2022;6(6):e535-e547.[DOI]
-
3. Zhang A, Qi Q, Jiang L, Zhou F, Wang J. Population exposure to PM2.5 in the urban area of Beijing. PLoS One. 2013;8(5):e63486.[DOI]
-
4. Lv W, Wu Y, Zang J. A review on the dispersion and distribution characteristics of pollutants in street canyons and improvement measures. Energies. 2021;14(19):6155.[DOI]
-
5. Nosek S, Fuka V, Kukacka L, Klukova Z, Janour Z. Street-canyon pollution with respect to urban-array complexity: The role of lateral and mean pollution fluxes. Build Environ. 2018;138:221-234.[DOI]
-
6. Kim JJ, Huen K, Adams S, Smorodinsky S, Hoats A, Malig B, et al. Residential traffic and children’s respiratory health. Environ Health Perspect. 2008;116(9):1274-1279.[DOI]
-
7. Pope CA, Turner MC, Burnett RT, Jerrett M, Gapstur SM, Diver WR, et al. Relationships between fine particulate air pollution, cardiometabolic disorders and cardiovascular mortality. Circ Res. 2015;116(1):108-115.[DOI]
-
8. Hitchins J, Morawska L, Wolff R, Gilbert D. Concentrations of submicrometre particles from vehicle emissions near a major road. Atmos Environ. 2000;34(1):51-59.[DOI]
-
9. Song C, Li R, He J, Wu L, Mao H. Study on pollution characteristics of NO, NO2 and O3 in the atmosphere of Langfang City, Hebei Province. China Environ Sci. 2016;36(10):2903-2912. Chinese. Available from: https://www.researchgate.net/publication/309922944_Analysis_of_pollution_characteristics_of_NO_NO2_and_O3_at_urban_area_of_Langfang_Hebei
-
10. Di Bernardino, Monti P, Leuzzi G, Querzoli G. Pollutant fluxes in two-dimensional street canyons. Urban Climate. 2018;24:80-93.[DOI]
-
11. Dezzutti M, Berri G, Venegas L. Intercomparison of atmospheric dispersion models applied to an urban street canyon of irregular geometry. Aerosol Air Qual Res. 2018;18(3):820-828.[DOI]
-
12. Hong B, Lin B, Qin H. Numerical investigation on the effect of avenue trees on PM2.5 dispersion in urban street canyons. Atmosphere. 2017;8(7):129.[DOI]
-
13. Zheng T, Li B, Li X, Wang Z, Li S, Peng Z. Vertical and horizontal distributions of traffic-related pollutants beside an urban arterial road based on unmanned aerial vehicle observations. Build Environ. 2021;187:107401.[DOI]
-
14. Miao C, Chen W, Yu S. Assessing ozone distribution vertically and horizontally in urban street canyons based on field investigation and ENVI-met modelling. Buildings. 2022;12(3):262.[DOI]
-
15. Vardoulakis S, Gonzalez-flesca N, Fisher B. Assessment of traffic-related air pollution in two street canyons in Paris: Implications for exposure studies. Atmos Environ. 2002;36:1025-1039.[DOI]
-
16. Huang Y, Wang M, Qian L, Cui P. Study on air flow and pollutant diffusion characteristics in T-shaped streets. Environ Pollut Prev. 2019;41(03):257-260. Chinese.[DOI]
-
17. Hu Y, Wu Y, Wang Q, Hang J, Li Q, Liang J, et al. Impact of indoor-outdoor temperature difference on building ventilation and pollutant dispersion within urban communities. Atmosphere. 2022;13(1):28.[DOI]
-
18. Mohammadi M, Calautit J. Impact of ventilation strategy on the transmission of outdoor pollutants into indoor environment using CFD. Sustainability. 2021;13(18):10343.[DOI]
-
19. Phillips BB, Bullock JM, Osborne JL, Gaston KJ. Spatial extent of road pollution: A national analysis. Sci Total Environ. 2021;773:145589.[DOI]
-
20. Ghosh R, Lurmann F, Perez L, Penfold B, Brandt S, Wilson J, et al. Near-roadway air pollution and coronary heart disease: Burden of disease and potential impact of greenhouse gas reduction strategy in southern California. Environ Health Perspect. 2016;124(2):193-200.[DOI]
-
21. Urman R, McConnell R, Islam T, Avol EL, Lurmann FW, Vora H, et al. Associations of children’s lung function with ambient air pollution: Joint effects of regional and near-roadway pollutants. Thorax. 2014;69(6):540-547.[DOI]
-
22. Karner AA, Eisinger DS, Niemeier DA. Near-roadway air quality: Synthesizing the findings from real-world data. Environ Sci Technol. 2010;44(14):5334-5344.[DOI]
-
23. Mukherjee A, McCarthy MC, Brown SG, Huang S, Landsberg K, Eisinger DS. Influence of roadway emissions on near-road PM2.5: Monitoring data analysis and implications. Transp Res D Transp Environ. 2020;86:102442.[DOI]
-
24. Rakowska A, Wong KC, Townsend T, Chan KL, Westerdahl D, Ng S, et al. Impact of traffic volume and composition on the air quality and pedestrian exposure in urban street canyon. Atmos Environ. 2014;98:260-270.[DOI]
-
25. Zhang H, Xu T, Zong Y, Tang H, Liu X, Wang Y. Influence of meteorological conditions on pollutant dispersion in street canyon. Procedia Eng. 2015;121:899-905.[DOI]
-
26. Xie X, Zhu Z. Effects of heat intensity and inflow wind on the reactive pollution dispersion in urban street canyon. J Shanghai Jiaotong Univ. 2018;23(Suppl 1):109-116.[DOI]
-
27. Miao C, Yu S, Hu Y, Bu R, Qi L, He X, et al. How the morphology of urban street canyons affects suspended particulate matter concentration at the pedestrian level: An in-situ investigation. Sustain Cities Soc. 2020;55:102042.[DOI]
-
28. Fu X, Liu J, Ban-weiss GA, Zhang J, Huang X, Ouyang B, et al. Effects of canyon geometry on the distribution of traffic-related air pollution in a large urban area: Implications of a multi-canyon air pollution dispersion model. Atmos Environ. 2017;165:111-121.[DOI]
-
29. Huertas JI, Aguirre JE, Lopez Mejia OD, Lopez CH. Design of road-side barriers to mitigate air pollution near roads. Appl Sci. 2021;11(5):2391.[DOI]
-
30. Li B, Qiu Z, Zheng J. Impacts of noise barriers on near-viaduct air quality in a city: A case study in Xi’an. Build Environ. 2021;196:107751.[DOI]
-
31. Kendrick CM, Koonce P, George LA. Diurnal and seasonal variations of NO, NO2 and PM2.5 mass as a function of traffic volumes alongside an urban arterial. Atmos Environ. 2015;122:133-141.[DOI]
-
32. Askariyeh MH, Zietsman J, Autenrieth R. Traffic contribution to PM2.5 increment in the near-road environment. Atmos Environ. 2020;224:117113.[DOI]
-
33. Zhou S, Lin R. Spatial-temporal heterogeneity of air pollution: The relationship between built environment and on-road PM2.5 at micro scale. Transp Res D Transp Environ. 2019;76:305-322.[DOI]
-
34. Xiao J, Du G, Shi Y, Wen Y, Yao J, Gao Y, et al. Spatial and temporal characteristics of ambient air pollution in Xiamen and its correlation with meteorological factors. J Environ Sci. 2016;36(09):3363-3371.[DOI]
-
35. Askariyeh MH, Vallamsundar S, Farzaneh R. Investigating the impact of meteorological conditions on near-road pollutant dispersion between daytime and nighttime periods. Transp Res Rec. 2018;2672(25):99-110.[DOI]
-
36. Zhang K, Chen G, Wang X, Liu S, Mak CM, Fan Y, et al. Numerical evaluations of urban design technique to reduce vehicular personal intake fraction in deep street canyons. Sci Total Environ. 2019;653:968-994.[DOI]
-
37. Miao C, Yu S, Hu Y, Zhang H, He X, Chen W. Review of methods used to estimate the sky view factor in urban street canyons. Build Environ. 2020;168:106497.[DOI]
-
38. Sofowote UM, Healy RM, Su Y, Debosz J, Noble M, Munoz A, et al. Understanding the PM2.5 imbalance between a far and near-road location: Results of high temporal frequency source apportionment and parameterization of black carbon. Atmos Environ. 2018;173:277-288.[DOI]
-
39. U.S. EPA [internet]. Transportation conformity guidance for quantitative hot-Spot analyses in PM2.5 and PM10 nonattainment and maintenance areas. Washington: Office of Transportation and Air Quality; 2015. Available from: https://www3.epa.gov/ttn/naaqs/aqmguide/collection/cp2/hot-spot_analysis_appx.pdf
-
40. Liu X, Sheng P, Ma X, Zhong M. Spatial and temporal distribution and health impact of vehicle pollutants in urban high concentration population areas. Traffic Inf saf. 2018;36(01):119-128.[DOI]
-
41. Mcauley TR, Ferro A, Spengler JD, Hopke PK, Jaques PA. Spatial measurements of ultrafine particles using an engine exhaust particle Sizer™ within a local community downwind of a major international trade bridge in Buffalo, New York. Aerosol Sci Technol. 2010;44:1096-1104.[DOI]
-
42. Batterman S, Cook R, Justin T. Temporal variation of traffic on highways and the development of accurate temporal allocation factors for air pollution analyses. Atmos Environ. 2015;107:351-363.[DOI]
-
43. Baldwin N, Gilani O, Raja S, Batterman S, Ganguly R, Hopke P, et al. Factors affecting pollutant concentrations in the near-road environment. Atmos Environ. 2015;115:223-235.[DOI]
-
44. Gao S, Tao S, Xiong X, Huang S, Li N. Study on air pollution characteristics of typical expressway short cut areas in northern China. J Ecol Environ. 2019;28(06):1168-1174.[DOI]
-
45. Sillman S. The use of NOy, H2O2, and HNO3 as indicators for ozone-NOx- hydrocarbon sensitivity in urban locations. J Geophys Res. 1995;100:14175-14188.[DOI]
-
46. Jing P, Goldberg DL. Influence of conducive weather on ozone in the presence of reduced NOx emissions: A case study in Chicago during the 2020 lockdowns. Atmos Pollut Res. 2022;13(2):101313.[DOI]
-
47. Jamriska M, Morawska L, Mergersen K. The effect of temperature and humidity on size segregated traffic exhaust particle emissions. Atmos Environ. 2008;42(10):2369-2382.[DOI]
-
48. Gao C, Zhao Q, Ding R, Zhang J, Li Y, Dong C. Variations of atmospheric pollutants concentrations and their correlation with meteorological factor in Jilin city in 2018. Environ Eng. 2021;39(5):71-79. Chinese.[DOI]
-
49. Chan LY, Kwok WS. Vertical dispersion of suspended parti culates in urban area of Hong Kong. Atmos Environ. 2000;34(26):4403-4412.[DOI]
-
50. Qiu Q, Wang L. Study on urban street geometric structure planning based on street canyon pollution mechanism. Urban Develop Res. 2007;04:78-82.[DOI]
-
51. Wang J, Wang W. Study on spatial morphology and pollutant diffusion of urban street canyons: A case study of Zhongshan Road, Hangzhou. Urban plan. 2010;34(12):57-63. Chinese. Available from: https://www.docin.com/p-1647105800.html
-
52. Kastner-Klein P, Plate EJ. Wind-tunnel study of concentration fields in street canyons. Atmos Environ. 1999;33:3973-3979.[DOI]
Copyright
© The Author(s) 2023. This is an Open Access article licensed under a Creative Commons Attribution 4.0 International License (https://creativecommons.org/licenses/by/4.0/), which permits unrestricted use, sharing, adaptation, distribution and reproduction in any medium or format, for any purpose, even commercially, as long as you give appropriate credit to the original author(s) and the source, provide a link to the Creative Commons license, and indicate if changes were made.
Publisher’s Note
Share And Cite


