Abstract
Studies have shown that view to greenery and other natural landscape elements may have a beneficial restorative effect on urban residents, and the effect may be evaluated by the Visible Green Index (VGI) which refers to the proportion of green landscape represented by plants and waterscape in people’s vision. This article proposes a method based on Sightline Sampling Algorithm (SSA) that can quickly calculate the VGI distribution in urban space. This method is operated on a voxel model, scans the distribution of plants around the viewpoint by constructing sampling sightline rays to quickly obtain the corresponding VGI information. Parametric analysis shows that for optimized combinations of voxel size and sampling size, the method can quickly calculate VGI at continuous locations with a fairly satisfactory accuracy. As a case study, the distributions of VGI in three campuses of a university in Shanghai, China is examined using the SSA method. The result shows that the method can evaluate the existing green view levels. Potential areas for improvement, i.e. high pedestrian density while poor green view percentages are identified, and the improved VGI distribution with renovation design scheme is predicted. The VGI method can be a potential tool to support architects and landscape designers in analyzing green visual quality and assessing the restorative benefits of urban landscape design.
Keywords
1. Introduction
In urban areas, the landscape system comprised of green plants and waterscape can relieve people’s psychological pressure, help people recover from anxiety, and could promote the physical and mental health. As early as the mid-19th century, Olmsted pointed out that in green spaces surrounded by green plants, people can quickly relax themselves and regulate their stress. He emphasized the important link between ecology and human well-being, and proposed the concepts of “Environmental Restoration” and “Comprehensive Planning”[1,2]. Many studies have been carried out on the relationship between green view and human health, indicating that it may have direct or indirect positive effects on human health, suggesting that visual contact with natural landscapes in different urban settings may produce considerable restorative, wellbeing and associated social benefits for urban spaces and the people that use them[3-10].
To help evaluate the potential of the view to green scene with respect to its restorative effects, Visible Green Index (VGI) was proposed to quantifying the “green view” from pedestrian’s perspective[11]. VGI refers to the proportion of green landscape represented by plants and waterscape in people’s vision. Compared to the green ratio that is widely used in urban planning, VGI is designed to evaluate the degree of greening in a three-dimensional manner as seen by a person, and thus could more intuitively reflect the perception of pedestrians on the degree of greening of ones’ surrounding environment (Figure 1).
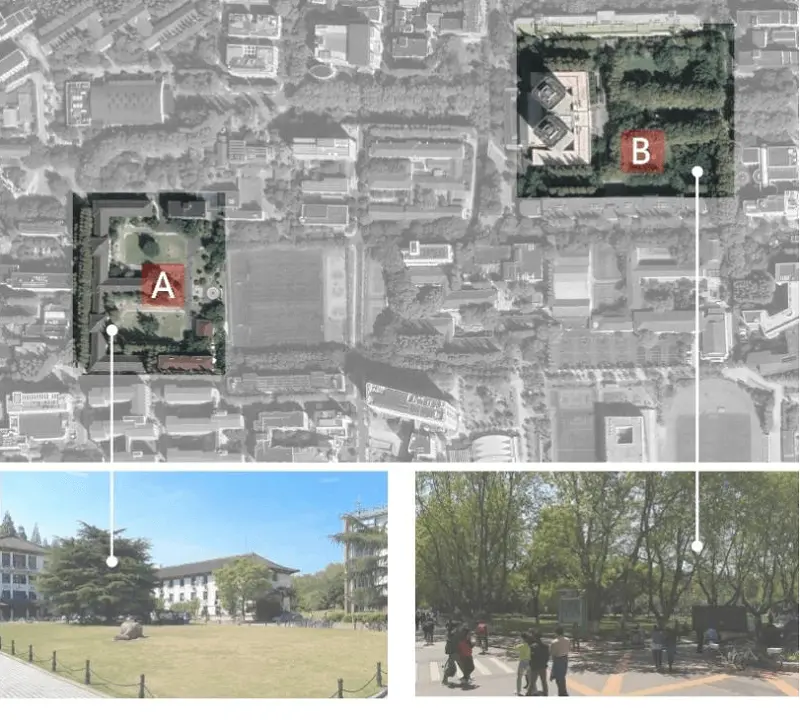
Figure 1. Two locations in a university campus, with approx. same green ratio on plan but contrasting pedestrian views due to spatial configurations of vegetation.
In recent decades, extensive research on the correlation between VGI and landscape perception were carried out. For instance, it is found that when VGI is less than 15%, perception of the “artificial” traces on the environment can be relatively strong[12]. Through a series of image experiments and field research, a study found that streets with 30% VGI can gain relatively high landscape satisfaction[13]. A study on the influence of green environment on sports found that a high VGI (in this case 64%) can promote emotional upswing in the subjects[14]. Another study concluded that the best VGI for relieving anxious mood is in the range of 24% to 34%; while when VGI is higher than 34%, the healing effect could decrease[15]. Results show that high VGI values could produce quiet and refreshing feelings, attract people, and activate the commercial vitality of surrounding areas, and when the spatial VGI reaches 25%, it can give citizens an ideal “green” spatial experience. Based on the research findings, VGI has been adopted in urban planning and landscape design guidelines in practice, for instance in many Japanese cities, the 25% threshold of VGI was used as one of the criteria in urban landscape design assessment[16-19].
In China, advancement of urbanization brings influx of urban population and increases career and social status competitions. This brought psychological pressure and negative emotions such as anxiety and tensions, which may gradually erode the physical and mental health of urban residents. A study tested the healing value of green plants in urban streets in a Chinese urban context[20]. As one of the potential measures, the design of urban green space needs to take into account the restorative and wellbeing benefits in dense urban space. This request provides a challenge as well as an opportunity to architects and landscape designers. In this process, the VGI can be one of the important indicators of restorative and wellbeing effects in evaluating a landscape design proposal.
The methods to estimate the VGI of real-world greenery can be summarized into three categories, i.e., 1) Photo-pixel method; 2) big data and machine learning method; and 3) Airborne Light Detection and Ranging (LiDAR) scanning method. The photo-pixel method uses camera equipment to record the image of pedestrian view at the measurement point, and through image processing software, the graphics are corrected so that the image range can overlap the field of view. The VGI of the measuring point can then be obtained by calculating the ratio of the number of pixels of green plants to the total pixel number of the image. Due to the high labor and time cost, usually only a limited number of points in the site can be measured. The emergence of the Convolutional Neural Networks (CNN) method benefited from the development of Artificial Intelligence. The basic principle is to recognize the vegetation part of the image of a street view through the CNN, and realize the automation of the photo-pixel method. By crawling the panoramic image data from map platforms such as Google Earth, combined with neural network technology, the VGI analysis and visualization of the main streets in the city can be realized and the valuable information in the urban greening system can be obtained[21]. However, the city panoramic images that can be crawled from data sources such as Google Earth, are mostly taken from measuring vehicles driven along the city roads, so they can only reflect the VGI information of the driveway position, which may not accurately reflect the VGI information from the pedestrian’s perspective. Airborne LiDAR scanning method is currently a more advanced VGI calculation method, which can obtain surrounding spatial information, including vegetation morphology, by emitting electromagnetic waves of different bands and generating corresponding point clouds to accurately describe the shape of surrounding objects and environment[22-24]. The application of LiDAR scanning method can cooperate with CNN technology to identify and extract the vegetation morphology in the environment in order to further obtain useful VGI information[25]. This method has the advantages of high accuracy, high speed and wide range. However, there are also problems such as high costs and restrictions on aircraft control policies in cities.
The above methods are used for evaluating real-world greening environment. They are however not suitable for assessment of greening scenarios at the planning and design stages. To fill this gap, this paper attempts to propose a VGI simulation method which is more suitable for support design-decision making. Based on voxel model, this paper proposes a Sightline Sampling Algorithm (SSA) that can quickly calculate the VGI of each point in the site, enables designers to model the distribution of VGI through the designed urban spaces. This method adopts Bresenham algorithm[26,27], which is a classic algorithm in the field of computer graphics, to construct a certain number of voxel rays representing sightlines in Voxel model, and check each ray whether they are blocked by vegetation voxels during the emission process. By recording the number of rays blocked by vegetation voxels and the total number of emitted rays, and taking the ratio of the two, the VGI at this point can be estimated. This method can quickly calculate the approximate value of the VGI of each point in the entire site based on the building and vegetation voxel models, so as to reflect the distribution of VGI of the entire site.
The rest of the paper is organized as follows: Section 2 introduces in more detail the methodology of VGI estimation, and a field study and sensitivity analysis to verify the method and test the effects of variable parameter combinations on the accuracy and computation efficiency of the method. Section 3 presents a case study on the distributions of VGI in three different functional campuses of a university in Shanghai. Based on the results, a design renovation scheme was proposed and the before-after effects simulated and compared, demonstrating the potential of the proposed method in predicting and evaluating pedestrian green visual quality in complex urban spaces. Section 4 discussed the advantages and limitations of the presented method, and the paper ended by a summary in Section 5 conclusion.
2. Methodology
2.1 Sightlines sampling algorithm for calculating visible green index
This paper aims to provide a fast VGI calculation method based on the voxel model to facilitate a quick evaluation of VGI. With the use of parallel computation technique, the SSA can complete the calculation of 40,000 points for a site of 200 meters by 200 meters within minutes, thus enables designers to evaluate and iterate landscape schematic design at early stages of urban renewal or new development.
The proposed method is inspired by the Random Sun method to calculate sky view factor (SVF) in a city’s digital elevation model (DEM)[28]. It uses random azimuth and altitude angles to build a solar model and calculate the SVF: it first generates a large number of sun models with random altitude and azimuth in the sky of urban DEM, then superimpose the shadow on each point in the field. The fewer times the shadow is superimposed, the higher SVF a point will have. Similarly, the SSA calculates VGI by constructing a certain number of sightline models that are uniformly and randomly distributed in research space from the view point, and checking the end of each sightline to see the type of the object that blocks the sight. By recording the number of sightlines that end at vegetation voxels, and calculate the ratio between it and the total number of sampling sightlines launched before, we obtain the VGI value of the view point. So, the calculation is divided into three steps: 1) constructing the sampling sightlines, 2) judging and counting the object information at the end of the sightlines, 3) calculating the ratio of the number of sightlines blocked by the target object to the total sightlines sampling number. The SSA is implemented by a program written in Python 3.7.
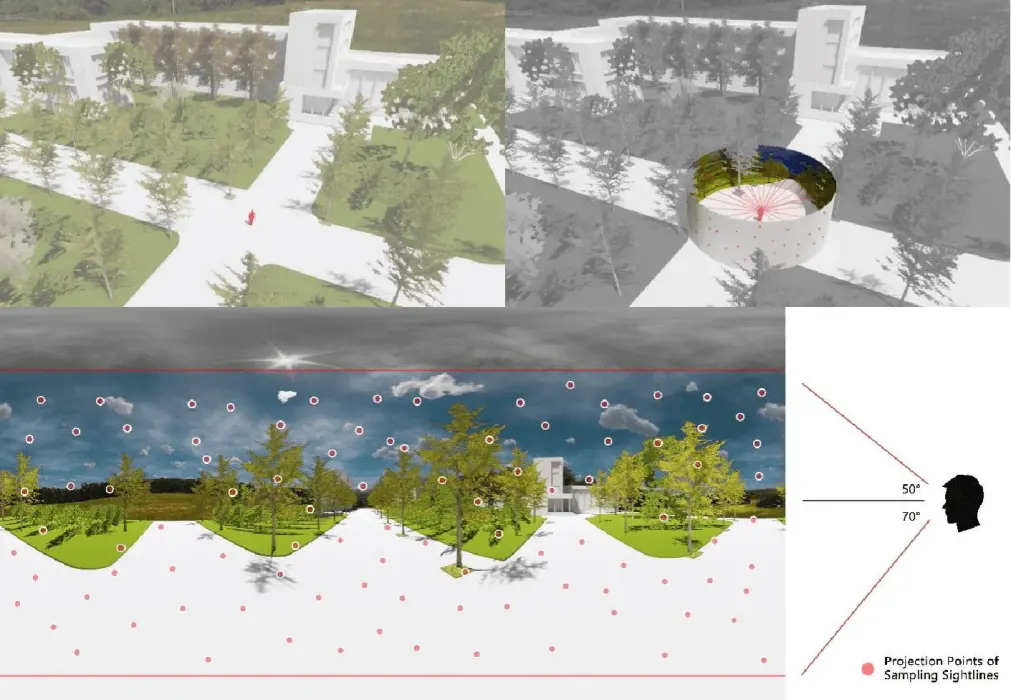
In Figure 2, the principle of this method can be explained more intuitively by means of projection analysis: First, we project the scene around the viewpoint onto a bucket canvas in the way of projection, and trim off the redundant images to make the image range on the canvas consistent with the human visual field. After this, during the process of sightline-ray emission, corresponding projection points will be generated in the bucket canvas. Then we unfold the canvas into a plane, and count the number of sightline projection points that are located in the position of vegetation pixels, and divide it by the total pixel number, and we have the corresponding VGI value.
In other words, this method can be understood as the expansion of “photo-pixel method” in 3-D space, while these sightlines are the spatial representation of picture pixels. It just changes the calculation unit from pixels to voxels, and also changes the exhaustive method to the sampling method.
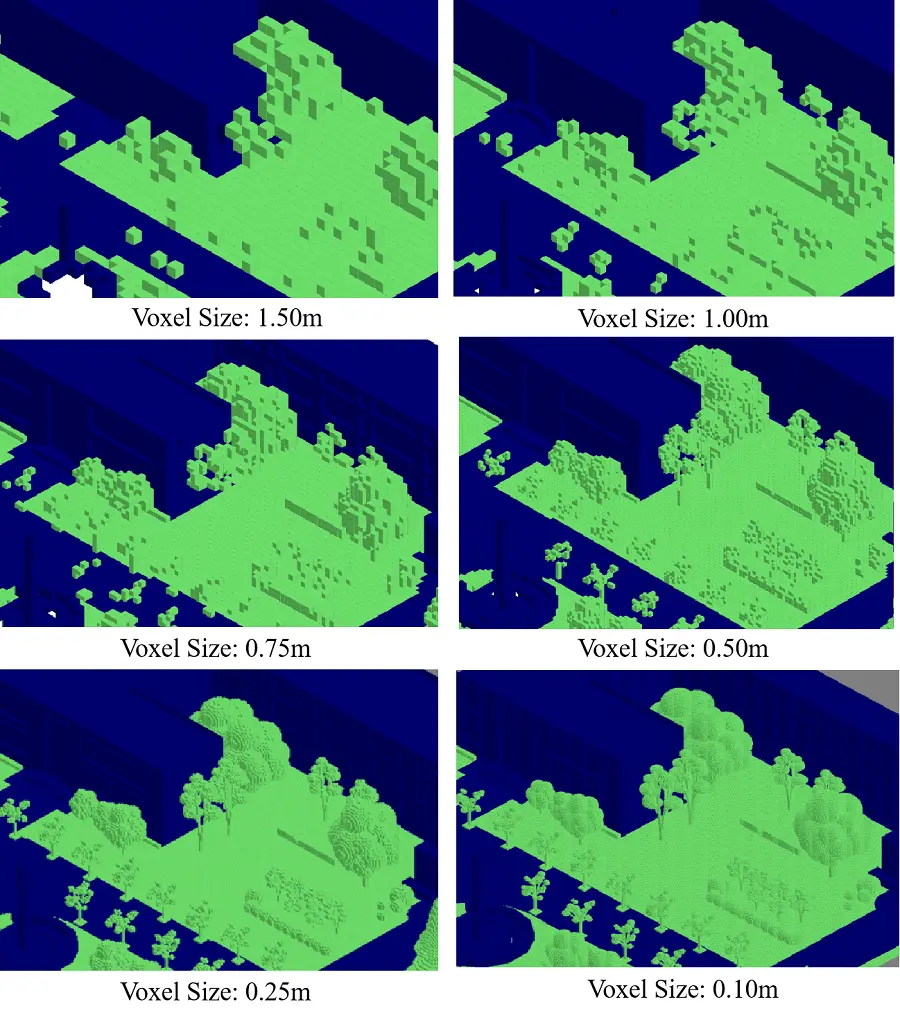
The SSA used in this paper is operated on voxel models (Figure 3). Voxel is the abbreviation of volume pixel, which is the smallest unit of digital data in 3-D space segmentation. Voxel is wildly used in 3-D imaging, virtual reality, medical imaging/visualization, global rendering, collision detection, computer animation or simulation, scientific data processing and other areas[29]. Conceptually, it is similar to the role of pixel in 2-D image data. Voxel model could be considered a model made up of many cubes of the same size, and the voxel size, which is the side length of the cubes, will affect the data size and spatial resolution of the voxel model. Compared with the traditional Computer Graphics model for instance made by SketchUp or Rhinoceros, voxel model is simpler in data structure, able to carry more information, and more suitable for scientific computing. Usually, a voxel model is represented by a three-dimensional matrix (or array). The index coordinates of matrix elements represent not only the number of data elements, but also the spatial position of the point. Besides, Voxel models can be transformed from formats such as STL and OBJ which can be directly exported from most modeling software, such as SketchUp, Autodesk 3D Max and Rhino. It means designers may use their favorite modeling software in work for this analysis. The transformation process is called Voxelization, which is a mature technology in industrial practice[30-33].
In this study, we built the experimental models with SketchUp software. A model was divided into two parts, buildings and vegetations, and each part exported into STL format separately. After this, we carried out the voxelization by a dual-level octree method, and got a 3D matrix composed values of 0 and 1 (0 means void in space while 1 means occupied by an opaque object)[33].
Compared with building modeling, plant modeling needs more considerations due to the complex geometry. Two modeling methods can be followed, i.e., the average transmittance method and equivalent sectional area method. In the former method, a geometric model is created covering the green plant canopy according to three views of green plants, and according to the front view and right view of the plants, the average light transmittance of the green plant crown is calculated, and the weight value of the voxel model of the canopy part to the average light transmittance of the canopy is determined. Whereas on the latter, firstly we calculate the average sectional area of plants according to the front view and right view of the green plant, and then create a geometric model similar to the shape of vegetation, make the cross-sectional areas of the two approximately equivalent (Figure 4).
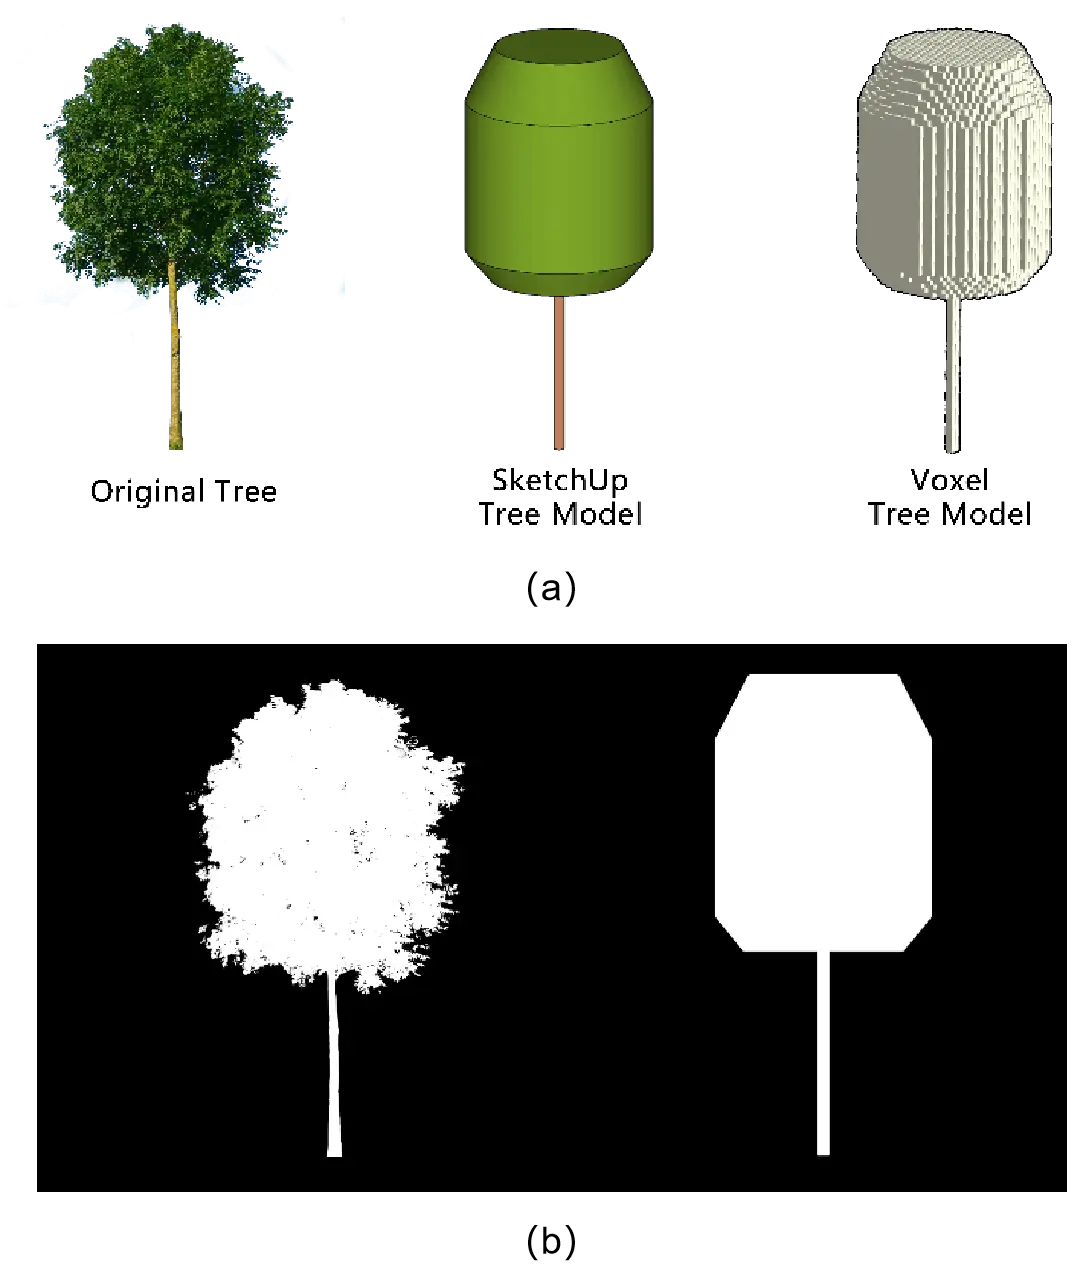
Figure 4. In the process of plants modeling (a) the projected area of the plant model should be close to that of the real plant: the projection of the real tree; (b. left) has a total of 135,462 pixels while the projection of the model; (b. right) has a total of 135,252 pixels.
In the process of plant modeling, there are some key points to be noted:
• Important or unique plants (e.g., a heritage tree) can be represented by detailed models, but the size of the model voxel unit should be appropriate, because details in the model that are smaller than the size of the voxel unit may be omitted during the voxelization process, resulting in incorrect simulation results.
• Plant growth is a dynamic process. For example, the same plant will have different shapes at different growth stages, and a deciduous tree will have very different shapes in different seasons. Therefore, a model can only reflect the greening situation of the site at a certain time.
• The shape of some plants has obvious individual differences, so designers should consider it according to their own landscape design experience when modeling. Regular and pruned landscape plants, such as street trees and holly clumps, can be produced by copying and pasting the same model. However, if the plant is complex and important to the design, the model should be refined reasonably according to the accuracy requirements of the simulation.
After the conversion of the voxel model is completed, rays representing the sightlines needs to be constructed in the voxel model. The construction of sightlines is based on the Bresenham algorithm[26,27], that is, through the determined azimuth angle θ, elevation angle φ, and starting point coordinates [i, j, k], draw a ray in the voxel space that continues to advance until it is blocked. The line element in voxel model is made up by a series of adjacent points. When the ray’s coordinates of the starting point [i0, j0, k0], azimuth, angle θ and elevation angle φ are known, and Δl is the growing distance of the ray during each refreshment, then the coordinates of the next point in the progress of the ray can be obtained by the following equations (Eq. 1-6):
The direction of the rays can be controlled by the altitude and elevation angles obtained by the random function, according to the principle of computer random number generation, it can be considered that when the number of rays is large enough, their distribution in space will be uniform.
In addition to using random altitude and azimuth angles, the construction of the sampling sightlines can also refer to the sightline construction process in the viewshed sphere analysis method. Yang et al. built an effective viewshed analysis model by uniformly generating a superficial target point matrix on a visual hemisphere model, and connecting the points in the matrix to the viewpoints in turn, which can be used for the calculation and analysis of the visual information in the city[34]. This method obtains a more uniform sampling sightlines distribution, but it will also increase the computational complexity of the program.
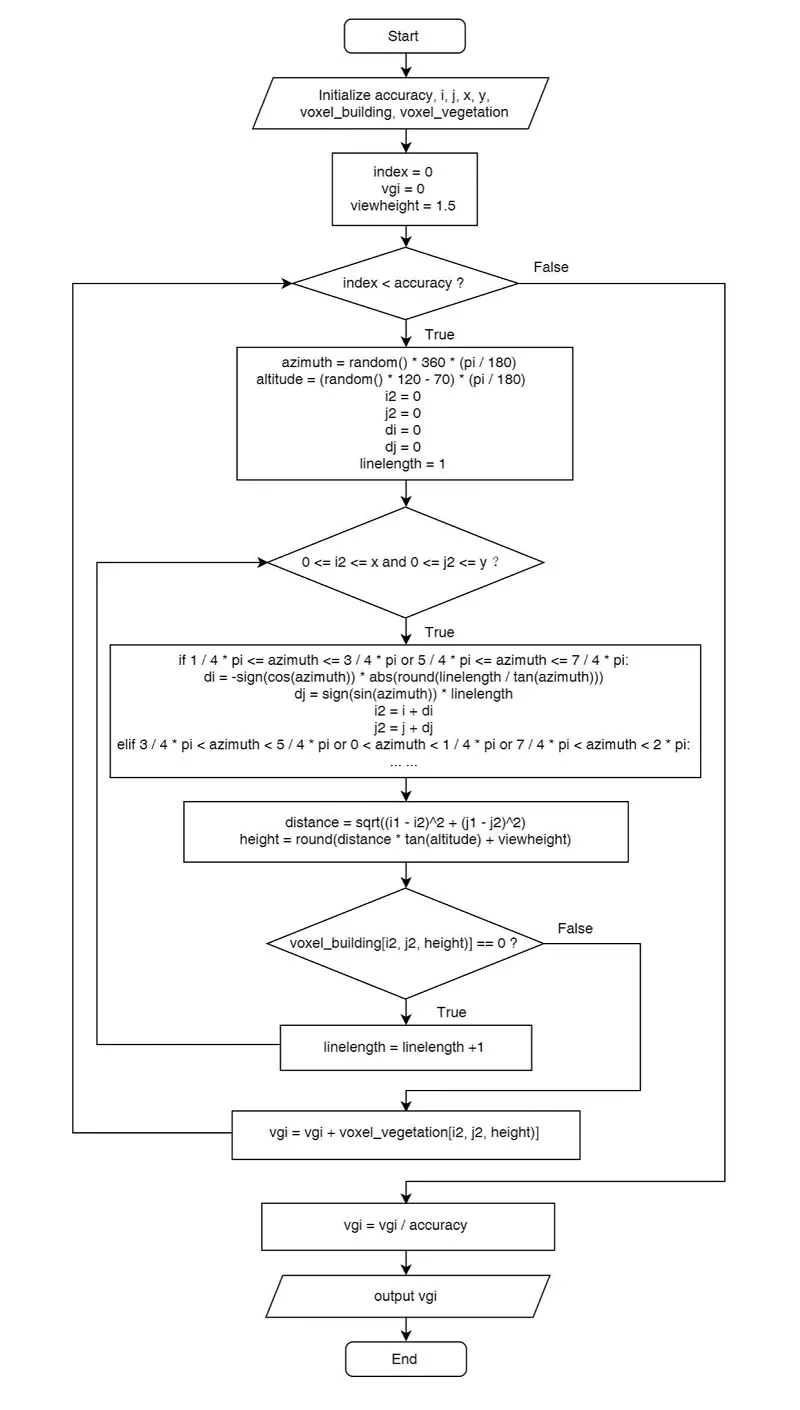
During the process of ray emission, it is necessary to monitor whether the ray collides with an object in real time. If there is no collision, the ray continues to advance by one voxel grid unit. Otherwise, it is necessary to judge whether the object blocking the line of sight is a plant, and whether the object is transparent. If the object is not a plant, the program will stop this ray and start drawing the next one. If the object is an opaque plant, the VGI value of this point is increased by 1/Sampling Times and then the ray stops and another one starts. If the point is a transparent (porous) plant, the VGI value of this point is increased by the Transmittance/Sampling Times, then the ray weight reduces to (1-Transmittance) and the ray continues to move until be blocked by an opaque object or the ray weight reduce to a certain threshold. The flow chart of the program is shown in Figure 5.
According to the principle of the algorithm, there should be three main factors affecting the accuracy of the VGI calculating results: 1) How well the model represents the real scene; 2) Cell size of the voxel model; 3) Construction method and total number of sampling sightlines.
The degree of restoration of the model to the real scene is related to the modeling skill of the modeler and the accuracy of the on-site surveying. The modeler is required to restore the real scene through the computer model as accurate as possible. The cell size of the voxel model affects its spatial resolution and its ability to describe object details. Smaller the unit size, less spatial information is lost during the voxelization process, and more delicate will be the restoration of real scene. In the meantime, because the line elements in voxel model is represented by a series of continuous voxel units, when the voxel size is too large, the line element representing the sightline may become a block, thus, the collision probability between sightline and object may increase, reduces the accuracy of VGI simulation. The number of sampling sightlines also affects the credibility of sampling. A certain number of sampling line of sight is needed to ensure that the calculation result of VGI is not affected by random factors.
In brief, the smaller the voxel model cell is, the more accurate the modeling is, and the more the number of sampling sightlines, the more accurate the calculation result of VGI will be. However, due to the principle of voxelization algorithm, the 3-D model should be as simple as possible, and express the building and vegetation environment of the scene in the form of simple geometry. Moreover, the changes of the voxel size and sampling times also need reasonable design, because decrease in voxel size (thus increase in voxel number) and increase in sampling lines may lead to exponential increase in calculation time.
2.2 Calibrating the SSA
In this section, a set of experiments were conducted to verify the accuracy and reliability of the SSA as developed in the previous section. The chosen experimental site is part of a university campus with a faculty building and its southern outdoor space. The size is 110m*90m*20m (length*width*height). There are rich vegetation types in this site, including deciduous trees represented by Platanus, evergreen trees represented by Metasequoia, shrubs represented by boxwood, and lawns etc. The modeling was based on a thorough site-survey on geometric details of the trees, shrubs and plants on site, in order to replicate the form and geometry as accurately as possible (Figure 6).
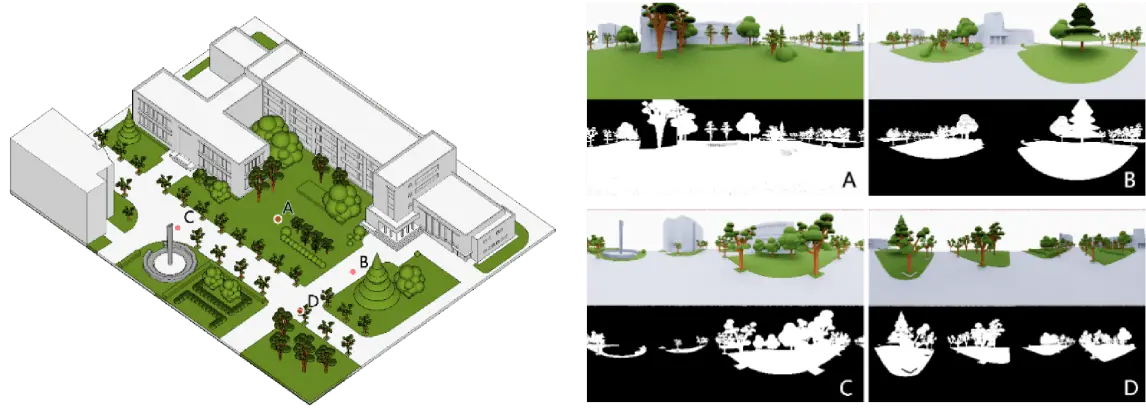
Figure 6. Building and vegetation geometry model of a campus site with locations of four calibration points (a) and panoramic photos of points A, B, C, D.
The experiment takes the northwest corner of the site as the coordinate origin (0, 0), and the coordinate unit is 1m. Four points numbered A, B, C, D with plane coordinates (55, 40), (85, 40), (40, 25), (85, 25) were selected as calibration points. For each point, a panoramic image was created and the correspondent VGI value calculated using the photo-pixel method. The results as shown in Figure 7 are used as baseline VGIs of the test points.
To test the sensitivity of model unit size and sampling times on modeling accuracy of VGI, we tested the combinations of six (6) unit sizes (0.1m, 0.25m, 0.5m, 0.75m, 1.0m, 1.5m) and ten (10) sampling times (50, 100, 150, 200, 300s, 400, 500, 750, 1,000 and 2,000). Calculation results are shown in Figure 8, Figure 9, Figure 10 and Figure 11.

Figure 8. Calculation results of the VGI of points A. VGI: the visible green index.

Figure 9. Calculation results of the VGI of points B. VGI: the visible green index.

Figure 10. Calculation results of the VGI of points C. VGI: the visible green index.

Figure 11. Calculation results of the VGI of points D. VGI: the visible green index.
The error distributions of four test points under different variable combinations are shown in Figure 12, Figure 13, Figure 14, Figure 15 and Figure 16.

Figure 12. Error of the VGI calculation result of point A. VGI: the visible green index.

Figure 13. Error of the VGI calculation result of point B. VGI: the visible green index.

Figure 14. Error of the VGI calculation result of point C. VGI: the visible green index.

Figure 15. Error of the VGI calculation result of point D. VGI: the visible green index.
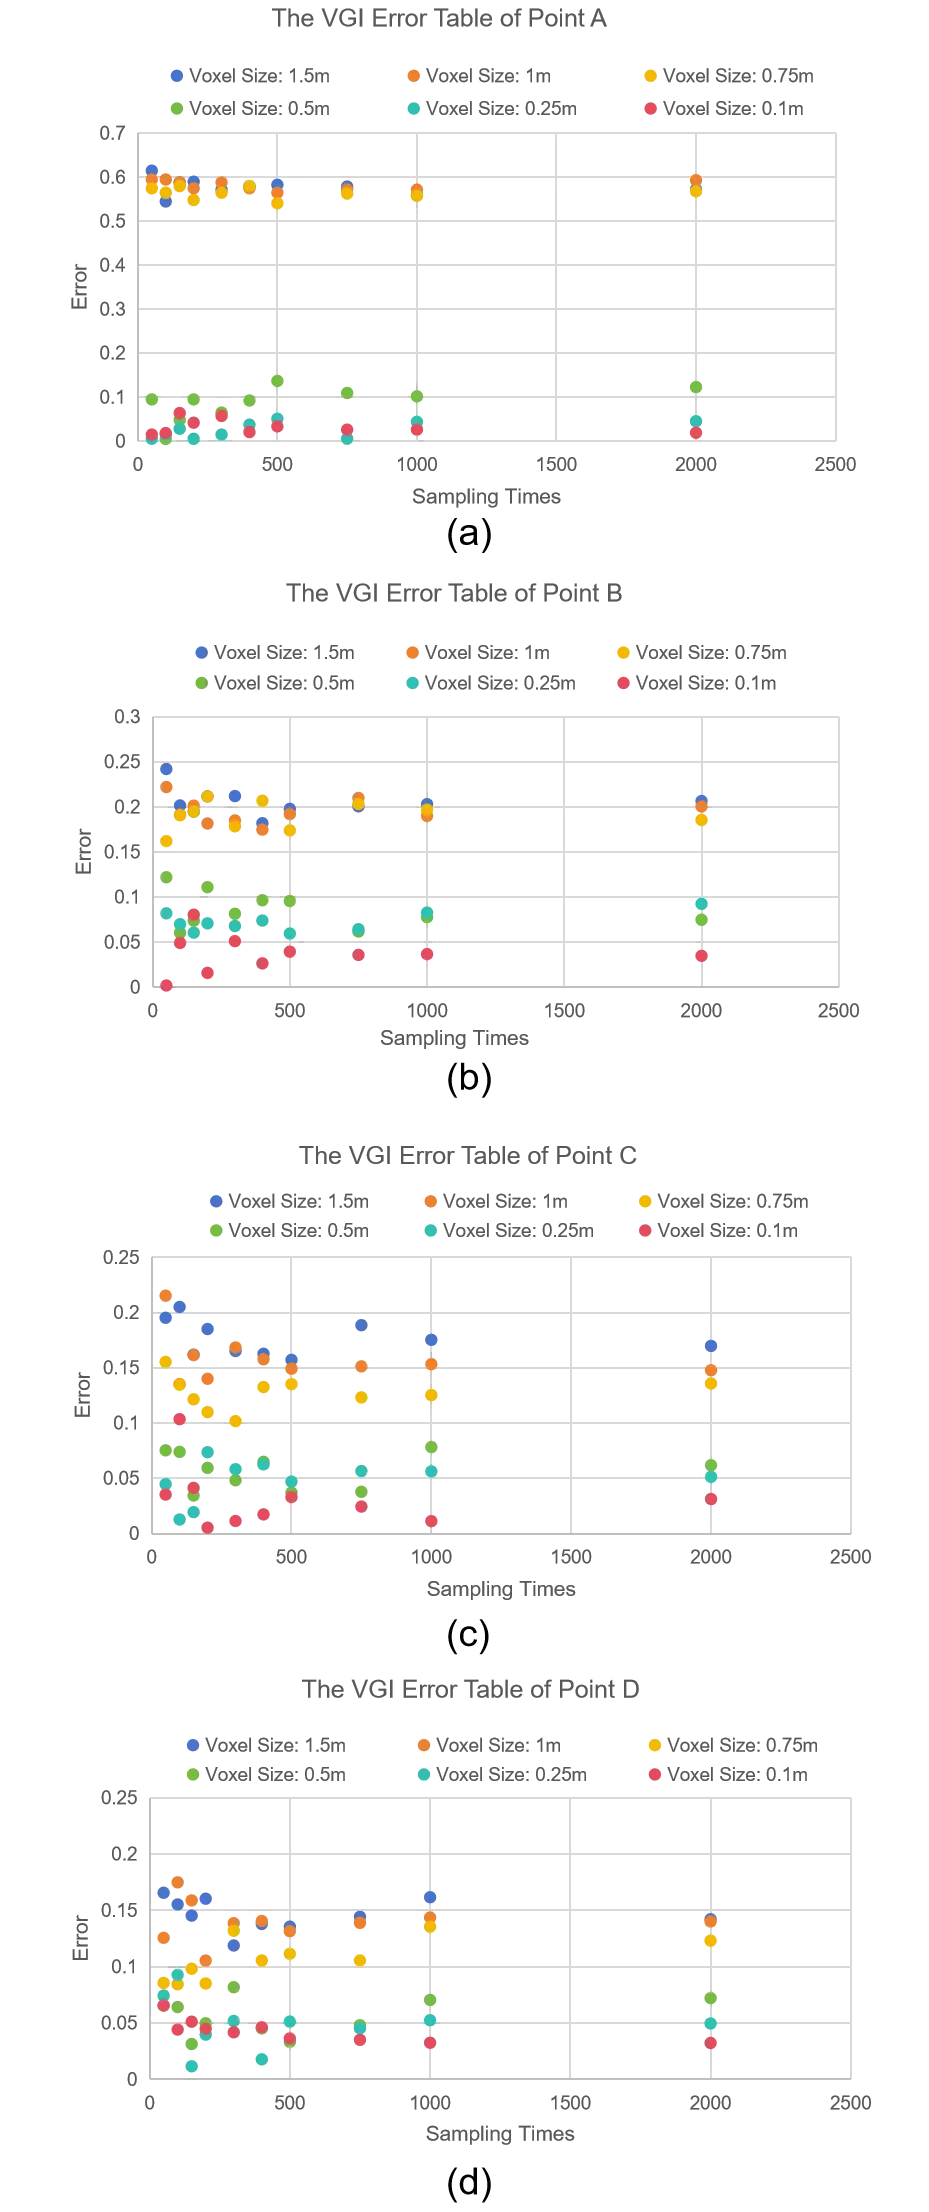
Figure 16. The VGI Error Charts of (a) Point A; (b) Point B; (c) Point C; and (d) Point D. VGI: the visible green index.
It can be seen from the calculation results that, if the calculation parameters are set properly, this method can quickly and accurately calculate the VGI values in the research site. In general, larger sampling times and smaller voxel sizes lead to higher accuracies, and there is also a phenomenon of diminishing marginal benefits in this process. When the voxel unit size is larger than a certain value, the VGI calculation result will have severe fluctuations, and the error will not diminish with the increase in the sampling times, because at or above that value voxels cannot effectively describe the geometric shape of buildings and vegetation. Modelers should therefore strike a balance between calculation speed and accuracy. When the building and vegetation geometry are complex, a smaller voxel size is preferred to keep the necessary information.
From Figure 17 it can be seen that when the voxel size is too large, the spatial characteristics of simple geometry can still be restored to a certain level (such as the spherical large-leaf boxwood). However, it’s not effective to restore the deciduous trees which have complicated details (such as the Tung Trees). Therefore, we should select proper voxel size to match the model scales, in order to ensure the accuracy.
The sampling times is also an important factor that determines the accuracy of the calculation result. When the number of samplings is less than 200, a numerical fluctuation of 5%~10% will often occur. Under the premise of ensuring the accuracy of the voxel size, when the number of samples reaches at 1,000, the fluctuation of this value can be reduced to 3% ~ 4%. Considering that the VGI itself is affected by the growth state of the plant, and the growth of the plant is a dynamic process, this degree of error is acceptable.
It is worth noting that, compared with the photo-pixel method, the VGI value obtained by the SSA is constantly 3%-5% lower. The possible reason is that in the process of voxelization, due to the principle of voxelization algorithm, the model will lose a part of its thickness near its surface (less than one-half of the voxel size). As a result, the voxel model will be slightly smaller than the previous model, leading to the decrease in VGI value. This kind of error can be corrected by setting calibration points and using empirical parameters.
3. Case Study on VGI in Three Campuses
In order to further explore the application of the SSA in actual urban scenarios, a case study was carried out on VGIs in three campus sites of a university in Shanghai, China. The possible areas in need of better green view were spotted and design renovation schemes as well as the resultant VGI improvement were presented based on outcomes of the proposed SSA algorithm.
3.1 Case description
College students often have psychological problems such as anxiety due to academic pressure and employment pressure. Therefore, it is very important for universities to build a campus landscape that can relieve anxiety and relax the body and mind. In the light of this, three campuses of a university in north-central Shanghai were chosen for green view evaluation and landscape design renovation assessment.
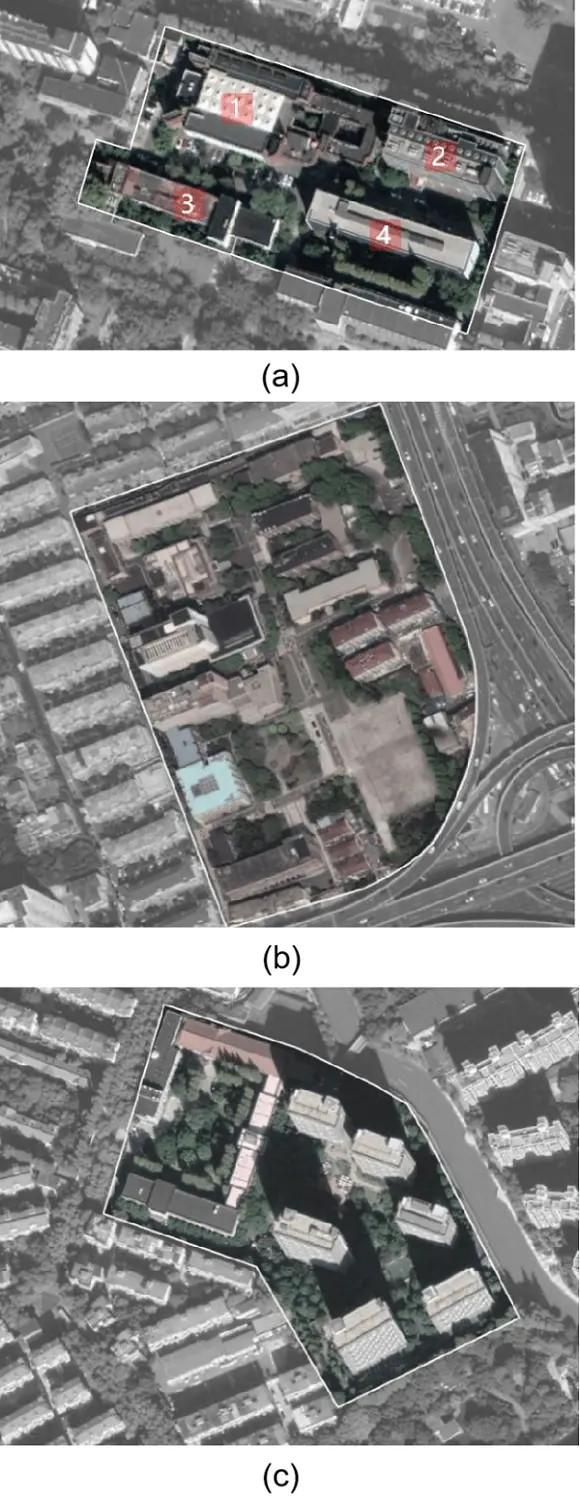
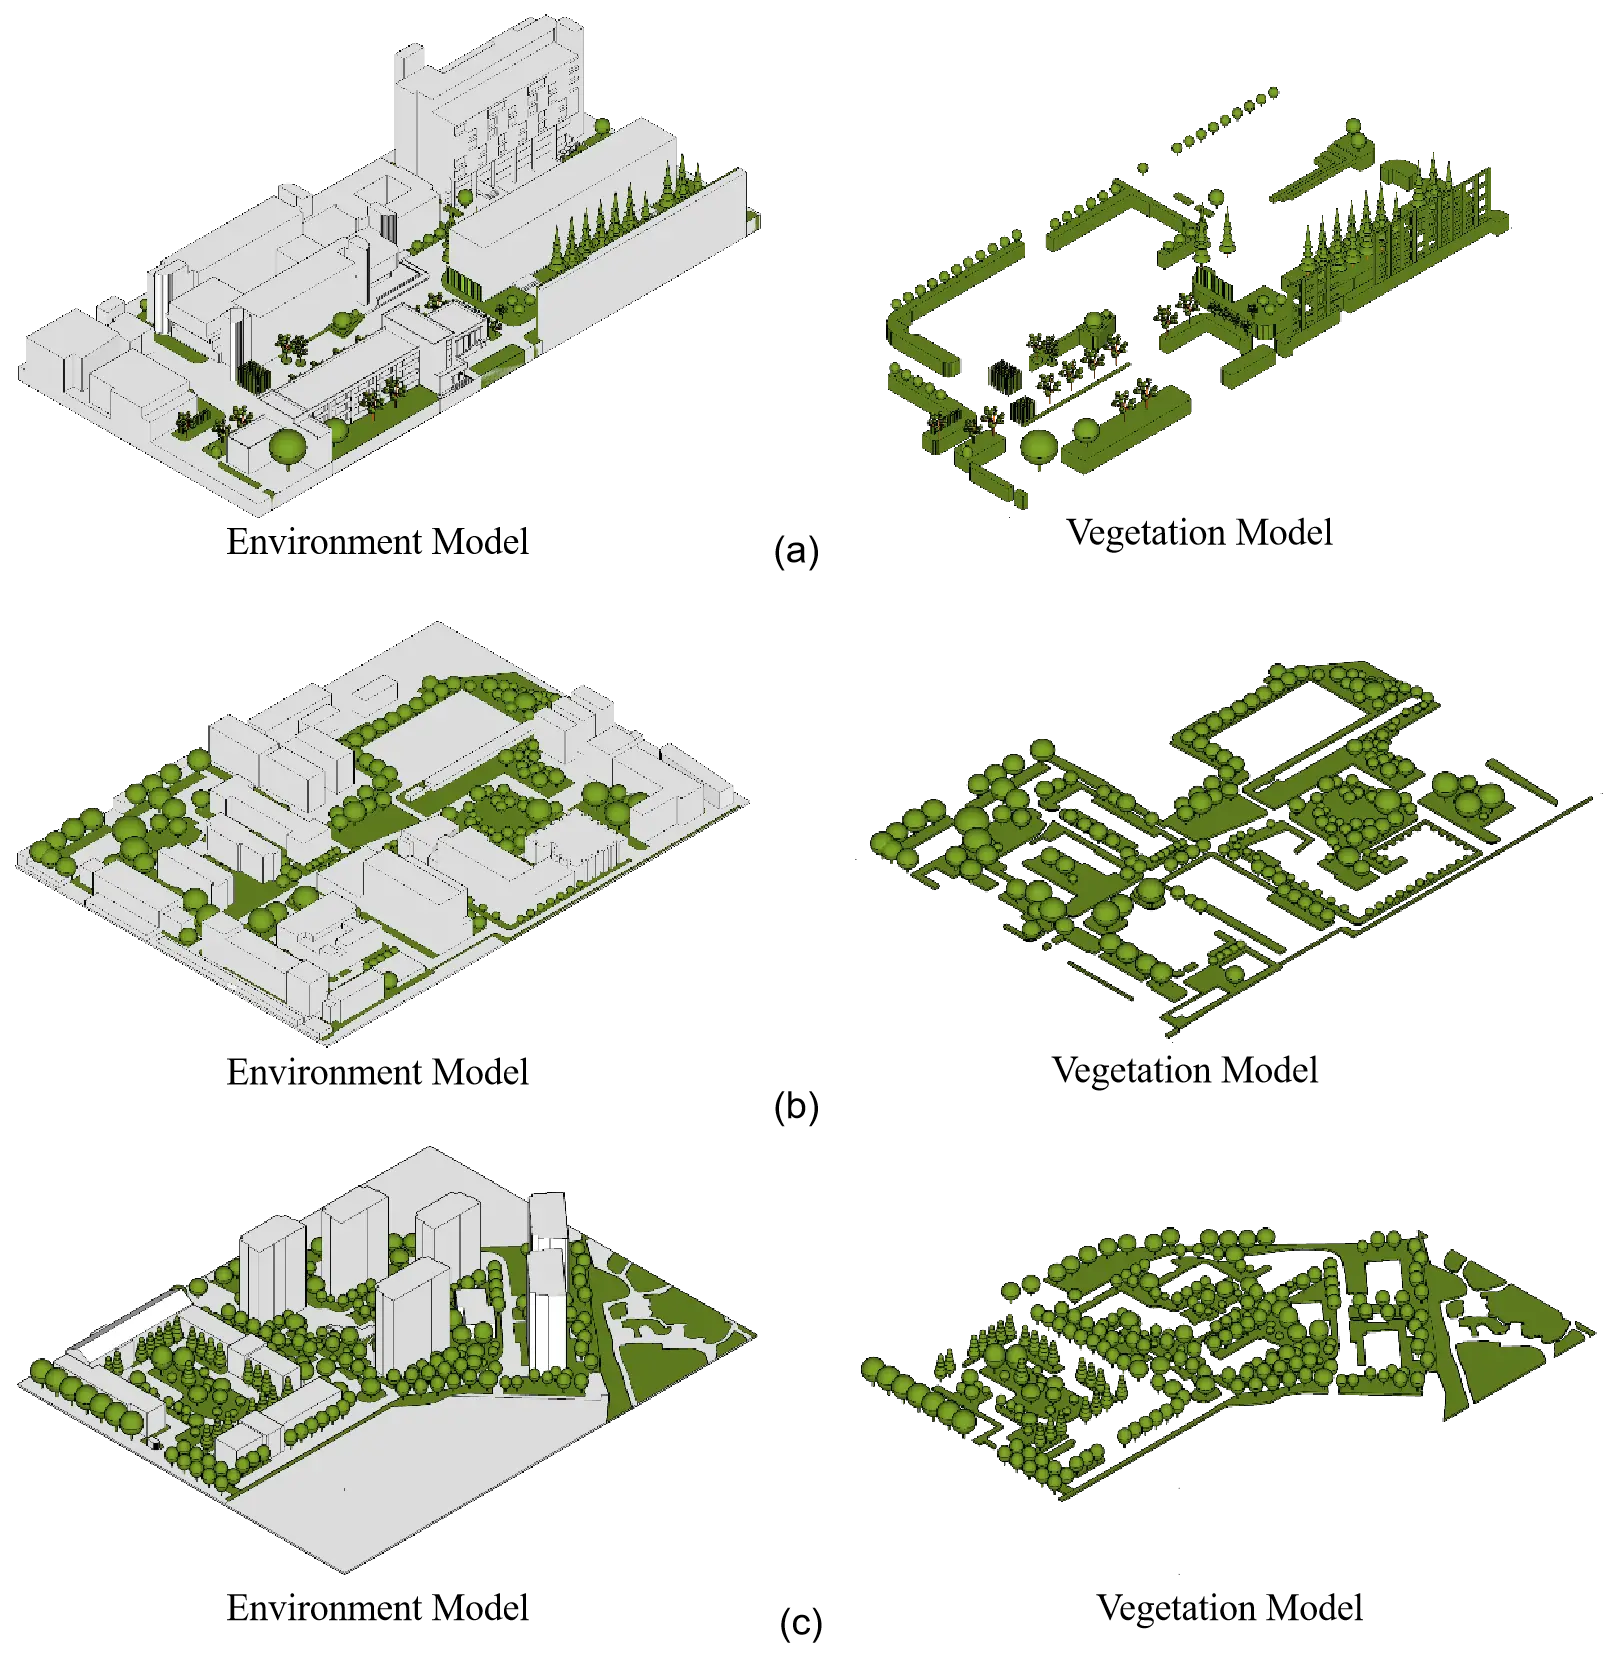
Site 1 is the College of Architecture and Urban Planning of the University, and the size of the site is 210m*100*48m (Figure 18a). It consists of four teaching buildings of different heights surrounding the central square. The space of the site is varied, with a sunken square and a second-story terrace on the east side. The main vegetation types are shrubs and trees with spherical crowns, tall deciduous trees with inverted cones, lawns, and cedar trees. In addition, there is a certain area of vertical greening system on the north facade of an adjacent building in the southeast corner of the site. Site 2 is the Medical School campus of the University, located in the city center and occupies a small area with a size of 263m*184m*30m (Figure 18b). The main types of greening are trees with spherical crowns, shrubs and lawns. Site 3 is the Graduate School Campus of the University, its size is 290m*230m*60m (Figure 18c). The site is divided into a teaching cluster composed of four enclosed multi-story buildings and a residential cluster composed of six high-rise dormitory buildings. The vegetation types are various and the green ratio is relatively high.
3.2 Object models and parameter setting
The vegetation and building models of three sites were established with reference to the university campus databases. According to calibration results of previous section, to obtain a balance between accuracy and efficiency, the voxel size is set to 0.25m, the number of samplings is 5,000 times. The viewing plane is 1.50 meters above the ground. The geometric models and the corresponding voxelization results are shown in Figure 19.
3.3 The calculation of VGI
We then ran the SSA program to process the model and have the VGI distribution maps of the three sites as the status-quo scenarios (Figure 20). The operation time is 2 minutes 17 seconds (site 1), 6 minutes 57 seconds (site 2), and 16 minutes 3 seconds (site 3). It can be seen that under the same unit voxel size setting, the operation time is mainly determined by the size of the voxel model.
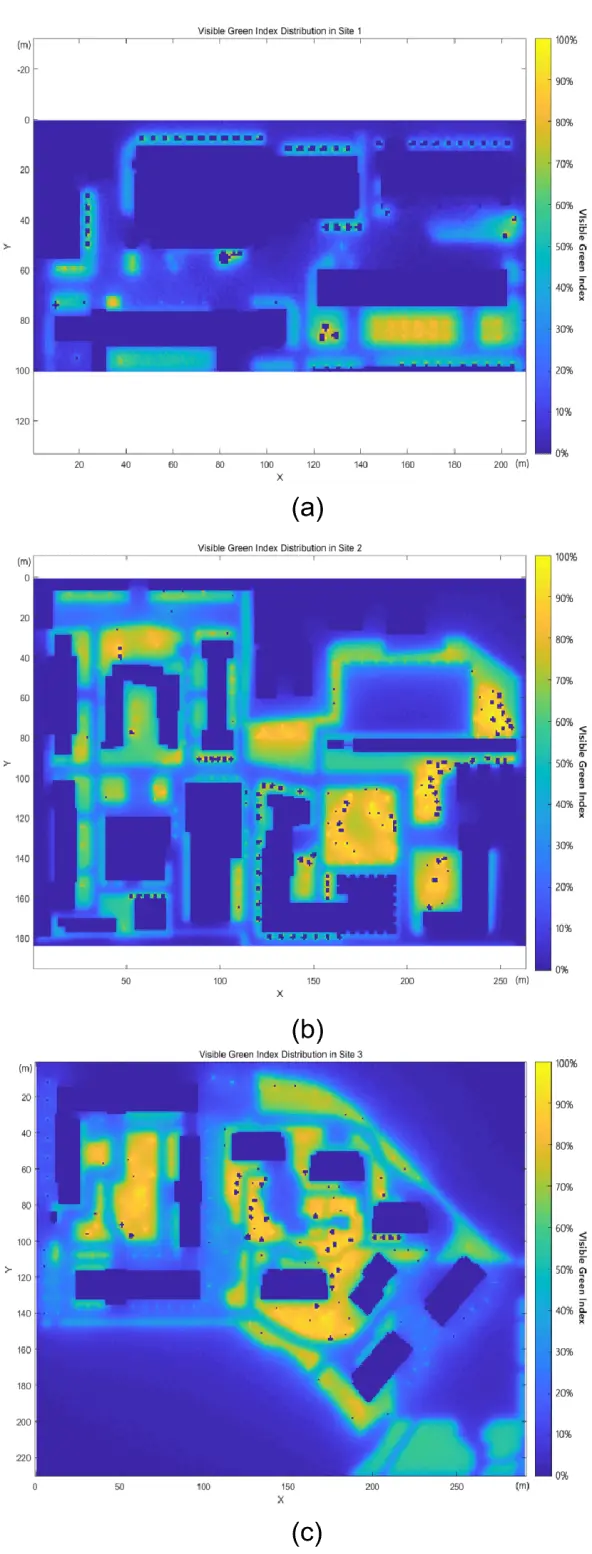
Figure 20. VGI distributions in (a) Site 1; (b) Site 2; (c) Site 3. VGI: the visible green index.
3.4 A renovation proposal to increase VGI
It can be seen from the VGI distribution map of site 1 (Figure 20a) that the high VGI area is located in the cedar trees cluster between the south facade of building 4 and the south site boundary. However, this area is lack of visual access due to its location. The square between the four teaching buildings, mainly covered by hard pavement and with only a few trees around, has an overall insufficient VGIs. This area is the pedestrian hub and place of social interactions among students and faculty, and so a better green view may provide more visual attractions and restorative benefit for people.
For site 2 (Figure 20b), the high VGI areas are at the entrance square of the campus in the northwest and the library square in the southeast. In both areas, the high VGI are produced by a series of combined greening landscape which includes batches of 8-meter-radius trees and grass lawn. The dark rectangle at the top right of the site is the basketball court. Considering that the green space helps to enhance the students’ exercise status and the recovery of the body after exercises[18], it should be useful if we increase the height and diameter of the canopy of the green plants around the basketball court to further enhance the VGI in this place.
In Site 3 (Figure 20c), the teaching area is enclosed by four 5-storey buildings. The rectangular center is a park with dense trees. The landscape design is excellent over there. The dormitory area in the east consists of six high-rise dormitories buildings. This layout leaves large room for greenery and other landscape features, so the green ratio of this site is relatively high. Indeed, the campus park in the teaching area and the jogging track in the dormitory area actually have very considerable utilization rates.
In response to the problems found in the status quo, design efforts are made to improve the green visual quality in the central square in Site 1. Due to the limited size of the square and possible effect on daylight access, lawn and trees are not considered as options to increase VGI. We adopted the form of vertical greening as an alternative to ordinary green space. In the renovation plan, the original sunshade grille on building 1 is replace by a living-wall system, and a new double-skin green façade system is built on the north façade of the building 3. Building 4 has a small grassland at the plinth, which allows a batch of 6-metre-high bamboos next to its west façade.
The updated greenery is modeled and transformed into a voxel model for following calculation (Figure 21a). Start the SSA program again to calculate the VGI distribution of the renovated site 1, and we have the updated VGI mapping as compared to the original distribution (Figure 21b). By subtracting the VGI matrix of the renovation with the original one, the VGI incremental contribution of the VGS in the renovation can be mapped (Figure 21c). It shows that, the introduction of the VGS has increased the overall VGI value of the square by ~5%, with the VGI value of the main area in the square increase from 10% to ~15%. This supports that the VGS renovation scheme can effectively improve the green view of the surrounding space. While implying the potential of VGS in urban renewal, it also shows that the method can be applied to VGI simulation of complex greening.
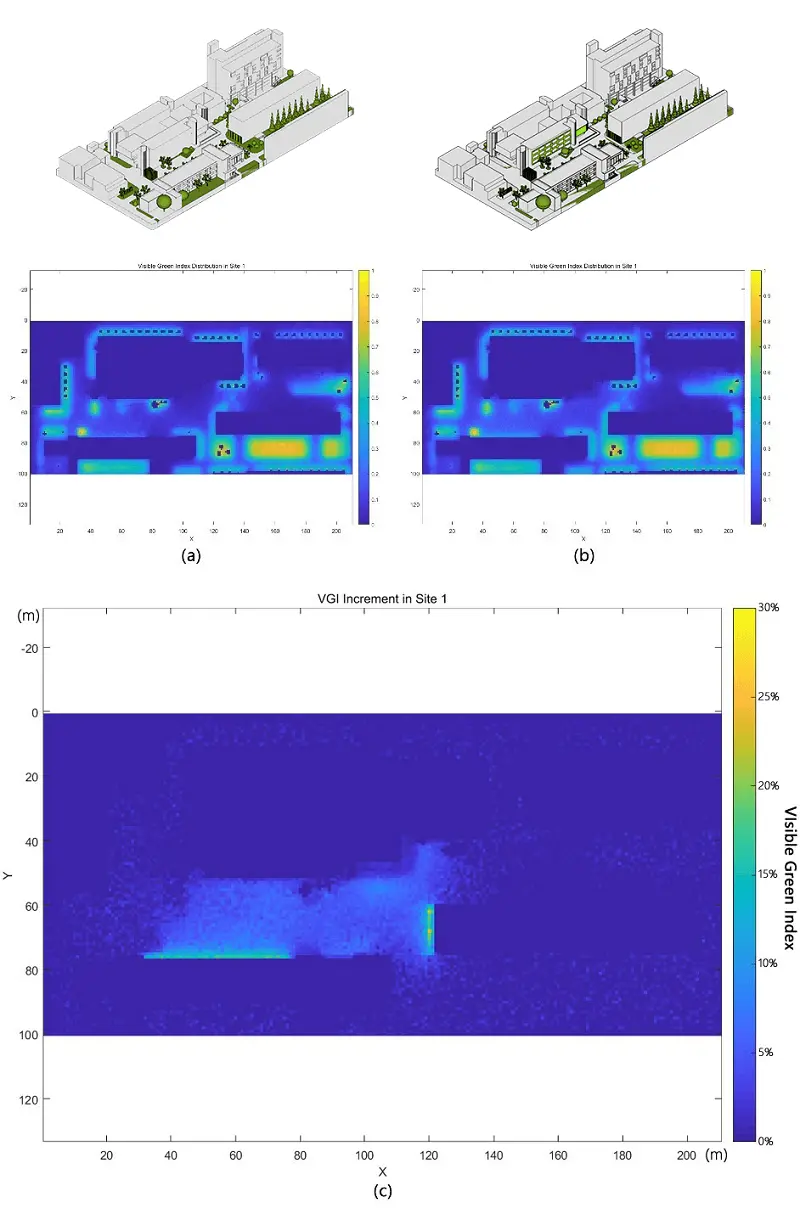
Figure 21. (a) Original VGI distribution of site 1; (b) Reformed VGI distribution of site 1; (c) VGI increment distribution map of site 1. VGI: the visible green index.
4. Discussion
The present study proposes an algorithm that quickly calculates the spatial distribution of VGI of urban space based on voxel model. The algorithm could enable designers to analyze and evaluate the visual effect or impact of existing or proposed landscape feature based on VGI. The method adopted a classic algorithm in the field of computer graphics to the calculation of VGI using the voxel model. The advantages of this method can be summarized as follows:
• It is computational-efficient, with a high operation rate and reasonably good precision. The characteristics of voxel models' data structure make it easier to be accelerated by parallel computing method, compared with CPU single-threaded computing, it may increase the computing speed by hundreds of times. The improvement of computing efficiency is of great significance to design integration. Even the case study in this paper presents a one-time comparison of the before-after greenery scenarios, the nature of design workflow requires that the method allow performance prediction of design schemes as quickly and efficiently as possible. With the emerging machine learning technology, many design-supportive multi-objective optimization algorithms, such as genetic algorithms, require programs that allow quick feedback with quantitative results for iterative design-evaluation-optimization loop.
• It has flexible application scenarios: this method can be used not only to evaluate the greening quality of the existing, real-world environment, but also to simulate and predict the greening effect of landscape scenarios at early design stages.
• This method works on voxel model, which can be obtained through voxelization of STL or OBJ format files exported by any current commercial modeling software, so design professional can maintain their familiar modeling tools without the need to grasp new tools from other disciplines. This helps to encourage designers to integrate the method in the overall design workflow.
• The simulation process is time-friendly and flexible. In addition to the VGI, it can be extended to the calculation of visibility of any other object, for instance, commercial billboard allocation study.
• It can compute and visualize the spatial distribution of VGI, rather than several discrete points, and therefore can more intuitively reflect the design-effect correlation and changing trend of the VGI.
• The algorithm is straight-forward and easy to transfer across platforms, which means it has the potential to be made as plug-ins for common modeling software like SketchUp and Rhino.
While the limitations of this method can be summarized as follows:
• When calculating the real-world VGI distribution, it is resource-costly to model 3-D greenery (mainly trees and shrubs) based on traditional ways (e.g., site survey). But with the support of advanced survey technologies in Photogrammetry e.g., Lidar and other technologies, the acquisition of site models will become more convenient and efficient.
• Because the calculation is based on the sampling principle, it is difficult to achieve absolute accuracy, and it is difficult for the voxel model to completely restore the complex shape of plants neither. As a result, before the simulation, the designer needs to systematically summarize the plants in the design or the real scene, and establish a model material library that can accurately reflect the morphology of plants in different stages of its growth cycle. Considering the time cost, in most time, it has to use simple geometry to abstract the plant, which may lose plant details.
• The space direction of sightlines is controlled by random function. It will certainly cause some fluctuation noise in VGI data. Thus, if the value is amplified, the space cannot be strictly smooth and continuous. If necessary, after the calculation is completed, the VGI data should be denoised.
• The program currently has a number of nested loops, so when the accuracy setting gets higher or the calculation site range is expanded, the time costs will also increase significantly.
• The VGI program also has obvious boundary effects, that is, the calculation results of points near the site boundary will be much smaller than other positions. The site model is often incomplete in areas close to the boundary, so it cannot provide accurate environmental information for calculation. Therefore, when making the site models, it’s necessary to leave enough buffer zones.
• Restricted by the data size and calculation efficiency, when calculating the VGI distribution, the impact of the distant landscape is often ignored. But the distant landscape is also an important element of the visible green. In the future work, the data structure can be optimized by multi-tree to improve the traversal efficiency of remote data, so that the method can be realized in a larger area.
5. Conclusion
This paper aims to develop a fast calculation method of VGI based on the SSA. The algorithm is calibrated and verified through a field study and measurement. Analysis on the sensitivity of voxel modeling parameters indicates the need to balance accuracy and computational cost, and when the voxel resolution is less than 0.10m and the sampling times is greater than 2,000, the calculation error is about 2~3%. The followed case study explores the application of the method in evaluating real-world urban building sites with vegetation. The results show that the method can evaluate status-quo green view levels, identify potential areas for improvement as well as predict the improved VGI distribution with renovation design scheme. The voxel-based SSA method can thus be used to analyze the VGI distribution in real or hypothetical urban space, with the potential to be integrated in the design iterations of urban renewal or new town development research or practice, to inform design optimization of urban greening that is oriented towards better pedestrian visual experiences.
Authors contribution
All authors contributed equally to this work.
Conflicts of interest
The authors declare no conflicts of interest.
Ethical approval
Not applicable.
Consent to participate
Not applicable.
Consent for publication
Not applicable.
Availability of data and materials
Not applicable.
Funding
The research was supported by the National Natural Science Foundation of China (NSFC) Project (Grant No: 52178022).
Copyright
© The Author(s) 2023.
References
-
1. Eisenman TS. Frederick Law Olmsted, green infrastructure, and the evolving city. J Plann Hist.2013;12(4):287-311.[DOI]
-
2. Elizabeth S. Park Maker: life of Frederick Law Olmsted. New York: Routledge; 2000.[DOI]
-
3. Ulrich RS. View through a window may influence recovery from surgery. Science. 1984;224(4647):420-421.[DOI]
-
4. Ulrich RS. Human responses to vegetation and landscapes. Landsc Urban Plan. 1986;13:29-44.[DOI]
-
5. Ulrich RS, Simons RF, Losito BD, Fiorito E, Miles MA, Zelson M. Stress recovery during exposure to natural and urban environments. J Environ Psychol. 1991;11(3):201-230.[DOI]
-
6. Holahan C. Cognition and environment: functioning in an uncertain world. PsycCRITIQUES. 1984;29(1):79.[DOI]
-
7. Kaplan S, Kaplan R. Health, supportive environments, and the reasonable person model. Am J Public Health. 2003;93(9):1484-1489.[DOI]
-
8. Kaplan R, Kaplan S. The experience of nature: a psychological perspective. Cambridge: Cambridge University Press; 1989.
-
9. Kaplan R. The role of nature in the context of the workplace. Landsc Urban Plan. 1993;26(1-4):193-201.[DOI]
-
10. Kaplan R. The role of nature in the urban context. In: Altman I, Wohlwill JF, editors. Behavior and the Natural Environment. Boston: Springer; 1983. p. 127-161.[DOI]
-
11. Aoki Y. Relationship between percieved greenery and width of visual fields. J Japan Inst Landsc Archit. 1987;51(1):1-10.[DOI]
-
12. Wu L, Wang Y. The green looking ratio of urban roads and its major factors. J Shanghai Jiaotong Univ (Agriculture Science). 2009;27(3):267-271.[DOI]
-
13. Aoki Y. Evaluation methods for landscapes with greenery. Landscape Res. 1991;16(3):3-6.[DOI]
-
14. Han KT. The effect of nature and physical activity on emotions and attention while engaging in green exercise. Urban For Urban Greening. 2017;24:5-13.[DOI]
-
15. Jiang B, Chang CY, Sullivan WC. A dose of nature: tree cover, stress reduction, and gender differences. Landscape Urban Plann. 2014;132:26-36.[DOI]
-
16. Aoki Y. The impact of greenery on urban landscape identification and evaluation. The Japan J R Estate Sci. 1987;2(3):68-74.
-
17. Yamada S, Fuji T, Shinsaku M. Development and verification of the impression deduction model for green space with ratio of omnidirectional visibility green space. J Archit Plann. 2016;81:727.[DOI]
-
18. Ministry of Land, Infrastructure, Transport and Tourism. Social experiment survey on the correlation between urban greening and psychological effects. Parks & Open Spaces 66; 2005.
-
19. Orihara N. Study on evaluation of green landscape--thoughts on green evaluation method of good landscape formation. Invest Res Periodical. 2006.
-
20. Xu L, Meng R, Huang S, Chen Z. Healing oriented street design: experimental explorations via virtual reality. Urban Plann Int. 2019;34(01):38-45.[DOI]
-
21. Vemulapalli R, Tuzel O, Liu MY, Chellapa R. Gaussian conditional random field network for semantic segmentation. In: 2016 IEEE Conference on Computer Vision and Pattern Recognition (CVPR); 2016 Jun 27-30; Las Vegas, USA. Piscataway: IEEE; 2016. p. 3224-3233.[DOI]
-
22. Khaldoun R, Huang C, Zhan X. Monitoring key forest structure attributes across the conterminous United States by integrating GEDI LiDAR measurements and VIIRS data. Remote Sens. 2021;13(3):442.[DOI]
-
23. Wu Q, Zhong R, Dong P, Mo Y, Jin Y. Airborne LiDAR intensity correction based on a new method for incidence angle correction for improving land-cover classification. Remote Sens. 2021;13(3):511.[DOI]
-
24. Bhattacharjee J, Marttila H, Haghighi AT, Saarimaa M, Tolvanen A, Lepistö A, et al. Development of aerial photos and LIDAR data approaches to map spatial and temporal evolution of ditch networks in peat-dominated catchments. J Irrig Drain Eng. 2021;147(4):0001547.[DOI]
-
25. Komiya Y, Susaki J. Calculating the Greening Coverage Rate in Urban Areas Using Aircraft. J Jpn Soc Civil Eng. 2015;71(1):1-9.[DOI]
-
26. Bresenham JE. Algorithm for computer control of a digital plotter. IBM Syst J. 1965;4(1):25-30.[DOI]
-
27. Bresenham J. A linear algorithm for incremental digital display of circular arcs. Commun ACM. 1977;20(2):100-106.[DOI]
-
28. Ratti C. Urban analysis for environmental prediction. 2001.
-
29. Zhang Y, Garcia S, Xu W, Shao T, Yang Y. Efficient voxelization using projected optimal scanline. Graph Models. 2018;100:61-70.[DOI]
-
30. Chen Q, Liu G, Li X, Zhang Z, Li Y. A corner-point-grid-based voxelization method for the complex geological structure model with folds. J Vis. 2017;20(4):875-888.[DOI]
-
31. Namane R, Miguet S, Oulebsir FB. A fast voxelization algorithm for trilinearly interpolated isosurfaces. Vis Comput. 2018;34(1):5-20.[DOI]
-
32. Faieghi M, Tutunea-Fatan OR, Eagleson R. Fast and cross-vendor OpenCL-based implementation for voxelization of triangular mesh models. Comput Aided Des Appl. 2018;15(6):852-862.[DOI]
-
33. Wang HL, Guo RF, Wang P, Liu X. Voxelization of STL model based on dual-level octree. Comput Integr Manuf Syst. 2014;20(07):1553-1560.[DOI]
-
34. Yang PJ, Putra SY, Li W. Viewsphere: A GIS-Based 3D Visibility Analysis for Urban Design Evaluation. Environ Plan B. 2007;34(6):971-992.[DOI]
Copyright
© The Author(s) 2023. This is an Open Access article licensed under a Creative Commons Attribution 4.0 International License (https://creativecommons.org/licenses/by/4.0/), which permits unrestricted use, sharing, adaptation, distribution and reproduction in any medium or format, for any purpose, even commercially, as long as you give appropriate credit to the original author(s) and the source, provide a link to the Creative Commons license, and indicate if changes were made.
Publisher’s Note
Share And Cite

