DNA methylation landscapes in human cells and their chromatin determinants
Wei Cui
#

,
Zhijun Huang
#
,
Gerd P. Pfeifer
*
*Correspondence to:
Gerd P. Pfeifer, Department of Epigenetics, Van Andel Institute, Grand Rapids, MI 49503, USA.
E-mail: gerd.pfeifer@vai.org
Ageing Cancer Res Treat. 2026;3:202513. 10.70401/acrt.2025.0007
Received: September 30, 2025Accepted: December 11, 2025Published: December 18, 2025
Abstract
Background: DNA methylation patterns are established during development and are propagated in a cell type specific manner, but these patterns may become aberrant during aging and cancer. Regions of alternating high and moderate to low levels of DNA methylation exist along all chromosomes in human cells. It is unclear how these distinct DNA methylation blocks are established. Most of the prior work in this area has been performed with mouse embryonic stem cells.
Methods: Using whole genome bisulfite sequencing and chromatin-immunoprecipitation sequencing, we have profiled DNA methylation at single base resolution and various histone modifications in human bronchial epithelial cells.
Results: We found that many regions of lower DNA methylation (< 50%) are characterized by presence of the Polycomb repressive complex 2 (PRC2) mark, histone H3K27 trimethylation, but less so by the PRC1 mark histone H2AK119 monoubiquitylation. These same PRC2-marked regions also showed a depletion of histone H3K36 di- and tri-methylation.
Conclusion: Since H3K36me2 and H3K36me3 are recognized by the reader domains of the DNA methyltransferases DNMT3A and DNMT3B, and H3K36 methylation is a block to the PRC2 methyltransferases, these two types of crosstalk may explain the stable maintenance and antagonism between H3K27me3 and broad DNA methylation domains. However, methylated CpG islands are depleted of H3K36me2 and show a different relationship between DNA methylation and H3K36me2 deposition compared to non-CpG island regions. The data give insight into how DNA methylation patterns are established in human cells. We discuss these findings and their potential relevance for altered DNA methylation patterns seen in aging tissues and in cancer cells.
Keywords
DNA methylation, Polycomb, histone H3K27 methylation, histone H2AK119 ubiquitination, histone H3K36 methylation
1. Introduction
Somatic cells and tissues of mammalian organisms, with few exceptions, contain the same genome in terms of DNA sequence. Yet, there are hundreds of phenotypically different cell types, which raises the question of how such diversity can arise independently of the primary DNA sequence. In each cell, DNA is packaged into chromatin, a structure that consists of DNA wrapped around nucleosome core particles, which are further modified by a series of post-translational histone modifications. The DNA itself also is modified and carries methyl groups or hydroxymethyl groups, chiefly at CpG (CG) DNA sequences, where the position 5 of the cytosine ring is modified. Collectively, the assembly of modified DNA and histones, along with the three-dimensional packaging of chromosomes into defined territories, compartments, and topologically associated domains, is referred to as the epigenome. The epigenome is inherently plastic, allowing for changes during development and differentiation. Cell type identity is determined by different sets of epigenomes between each cell type. The most important readout of a specific epigenome is the establishment of cell type specific gene expression patterns.
Active genes generally carry a distinct set of defining epigenomic marks. They include an unmethylated, often GC-rich promoter, referred to as a CpG island[1]. At the chromatin level, active promoters are characterized by histone H3 lysine 4 (H3K4) methylation, with H3K4 trimethylation (H3K4me3) being a typical promoter mark[2], and histone acetylation, for example, H3K27 acetylation. Downstream of transcription start sites, along the gene body, we find other specific marks, DNA CpG hypermethylation, H3K36 trimethylation (H3K36me3), and H3K79 trimethylation[3,4].
Genomic regions that lack active genes are often associated with repressive histone marks. They have much lower levels of histone acetylation and carry the mark H3K9 trimethylation[5]. Such regions are referred to as constitutive heterochromatin and are often found in nuclear lamina associated domains (LADs)[6,7]. Some genes are repressed by a more flexible system known as facultative heterochromatin[8]. This means that these regions may be active during specific phases of development or in specific cell types but are otherwise repressed. A typical component of facultative heterochromatin is the Polycomb system. It consists of two
With the common use of genomic mapping techniques beginning about two decades ago[14-16], much knowledge has been assembled about the specific features of histone modifications and DNA methylation patterns in many different cell types. Through numerous uncoordinated and coordinated (e.g., by ENCODE) efforts, the epigenome of commonly used cell types and mammalian tissues has been mapped comprehensively. Of great interest has always been the question if the epigenome is aberrant during the initiation of human diseases or during the aging process. For example, how would an altered epigenome that is found in one cell type promote a tissue-specific disease, and why would this alteration be tissue-specific? Through the work of countless laboratories, we now know that cancer cells are characterized by widespread epigenomic alterations. This field was initiated over four decades ago when it was reported that cancer cells from animals or humans have altered DNA methylation patterns, either genome-wide[17,18] or at specific gene loci[19]. The methylation changes include genome-scale DNA hypomethylation, which affects many parts of the genome in different cancer types[20], as well as more localized DNA hypermethylation events, which target mostly CpG islands[21,22]. In some cases, methylation of promoter-based CpG islands may silence critical genes, for instance, tumor suppressor genes or genes essential for maintaining the differentiated state of a somatic cell[23-26]. Although studied less widely and less systematically, alterations in chromatin structure are also found in tumors. Most notably, mutations in many cancer types are observed in genes that encode enzymes of the epigenetic machinery, for example, histone methyltransferases and acetyltransferases, components of Polycomb complexes, and chromatin remodeling factors[27,28].
In addition to cancer and a few other diseases, the aging process also leads to a disruption of epigenomic patterns. This has most widely (in fact, almost exclusively) been studied for DNA methylation. Similar to what happens in cancer, aging leads to a slow general loss of DNA methylation and, at the same time, to an encroachment of DNA methylation into CpG islands[29-31]. Often, related groups of genes are affected in cancer and aging. Most notably, CpG islands targeted by the Polycomb complexes, such as developmental transcription factor genes, are methylated during carcinogenic processes[16,32-34], but also during the aging process[35,36] and during inflammation[37], a condition that may predispose to cancer and aging. Since the discovery of an active DNA demethylation process about 15 years ago[38], it has now become clear that the establishment, maintenance, and erosion of DNA methylation patterns are much more dynamic and complicated than previously thought. DNA methylation is established by DNA methyltransferases that methylate CpG sequences[39]. The active enzymes include the maintenance methyltransferase DNMT1 and the de novo methyltransferases DNMT3A and DNMT3B, which methylate previously unmethylated sites preferentially. The DNA demethylation process is initiated by oxidation of the methyl group of 5-methylcytosine by the Ten-Eleven-Translocation (TET) enzymes, TET1, TET2, and TET3[38]. The demethylation process is often defective in human cancer, either by mutation of TET2 or by defects in TET
However, what remains largely unclear to date is how these epigenomic patterns are established mechanistically in normal cells during development and how these patterns become aberrant in cancer. The extent of crosstalk between different epigenomic states and modification patterns along the genome is only partially understood. Most of the prior work has been done with mouse cells, preferentially mouse embryonic stem cells. One study analyzed the Polycomb-DNA methylation crosstalk in human cells[41]. However, it did not include data on H3K36 methylation. Another paper showed a correlation between highly methylated domains and H3K36me2, but it did not analyze H3K27me3[42]. In our own previous work, we reported that dysfunction of the Polycomb protein RYBP, which is a critical component of PRC1 complexes, along with loss of TET proteins, leads to widespread hypermethylation of thousands of CpG islands in human bronchial epithelial cells[43]. In that publication, we focused on CpG islands. From this published work[43] and from additional chromatin modification mapping experiments, we have now obtained a detailed picture of how the different epigenomic parameters of DNA and histone modification overlap or antagonize each other. Here, we provide a
2. Materials and Methods
2.1 Cell culture
Human bronchial epithelial cells (HBEC-3KT, CRL-4051; RRID: CVCL_X491)[44] were obtained from ATCC. Cell lines were authenticated by ATCC by short tandem repeat profiling. The cells were cultured in keratinocyte serum-free medium (K-SFM; Thermo, 17005042) containing 50 µg/ml bovine pituitary extract and 5 ng/ml human recombinant epidermal growth factor and were incubated at 37 °C with 5% CO2. The media were changed every 3 to 4 days.
2.2 DNA methylation analysis
Genome-wide DNA methylation patterns at single base resolution were determined by whole genome bisulfite sequencing (WGBS). The analysis pipeline for WGBS and the data obtained have been published previously[43,45,46]. The correlation analysis between DNA methylation and histone modifications based on the genome-wide signal of 50 kb bins was calculated by Pearson’s coefficients using R (v4.1.2).
2.3 ChIP-seq
ChIP-seq was performed as previously described[43]. H2AK119ub1 (CST, 8240), H3K27me3 (CST, 9733), H3K36me2 (CST, 2901S), and H3K36me3 (Abcam, ab9050) antibodies were used for immunoprecipitation. Briefly, cells were cross-linked with 1% formaldehyde for 10 min at room temperature, and the reaction was quenched with glycine. Cross-linked cells were lysed in lysis buffer and incubated on ice for another 10 min. The washed cell pellets were resuspended in shearing buffer and sonicated to shear the DNA into 300 to 500 bp long fragments. An optimal amount of chromatin, antibodies, and protein-G bead complexes was incubated overnight on a rotator at 4 °C. Purified DNA was quantified for library preparation with the Qubit sensitivity dsDNA HS Kit. Libraries were prepared using the TruSeq ChIP Sample Preparation Kit (Illumina, IP202–1012, IP-202–1024) according to the manufacturer’s instructions. The libraries were pooled and sequenced with an Illumina NextSeq500 or NovaSeq6000 instrument. A 5% spike-in of PhiX DNA was added to the runs to increase diversity and for quality control purposes. Each library had at least 50 million reads. Three replicates were generated in this study. The triplicates for each mapping experiment were highly correlated (Figure S1).
2.4 ChIP-seq data analysis
ChIP-seq data analysis was performed as previously described[43,45]. Briefly, the adapter and low-quality sequences were trimmed with Trimgalore (v 0.4.0) with default parameters, then the trimmed reads were mapped to the human genome hg19 with Bowtie2 (v 2.3.5). The deduplicated reads were used for peak calling by HOMER (v 4.10). Density plots of ChIP-seq enrichment at peak center regions were made with the R package genomation (version 1.28.0). For all overlap analysis of ChIP peaks, we used the bedtools intersection function, as well as for all other region overlap analysis in this study. Since regions enriched for a specific chromatin mark always alternate with unenriched regions (regions with no peaks) along the genome, their total numbers used in the analysis were almost identical. Pearson’s correlation coefficients between samples and groups were calculated using deepTools plotCorrelations, based on the genome-wide signal of 10 kb bins (Figure S1). Statistical testing (t-test) was used to compare the means of two groups and was performed using R (v4.1.2).
3. Results
3.1 DNA methylation is segregated into highly methylated and partially methylated regions along the genome
DNA methylation was analyzed at single base resolution by the WGBS method as described previously[43,45]. Triplicate samples of bronchial epithelial cell clones of the telomerase- and CDK4-immortalized cell line HBEC3 were used. Broader genomic regions at the scale of one to several megabases were inspected, as shown in Figure 1 for several chromosomal segments. Most genomic regions can be subdivided into segments of high DNA methylation (more than 75% methylation at most CpG sites) and intermediate or partial methylation (30-50% methylation). Using genome-wide analysis of genic and intergenic regions, we observed the highest DNA methylation levels in genic regions, also referred to as gene bodies (Figure 2A). This is consistent with prior work in other cell
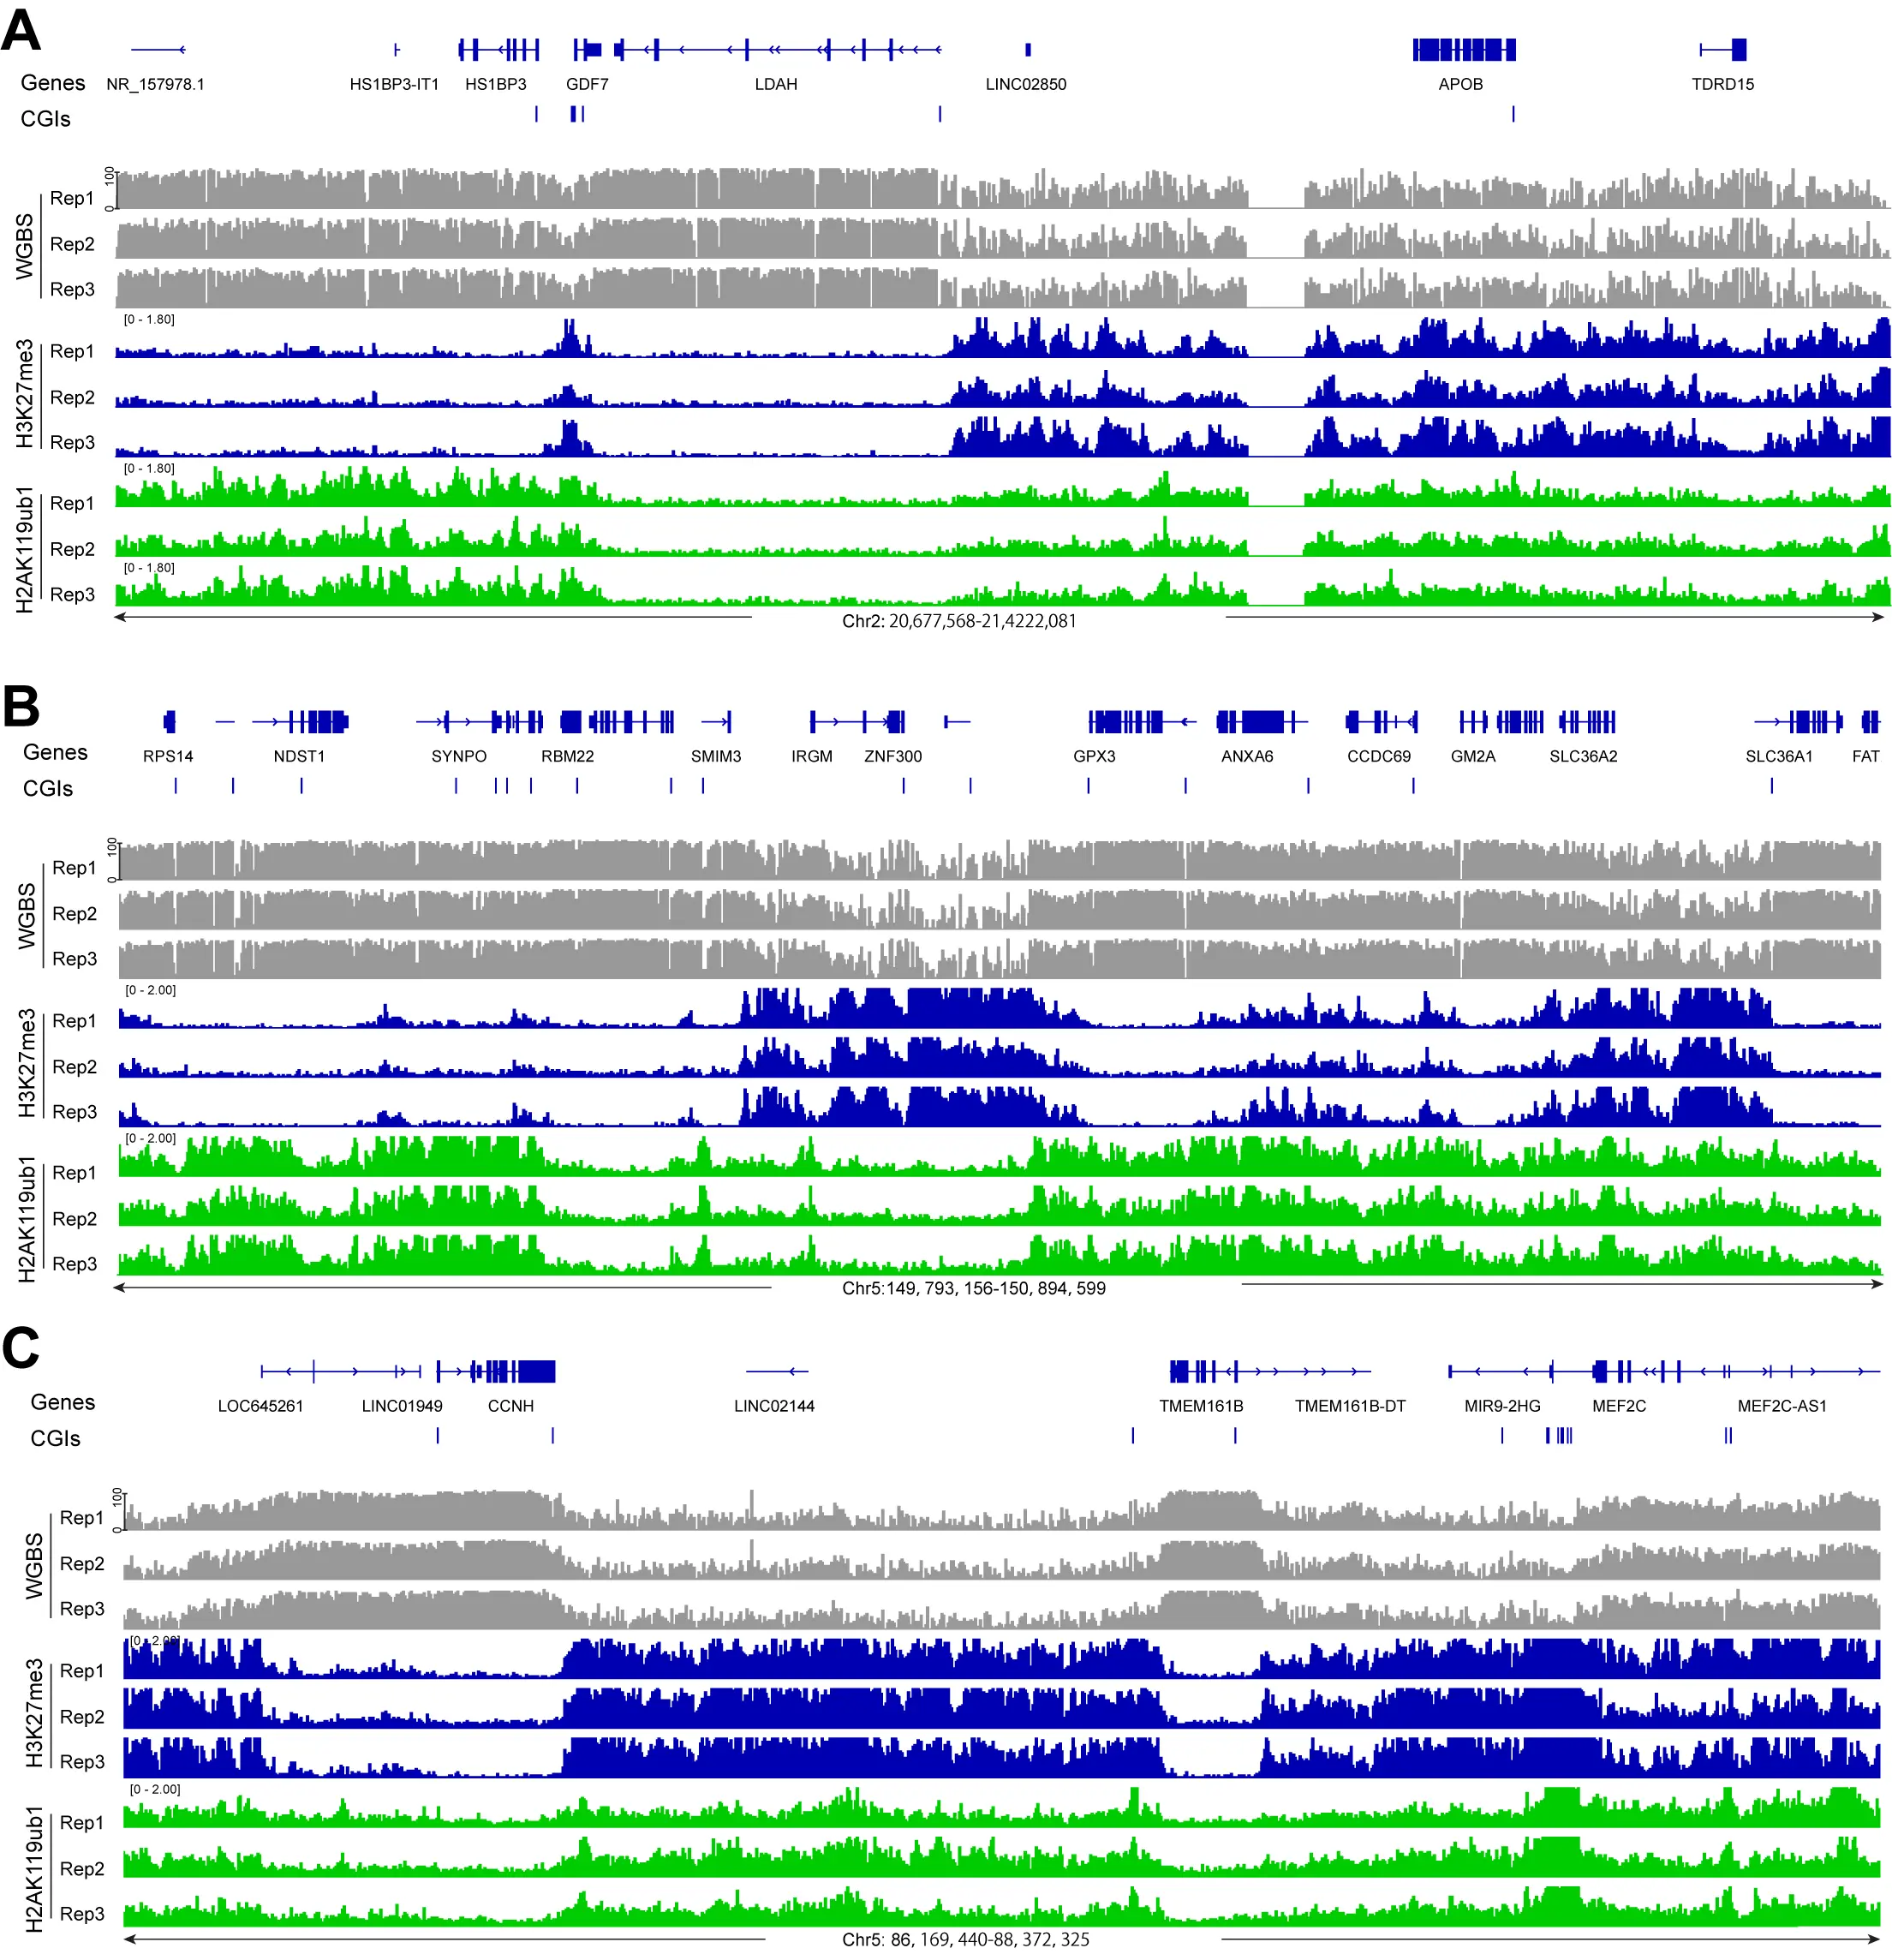
Figure 1. Display of DNA methylation at PRC1- and PRC2-marked regions. (A) DNA methylation (grey), H3K27me3 ChIP-seq (blue), and H2AK119ub1 (green) ChIP-seq tracks are shown for a representative region of chromosome 2. Hg19 coordinates are shown along with the CpG island regions (blue bars); (B) DNA methylation, H3K27me3
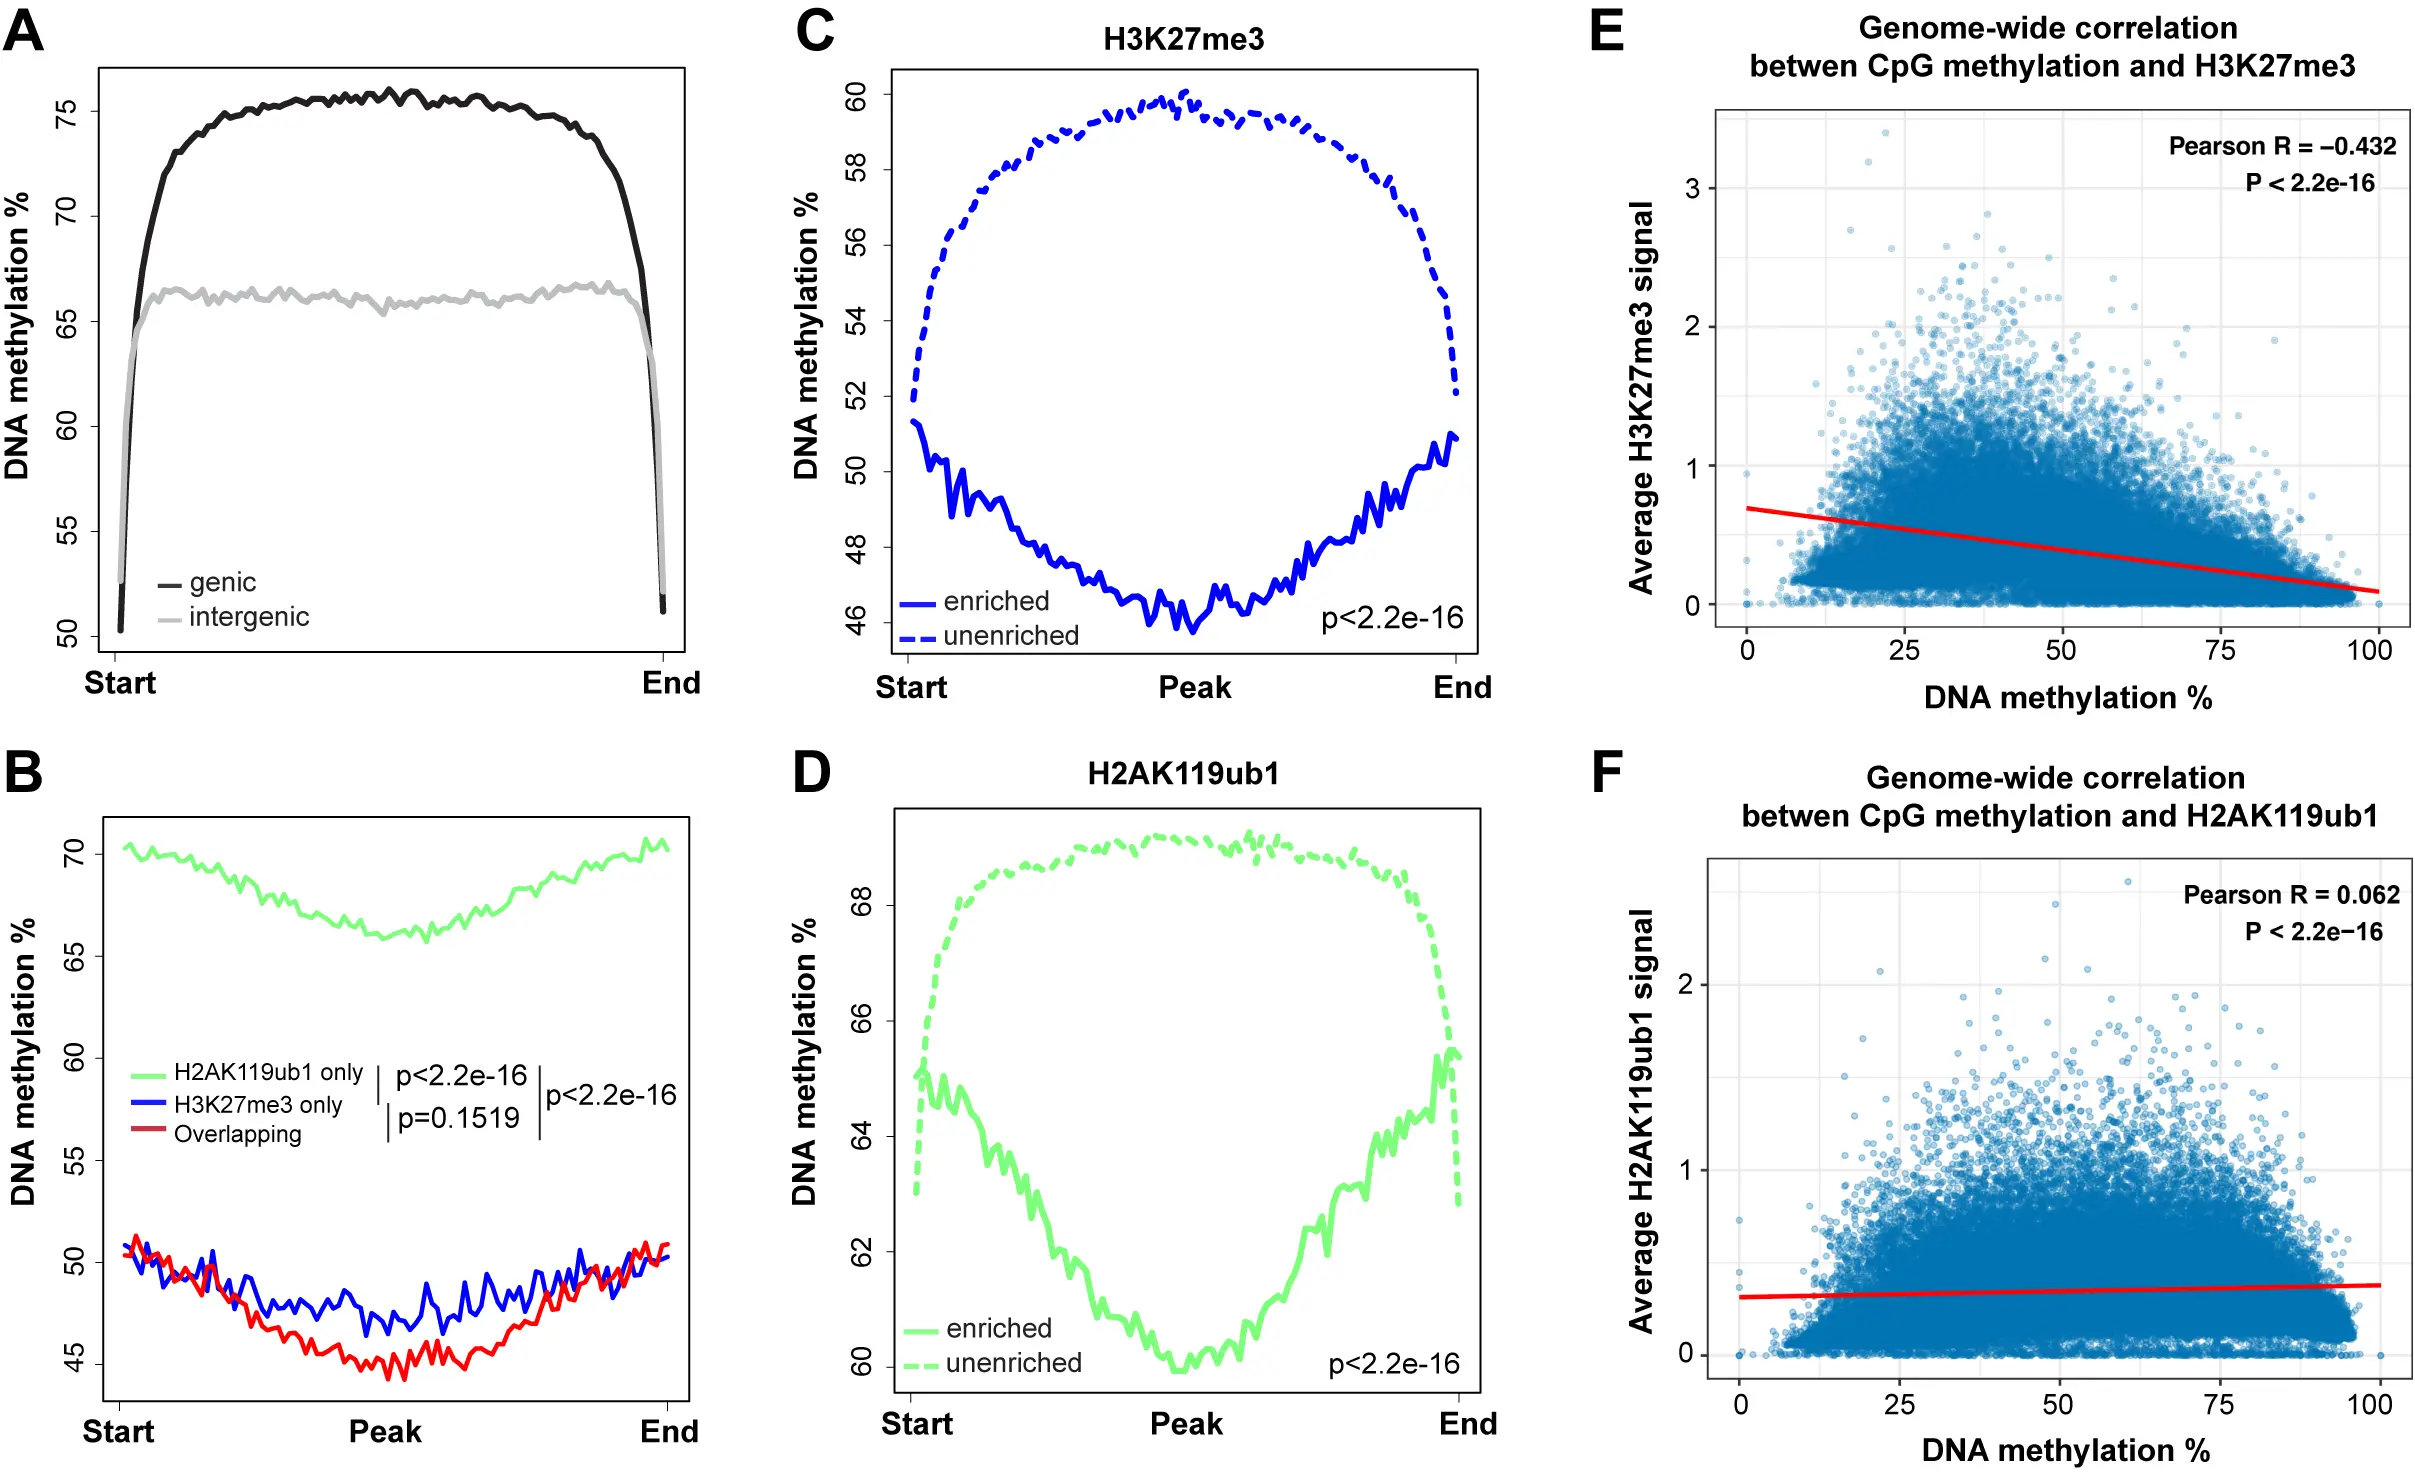
Figure 2. The profile of DNA methylation at PRC1- and PRC2-targeted regions. (A) Meta-signal plots of DNA methylation at genic and intergenic regions. A total of 23,055 genic regions and 18,430 intergenic regions were binned to 100 windows, respectively, then the average methylation level of each window was calculated; (B) Meta-signal plots of DNA methylation at H2AK119ub1-only, H3K27me3-only, and at H2AK119ub1 and H3K27me3 overlapping regions. A total of 27,914 H3K27me3-only enriched regions, 39,686 H2AK119ub1-only enriched regions and 21,386 overlapping regions were binned to 100 windows, respectively, then the average methylation level of each window was calculated; (C) Meta-signal plots of DNA methylation at all H3K27me3-enriched and unenriched regions. A total of 45,121 H3K27me3-enriched regions and 45,119 unenriched regions were binned to 100 windows, respectively, then the average methylation level of each window was calculated; (D) Meta-signal plots of DNA methylation at all H2AK119ub1-enriched and unenriched regions. A total of 58,777 H2AK119ub1-enriched regions and 58,775 unenriched regions were binned to 100 windows, respectively, then the average methylation level of each window was calculated; (E) Correlation coefficients between DNA methylation level at all CpGs and H3K27me3 enrichment signal across the entire genome. The genome was binned into 50 kb regions. The DNA methylation and H3K27me3 levels were calculated for each bin; (F) Correlation coefficients between DNA methylation level at all CpGs and H2AK119ub1 enrichment signal across the entire genome. The genome was binned into 50 kb regions. The DNA methylation and H2AK119ub1 levels were calculated for each bin. PRC1: Polycomb repressive complex 1; PRC2: Polycomb repressive complex 2.
We also find that many of the 30 to 50% methylated domains fall into gene-poor areas of the genome. Genome segments that are depleted of active genes tend to be associated with the nuclear lamina[51]. Although we lack data on LADs in this bronchial cell line, constitutive LADs are often common between different human cell types. The reason why LADs have lower DNA methylation levels has been debated. Suggestions include late DNA replication of these domains allowing less time for DNA methyltransferases to complete their reactions before mitosis[52], a sequence preference for DNMTs that disfavors A/T-CG-A/T DNA sequences[53], and as we proposed recently, a limited access of DNMT enzymes to regions attached to the nuclear lamina[45]. Despite the clear segregation of the DNA methylation patterns into highly methylated (> 75%) and partially methylated (30-50%) domains, it has remained unknown how these patterns are established and maintained along the genome.
3.2 Lower DNA methylation is best correlated with the PRC2 mark, H3K27me3
In parallel with DNA methylation, we mapped the distribution of various histone marks in the same cell clones. We focused here on the Polycomb marks H3K27me3, installed by the EZH1/2 histone methyltransferases of the PRC2 complex, and on H2AK119ub1, installed by the PRC1 complex. As can be seen in Figure 1 and several subsequent figures, the presence of regions strongly enriched in H3K27me3 generally coincides with regions of lower DNA methylation. When we compared DNA methylation levels over regions covered by H3K27me3, H2AK119ub1 or regions containing both Polycomb marks, we observed that DNA methylation levels are higher at H2AK119ub1 marked regions (65-70%) but much lower at genomic segments marked by H3K27me3 or by both marks (45-50%)
A genome-wide scatter plot analysis shows that DNA methylation levels are inversely correlated with H3K27me3 levels but show little overall correlation with the level of the PRC1 mark H2AK119Ub1 (Figure 2E,F).
3.3 H3K27me3 is reverse to H3K36me2 and H3K36me3
Next, we determined the genomic distribution of the H3K36me2 and H3K36me3 histone modifications (Figure 3). These marks are established by the NSD family of histone methyltransferases, NSD1, NSD2, and NSD3[54]. H3K36me3, produced by SETD2, is a mark preferentially found in gene bodies, where it likely accumulates in conjunction with RNA polymerase II progression[55]. It is thought that H3K36me3 promotes gene activity by suppressing intragenic initiation and antisense transcription. Genomic profile plots in Figure 3A show that H3K36me3 is indeed accumulating in gene bodies genome-wide, as opposed to intergenic regions. In contrast, H3K36me2 is more broadly distributed and is found along genes and in non-genic regions (Figure 3A). In Figure 3B, we establish the profiles of the Polycomb marks H3K27me3 and H2AK119ub1 along genic and intergenic regions. Genome-wide, the H2AK119 ubiquitin mark occurs in genes and in non-genic regions, but H3K27me3 is more abundant in intergenic segments compared to genes
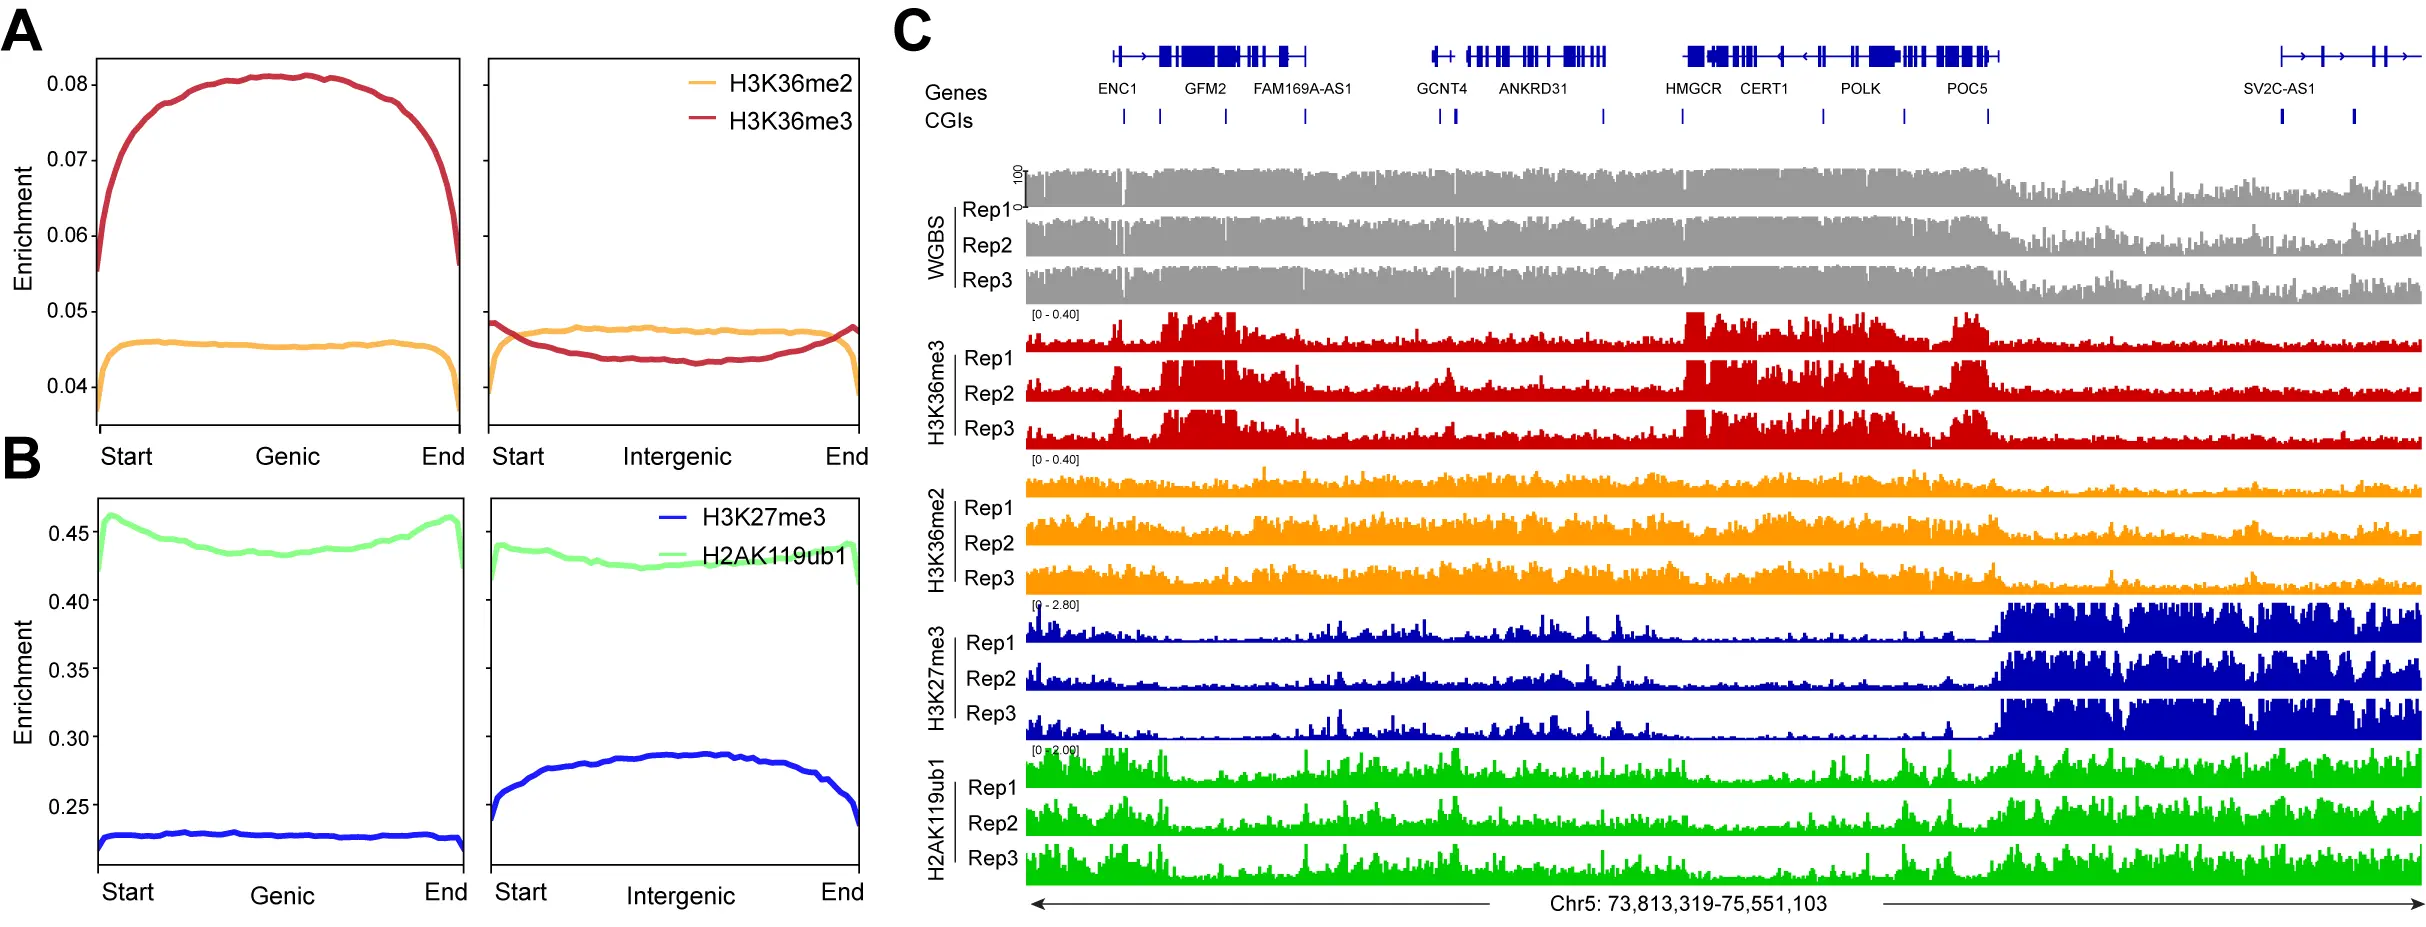
Figure 3. The enrichment of H3K36me2, H3K36me3 and the Polycomb marks at genic and intergenic regions. (A) Meta-signal plots of H3K36me2 and H3K36me3 enrichment at genic and intergenic regions in HBEC3 cells. A total of 23,055 genic regions and 18,430 intergenic regions were binned into 60 windows, respectively, then the CPM value of H3K36me2 and H3K36me3 of each window was calculated; (B) Meta-signal plots of H3K27me3 and H2AK119ub1 enrichment at genic and intergenic regions in HBEC3 cells. A total of 23,055 genic regions and 18,430 intergenic regions were binned into 60 windows, respectively, then the CPM value of H3K27me3 and H2AK119ub1 of each window was calculated; (C) DNA methylation (gray), H3K36me3 ChIP-seq (red), H3K36me2 ChIP-seq (orange), H3K27me3 ChIP-seq (blue), H2AK119ub1 ChIP-seq (green) tracks are shown for a representative region on chromosome 5. CPM: counts per million; H3K36me3: H3K36 trimethylation.
We next investigated the crosstalk between the Polycomb marks and the H3K36 methylation system (Figure 4, Figure 5). It is easily visible that regions with high levels of H3K36me3 have extremely low levels of H3K27me3 or H2AK119ub1 (Figure 4A). When there are regions of H3K36me2, the Polycomb marks are also reduced. Conversely, genomic areas that are strongly marked by H3K27me3 and H2AK119ub1 show low levels of the H3K36 modifications. Figure 4B,C show a correlation profile analysis. At the genome-wide level, regions bound by the Polycomb marks show lower levels of H3K36me3 (Figure 4B) and H3K36me2 (Figure 4C). Figure 5 shows additional examples of this relationship. Profile plots of H2AK119ub1 show some enrichment for H3K36me3 (Figure 5A) and H3K36me2 (Figure 5B). However, when H3K27me3 is present alone or when it is overlapping with H2AK119ub1, the enrichment of the H3K36 modifications is much lower.
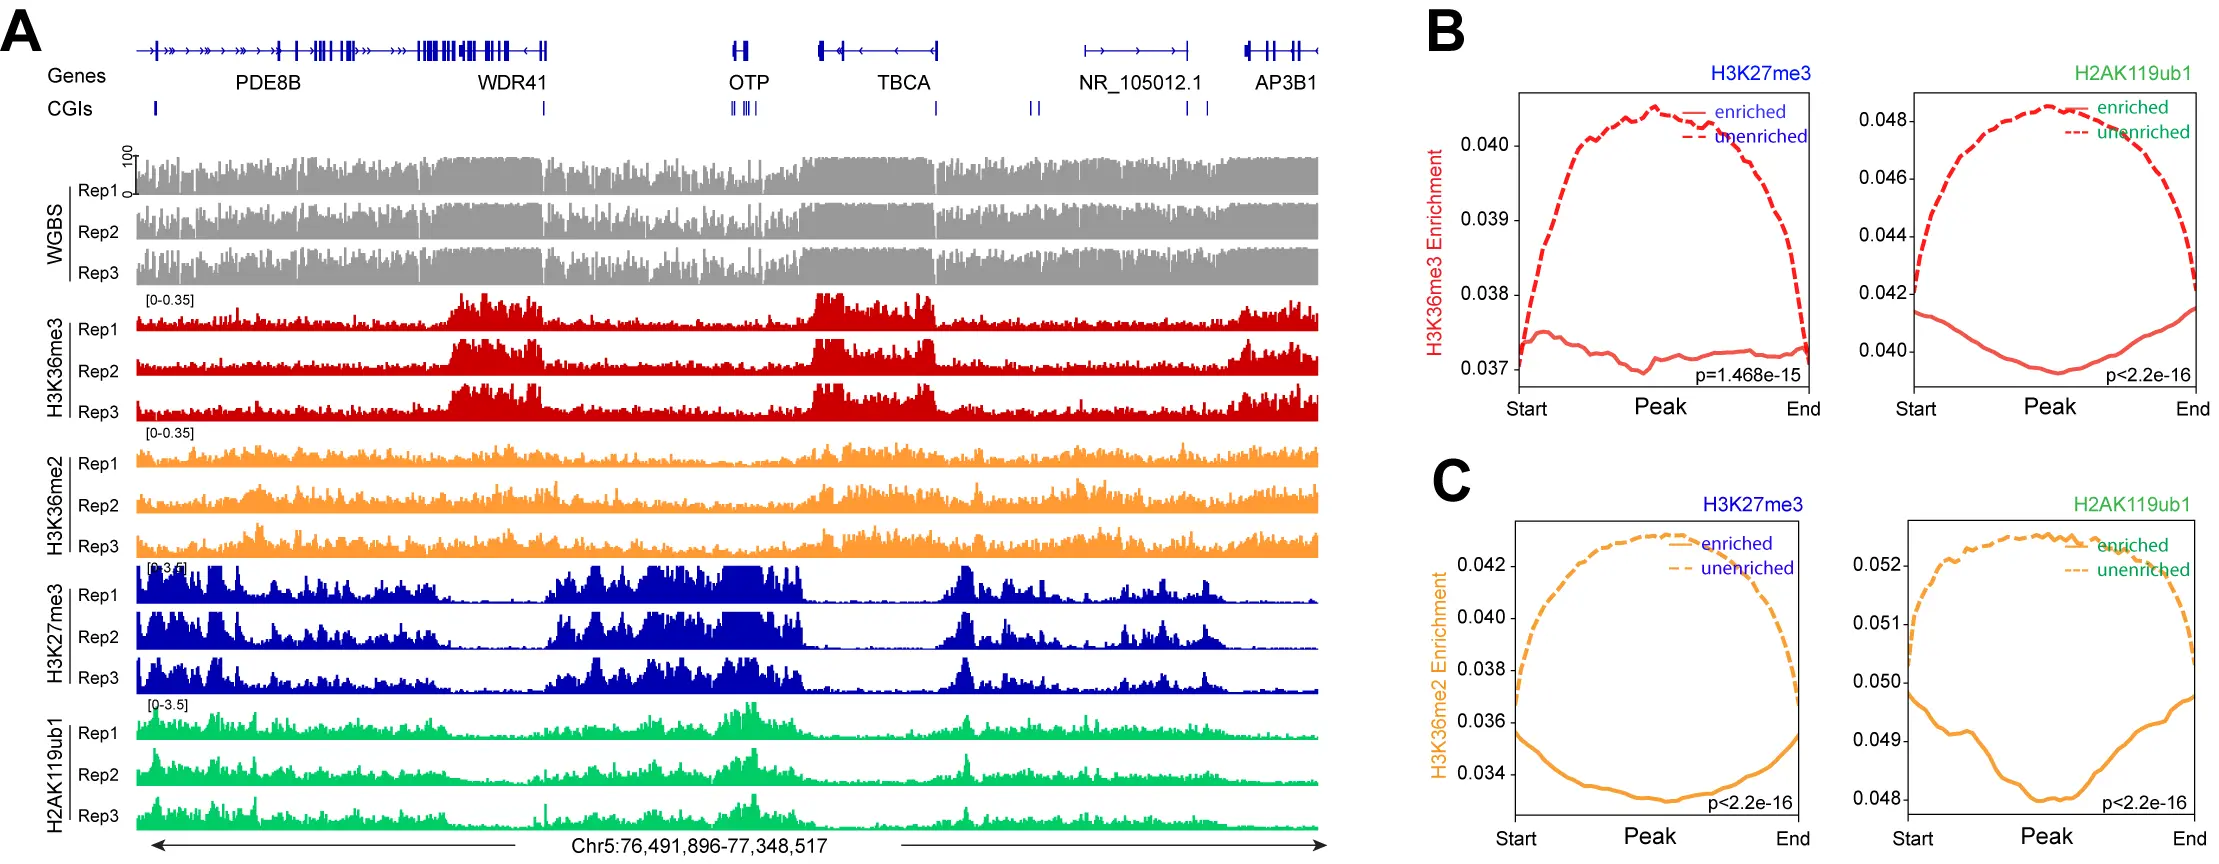
Figure 4. H3K36me2, H3K36me3 and Polycomb marks show reverse occupancy. (A) DNA methylation, H3K36me3 ChIP-seq, H3K36me2 ChIP-seq, H3K27me3 ChIP-seq, and H2AK119ub1 ChIP-seq tracks are shown for a representative region on chromosome 5; (B) Meta-signal plots showing ChIP-seq signal for H3K36me3 at PRC-targeted and
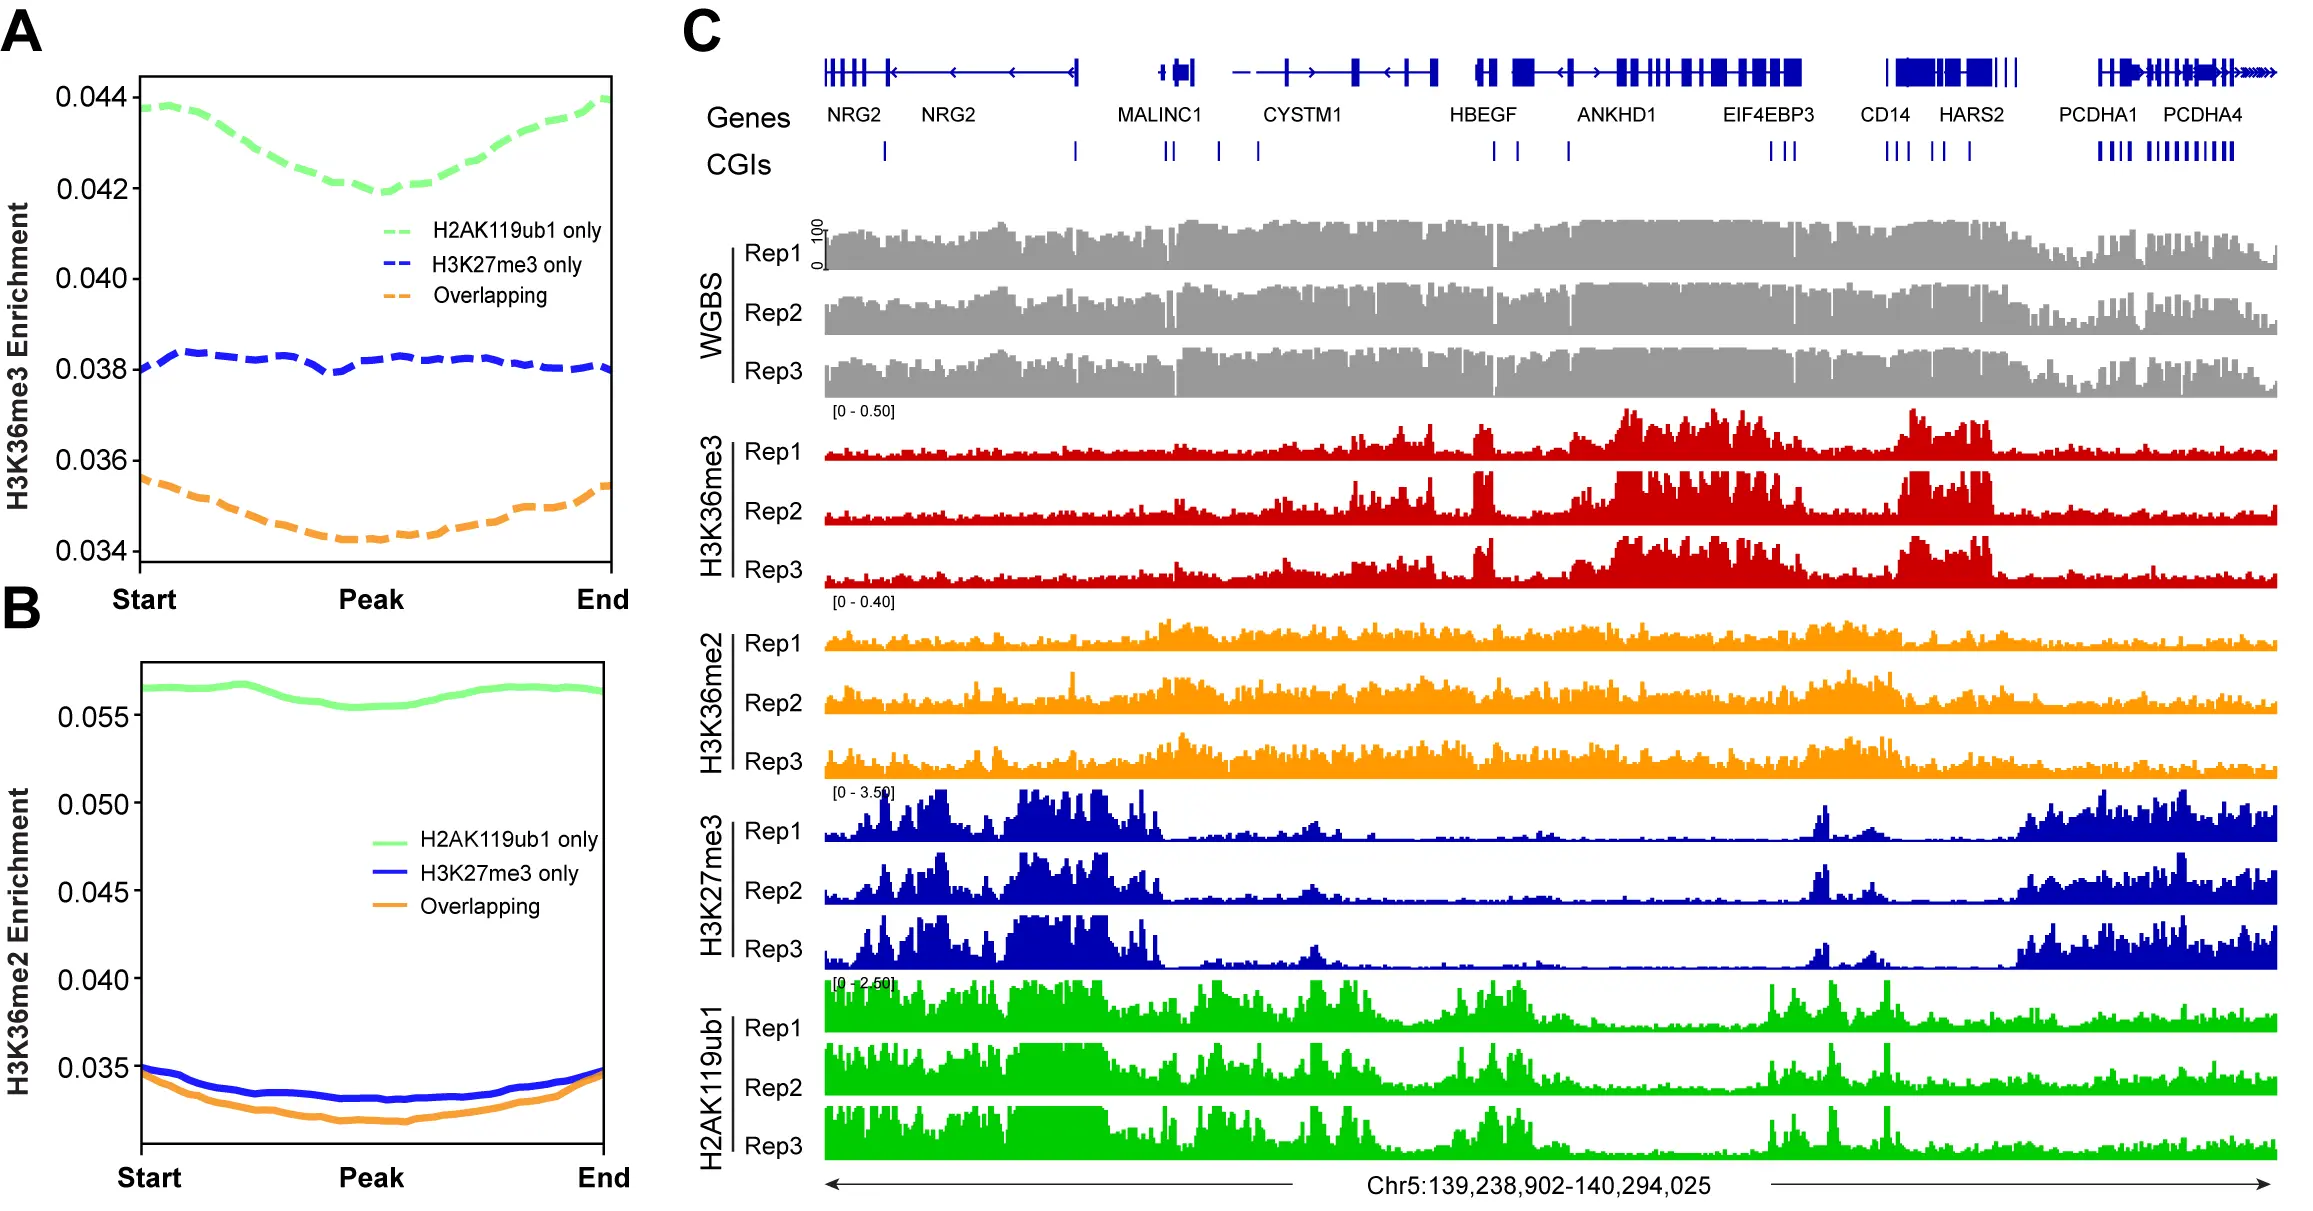
Figure 5. The profile of H3K36me2 and H3K36me3 at all PRC1- and PRC2-marked regions. (A) Meta-signal plots showing ChIP-seq signals for H3K36me3 at
3.4 High DNA methylation levels are linked to H3K36me2 genome-wide
When we integrated the distribution of DNA methylation versus the different histone modification profiles, we found that high DNA methylation levels (78 to 90%) best correlated with H3K36me3 levels, and then also correlated with H3K36me2, the latter not being limited to gene bodies but more broadly distributed (Figure 3C, Figure 5C, Figure 6).
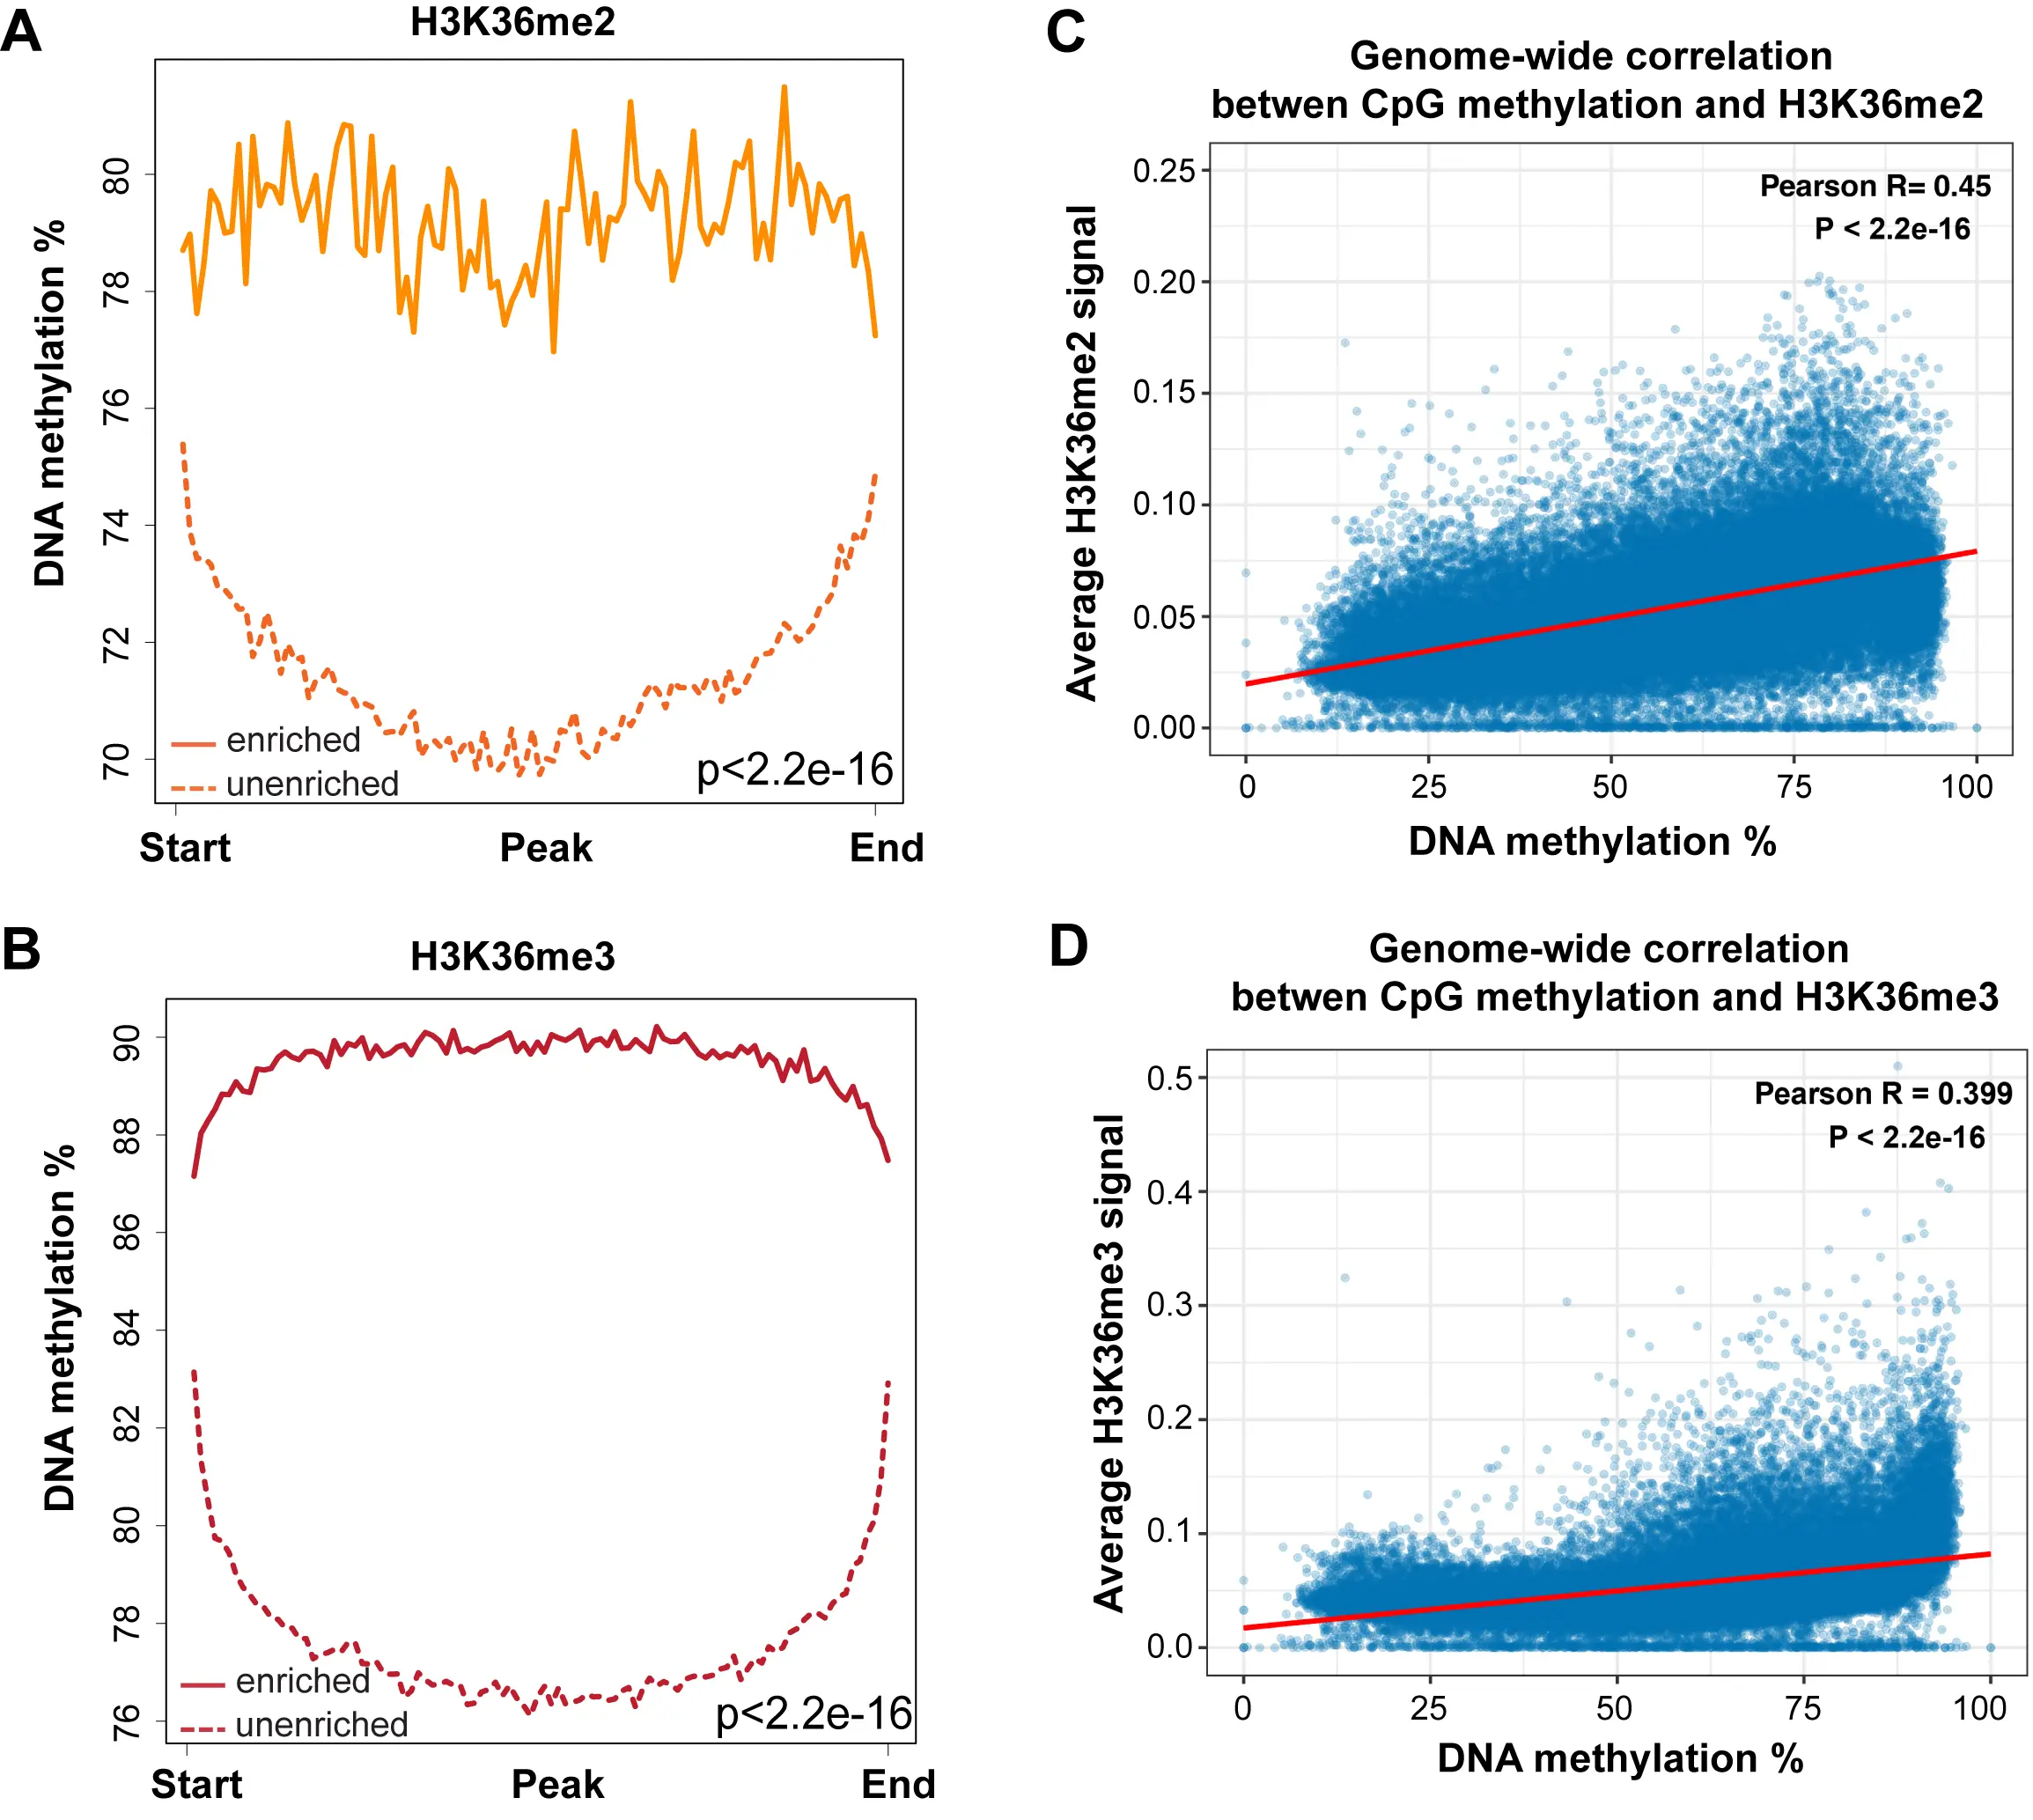
Figure 6. DNA methylation at H3K36me2- and H3K36me3-marked regions. (A) DNA methylation is high at genomic regions enriched for H3K36me2. A total of 15,751 H3K36me2-enriched regions and 15,752 unenriched regions were binned into 100 windows, respectively, then the average methylation level of each window was calculated; (B) DNA methylation is highest at genomic regions enriched for H3K36me3. A total of 48,803 H3K36me3-enriched regions and 48,804 unenriched regions were binned into 100 windows, respectively, then the average methylation level of each window was calculated; (C) Correlation coefficients between DNA methylation level at all CpGs and H3K36me2 enrichment signal across the genome. The whole genome was binned into 50 kb regions. The DNA methylation and H3K36me2 levels were calculated for each bin; (D) Correlation coefficients between DNA methylation level at all CpGs and H3K36me3 enrichment signal across the genome. The whole genome was binned into 50 kb regions. The DNA methylation and H3K36me3 levels were calculated for each bin. H3K36me3: H3K36 trimethylation.
A genome-wide scatter plot analysis shows that DNA methylation levels are positively correlated with H3K36me2 and H3K36me3 levels (Figure 6C,D).
3.5 DNA methylation at CpG islands
In the last part of our analysis, we focused on CpG islands, CpG-rich genomic regions, commonly found at promoters that are often unmethylated when the gene is active. Indeed, most CpG islands of the genome have relatively low DNA methylation levels
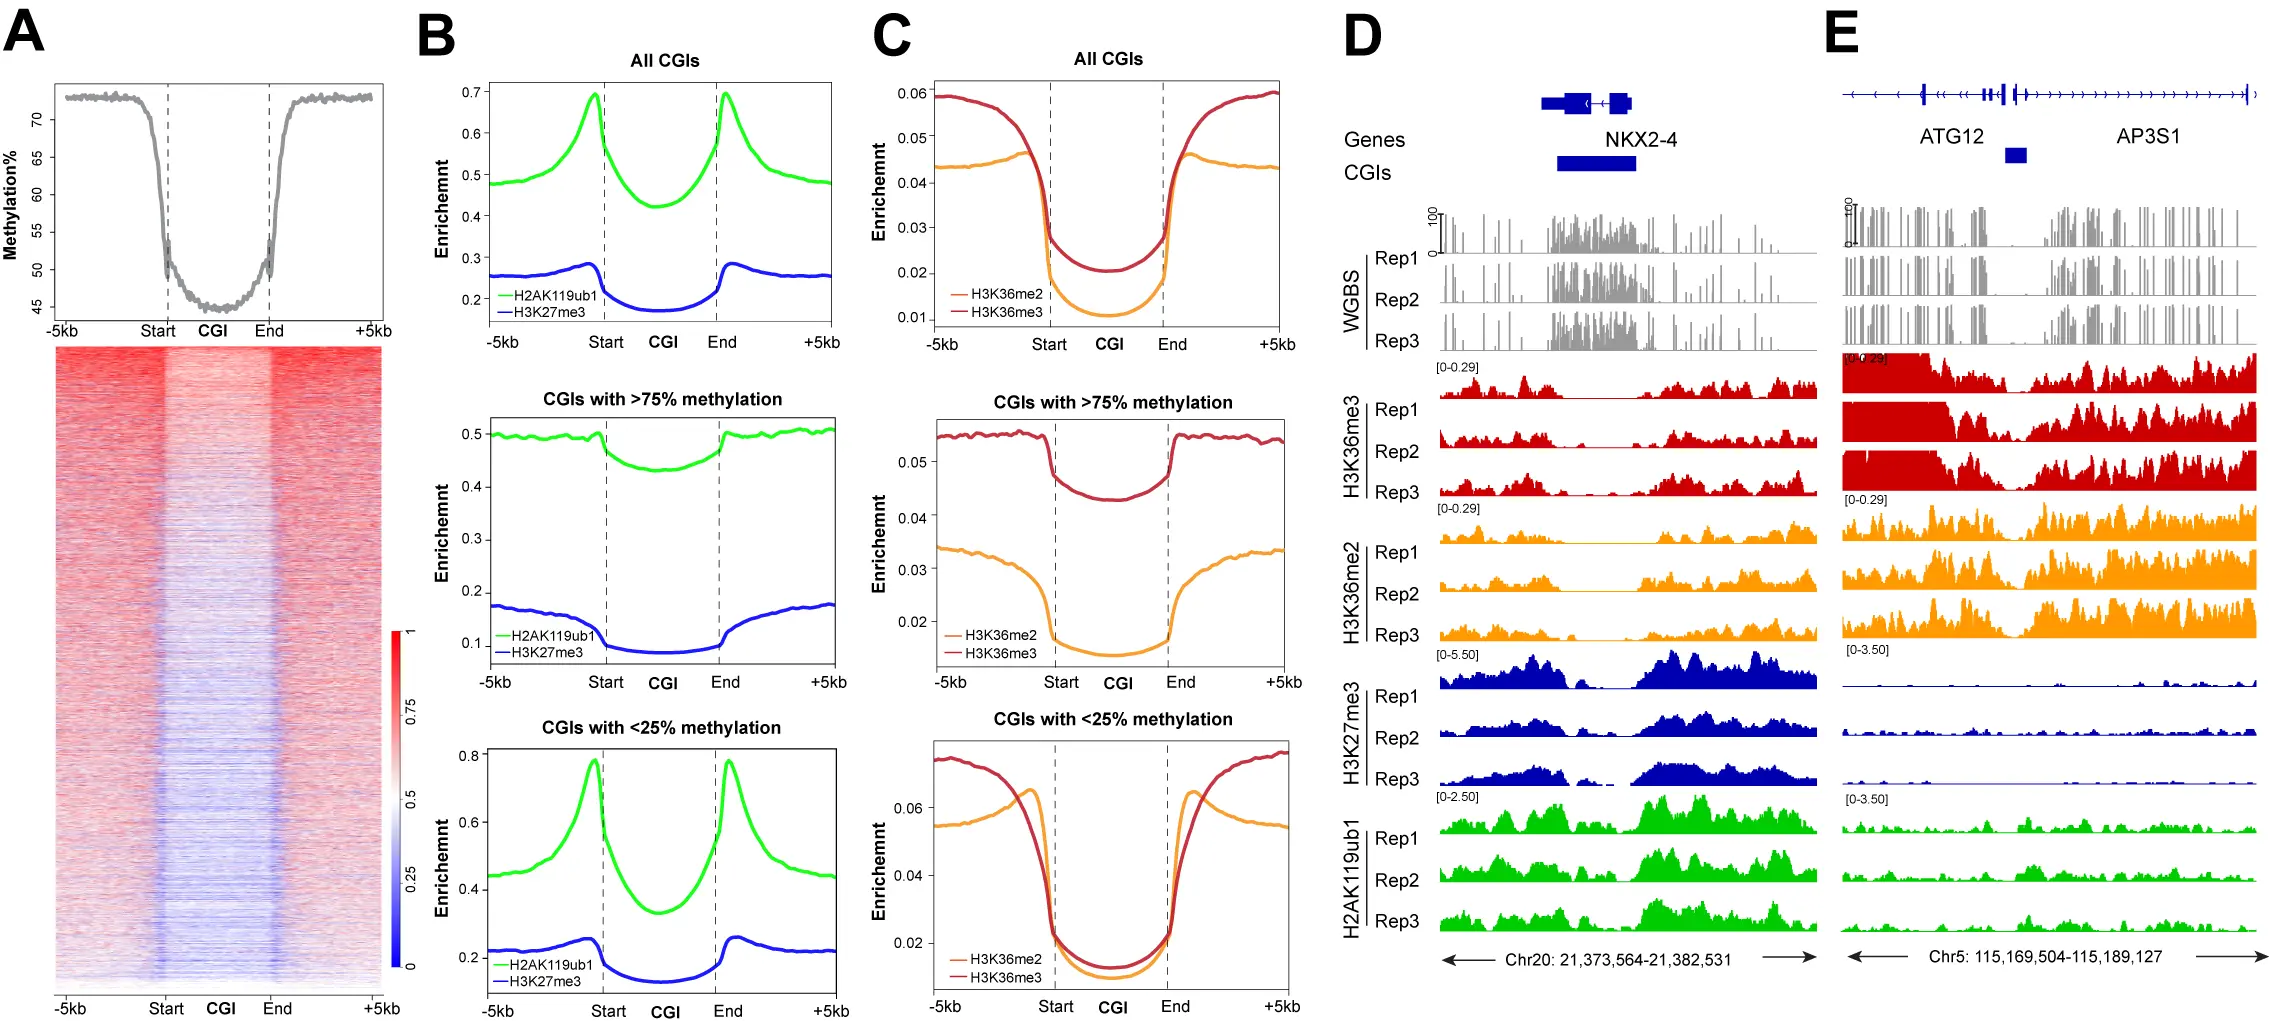
Figure 7. The profile of DNA methylation and histone marks at CpG islands. (A) Meta-signal plot and heatmap of DNA methylation at all CGIs and 5 kb flanking regions in HBEC3 cells. The heatmap shows DNA methylation levels of each CGI and 5 kb flanking regions. Three biological replicates were analyzed; (B) Meta-signal plots of H2AK119ub1 and H3K27me3 ChIP-seq signals at all genomic CGIs, CGIs with > 75% or < 25% methylation levels, including 5 kb flanking regions, respectively. A total of 27,717 CGIs, 6,678 highly methylated CGIs and 10,840 lowly methylated CGIs plus upstream and downstream 5 kb were binned into 150 windows, respectively, then the CPM value of H3K27me3 and H2AK119ub1 of each window was calculated; (C) Meta-signal plots of H3K36me2 and H3K36me3 ChIP-seq signals at all CGIs, CGIs with > 75% or
4. Discussion
In this study, we established links between genome-wide DNA methylation profiles and four prominent histone modifications in a human bronchial epithelial cell line. We did not focus here on the well-known relationship between the promoter mark H3K4me3, which interferes with de novo methylation by DNA methyltransferases[57] and is critical for keeping active and poised promoter CpG islands free of DNA methylation. The antagonistic relationship between DNA methylation and the Polycomb mark H3K27me3 has previously been noted[30,41,58-62]. In some experimental systems, for example, during the progression of normal cells towards malignancy, there can be a switch of the two repressive marks. Loss of the Polycomb mark at target genes may occur in cancer when it is replaced with DNA methylation[37,63]. In the opposite direction, when DNA methylation is reduced, for example, artificially by treatment of cells with a DNA methylation inhibitor, the demethylated regions may become occupied and modified by the Polycomb system[64]. In these situations, DNA methylation and Polycomb marking appear as opposite events, similar to what we have observed in our experimental system (Figure 1, Figure 2). The reason why this exclusion occurs is unclear. It is possible that highly
However, our data suggest that the situation is probably more complicated because of additional crosstalk between specific histone modifications and between DNMTs and those histone modifications. First, the EZH2-catalyzed H3K27 methylation activity of PRC2 is sensitive to the methylation state of the H3K36 lysine residue, at least when present on the same histone tail[69]. The activity of EZH2 is much higher on H3 histone tails that are unmodified at lysine 36 compared to dimethylated or trimethylated H3K36[70,71]. Cryo electron microscopy studies have shown that histone H3 tails containing H3K36me3 interact poorly with PRC2[72].
The methylation marks at H3K36 are dimethylation established primarily by NSD1, NSD2 and NSD3, as well as trimethylation installed by the SETD2 methyltransferase[73]. H3K27me3 is not known to block NSD or SETD2 activity, although their activity may be blocked by PRC1-induced H2AK119Ub1[74]. Loss of NSD1 leads to genome-wide expansion of H3K27me3 domains[75]. A mutually exclusive domain model may explain the stability of histone H3K27 and H3K36 histone methylation landscapes[76]. These inhibition models suggest that once an active domain with H3K36me2, and even more so with H3K36me3, has been established, it is difficult to overcome this active state by PRC-mediated Polycomb repression.
The H3K36 histone modifications explain not only the absence of H3K27 repressive marks at these regions but also the antagonism between H3K27 methylation and DNA methylation. This triangular relationship (Figure 8) exists because the H3K36 methylation marks positively induce DNA methylation. This was first shown for the de novo DNA methyltransferase DNMT3A, which interacts through its PWWP reader domain with methylated H3K36[77,78]. DNMT3B, which preferentially resides in gene bodies, also binds through its PWWP domain to H3K36-modified histones and prefers H3K36me3[79-82]. This finding may explain the high DNA methylation levels present in gene bodies, where this histone mark is prevalent. Later, it was shown that H3K36me2 is preferentially recognized by the PWWP domain of DNMT3A[83]. Since H3K36me2 is broadly present along many parts of the genome, this modification can explain much of the genomic DNA methylation patterns. Knockout of H3K36me2 methylation led to globally reduced levels of DNA methylation[83]. Interestingly, levels of H3K36me2 are also low in LAD regions, which provides yet another explanation why LADs contain only partially methylated domains[45]. As we showed recently, switching of LAD-associated genomic B compartments that contain heterochromatin to active euchromatic A compartments leads to an enhancement of H3K36me2 levels in the switched regions and to the acquisition of long stretches of DNA hypermethylation[45].
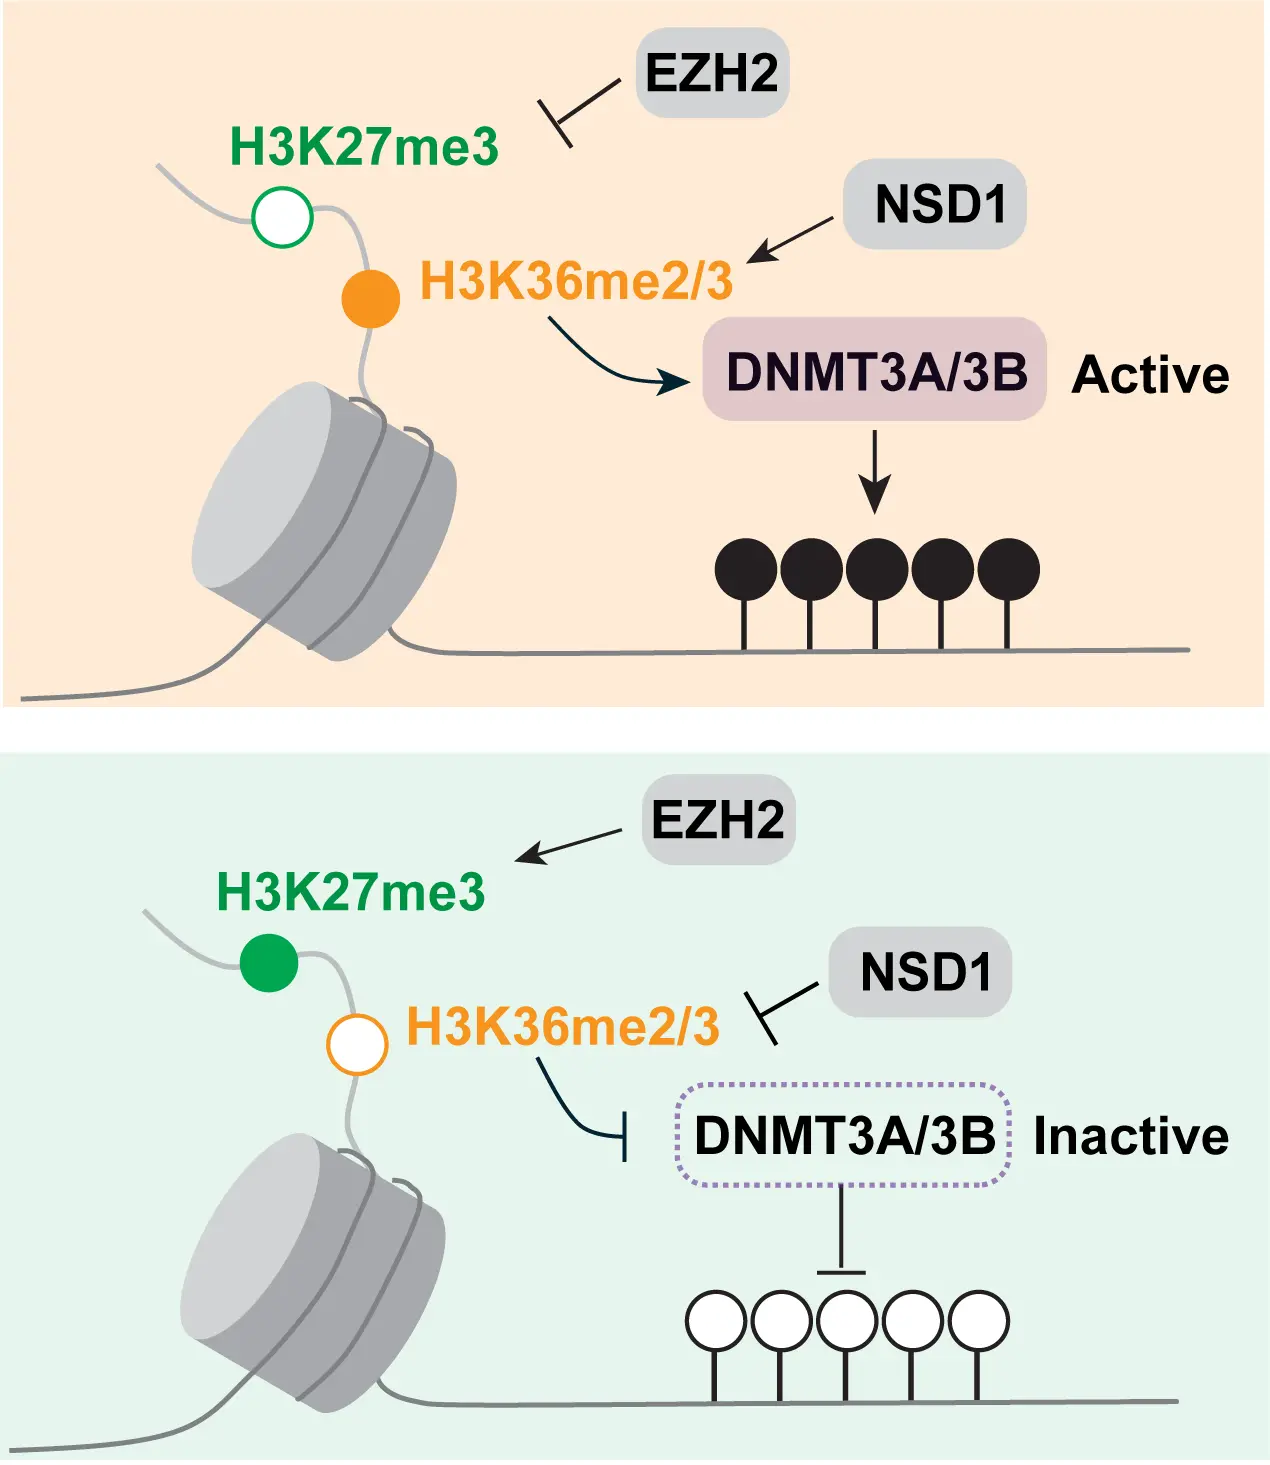
Figure 8. Model of the crosstalk between H3K27me3, H3K36 methylation and DNA methylation. The state of H3K36 methylation determines if H3K27 methylation by EZH2 occurs and if DNA methylation by DNMT3A or DNMT3B takes place. These events may determine the negative relationship between H2K27me3 and DNA methylation.
The question may be asked: in which order these genome modifications are established and what it takes to overcome and shift these landscapes. The issues of cause or consequence are often difficult to discern in biological systems with steady state observations, as reported here. However, the available evidence from in vitro systems and from genetic manipulation experiments would suggest that the NSD- and SETD2-catalyzed marks are the primary determinants of both the Polycomb PRC2 mark setting and of the DNA methylation setting (Figure 8). Therefore, interference with the H3K36 methylation system may be an attractive approach to manipulate either DNA methylation—causing DNA hypomethylation—or to affect the Polycomb system—causing increased
One phenomenon that is widely prevalent in most cancer types and is found during the aging process as well is the methylation of Polycomb target genes. In this process, hundreds or even thousands of genes that are marked by the Polycomb system in normal cells, either in embryonic stem cells or in the corresponding normal tissue cells, undergo DNA hypermethylation at CpG islands. Even though this process has been observed almost two decades ago[16,32,33,84,85], the mechanisms leading to this widespread DNA hypermethylation have remained elusive. The same process operates during tissue inflammation[37,86] and during aging[30,35,36,87,88]. Our hypothesis is that Polycomb-marked CpG islands are normally protected from the DNA methylation machinery, but that this protection is inherently unstable and deteriorates over time, i.e., during aging[30]. One such pathway that protects from DNA methylation is oxidation of 5-methylcytosine by the 5-methylcytosine oxidases, the TET proteins. TET proteins are often dysfunctional in human cancer due to either mutation or reduced enzymatic activity[40,89,90]. This phenomenon can easily be observed by the almost complete absence of the primary TET oxidation product, 5-hydroxymethylcytosine, in human tumors of many different tissue
Given the widespread crosstalk between H3K27 methylation, H3K36 methylation, and DNA methylation, one wonders if the H3K36 methylation system plays any role in the methylation of Polycomb target genes. CpG islands are bound by the H3K36 demethylase enzymes, KDM2A and KDM2B[65,66], which should reduce these modifications at unmethylated CpG islands, consistent with our findings (Figure 7). The H3K36 modifications are also largely absent from methylated CpG islands (Figure 7C,D), except for H3K36me3 at the bodies of active genes. It is possible, however, that NSD enzyme activities could forcefully introduce H3K36 methylation at Polycomb-marked CpG islands, which would interfere with PRC2 but promote de novo DNA methylation. In fact, NSD2 and NSD3 are upregulated at the transcript levels or carry activating mutations in human tumors[92-96]. Further work is required to better understand how these mutually dependent genome modification systems operate in different cell types and how they break down during aging and cancer.
Limitations of the study: The data in our study are mostly correlative. Therefore, we cannot infer that there is causation in one direction or the other. Only systematic perturbation experiments, in which the H3K27, the H3K36 modifications, or DNA methylation are removed, would allow us to establish mechanistically the order of events and the mutual dependency of these modifications. Doing that would represent a considerable effort, as multiple genes (e.g., NSD1, NSD2, NSD3, or EZH1, EZH2) would need to be targeted and the manipulated cells then analyzed for epigenomic patterns.
Supplementary materials
The supplementary material for this article is available at: Supplementary materials.
Authors contribution
Cui W: Investigation, formal analysis, writing-review & editing.
Huang Z: Formal analysis, writing-review & editing.
Pfeifer GP: Conceptualization, writing-original draft, writing-review & editing, funding acquisition.
Conflicts of interest
Gerd P. Pfeifer is an Editorial Board Member of Ageing and Cancer Research & Treatment. The other authors declare no conflicts of interest.
Ethical approval
Not applicable.
Consent to participate
Not applicable.
Consent for publication
Not applicable.
Availability of data and material
The data and materials could be obtained from the corresponding author upon request.
Funding
This work was supported by a grant from the National Cancer Institute (CA234595) to Gerd P. Pfeifer.
Copyright
© The Author(s) 2025.
References
-
1. Bird AP. CpG-rich islands and the function of DNA methylation. Nature. 1986;321(6067):209-213.[DOI]
-
2. Wang H, Helin K. Roles of H3K4 methylation in biology and disease. Trends Cell Biol. 2025;35(2):115-128.[DOI]
-
3. Lam UTF, Tan BKY, Poh JJX and Chen ES. Structural and functional specificity of H3K36 methylation. Epigenetics Chromatin. 2022;15(1):17.[DOI]
-
4. Ljungman M, Parks L, Hulbatte R, Bedi K. The role of H3K79 methylation in transcription and the DNA damage response. Mutat Res Rev Mutat Res. 2019;780:48-54.[DOI]
-
5. Padeken J, Methot SP, Gasser SM. Establishment of H3K9-methylated heterochromatin and its functions in tissue differentiation and maintenance. Nat Rev Mol Cell Biol. 2022;23(9):623-640.[DOI]
-
6. Alagna NS, Thomas TI, Wilson KL, Reddy KL. Choreography of lamina-associated domains: Structure meets dynamics. FEBS Lett. 2023;597(22):2806-2822.[DOI]
-
7. Manzo SG, Dauban L, van Steensel B. Lamina-associated domains: Tethers and looseners. Curr Opin Cell Biol. 2022;74:80-87.[DOI]
-
8. Beck DB, Bonasio R, Kaneko S, Li G, Margueron R, Oda H, et al. Chromatin in the nuclear landscape. Cold Spring Harb Symp Quant Biol. 2010;75:11-22.[DOI]
-
9. Blackledge NP and Klose RJ. The molecular principles of gene regulation by Polycomb repressive complexes. Nat Rev Mol Cell Biol. 2021;22(12):815-833.[DOI]
-
10. Aranda S, Mas G, Di Croce L. Regulation of gene transcription by Polycomb proteins. Sci Adv. 2015;1(11):e1500737.[DOI]
-
11. Ito S, Umehara T, Koseki H. Polycomb-mediated histone modifications and gene regulation. Biochem Soc Trans. 2024;52(1):151-161.[DOI]
-
12. Wang S, Ordonez-Rubiano SC, Dhiman A, Jiao G, Strohmier Brayden P, Krusemark CJ, et al. Polycomb group proteins in cancer: Multifaceted functions and strategies for modulation. NAR Cancer. 2021;3(4):zcab039.[DOI]
-
13. Tamburri S, Conway E, Pasini D. Polycomb-dependent histone H2A ubiquitination links developmental disorders with cancer. Trends Genet. 2022;38(4):333-352.[DOI]
-
14. Barski A, Cuddapah S, Cui K, Roh TY, Schones DE, Wang Z, et al. High-resolution profiling of histone methylations in the human genome. Cell. 2007;129(4):823-837.[DOI]
-
15. Weber M, Davies JJ, Wittig D, Oakeley EJ, Haase M, Lam WL, et al. Chromosome-wide and promoter-specific analyses identify sites of differential DNA methylation in normal and transformed human cells. Nat Genet. 2005;3 (8):853-862.[DOI]
-
16. Rauch T, Li H, Wu X, Pfeifer GP. MIRA-assisted microarray analysis, a new technology for the determination of DNA methylation patterns, identifies frequent methylation of homeodomain-containing genes in lung cancer cells. Cancer Res. 2006;66(16):7939-7947.[DOI]
-
17. Gama-Sosa MA, Midgett RM, Slagel VA, Githens S, Kuo KC, Gehrke CW, et al. Tissue-specific differences in DNA methylation in various mammals. Biochim Biophys Acta. 1983;740(2):212-219.[DOI]
-
18. Romanov GA, Vanyushin BF. Methylation of reiterated sequences in mammalian DNAs. Effects of the tissue type, age, malignancy and hormonal induction. Biochim Biophys Acta. 1981;653(2):204-218.[DOI]
-
19. Feinberg AP, Vogelstein B. Hypomethylation of ras oncogenes in primary human cancers. Biochem Biophys Res Commun. 1983;111(1):47-54.[DOI]
-
20. Ehrlich M. DNA hypomethylation in cancer cells. Epigenomics. 2009;1(2):239-259.[DOI]
-
21. Baylin SB, Hoppener JW, de Bustros A, Steenbergh PH, Lips CJ, Nelkin BD. DNA methylation patterns of the calcitonin gene in human lung cancers and lymphomas. Cancer Res. 1986;46(6):2917-2922. Available from: https://www.ncbi.nlm.nih.gov/pubmed/3009002
-
22. Esteller M. CpG island hypermethylation and tumor suppressor genes: a booming present, a brighter future. Oncogene. 2002;21(35):5427-5440.[DOI]
-
23. Herman JG, Baylin SB. Gene silencing in cancer in association with promoter hypermethylation. N Engl J Med. 2003;349(21):2042-2054.[DOI]
-
24. Dammann R, Li C, Yoon JH, Chin PL, Bates S, Pfeifer GP. Epigenetic inactivation of a RAS association domain family protein from the lung tumour suppressor locus 3p21.3. Nat Genet. 2000;25(3):315-319.[DOI]
-
25. Herman JG, Jen J, Merlo A, Baylin SB. Hypermethylation-associated inactivation indicates a tumor suppressor role for p15ink4b. Cancer Res. 1996;56(4):722-727.[PubMed]
-
26. Kane MF, Loda M, Gaida GM, Lipman J, Mishra R, Goldman H, et al. Methylation of the hMLH1 promoter correlates with lack of expression of hMLH1 in sporadic colon tumors and mismatch repair-defective human tumor cell lines. Cancer Res. 1997;57(5):808-811.[PubMed]
-
27. Jones PA, Issa J-PJ, Baylin S. Targeting the cancer epigenome for therapy. Nat Rev Genet. 2016;17(10):630-641.[DOI]
-
28. Pasini D, Di Croce L. Emerging roles for Polycomb proteins in cancer. Curr Opin Genet Dev. 2016;36:50-58.[DOI]
-
29. Vaidya H, Jelinek J, Issa JPJ. DNA methylation, aging, and cancer. Epigenomes. 2025;9(2):18.[DOI]
-
30. Jung M, Pfeifer GP. Aging and DNA methylation. BMC Biol. 2015;13:7.[DOI]
-
31. Klutstein M, Nejman D, Greenfield R, Cedar H. DNA methylation in cancer and aging. Cancer Res. 2016;76(12):3446-3450.[DOI]
-
32. Rauch T, Wang Z, Zhang X, Zhong X, Wu X, Lau SK, et al.. Homeobox gene methylation in lung cancer studied by genome-wide analysis with a microarray-based methylated CpG island recovery assay. Proc Natl Acad Sci U.S.A. 2007;104(13):5527-5532.[DOI]
-
33. Ohm JE, McGarvey KM, Yu X, Cheng L, Schuebel KE, Cope L, et al. A stem cell-like chromatin pattern may predispose tumor suppressor genes to DNA hypermethylation and heritable silencing. Nat Genet. 2007;39(2):237-242.[DOI]
-
34. Easwaran H, Johnstone SE, Van Neste L, Ohm J, Mosbruger T, Wang Q, et al. A DNA hypermethylation module for the stem/progenitor cell signature of cancer. Genome Res. 2012;22(5):837-849.[DOI]
-
35. Teschendorff AE, Menon U, Gentry-Maharaj A, Ramus SJ, Weisenberger DJ, Shen H, et al. Age-dependent DNA methylation of genes that are suppressed in stem cells is a hallmark of cancer. Genome Res. 2010;20(4):440-446.[DOI]
-
36. Maegawa S, Hinkal G, Kim HS, Shen L, Zhang L, Zhang J, et al. Widespread and tissue specific age-related DNA methylation changes in mice. Genome Res. 2010;20(3):332-340.[DOI]
-
37. Hahn MA, Hahn T, Lee DH, Esworthy RS, Kim B, Riggs AD, et al. Methylation of polycomb target genes in intestinal cancer is mediated by inflammation. Cancer Res. 2008;68(24):10280-10289.[DOI]
-
38. Tahiliani M, Koh KP, Shen Y, Pastor WA, Bandukwala H, Brudno Y, et al. Conversion of 5-methylcytosine to 5-hydroxymethylcytosine in mammalian DNA by MLL partner TET1. Science. 2009;324(5929):930-935.[DOI]
-
39. Edwards JR, Yarychkivska O, Boulard M, Bestor TH. DNA methylation and DNA methyltransferases. Epigenetics Chromatin. 2017;10(1):23.[DOI]
-
40. Pfeifer GP, Kadam S, Jin SG. 5-hydroxymethylcytosine and its potential roles in development and cancer. Epigenetics Chromatin. 2013;6(1):10.[DOI]
-
41. Fu K, Bonora G, Pellegrini M. Interactions between core histone marks and DNA methyltransferases predict DNA methylation patterns observed in human cells and tissues. Epigenetics. 2020;15(3):272-282.[DOI]
-
42. Zheng Y, Ziman B, Ho AS, Sinha UK, Xu LY, Li EM, et al. Comprehensive analyses of partially methylated domains and differentially methylated regions in esophageal cancer reveal both cell-type- and cancer-specific epigenetic regulation. Genome Biol. 2023;24(1):193.[DOI]
-
43. Cui W, Huang Z, Jin SG, Johnson J, Lau KH, Hostetter G, et al. Deficiency of the polycomb protein rybp and tet methylcytosine oxidases promotes extensive cpg island hypermethylation and malignant transformation. Cancer Res. 2023;83(15):2480-2495.[DOI]
-
44. Ramirez RD, Sheridan S, Girard L, Sato M, Kim Y, Pollack J, et al. Immortalization of human bronchial epithelial cells in the absence of viral oncoproteins. Cancer Res. 2004;64(24):9027-9034.[DOI]
-
45. Huang Z, Cui W, Ratnayake I, Gallik KL, Cohen L, Tawil R, et al. SMCHD1 maintains heterochromatin, genome compartments and epigenome landscape in human myoblasts. Nat Commun. 2025;16(1):6900.[DOI]
-
46. Huang Z, Yu J, Cui W, Johnson BK, Kim K, Pfeifer GP. The chromosomal protein SMCHD1 regulates DNA methylation and the 2c-like state of embryonic stem cells by antagonizing TET proteins. Sci Adv. 2021;7(4):eabb9149.[DOI]
-
47. Rauch TA, Wu X, Zhong X, Riggs AD, Pfeifer GP. A human B cell methylome at 100-base pair resolution. Proc Natl Acad Sci U.S.A. 2009;106(3):671-678.[DOI]
-
48. Maunakea AK, Nagarajan RP, Bilenky M, Ballinger TJ, D'Souza C, Fouse SD, et al. Conserved role of intragenic DNA methylation in regulating alternative promoters. Nature. 2010;466(7303):253-257.[DOI]
-
49. Hahn MA, Wu X, Li AX, Hahn T, Pfeifer GP. Relationship between gene body DNA methylation and intragenic H3K9me3 and H3K36me3 chromatin marks. PLoS One. 2011;6(4):e18844.[DOI]
-
50. Hellman A and Chess A. Gene body-specific methylation on the active X chromosome. Science. 2007;315(5815):1141-1143.[DOI]
-
51. van Steensel B, Belmont AS. Lamina-associated domains: Links with chromosome architecture, heterochromatin, and gene repression. Cell. 2017;169(5):780-791.[DOI]
-
52. Endicott JL, Nolte PA, Shen H, Laird PW. Cell division drives DNA methylation loss in late-replicating domains in primary human cells. Nat Commun. 2022;13(1):6659.[DOI]
-
53. Zhou W, Dinh HQ, Ramjan Z, Weisenberger DJ, Nicolet CM, Shen H, et al. DNA methylation loss in late-replicating domains is linked to mitotic cell division. Nat Genet. 2018;50(4):591-602.[DOI]
-
54. Bennett RL, Swaroop A, Troche C and Licht JD. The role of nuclear receptor-binding SET domain family histone lysine methyltransferases in cancer. Cold Spring Harb Perspect Med. 2017;7(6)a026708:[DOI]
-
55. Molenaar TM, van Leeuwen F. SETD2: From chromatin modifier to multipronged regulator of the genome and beyond. Cell Mol Life Sci. 2022;79(6):346.[DOI]
-
56. Masalmeh RHA, Taglini F, Rubio-Ramon C, Musialik KI, Higham J, Davidson-Smith H, et al. De novo DNA methyltransferase activity in colorectal cancer is directed towards H3K36me3 marked CpG islands. Nat Commun. 2021;12(1):694.[DOI]
-
57. Ooi SKT, Qiu C, Bernstein E, Li K, Jia D, Yang Z, et al. DNMT3L connects unmethylated lysine 4 of histone H3 to de novo methylation of DNA. Nature. 2007;448(7154):714-717.[DOI]
-
58. Brinkman AB, Gu H, Bartels SJ, Zhang Y, Matarese F, Simmer F, et al. Sequential ChIP-bisulfite sequencing enables direct genome-scale investigation of chromatin and DNA methylation cross-talk. Genome Res. 2012;22(6):1128-1138.[DOI]
-
59. Lindroth AM, Park YJ, McLean CM, Dokshin GA, Persson JM, Herman H, et al. Antagonism between DNA and H3K27 methylation at the imprinted Rasgrf1 locus. PLoS Genet. 2008;4(8):e1000145.[DOI]
-
60. Hon GC, Hawkins RD, Caballero OL, Lo C, Lister R, Pelizzola M, et al. Global DNA hypomethylation coupled to repressive chromatin domain formation and gene silencing in breast cancer. Genome Res. 2012;22(2):246-258.[DOI]
-
61. Kondo Y, Shen L, Cheng AS, Ahmed S, Boumber Y, Charo C, et al. Gene silencing in cancer by histone H3 lysine 27 trimethylation independent of promoter DNA methylation. Nat Genet. 2008;40(6):741-750.[DOI]
-
62. Li Y, Chen X, Lu C. The interplay between DNA and histone methylation: Molecular mechanisms and disease implications. EMBO Rep. 2021;22(5):EMBR202051803.[DOI]
-
63. Gal-Yam EN, Egger G, Iniguez L, Holster H, Einarsson S, Zhang X, et al. Frequent switching of Polycomb repressive marks and DNA hypermethylation in the PC3 prostate cancer cell line. Proc Natl Acad Sci U.S.A. 2008;105(35):12979-12984.[DOI]
-
64. Reddington JP, Perricone SM, Nestor CE, Reichmann J, Youngson NA, Suzuki M, et al. Redistribution of H3K27me3 upon DNA hypomethylation results in de-repression of Polycomb target genes. Genome Biol. 2013;14(3):R25.[DOI]
-
65. Farcas AM, Blackledge NP, Sudbery I, Long HK, McGouran JF, Rose NR, et al. KDM2B links the Polycomb Repressive Complex 1 (PRC1) to recognition of CpG islands. eLife. 2012;1:e00205.[DOI]
-
66. Blackledge NP, Zhou JC, Tolstorukov MY, Farcas AM, Park PJ, Klose RJ. CpG islands recruit a histone H3 lysine 36 demethylase. Molecular Cell. 2010;38(2):179-190.[DOI]
-
67. Long HK, Blackledge NP, Klose RJ. ZF-CxxC domain-containing proteins, CpG islands and the chromatin connection. Biochem Soc Trans. 2013;41(3):727-740.[DOI]
-
68. Owen BM, Davidovich C. DNA binding by polycomb-group proteins: searching for the link to CpG islands. Nucleic Acids Res. 2022;50(9):4813-4839.[DOI]
-
69. Jani KS, Jain SU, Ge EJ, Diehl KL, Lundgren SM, Müller MM, et al. Histone H3 tail binds a unique sensing pocket in EZH2 to activate the PRC2 methyltransferase. Proc Natl Acad Sci U.S.A. 2019;116(17):8295-8300.[DOI]
-
70. Yuan W, Xu M, Huang C, Liu N, Chen S, Zhu B. H3K36 methylation antagonizes PRC2-mediated H3K27 methylation. J Biol Chem. 2011;286(10):7983-7989.[DOI]
-
71. Schmitges Frank W, Prusty Archana B, Faty M, Stützer A, Lingaraju Gondichatnahalli M, Aiwazian J, et al. Histone methylation by prc2 is inhibited by active chromatin marks. Molecular Cell. 2011;42(3):330-341.[DOI]
-
72. Cookis T, Lydecker A, Sauer P, Kasinath V, Nogales E Structural basis for the inhibition of PRC2 by active transcription histone posttranslational modifications. Nat Struct Mol Biol. 2025;32(2):393-404.[DOI]
-
73. Lee MK, Park NH, Lee SY, Kim T. Context-dependent and locus-specific role of H3K36 methylation in transcriptional regulation. J Mol Biol. 2025;437(1):168796.[DOI]
-
74. Yuan G, Ma B, Yuan W, Zhang Z, Chen P, Ding X, et al. Histone H2A ubiquitination inhibits the enzymatic activity of H3 lysine 36 methyltransferases. J Biol Chem. 2013;288(43):30832-30842.[DOI]
-
75. Streubel G, Watson A, Jammula SG, Scelfo A, Fitzpatrick DJ, Oliviero G, et al. The H3K36me2 Methyltransferase Nsd1 Demarcates PRC2-Mediated H3K27me2 and H3K27me3 Domains in Embryonic Stem Cells. Molecular Cell. 2018;70(2):371-379.[DOI]
-
76. Alabert C, Loos C, Voelker-Albert M, Graziano S, Forné I, Reveron-Gomez N, et al. Domain model explains propagation dynamics and stability of histone H3K27 and H3K36 methylation landscapes. Cell Rep. 2020;30(4):1223-1234.[DOI]
-
77. Dhayalan A, Rajavelu A, Rathert P, Tamas R, Jurkowska RZ, Ragozin S, et al. The Dnmt3a PWWP domain reads histone 3 lysine 36 trimethylation and guides DNA methylation. J Biol Chem. 2010;285(34):26114-26120.[DOI]
-
78. Dukatz M, Holzer K, Choudalakis M, Emperle M, Lungu C, Bashtrykov P, et al. H3K36me2/3 binding and DNA binding of the DNA methyltransferase DNMT3A PWWP domain both contribute to its chromatin interaction. J Mol Biol. 2019;431(24):5063-5074.[DOI]
-
79. Rondelet G, Dal Maso T, Willems L, Wouters J. Structural basis for recognition of histone H3K36me3 nucleosome by human de novo DNA methyltransferases 3A and 3B. J Struct Biol. 2016;194(3):357-367.[DOI]
-
80. Taglini F, Kafetzopoulos I, Rolls W, Musialik KI, Lee HY, Zhang Y, et al. DNMT3B PWWP mutations cause hypermethylation of heterochromatin. EMBO Rep. 2024;25(3):1130-1155.[DOI]
-
81. Baubec T, Colombo DF, Wirbelauer C, Schmidt J, Burger L, Krebs AR, et al. Genomic profiling of DNA methyltransferases reveals a role for DNMT3B in genic methylation. Nature. 2015;520(7546):243-247.[DOI]
-
82. Yano S, Ishiuchi T, Abe S, Namekawa SH, Huang G, Ogawa Y, et al. Histone H3K36me2 and H3K36me3 form a chromatin platform essential for DNMT3A-dependent DNA methylation in mouse oocytes. Nat Commun. 2022;13(1):4440.[DOI]
-
83. Weinberg DN, Papillon-Cavanagh S, Chen H, Yue Y, Chen X, Rajagopalan KN, et al. The histone mark H3K36me2 recruits DNMT3A and shapes the intergenic DNA methylation landscape. Nature. 2019;573(7773):281-286.[DOI]
-
84. Schlesinger Y, Straussman R, Keshet I, Farkash S, Hecht M, Zimmerman J, et al. Polycomb-mediated methylation on Lys27 of histone H3 pre-marks genes for de novo methylation in cancer. Nat Genet. 2007;39(2):232-236.[DOI]
-
85. Widschwendter M, Fiegl H, Egle D, Mueller-Holzner E, Spizzo G, Marth C, et al. Epigenetic stem cell signature in cancer. Nat Genet. 2007;39(2):157-158.[DOI]
-
86. Wijetunga NA, Pascual M, Tozour J, Delahaye F, Alani M, Adeyeye M, et al. A pre-neoplastic epigenetic field defect in HCV-infected liver at transcription factor binding sites and polycomb targets. Oncogene. 2017;36(14):2030-2044.[DOI]
-
87. Horvath S, Zhang Y, Langfelder P, Kahn RS, Boks MPM, van Eijk K, et al. Aging effects on DNA methylation modules in human brain and blood tissue. Genome Biol. 2012;13(10):R97.[DOI]
-
88. Johnson KC, Koestler DC, Cheng C, Christensen BC. Age-related DNA methylation in normal breast tissue and its relationship with invasive breast tumor methylation. Epigenetics. 2014;9(2):268-275.[DOI]
-
89. Huang Y and Rao A. Connections between TET proteins and aberrant DNA modification in cancer. Trends Genet. 2014;30(10):464-474.[DOI]
-
90. Liu YY, Ohashi Y, Ushijima T. How chronic inflammation fuels carcinogenesis as an environmental epimutagen. Discov Oncol. 2025;16(1):1150.[DOI]
-
91. Jin SG, Jiang Y, Qiu R, Rauch TA, Wang Y, Schackert G, et al. 5-Hydroxymethylcytosine is strongly depleted in human cancers but its levels do not correlate with IDH1 mutations. Cancer Res. 2011;71(24):7360-7365.[DOI]
-
92. Zhao LH, Li Q, Huang ZJ, Sun MX, Lu JJ, Zhang XH, et al. Identification of histone methyltransferase NSD2 as an important oncogenic gene in colorectal cancer. Cell Death Dis. 2021;12(11):974.[DOI]
-
93. Chen R, Chen Y, Zhao W, Fang C, Zhou W, Yang X, et al. The role of methyltransferase NSD2 as a potential oncogene in human solid tumors. Onco Targets Ther. 2020;13:6837-6846.[DOI]
-
94. Swaroop A, Oyer JA, Will CM, Huang X, Yu W, Troche C, et al. An activating mutation of the NSD2 histone methyltransferase drives oncogenic reprogramming in acute lymphocytic leukemia. Oncogene. 2019;38(5):671-686.[DOI]
-
95. Nuñez Y, Vera S, Baeza V, Gonzalez-Pecchi V. NSD3 in cancer: Unraveling methyltransferase-dependent and isoform-specific functions. Int J Mol Sci. 2024;25(2):944.[DOI]
-
96. Sun Y, Xie J, Cai S, Wang Q, Feng Z, Li Y, et al. Elevated expression of nuclear receptor-binding SET domain 3 promotes pancreatic cancer cell growth. Cell Death Dis. 2021;12(10):913.[DOI]
Copyright
© The Author(s) 2026. This is an Open Access article licensed under a Creative Commons Attribution 4.0 International License (https://creativecommons.org/licenses/by/4.0/), which permits unrestricted use, sharing, adaptation, distribution and reproduction in any medium or format, for any purpose, even commercially, as long as you give appropriate credit to the original author(s) and the source, provide a link to the Creative Commons license, and indicate if changes were made.
Publisher’s Note
Science Exploration remains a neutral stance on jurisdictional claims in published
maps
and institutional affiliations. The views expressed in this article are solely those
of
the author(s) and do not reflect the opinions of the Editors or the publisher.
Share And Cite


Science Exploration Style
Cui W, Huang Z, Pfeifer GP. DNA methylation landscapes in human cells and their chromatin determinants. Ageing Cancer Res Treat. 2026;3:202513. https://doi.org/10.70401/acrt.2025.0007
Tips
Copy completed.
Submit a Manuscript
Author Instructions
Cite this Article
Article Metrics
0
View
0
Download
Cited
Article Updates

Science Exploration Style
Cui W, Huang Z, Pfeifer GP. DNA methylation landscapes in human cells and their chromatin determinants. Ageing Cancer Res Treat. 2026;3:202513. https://doi.org/10.70401/acrt.2025.0007
copy
Share Link
copy