Thermal conductivity hydrogen sensor: From fundamental principles to smart gas sensing applications
*Correspondence to:
Minggang Xia, Department of Applied Physics, School of Physics, Xi’an Jiaotong University, Xi’an 710049, Shaanxi, China.
E-mail: xiamg@mail.xjtu.edu.cn
Thermo-X. 2026;2:202605. 10.70401/tx.2026.0017
Received: January 22, 2026Accepted: March 23, 2026Published: March 25, 2026
Abstract
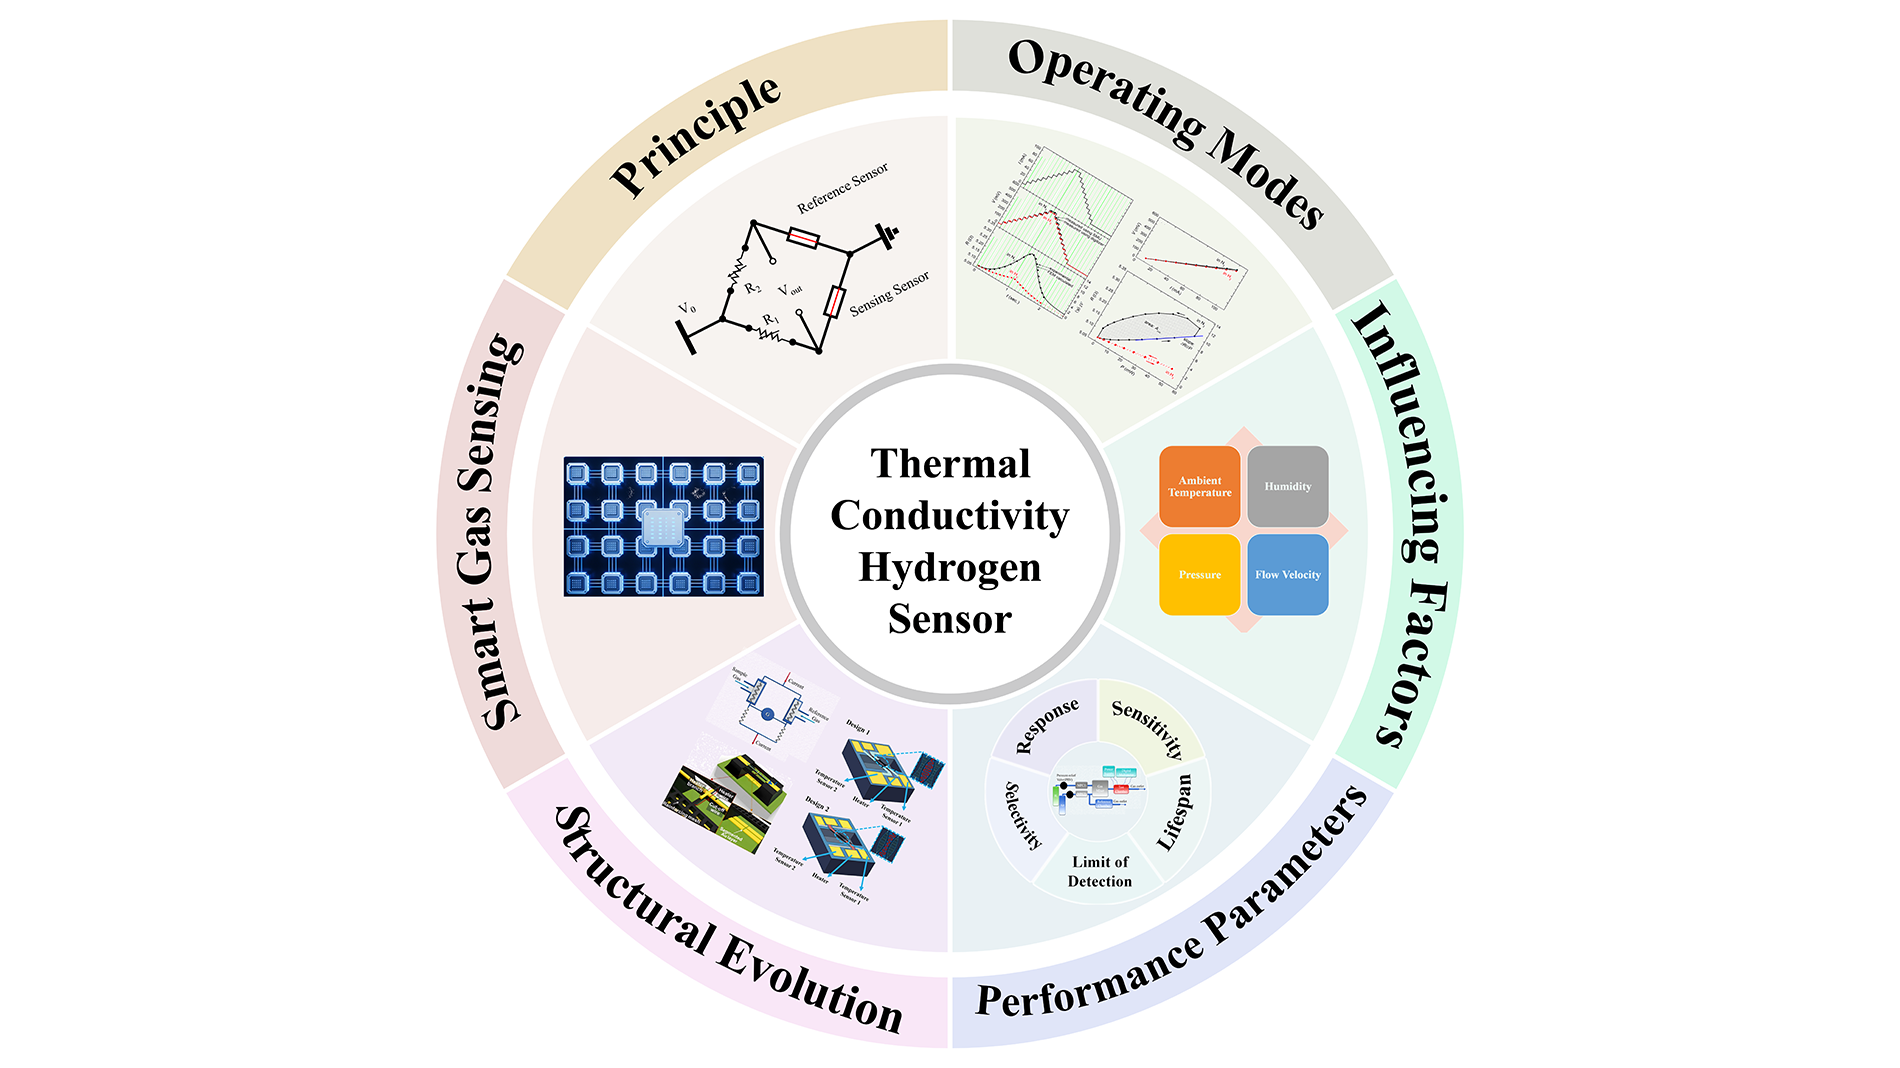
Hydrogen is widely recognized as the leading green energy carrier of the 21st century, owing to its diverse production pathways, high combustion energy density, and environmentally benign byproduct: water. However, its wide flammability range (4-75 vol.% in air) and extremely low minimum ignition energy (0.02 mJ) pose significant safety risks across the entire lifecycle of production, storage, transportation, and utilization, necessitating real-time monitoring through highly reliable sensing technologies. Among various hydrogen detection methods, thermal conductivity sensors have attracted considerable attention due to their oxygen-independent operation, broad measuring range, mechanical robustness, and long service lifespan. Despite growing research interest, there remains a notable lack of comprehensive review articles specifically dedicated to thermal conductivity hydrogen sensors (TCHSs) that consolidate the current state of knowledge and guide future research directions. This paper presents a systematic analysis of the working principles and operating modes of TCHSs, introduces key performance parameters, and reviews theoretical models describing the effective thermal conductivity of gas mixtures. The discussion covers representative sensor architectures, gas inlet configurations, and critical environmental factors influencing sensor performance. Furthermore, recent advances and emerging trends are examined, with particular emphasis on smart gas sensing technologies enabled by sensor integration and advanced machine learning algorithms. This study aims to serve as a comprehensive academic reference, offering a clear and structured framework for researchers, particularly those newly entering the field of hydrogen sensing.
Graphical Abstract
Keywords
Thermal conductivity hydrogen sensor, sensing principle, operating mode, structural design, smart gas sensing applications
1. Introduction
Contemporary global challenges, including the depletion of fossil fuel reserves, escalating air pollution, and worsening global warming, have underscored the urgency of transitioning to sustainable energy sources. Against this backdrop, hydrogen is widely regarded as the preferred green energy source for the 21st century[1-4], owing to its diverse production pathways[4], such as natural gas reforming and water electrolysis, high combustion energy density (142 kJ/g), and its environmentally benign combustion byproduct: water. Widely utilized in metal smelting, chemical synthesis, fuel cells, and district heating systems[5-7], hydrogen plays a pivotal role in advancing progress toward the Sustainable Development Goals. However, its wide flammability range (4-75 vol.% in air) and extremely low minimum ignition energy (0.02 mJ) pose significant safety risks across the entire lifecycle of production, storage, transportation, and utilization[8,9]. Consequently, the development of reliable sensing technologies capable of long-term, stable, rapid, and precise hydrogen monitoring is indispensable.
A variety of hydrogen detection technologies have been developed, including thermal conductivity sensors (TCSs)[10-15], metal-oxide semiconductor (MOS) sensors[9,16-21], electrochemical sensors[22-27], catalytic combustion sensors[28-33], and optical sensors[34-40]. MOS sensors offer advantages such as simple structure, ease of mass production[41], long operational lifespan, and high sensitivity[42-44], but are limited by high power consumption[45] and poor selectivity[17,18,46]. Electrochemical sensors exhibit high sensitivity to low hydrogen concentrations, yet their performance is significantly affected by temperature fluctuations[47]. Catalytic combustion sensors are generally classified into pellistors and thermoelectric sensors[42]. Pellistors consist of alumina beads impregnated with a catalyst and a platinum resistance thermometer (Pt thermistor), operating through catalytic oxidation that requires oxygen and reaches temperatures of several hundred degrees Celsius[29,41], resulting in high power consumption (hundreds of milliwatts[28,31]) and relatively slow response times[31]. Thermoelectric sensors generate signals via the thermoelectric effect induced by heat from catalytic reactions, offering high sensitivity and potential for miniaturization, but present safety concerns due to elevated operating temperatures[48] and are susceptible to poisoning by phosphorus, sulfur, and silicon compounds, as well as interference from other gases[42]. Optical sensors provide a broad measurement range and fast response, yet face limitations related to complex configurations, higher costs[47], and challenges in miniaturization[46], largely due to stringent requirements for light sources and photodetectors[43].
In contrast, thermal conductivity hydrogen sensors (TCHSs), which operate based on heat transfer principles, exhibit distinct advantages: simple design, independence from oxygen[41], wide measurement range (0-100 vol.%), non-destructive detection[49], and extended operational lifespan[50]. These characteristics render TCHSs particularly suitable for automotive applications, where immunity to carbon monoxide and minimal maintenance requirements are critical[41]. A comparative analysis of different sensor types is presented in Figure 1. The U.S. Department of Energy has established performance targets for hydrogen sensors[51], specifying a measuring range of 0.1-10%, high accuracy (±5% of full scale), excellent selectivity (resistance to humidity and hydrocarbon interference), fast response time (< 1 s), and long service life (> 10 years). TCHSs can effectively meet these criteria, particularly with respect to the measuring range and durability.
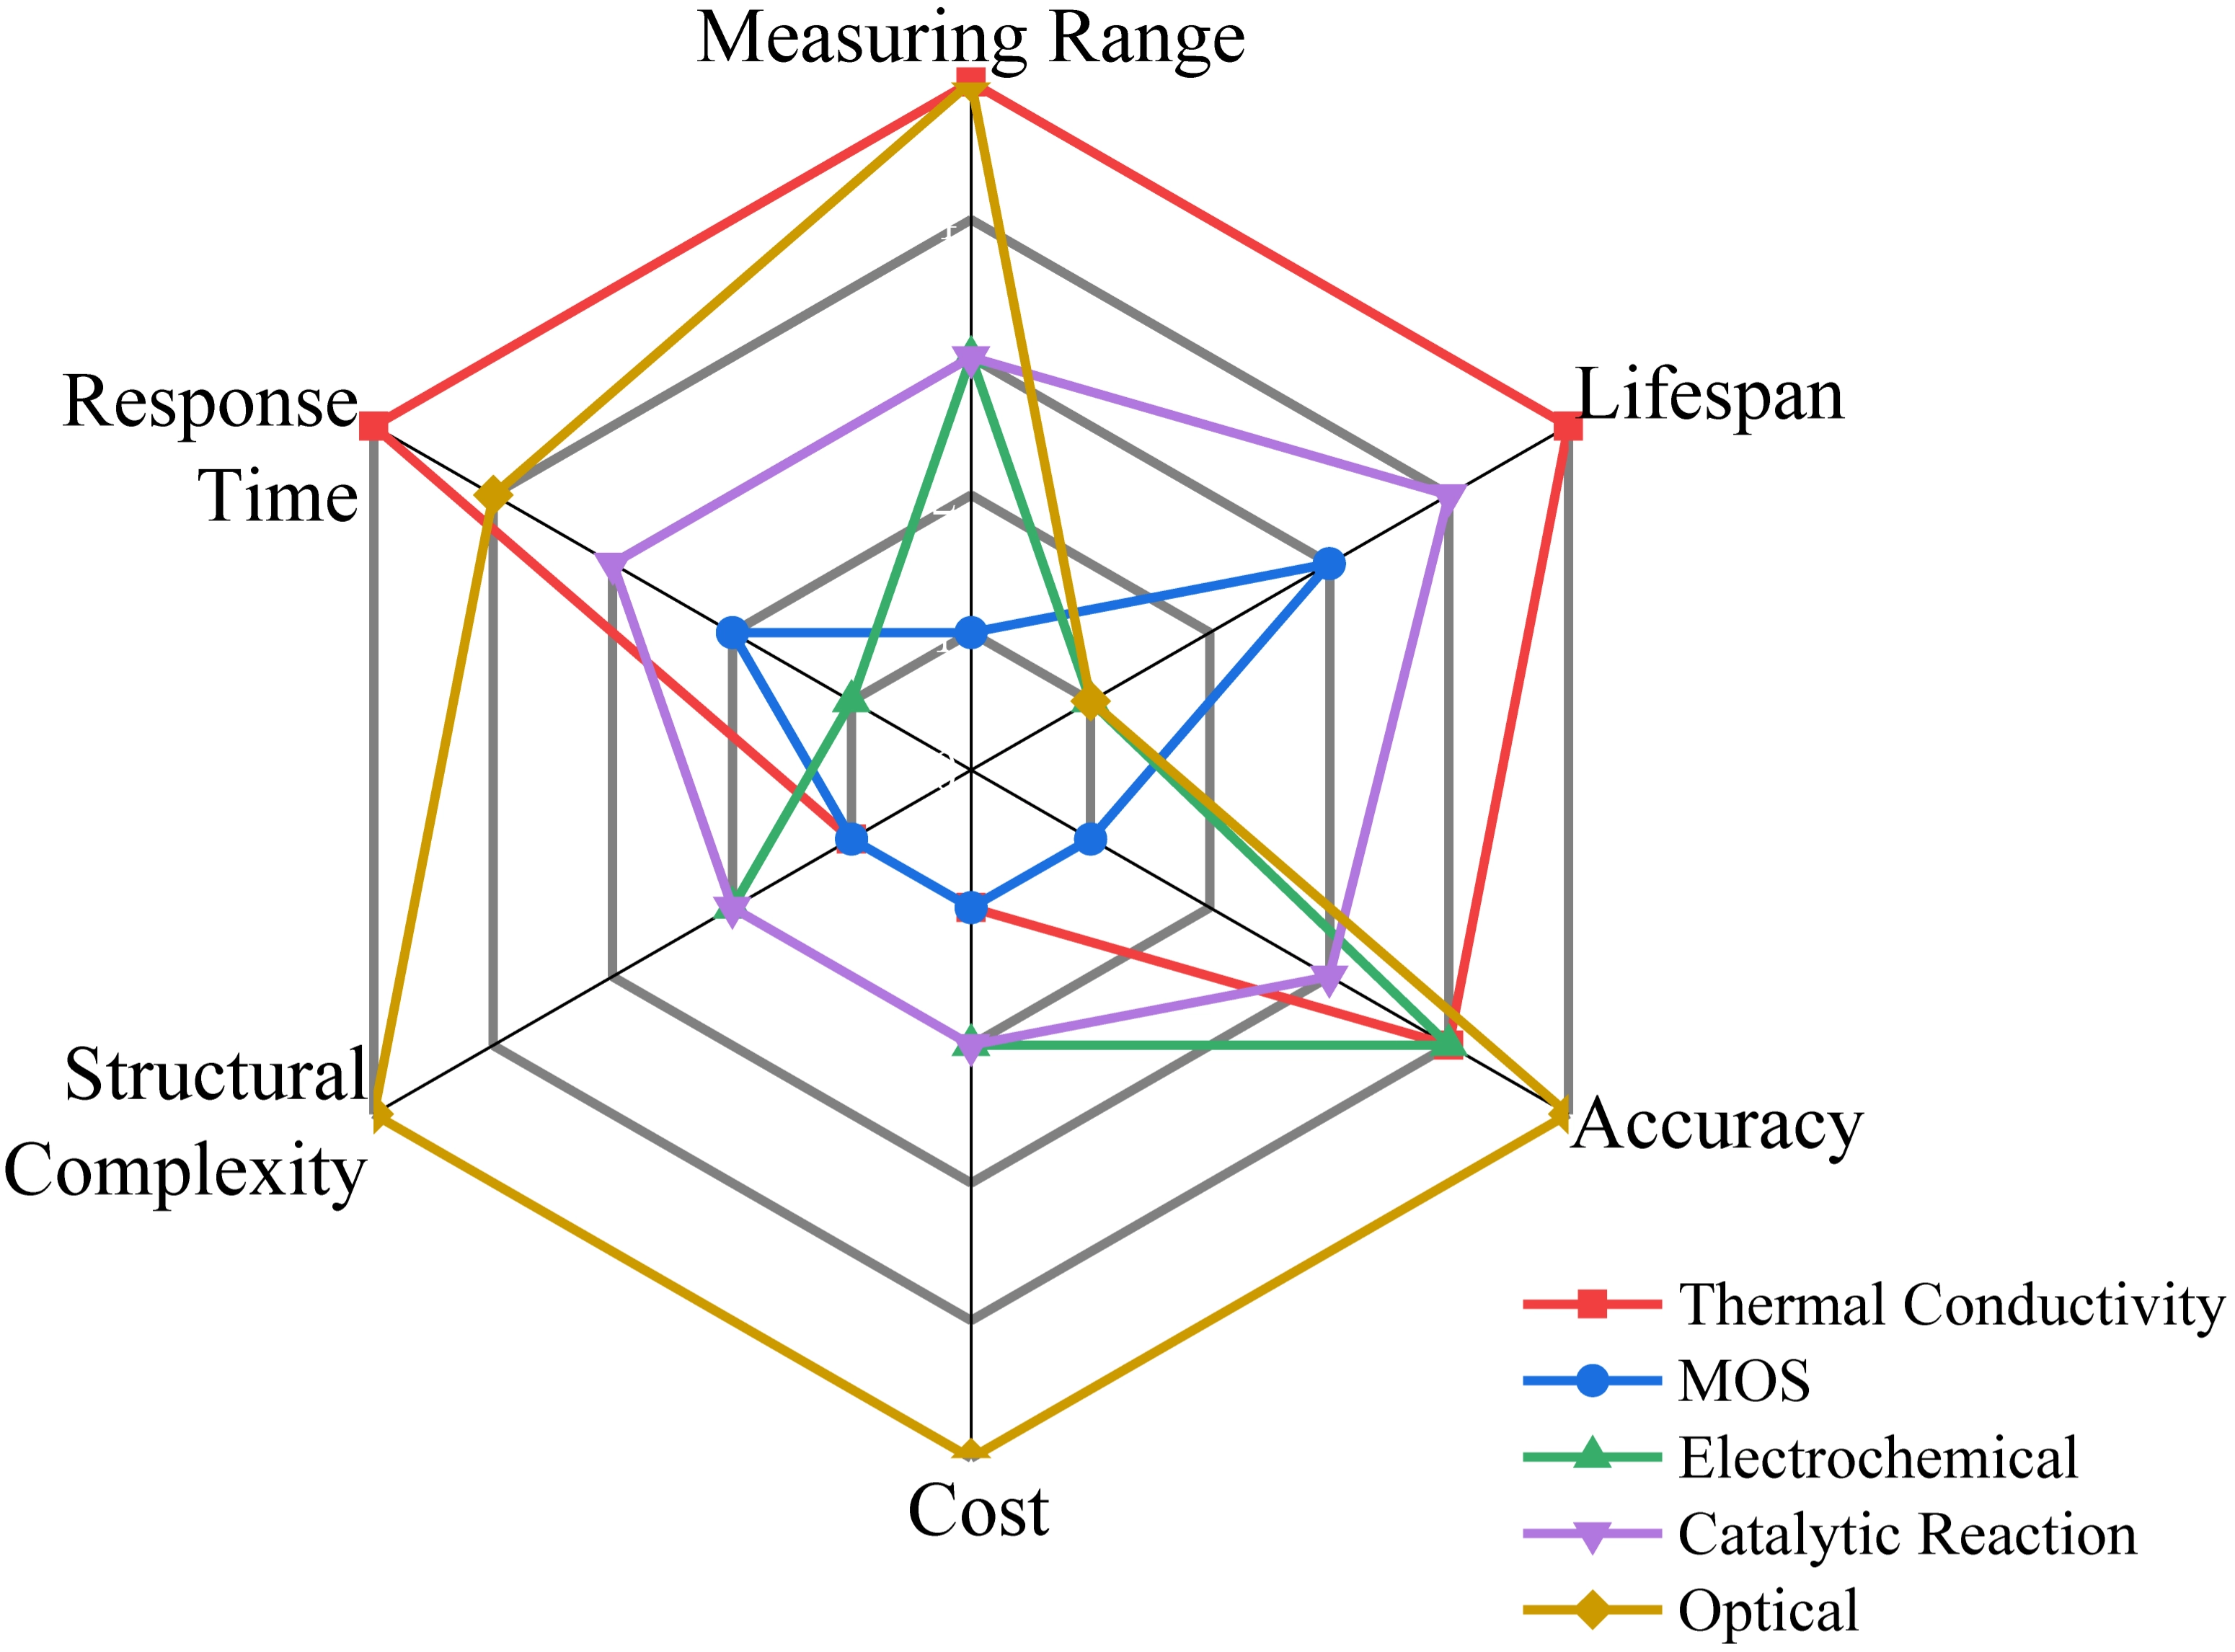
Figure 1. Comparison of sensor performance across different types, with values increasing radially outward from the center.
The thermal conductivity of common gases is presented in Table 1. Hydrogen exhibits a thermal conductivity nearly seven times that of air, the highest among known gases, which can be attributed to its low molecular mass and small molecular size[53]. In hydrogen-containing gas mixtures, the overall thermal conductivity increases with hydrogen concentration[54], enabling hydrogen detection through quantification of thermal conductivity variations and their conversion into readable electrical signals, which can be accomplished using TCHSs.
Table 1. Thermal conductivity of several common gases (1 bar, 300 K)[52].
| Gas | Air | CO2 | He | H2 | N2 | Ar | O2 | CH4 |
| TC[10-3 W/(m·K)] | 26.2 | 16.8 | 156.7 | 186.9 | 26 | 17.9 | 26.3 | 34.1 |
TC: thermal conductivity.
Since its inception, TCHS has evolved from traditional wire-based structures to micro-electro-mechanical system (MEMS) microstructures, and further toward integrated systems, achieving significant improvements in performance. Recently, TCHS has attracted growing attention due to its simple structure, long lifespan, and compatibility with integration and miniaturization[55], making it suitable for applications in sensor arrays and portable devices[52]. However, limitations remain in trace detection, as well as susceptibility to flow velocity, temperature, and humidity-induced drift. Driven by the rapid advancement of the Internet of Things (IoT), wireless sensor networks, artificial intelligence (AI), and machine learning (ML), along with increasing demand for miniaturized, low-power, and intelligent sensors, TCHS is undergoing accelerated innovation toward micro-integration and intelligent sensing capabilities[56].
Notwithstanding these advancements, the academic community still lacks dedicated review articles focused specifically on TCHS to consolidate the current state of knowledge and guide future research directions. This paper presents a comprehensive analysis of the working principles and operating modes of TCHS, introduces key performance parameters, and reviews theoretical models describing the effective thermal conductivity of gas mixtures. The discussion covers representative sensor architectures, gas inlet configurations, and critical environmental factors influencing sensor performance. Furthermore, recent advances and emerging trends are examined, with particular emphasis on smart gas sensing technology enabled by sensor arrays and advanced ML algorithms.
2. Sensing Principle
Thermal conductivity, a fundamental material property that describes the ability of a substance to conduct heat, is defined as the quantity of heat transferred per unit area per unit time under a unit temperature gradient. Common units include W/(m·K) and cal/(cm·s·°C). A typical TCHS consists of a heating element and a temperature sensor, which detect changes in the thermal conductivity of the ambient gas through corresponding temperature variations. These components may be either separate or integrated into a single structure. Certain materials, such as platinum (Pt), exhibit temperature-dependent electrical resistance. The heating element, typically fabricated from such materials, dissipates heat at different rates depending on the thermal conductivity of the ambient gas. All TCHSs operate based on measurements of thermal conductivity.
A complete TCHS sensing system consists of a core sensing element, a reference element, a read-out circuit, and optional compensation components and packaging. The basic experimental setup for testing TCHS is illustrated in Figure 2. The gas mass flow velocity is controlled via computer-operated Mass Flow Controllers. Hydrogen and the carrier gas (e.g., air) are precisely mixed before being introduced into the sensing chamber. Low-concentration hydrogen mixtures are typically prepared by diluting a higher-concentration hydrogen source with the ambient gas[57]. The signal acquisition setup depicted is minimal, using only a digital multimeter; however, high-precision Lock-in Amplifiers are now widely employed in advanced configurations.
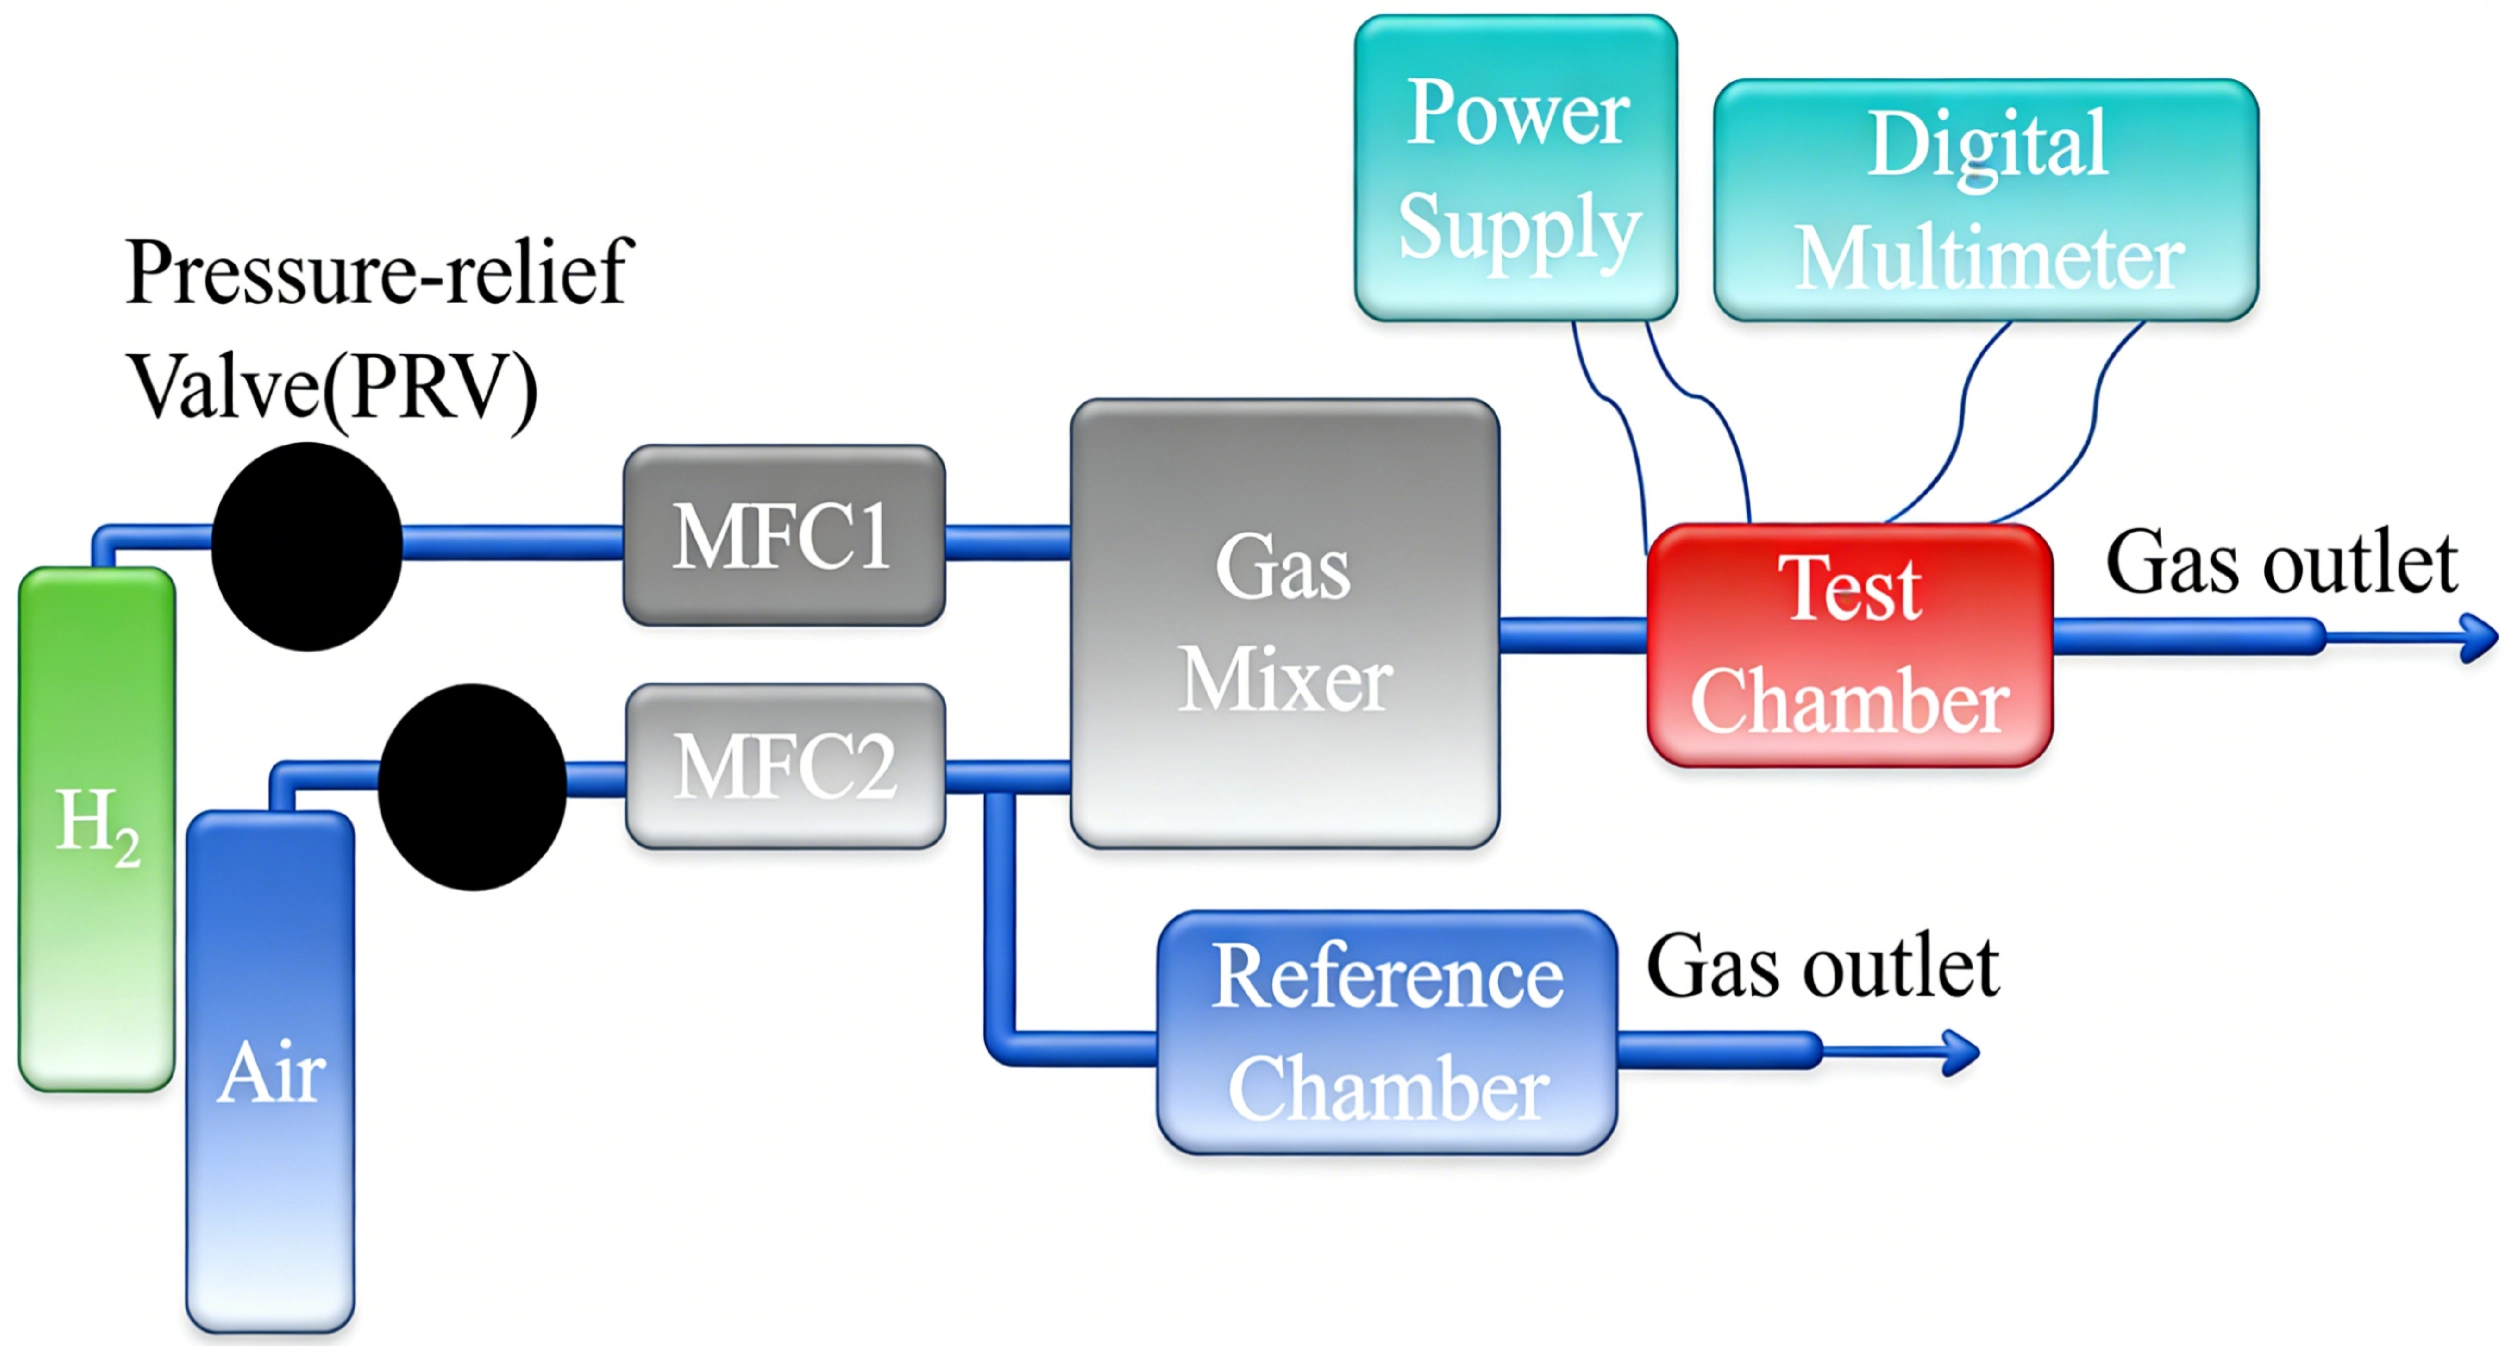
Figure 2. Schematic diagram of the basic experimental setup for testing a TCHS. TCHS: thermal conductivity hydrogen sensor; MFC: mass flow controller.
Three primary operating modes exist: steady-state mode, transient-state mode, and sweep-heating mode. These methods share fundamental similarities, including the necessity for prior calibration and susceptibility to the same environmental influences, differing primarily in data acquisition and signal processing[52].
2.1 The steady-state sensing mode
When a constant current is applied, the steady-state temperature of the heating element varies with the thermal conductivity, and thus the concentration of the ambient gas. Two identical sensing elements, made from materials with a high temperature coefficient of resistance (TCR) to enhance sensitivity, can be configured as two arms of a Wheatstone bridge, each exposed to a different atmosphere, as illustrated in Figure 3a. The remaining two arms consist of either variable resistors for bridge balancing or fixed resistors in an unbalanced configuration. When both the sensing and reference elements are exposed to the same gas, their heat dissipation characteristics are equivalent, resulting in no output signal as the bridge remains balanced. Upon exposure to hydrogen, the change in thermal conductivity of the ambient gas alters the temperature, and consequently the resistance of the sensing element relative to the reference element, generating an electrical output signal proportional to the hydrogen concentration.
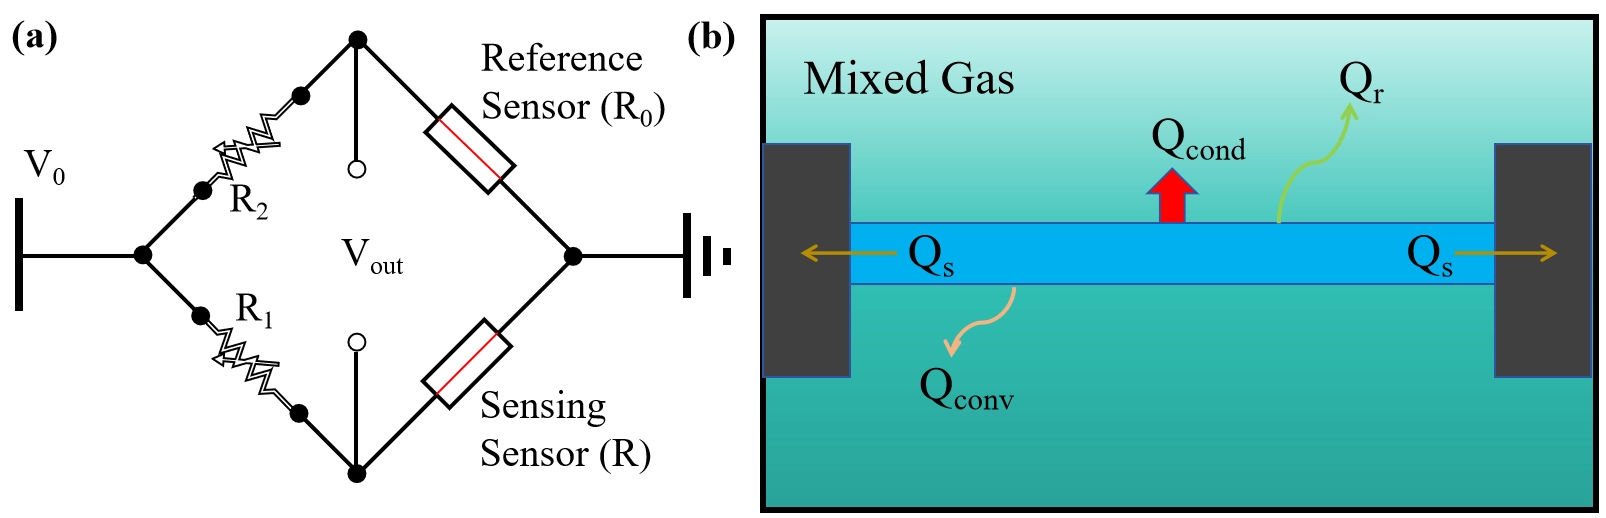
Figure 3. (a) Schematic of the typical operating circuit in a TCHS system; (b) Schematic of the heat transfer pathways from the heating element. TCHS: thermal conductivity hydrogen sensor.
The basic heat transfer pathways within the chamber are illustrated in Figure 3b. When the heater’s temperature is relatively low (typically < 400 °C[58]), radiative heat loss (Qr) can be neglected. Through optimized structural designs[10,14,59,60], heat loss through the substrate (Qs) can also be minimized to negligible levels. The total heat loss, Q, is predominantly governed by gas-mediated heat transfer, which includes conduction (Qcond) and convection (Qconv), with forced convection being the dominant mechanism.
At steady state, energy balance dictates that the rate of heat transfer from the heating element to the ambient gas equals the rate of heat generation within the element. This relationship can be expressed as follows[61]:
Where
The left-hand side of Eq. (2) represents the dissipated electrical power, expressed as I²R, where I denotes the applied current and R denotes the resistance of the heating element at temperature T. For common metals and doped silicon, the temperature dependence of resistance can be described using a linear model as follows:
where R0 is the reference resistance, which is simplified as the resistance of the reference element at temperature TR. Substituting Eq. (3) into Eq. (2) yields:
The temperature change of the heater can then be expressed as follows:
Therefore, the inverse of the temperature change is proportional to h.
Upon hydrogen introduction, changes in the thermal conductivity of the ambient gas induce a temperature difference between the sensing and reference elements, resulting in an electrical output signal[64], which can be expressed as follows:
where R1 and R2 are the resistances of the other two resistors, and V0 is the input voltage. Alternatively, the hydrogen concentration can be determined by adjusting the resistance of the variable resistors to rebalance the bridge, under equilibrium conditions satisfying the following relation:
This mode offers simple signal acquisition. It measures stable signals once thermal exchange reaches equilibrium, resulting in minimal fluctuation and low drift. However, it is limited by slow response time[65] (due to the requirement for thermal equilibrium) and high power consumption[12,59,65].
2.2 The transient-state sensing mode
The sensor can also operate in transient-state mode, wherein the biasing conditions vary over time. The transient-state mode involves applying periodic current pulses to the heater, capturing its dynamic response characteristics[61]. The heating duration should be selected such that the heating element reaches a steady-state temperature, while sufficient cooling time between pulses prevents thermal accumulation from prior cycles[66]. This mode emerged at a later stage, with its conceptual origins traceable to the transient hot-wire method used in thermal conductivity measurements[67]. Advances in microfabrication technology have enabled the fabrication of sensors with low thermal mass, allowing for rapid thermal response to pulsed excitation due to their ability to heat up and cool down quickly[61,68].
Under the transient-state mode, the temperature of the heating element changes rapidly over time, enabling the neglect of convective heat transfer. Consequently, heat transfer between the heater and the surrounding gas occurs predominantly through conduction[52]. The heat transfer coefficient can be approximated by the thermal conductivity of the ambient gas, denoted as km. The heater’s temperature rises from TR to a steady elevated temperature. By incorporating the transient term, Eq. (4) is extended to:
where ρ is the density of the heating element, CP is the specific heat capacity at constant pressure, and V is the volume. The time-resolved temperature solution of Eq. (8) is given by[61]:
where τ is the thermal time constant, defined as the time required for the heater’s temperature to reach 63.2% of its maximum value:
The inverse of τ is proportional to the thermal conductivity, a relationship that can be utilized for sensing purposes.
Compared to the steady-state mode, this mode offers faster response times (excluding the time required for gas introduction). Crucially, it requires power supply only during current pulses, resulting in significantly lower power consumption[60,61,68]. However, it should be noted that the heater’s temperature undergoes rapid dynamic changes, making the output susceptible to environmental temperature fluctuations and flow velocity variations. Prolonged operation may lead to significant drift, and repeated heating and cooling cycles can reduce the sensor’s operational lifespan. Furthermore, this mode necessitates high-precision pulse control circuits and high-speed data acquisition modules, inevitably increasing costs.
2.3 The sweep-heating sensing mode
Recently, Harumoto et al.[11,15] proposed an operating mode termed sweep-heating, which is based on current sweeping and can be regarded as a derivative of the transient-state mode. A Platinum (Pt) thin-wire was used as the sensing element, and N2 was used as the carrier gas by the authors.
A SMU is used to generate the current sweep. During each sweep, the current increases stepwise from an initial to a final value and then returns to the starting point, as shown in Figure 4a. The corresponding output voltage in pure nitrogen and hydrogen atmospheres is shown in Figure 4b. The resistance of the Pt thin-wire also changes in steps, as shown in Figure 4c, and the I-V characteristics of the Pt thin-wire during the sweep heating are shown in Figure 4d. Each sweep cycle generates a large amount of data; even if certain measurements fail, the desired information can still be extracted from the remaining data, demonstrating the robustness and high reliability of this operational mode.
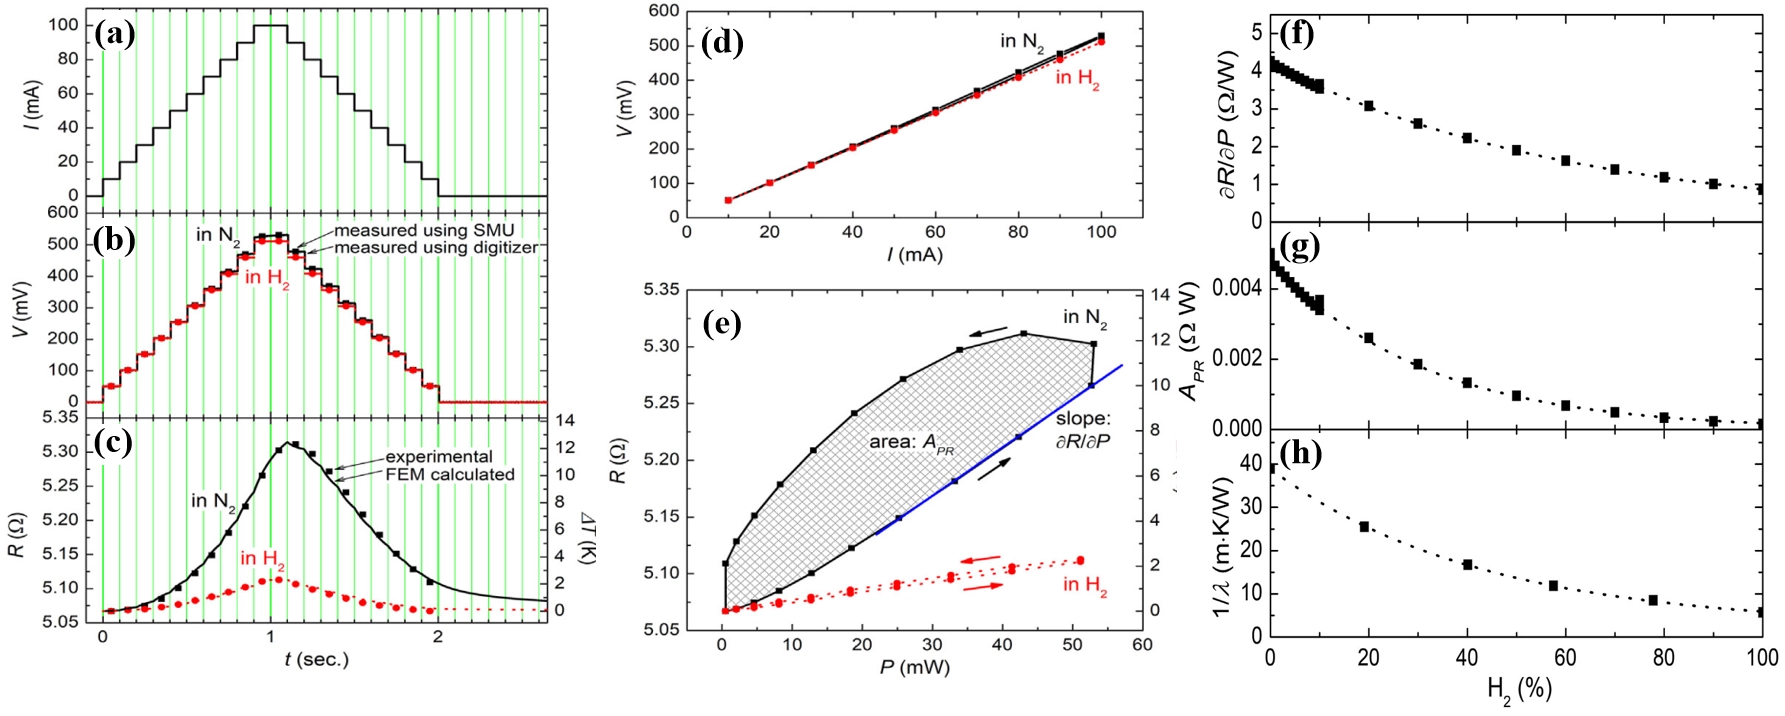
Figure 4. (a) Stepped sweep current applied to the metallic thin-wire using a SMU; (b) Variation of the output voltage signals with respect to the applied current in nitrogen and hydrogen atmospheres, respectively; (c) Resistance (R) of the wire during sweep heating. As shown on the right-hand axis, the increase in R can be converted into temperature rise using the TCR. The corresponding temperature profiles obtained from FEM simulations are represented by solid lines; (d) I-V characteristics of the thin-wire during sweep heating; (e) Relationship between input power and resistance; H2 concentration dependences of (f) slope (∂R/∂P) and (g) area (APR) of P-R diagram of the thin-wire; And (h) is the inverse of the thermal conductivity of H2-N2 gas mixture (room temperature and atmospheric pressure). Republished with permission from[11]. SMU: source measurement unit; TCR: temperature coefficient of resistance; FEM: finite element method.
The authors noted that the differential parameters ∂R/∂P and APR derived from the power-resistance (P–R) diagram (Figure 4e), are sensitive to the thermal conductivity of the ambient gas (i.e., concentration of hydrogen), as shown in Figure 4f,g,h. The exponential decrease is confirmed, which can be elucidated by the inverse of the thermal conductivity of N2-H2 gas mixture. This can be used to detect the thermal conductivity of the ambient gas, or the concentration of hydrogen.
The advantages of this model are that the sensor’s lifespan is significantly extended in this mode, as the peak operating temperature is close to room temperature. In contrast, conventional sensors typically require temperatures of several hundred degrees Celsius to minimize the thermal conductivity difference between interfering gases and the carrier gas (e.g., N2)[69], as shown in Figure 5. Furthermore, the compensator to compensate the ambient temperature is not required, as the ambient temperature can be obtained by the resistance of the thin wire at small currents, where self-heating is small. This is helpful in reducing the cost. Furthermore, this step-by-step operation is well matched to contemporary sensor driver integrated circuits, which consist of digital components, such as microcontroller units, digital-to-analog and analog-to-digital converters. It may be envisaged that by sequentially varying other critical parameters of the heating pulse, such as frequency and duration, capturing dynamic response curves across the full sweep range, and extracting multidimensional characteristics, more precise detection can be achieved. Nevertheless, a complete sweep requires heating and signal acquisition at multiple points, generating large volumes of data, which imposes higher demands on hardware and computational processing power.
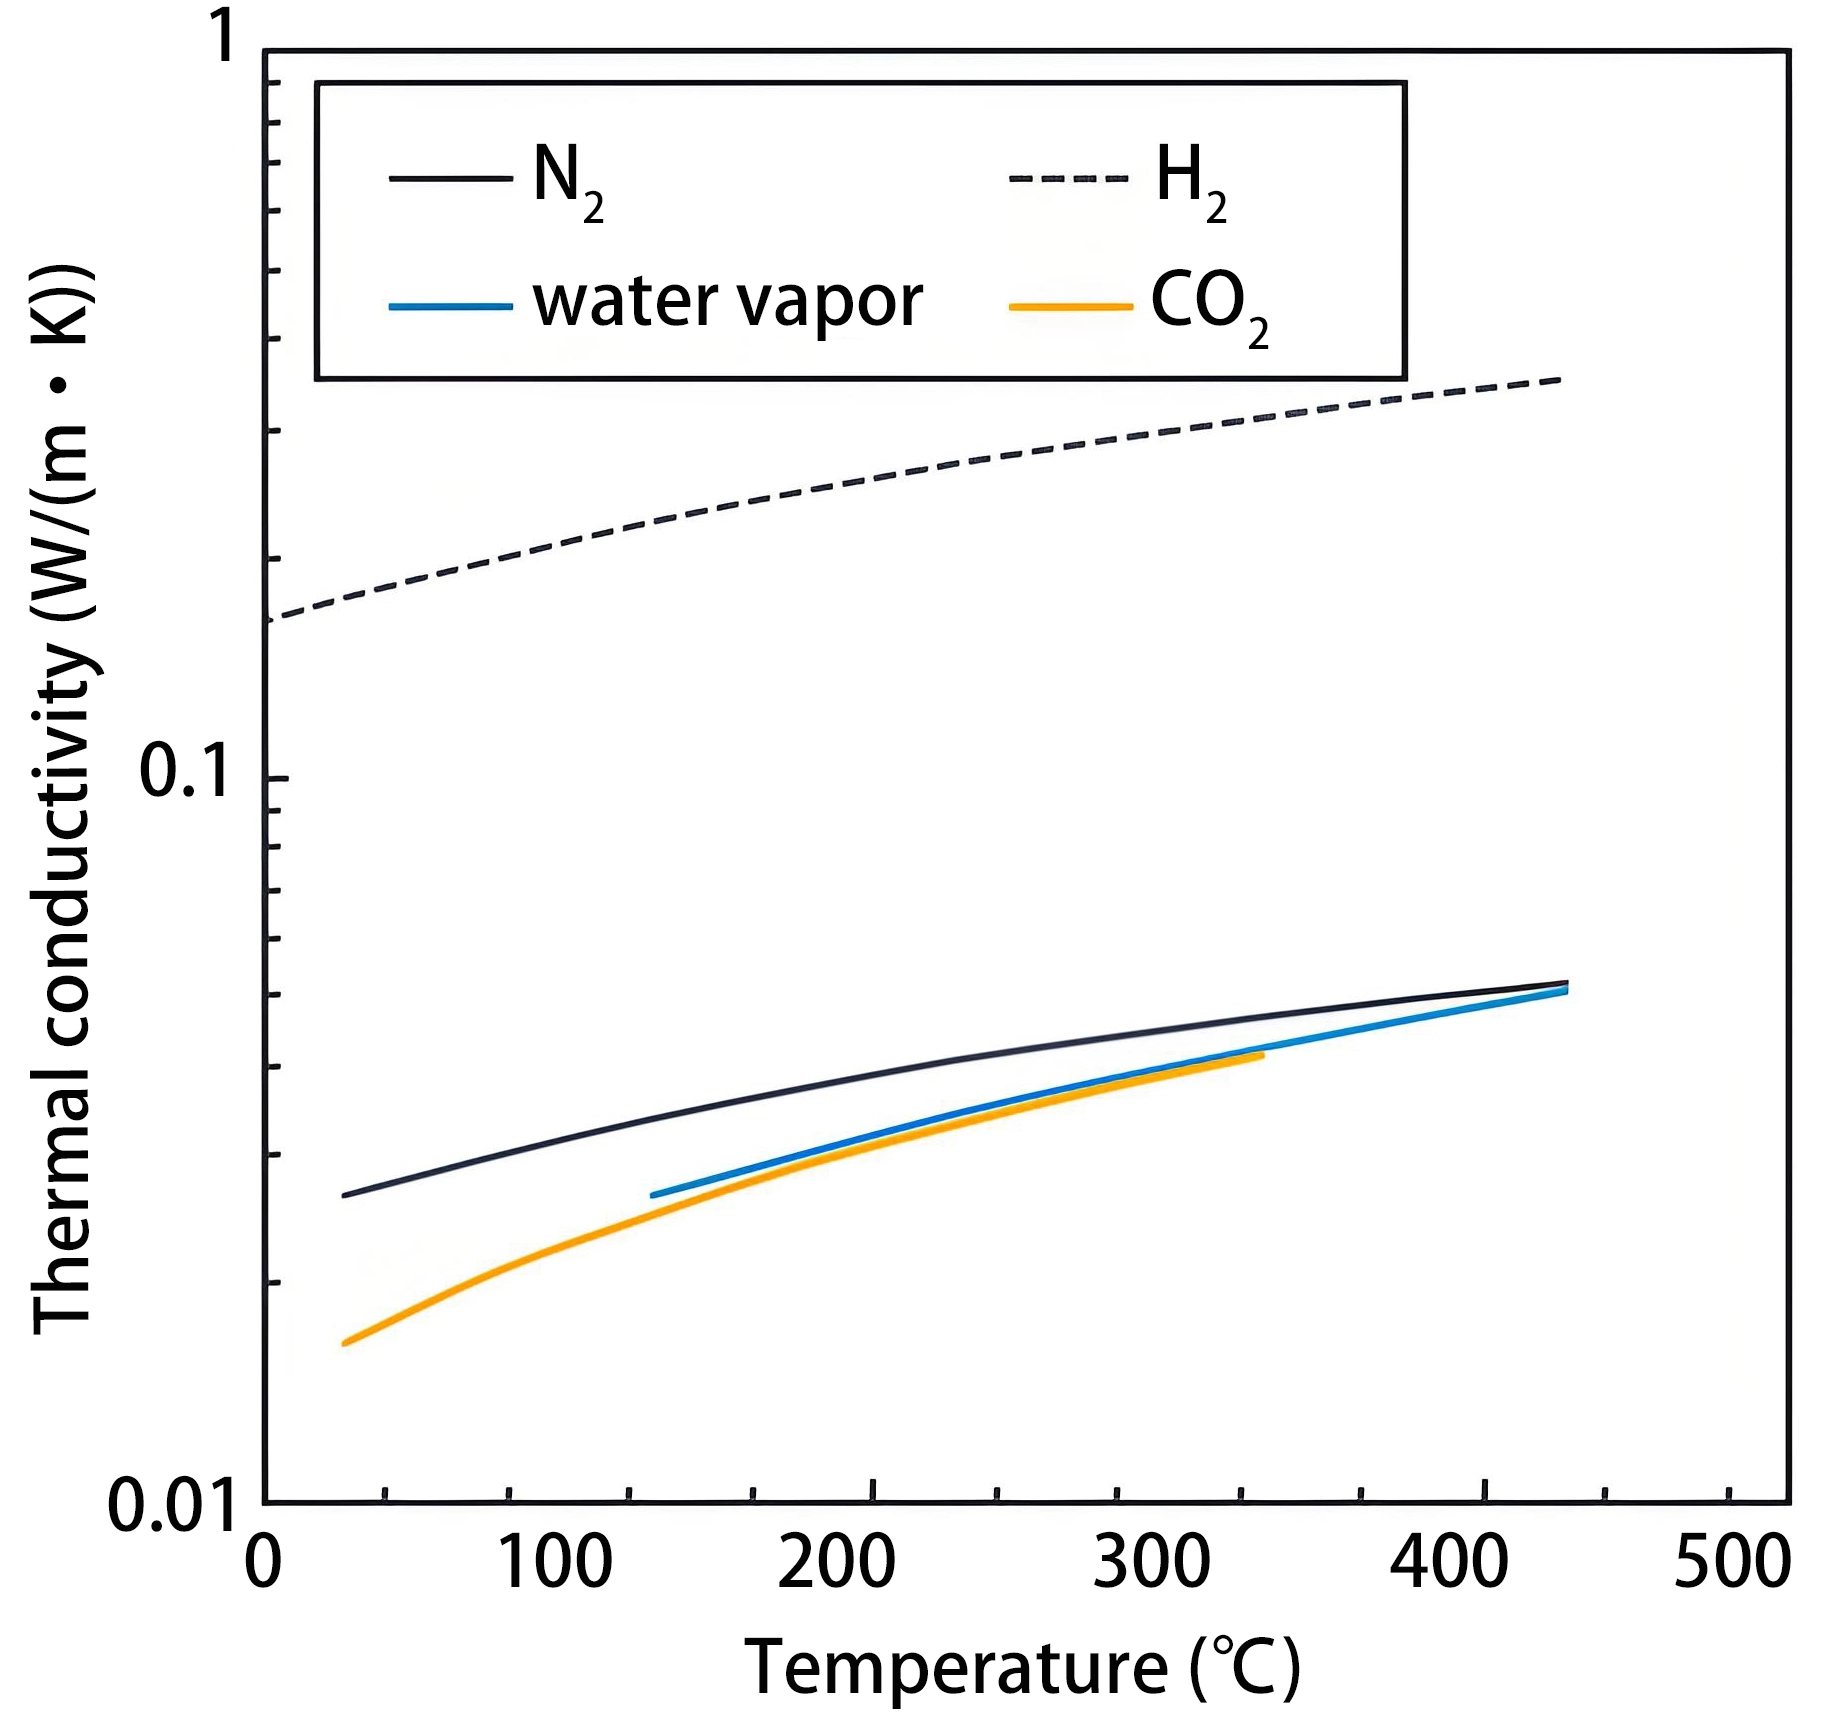
Figure 5. Temperature dependence of thermal conductivity of some gases. Republished with permission from[69].
A unified workflow applicable to all the operating modes is illustrated in Figure 6. Regardless of the operation mode, several common challenges remain. First, additional heat loss mechanisms persist, potentially reducing the temperature rise of the heating element, or resulting in unnecessary power consumption, particularly in portable devices. To mitigate these issues, optimization of sensor geometry and design is essential, while maintaining structural robustness and manufacturing feasibility. Many researchers achieve thermal decoupling between the heating element and the substrate with suspended structures[10,14,59,60], whereas others implement thermal insulation via multi-layer structural designs[70].
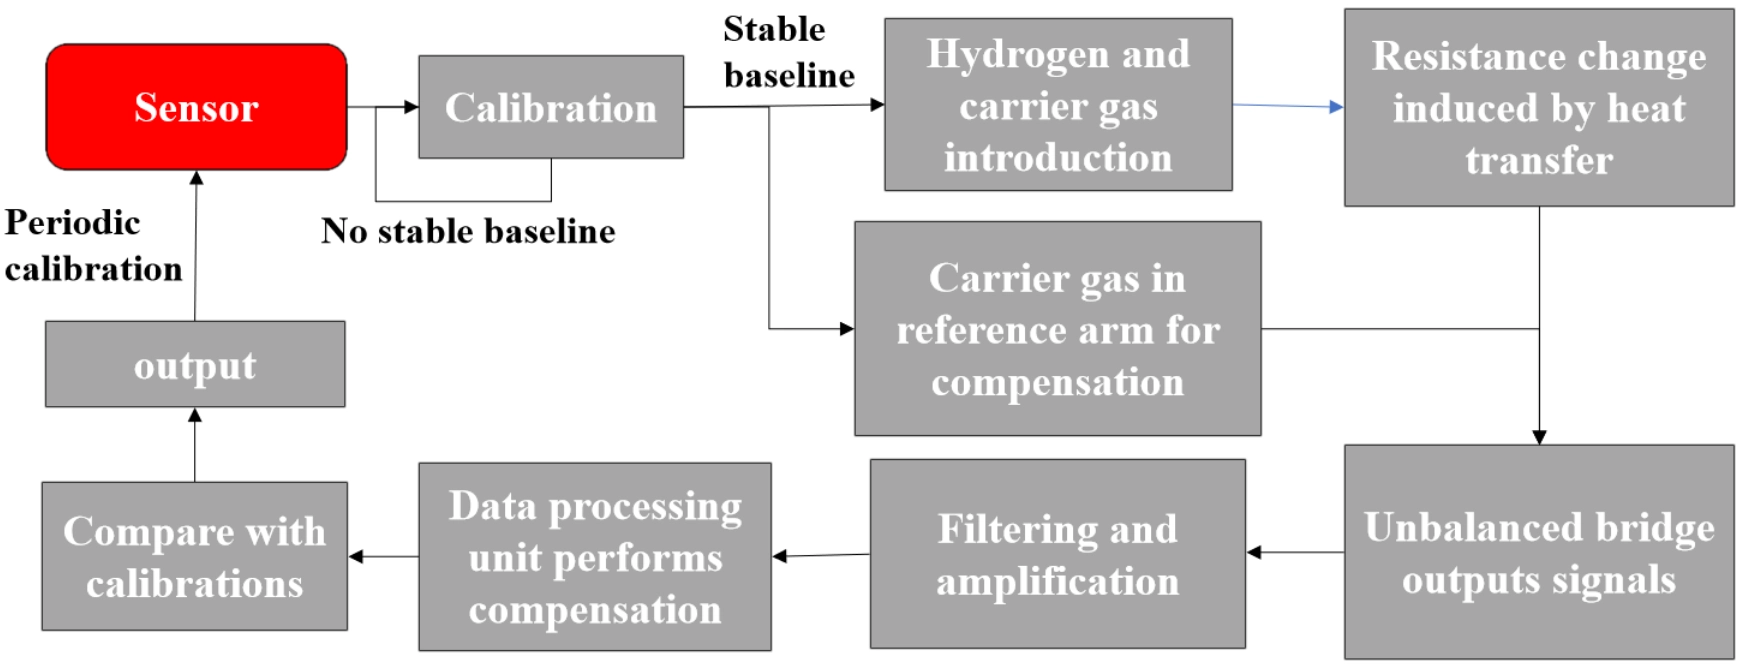
Figure 6. General workflow of a modern TCHS sensing system. TCHS: thermal conductivity hydrogen sensor.
Second, hydrogen diffusion and the establishment of thermal equilibrium lead to a complex temperature distribution within the chamber, that is challenging to characterize accurately. The assumption of uniform gas temperature is a rough simplification. However, advances in computer science and numerical computation methods have enabled simulations of this distribution, thereby facilitating a comprehensive understanding of heat transfer processes within the chamber. This remains both a valuable and challenging research topic. Figure 7 presents a scanning electron microscopy image of a representative suspended structure along with corresponding temperature distribution simulations[71]. Since the thermal conductivity of a gas is temperature-dependent, as illustrated in Figure 5, the presence of a temperature gradient within the chamber can modulate the heat transfer efficiency between the heater and the surrounding gas.
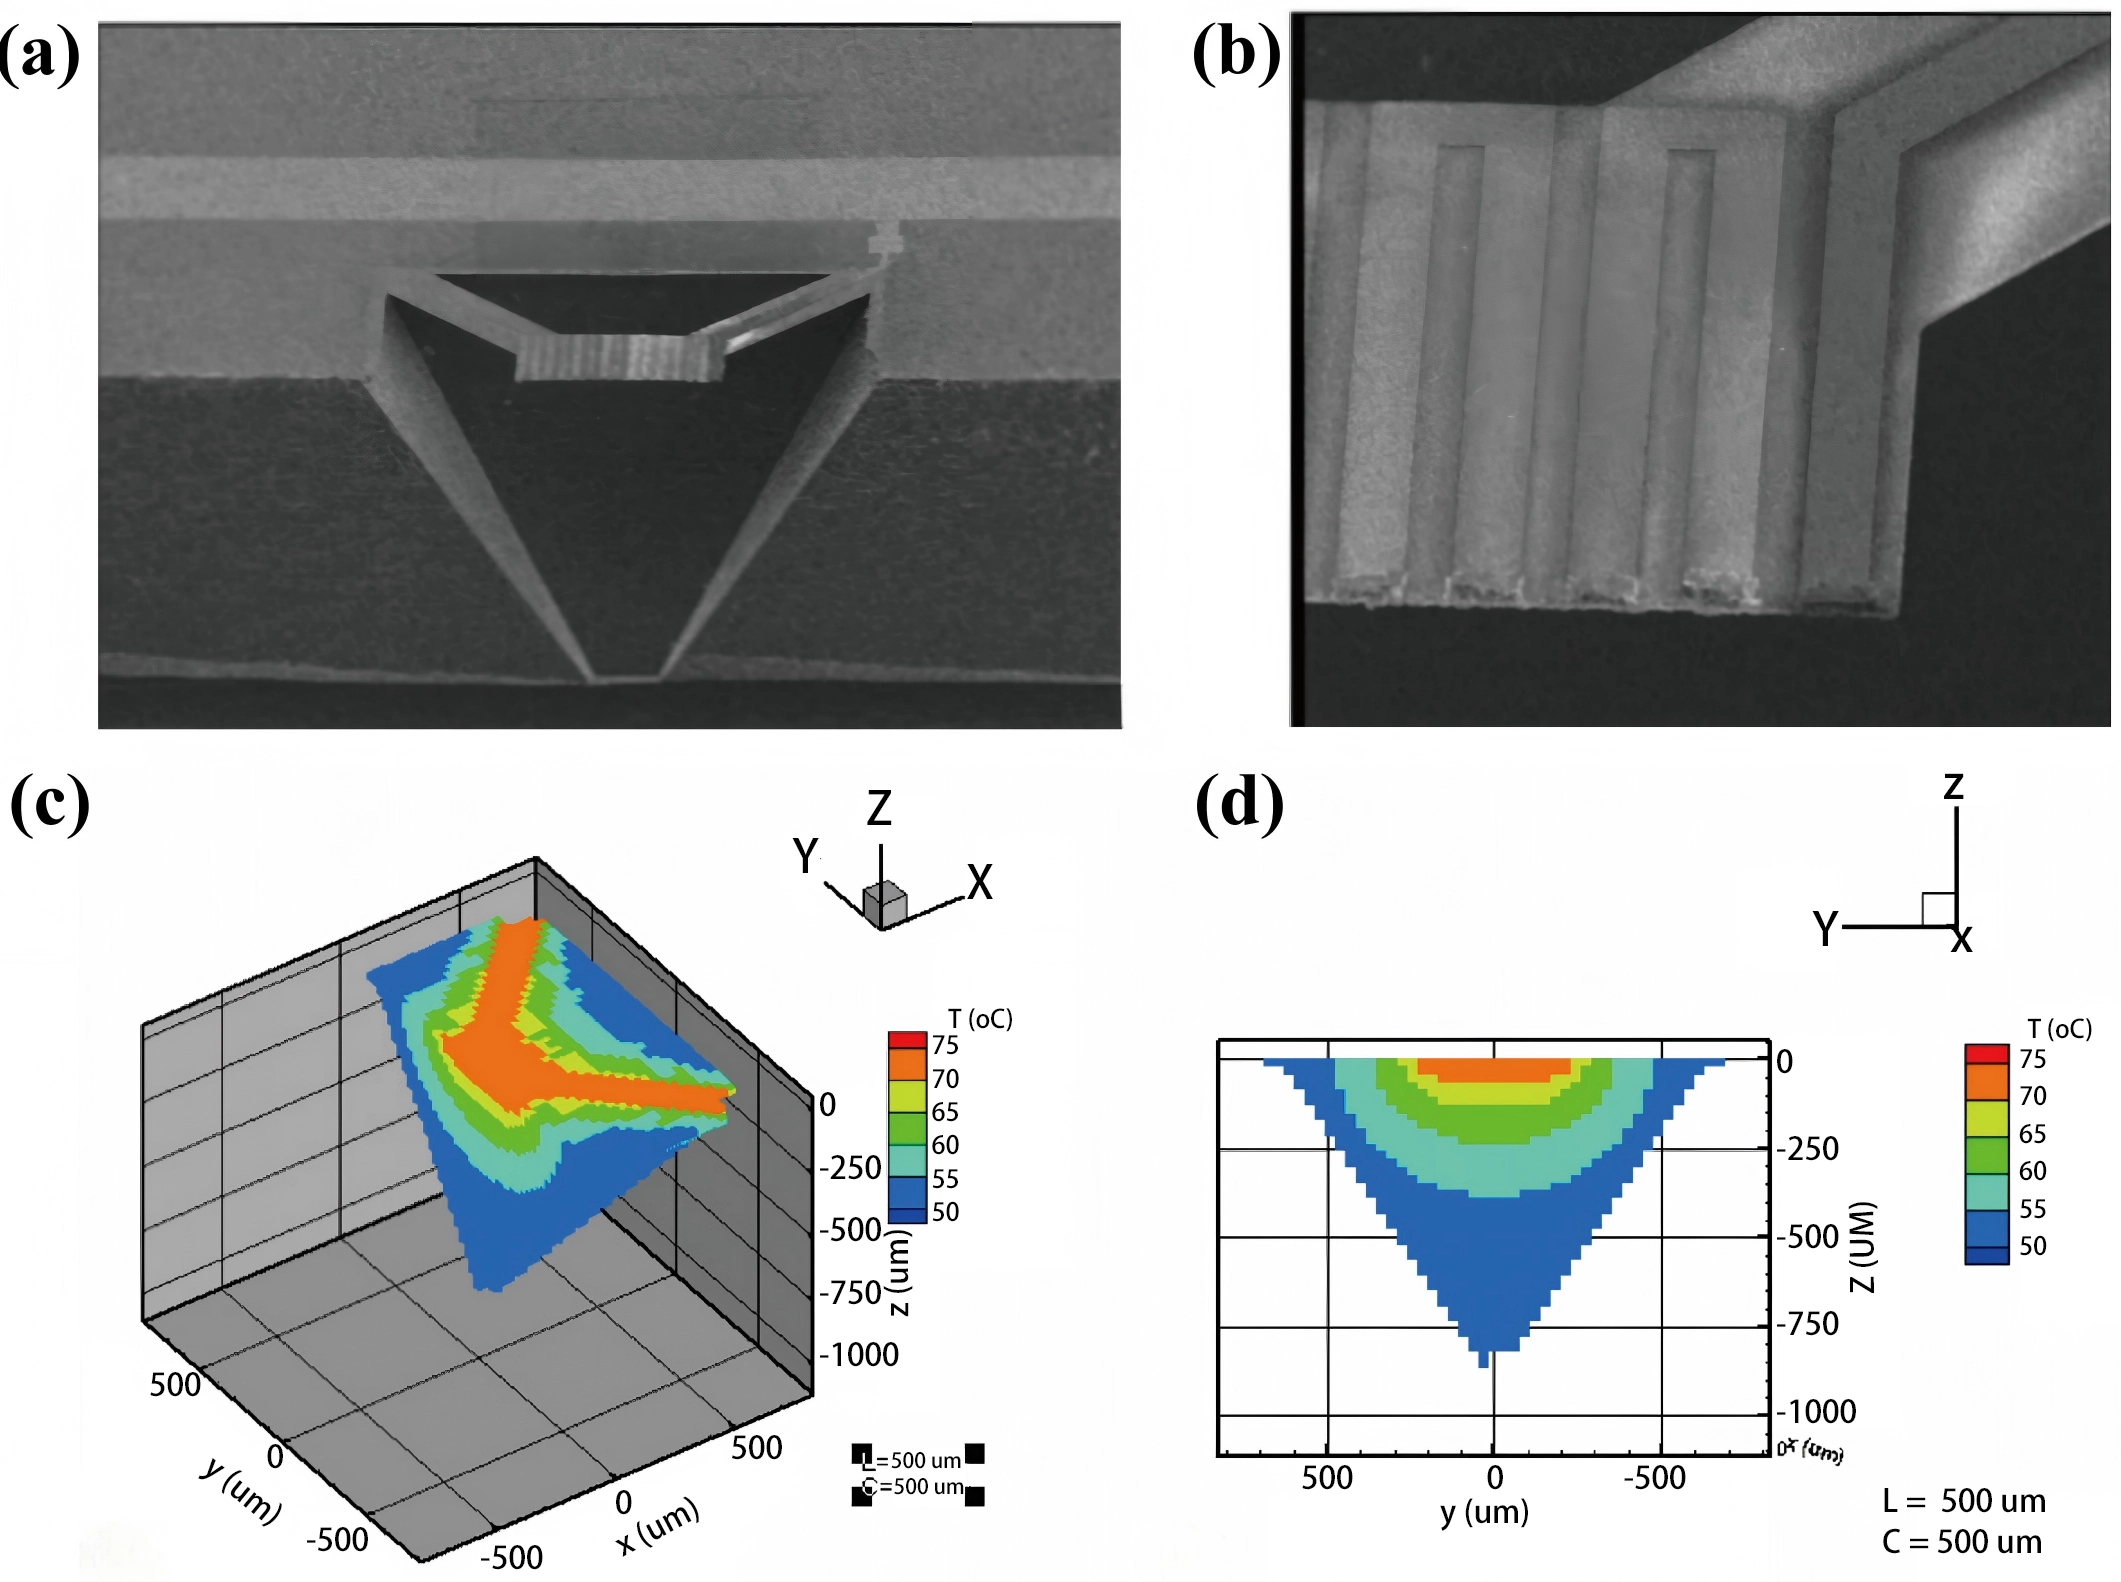
Figure 7. (a) SEM cross-sectional view of the suspended structure in a TCD; (b) Top-down SEM image of the heating element; (c) 3D simulation of the temperature distribution within the chamber; (d) Simulated temperature profile across the sensor cross-section at the X = 0 plane. Republished with permission from[71]. SEM: scanning electron microscopy; TCD: thermal conductivity detector; 3D: three-dimensional.
It is worth noting that the operating principle of TCHS can be modified[42,52]. This configuration involves maintaining a heating element and a cold element within the same chamber. Upon hydrogen introduction, additional power is required to sustain the constant temperature difference between the two elements, which correlates with the hydrogen concentration. Given the low thermal conductivity of gases, minimizing the distance between the elements is essential. However, this may introduce new challenges, such as significant enhancement of near-field radiative heat transfer, which can exceed far-field radiation by several orders of magnitude[72-74]. At the microscopic level, molecular-mediated heat transfer represents a promising research direction. Furthermore, suppressing interference from other heat transfer mechanisms and extracting useful signals remain significant theoretical and experimental challenges.
2.4 Thermal conductivity of gas mixture
Considerable efforts have been devoted to developing practical models for the effective thermal conductivity of gas mixtures, aimed at guiding the design of TCSs. Hydrogen is a difficulty for unified equations because it allows a stronger interaction in collisions than other molecules and atoms due to its small size[75]. This section presents several representative models, and analyzes their advantages and limitations. Taking into account the typical operating conditions of TCHS, this analysis focuses on low-pressure hydrogen-containing mixtures.
2.4.1 Molar-fraction-weighted sum
In simple analysis, the thermal conductivity of a gas mixture can be approximated as the molar-fraction-weighted sum of the thermal conductivity of individual components[76]:
where km denotes the thermal conductivity of the mixture, xi represents the molar fraction of component i, and ki denotes its thermal conductivity in isolation. Eq. (11) is formally simple, but does not fit the experimental facts in most cases[77], which is suitable for quick estimation but lacks accuracy.
Mathur et al.[78] proposed an empirical equation that has been widely adopted in various engineering codes nowadays, as it is relatively simple and precise for multi-component mixtures:
The average relative error for Eq. (12) is less than 5% for mixtures containing hydrogen, but it has little theoretical ground, and maybe a lucky combination of mole fractions and the thermal conductivity of individual components[75].
Udoetok[79] recently proposed a simple formula for binary mixtures, in which he considered the thermal resistances of different gases and their parallel and serial connections:
In fact, when the mixture is a binary mixture, Eq. (12) is equivalent to Eq. (13). Eq. (13) is suitable for mixtures of gases with similar densities and polarities. For example, for an H2-He mixture at ~300 K, calculation errors are less than 5%. However, if hydrogen is mixed with heavy gases, such as CO2 and O2, it is not recommended in non-zero gravity conditions, as these gases may not be able to mix thoroughly without external force[79], which consequently causes the assumptions of this model to become invalid.
In general, the molar averaging is formally simple and easy-to-use, but it tends to skew the contributions of light and heavy components, potentially underestimating the influence of heavier species on the mixture’s thermal properties[80]. Thus, the method is more applicable to the mixtures of gases with similar properties, such as polarity, density, and so on.
2.4.2 Wassiljewa equation
Most existing techniques to calculate the thermal conductivity of gas mixtures of n components are essentially empirical, and can reduce to some form of the Wassiljewa equation:
where Aij is an adjustable parameter, which is a measure of the ratio of the efficiencies with which molecules j and molecules i impede the transport of heat by molecules i[81]. Mason and Saxena[82] proposed an expression of Aij derived from kinetic theory using well-defined approximations:
where ηi and Mj are the viscosity and the molecular weight of the component i, respectively. The parameter 1.065 is an empirical factor for gas mixtures containing hydrogen. This model is recommended for nonpolar and polyatomic gases, such as the H2-O2 mixture[75]. Errors will generally be less than 3-4%, but for nonpolar-polar and polar-polar gas mixtures, it was found to be somewhat not applicable, in which errors greater than 5 to 8% may be expected[83].
Lindsay and Bromley[54] also proposed that Aij can be calculated from the gas viscosity (μ), molar mass (M), Sutherland constant (S), and temperature (T), which is suitable for binary mixtures:
They used the experimental data of 85 common binary mixtures under normal temperature and pressure to test their model, including H2-CO2 mixture (273 K), H2-N2 mixture (273 K), and so on. The average error was found to be 1.9%. However, for a mixture of multiple components, this model does not yield better results than the model proposed by Mason and Saxena (Eq. (15)).
2.4.3 Corresponding states method
It is worth noting that Chung et al.[84] proposed a formula for gas mixtures containing hydrogen, which is not based on the mixture component thermal conductivity, but rather on other properties of the mixture:
where R is the universal gas constant, ηm is the viscosity of the mixture, and Mm is the molecular weight of the mixture. ψ is a complex function of the mixture’s critical temperature, dipole moment, heat capacities, and so on. The advantage of this method is the fact that the thermal conductivity of each pure component is not required. But the accuracy of Eq. (17) is a little worse than the models proposed by Mathur (Eq. (12)) and by Mason and Saxena (Eqs. (14) and (15)).
Apart from the models mentioned above, Hirschfelder et al.[85], Curtiss et al.[86] and others developed a series of models, such as the Curtiss-Hirschfelder model, most of which are quite complex to use, and must be selected with care. Zhukov et al.[75] and Emperhoff et al.[87] provided more detailed discussions on several of them. In general, when the temperature and pressure are not too high (the most common working scenario for TCHS), Eq. (14) with the Mason-Saxena relation for Aij (Eq. (15)) is the most suitable for calculating the thermal conductivity of mixtures containing hydrogen.
3. Key Performance Parameters
Sensors exhibit distinct performance characteristics, as illustrated in Figure 1. Generally, the following key parameters can be used to evaluate the overall performance of a TCHS[88].
3.1 Response
The response depicts the alteration in the resistance, current, or voltage of the sensor under the exposure of hydrogen. In its resistance-based form, the response of the TCHS is[89]:
3.2 Sensitivity
The sensitivity (S) reflects the sensor’s response to slight variations in hydrogen concentration, which is always defined as the change in the response of the sensor per unit concentration[90]. From the response curve, a steeper curve indicates a greater sensitivity[44].
where ΔC represents the change in hydrogen concentration. A high sensitivity implies that small changes in hydrogen concentration can be measured easily.
3.3 Response/recovery time
The response time (T90) is defined as the time interval between the instant when an instantaneous change occurs from the carrier gas to hydrogen at the sensor inlet, and the moment when the sensor response reaches 90% of its maximum value. The recovery time (T10) is defined as the interval between the instant when the gas reverts instantaneously from hydrogen to the carrier gas at the inlet and the time when the response attains 10% of the previous maximum value[57].
In practice, the transition between the carrier gas and hydrogen is not instantaneous. Consequently, any experimental measurement of the response or recovery time of TCHS inherently includes the time required for the hydrogen concentration to reach the target level, whether by diffusion or under dynamic flow conditions, a contribution commonly referred to as the extrinsic time (T0)[91]. T0 can be minimized through careful design of measurement methodologies and apparatus to reduce the delivery time of hydrogen to the sensing element as much as possible[57,92-94], thereby enhancing the sensor’s overall response speed. Sensors with fast T90 and T10 are better suited for dynamic detection applications. Early TCHS suffered from inherently long response times[57] due to the operating principles and structural designs. However, MEMS technology enables significant miniaturization of TCHSs and shortens the thermal conduction path[95], effectively reducing the T90 and T10 (several seconds or even shorter[59,61,96]).
3.4 Selectivity
The ability of the sensor to respond to a specific gas in a gas mixture can be called the selectivity, which can be characterized by the selectivity coefficient:
where QX denotes the selectivity coefficient of the gas ‘X’ to another gas ‘Y’, SX and SY are sensitivities of the sensor to gases ‘X’ and ‘Y’, respectively[97]. If there is high selectivity to hydrogen, the cross-sensitivity to other gases will be low and the results will be less ambiguous. According to Eq. (20), either boosting the reaction to the target gas or decreasing the interference signal can improve the selectivity of a sensor[98].
TCHSs generally show a reduced selectivity as, when gases with thermal conductivity similar to H₂, such as He, are introduced into the TCHS, the measured value of hydrogen concentration may be higher than the actual value[46]. Consequently, they are typically used for analyzing gas mixtures with known compositions. Nevertheless, with advances in smart gas sensing technology, the issue of cross-sensitivity can be addressed effectively with sensor arrays[56,99-101], where a set of gas sensors, each individually designed for a particular analyte, are used with postprocessing methods. A highly selective system that can distinguish different gases is the consequence of this combination[46], which will be discussed in detail in Section 6.
3.5 Measuring range
Measuring range denotes the concentration range within which a TCHS can measure the hydrogen concentration under the specified accuracy and stability requirements[98], including the lowest and highest values. For hydrogen detection, measurements should be completed before the concentration reaches the lower explosion limit[102]. TCHS exhibits a notably broad measurement range (up to 100 vol.%), surpassing that of many other sensor types. However, it faces challenges in trace detection due to minimal heat exchange at low gas concentrations.
3.6 Limit of detection
The limit of detection (LOD) is defined as the minimum concentration of hydrogen at which the TCHS can reliably distinguish the concentration signal from the baseline noise, which is a key parameter for measuring the trace detection capability of TCHS. According to the recommended standards of the International Union of Pure and Applied Chemistry[103], the calculation of LOD follows the core principle based on baseline noise and the sensitivity (there is deviation from the actual measured LOD):
where σ is the standard deviation of the sensor’s baseline signal, which is usually obtained by introducing pure carrier gas and collecting a sufficient number of baseline data points. The number of measurements should be as large as possible to enhance the credibility. Generally, when the gas concentration is less than 500 ppm, it falls within the range of trace detection, which demands a relatively low LOD of the sensor. However, TCHS faces challenges in trace detection due to minimal heat exchange at low concentrations. The LOD of TCHS is synergistically affected by various factors. Among them, the composition of baseline noise is more complex, mainly including thermal noise, circuit noise, and gas flow fluctuation noise, which together determine the value of σ. Therefore, optimizing the LOD of TCHS needs to simultaneously reduce noise interference and improve the sensor sensitivity.
3.7 Lifespan
The lifespan refers to the maximum continuous operating duration under specified conditions, while maintaining acceptable performance stability. TCHSs are often preferred for long-term detection applications due to their operation based on purely physical principles, avoiding chemical reactions, electrode oxidation, and electrolyte depletion. As a result, they exhibit low maintenance requirements and an exceptionally long lifespan (> 5 years[42]), representing one of their key advantages. In contrast, MOS sensors undergo grain growth and a reduction in active sites during prolonged high-temperature operation[56], leading to deterioration in sensitivity and stability and increased susceptibility to contamination[104]. Electrochemical sensors suffer from gradual electrolyte depletion and electrode degradation caused by oxidation or poisoning, along with risks of electrolyte evaporation and leakage[105]. In catalytic combustion sensors, precious metal catalysts may experience deactivation due to high-temperature sintering and poisoning, as well as potential aging and shedding[45]. Optical sensors are sensitive to temperature and humidity variations, and contamination will impair signal transmission[37].
4. Key Components and Structure
The structure of a sensor directly influences its response speed, sensitivity, and stability. TCHS structures are primarily categorized into two types: conventional bare metallic thin wires and MEMS-based conductive wires.
4.1 Conventional bare metallic thin wire
The conventional bare metallic thin wire represents the earliest commercialized sensor structure, with a history tracing back to thermal conductivity gas analyzers developed in the early 20th century[76,106,107]. Prior to the emergence of MEMS technology, it was widely adopted due to its simple design and ease of fabrication. A schematic illustration of a sensor incorporating this structure is presented in Figure 8.
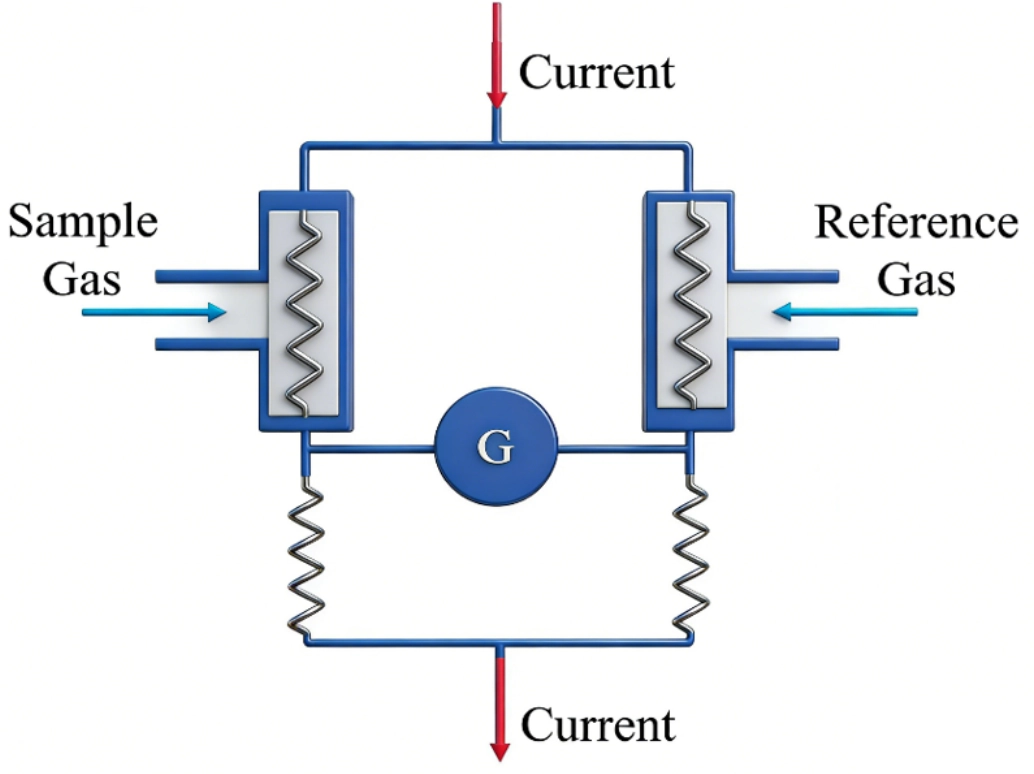
Figure 8. Schematic of a sensor featuring a conventional bare metallic thin wire as the sensing element.
The core fabrication processes typically include material selection, wire drawing, insulation treatment, and encapsulation. Pt has been the most commonly used material owing to its stable physicochemical properties, ease of shaping, and highly linear resistance–temperature relationship[108]. It is typically drawn into wires with diameters ranging from 20 to 100 μm and wound into spirals measuring 5 to 20 mm in length[106,109] to increase the relative heat exchange area, and subsequently coated with glass or ceramic for mechanical and environmental protection[110].
This structure demonstrates high temperature resistance, corrosion resistance, excellent stability, and a long lifespan. However, it is relatively bulky and exhibits high thermal inertia, resulting in slow gas renewal and consequently prolonged response times. The advancement of MEMS technology has led to the gradual replacement of these conventional elements by MEMS-based conductive wires. Nevertheless, recent work by Harumoto et al[15] demonstrated that this traditional structure still possesses significant potential. By implementing the sweep-heating mode, they developed a sensor based on a single Pt wire that achieves performance comparable to MEMS-based sensors. It is capable of detecting hydrogen concentrations as low as 3,000 ppm near room temperature, with a peak power consumption of 0.053 W and a single measurement time of 2.7 s.
4.2 MEMS-based conductive wire
MEMS technology, developed in the 1960s and significantly advanced in the 1980s, along with innovations in photolithography[111], thin-film deposition, and 3D printing technologies[112], enables the integration of micro-sensors, micro-actuators, mechanical structures, and signal processing circuits onto a single chip. A comprehensive discussion of MEMS technology is provided by Gardner et al.[113]. MEMS-based TCHS offers several distinct advantages, including miniaturization, low power consumption, high sensitivity, and scalability for mass production[114]. To a certain extent, MEMS has driven a revival of TCHS applications.
The fabrication of a MEMS-based TCHS typically involves three stages[115]: structural design, device fabrication, and performance testing. Among these, structural design constitutes the top-level framework and requires the establishment of an optimal heat transfer pathway between the sensing element and the ambient gas. Typically, a silicon wafer or glass substrate is selected, cleaned, and thermally oxidized to form an insulating layer, as illustrated in Figure 9a. Subsequently, photolithography is employed to define the desired patterns, as shown in Figure 9b,c,d. A metal layer with high temperature coefficient of resistance, such as Pt, is deposited using techniques like sputtering or plasma-enhanced chemical vapor deposition (PECVD), followed by selective etching to remove excess material, as depicted in Figure 9e. A thin adhesion layer of Cr or Ti is first deposited to enhance the interfacial bonding. Finally, the structure is released to form a suspended configuration via simultaneous back-side etching of the substrate and front-side etching of the element, as demonstrated in Figure 9f,g,h, which is a critically important step[116]. Although MEMS-based sensors are significantly smaller and consume less power than their conventional counterparts, the proportion of heat dissipated into the substrate increases[117,118], particularly when the substrate exhibits low thermal resistance. Though the substrate also exchanges heat with the surrounding gas, this contribution is not considered part of the measurable sensing signal. Suspended structures effectively minimize such losses, as heat conduction to the substrate occurs primarily through long narrow support beams. Silicon nitride is commonly used as the support material for its electrical insulation properties and low thermal conductivity (1-5 W·m-1·K-1)[13]. Additionally, silicon nitride possesses favorable stress characteristics that enable it to support both the heating element and beams mechanically.
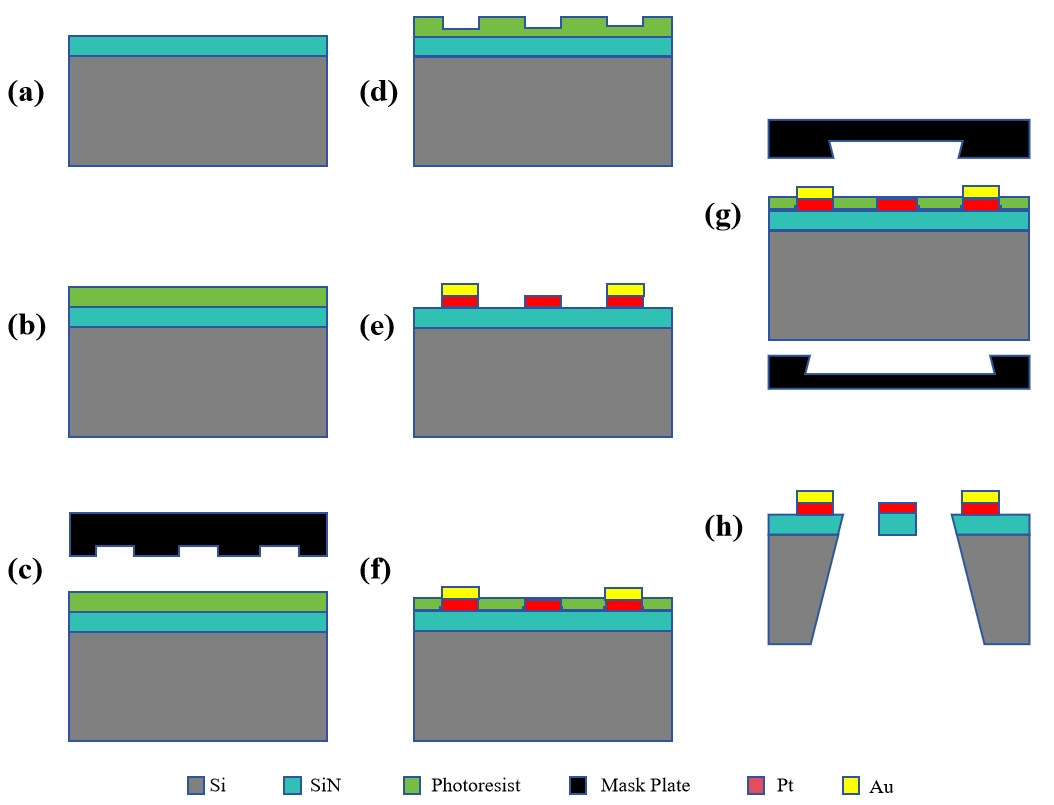
Figure 9. Schematic of the general fabrication steps for a MEMS-based TCHS. MEMS: micro-electro-mechanical system; TCHS: thermal conductivity hydrogen sensor.
However, this structure introduces new challenges, particularly the need to balance thermal isolation with mechanical stability. Notably, novel materials such as nanowires[119] have significantly enhanced sensor performance, yet mechanical stability remains a concern requiring further improvement. Additional strategies to enhance heat transfer between the sensing element and the ambient gas include increasing the relative heat exchange area[10,59], implementing specialized channel designs[120,121], and optimizing the packaging configurations[122,123].
With the maturation and refinement of microfabrication techniques such as deep reactive ion etching (DRIE)[124] and PECVD, MEMS-based TCHSs have evolved into two mainstream configurations: patterned thin-film and microbridge structures. These designs predominantly feature suspended architectures characterized by high aspect ratios and low thermal mass, enabling rapid attainment of thermal equilibrium. Representative recent studies are presented below to illustrate their respective characteristics.
4.2.1 Patterned thin-film
The thin-film structure is relatively simple and inherently compatible with conventional microfabrication techniques such as photolithography and electron beam evaporation, making it suitable for mass production. Besides, the film provides a large relative heat exchange area. It exhibits excellent structural continuity, reducing the likelihood of damage during fabrication while providing robust resistance to mechanical vibration during operation. However, the relatively high thermal mass limits its rapid thermal response to pulsed currents. As a result, such sensors typically operate in steady-state mode[65,122], leading to relatively higher power consumption. Additionally, achieving thermal equilibrium after hydrogen introduction requires a considerable amount of time, which may compromise the response speed.
For example, Wang et al.[122] recently developed a suspended micro-hotplate (MHP) integrated with a silicon cap, as illustrated in Figure 10a,b. The MHP and supporting beams were fabricated using low-pressure chemical vapor deposition silicon nitride thin films, while interdigitated Pt resistors served as the heating element. A backside cavity was formed through DRIE, and an ambient resistor was incorporated for temperature compensation. The heat conduction through hydrogen accounted for 91.6% of the total thermal conductivity in the capped sensor, significantly higher than that observed in the uncapped counterpart. Effective detection of hydrogen at a concentration as low as 50 ppm was demonstrated.
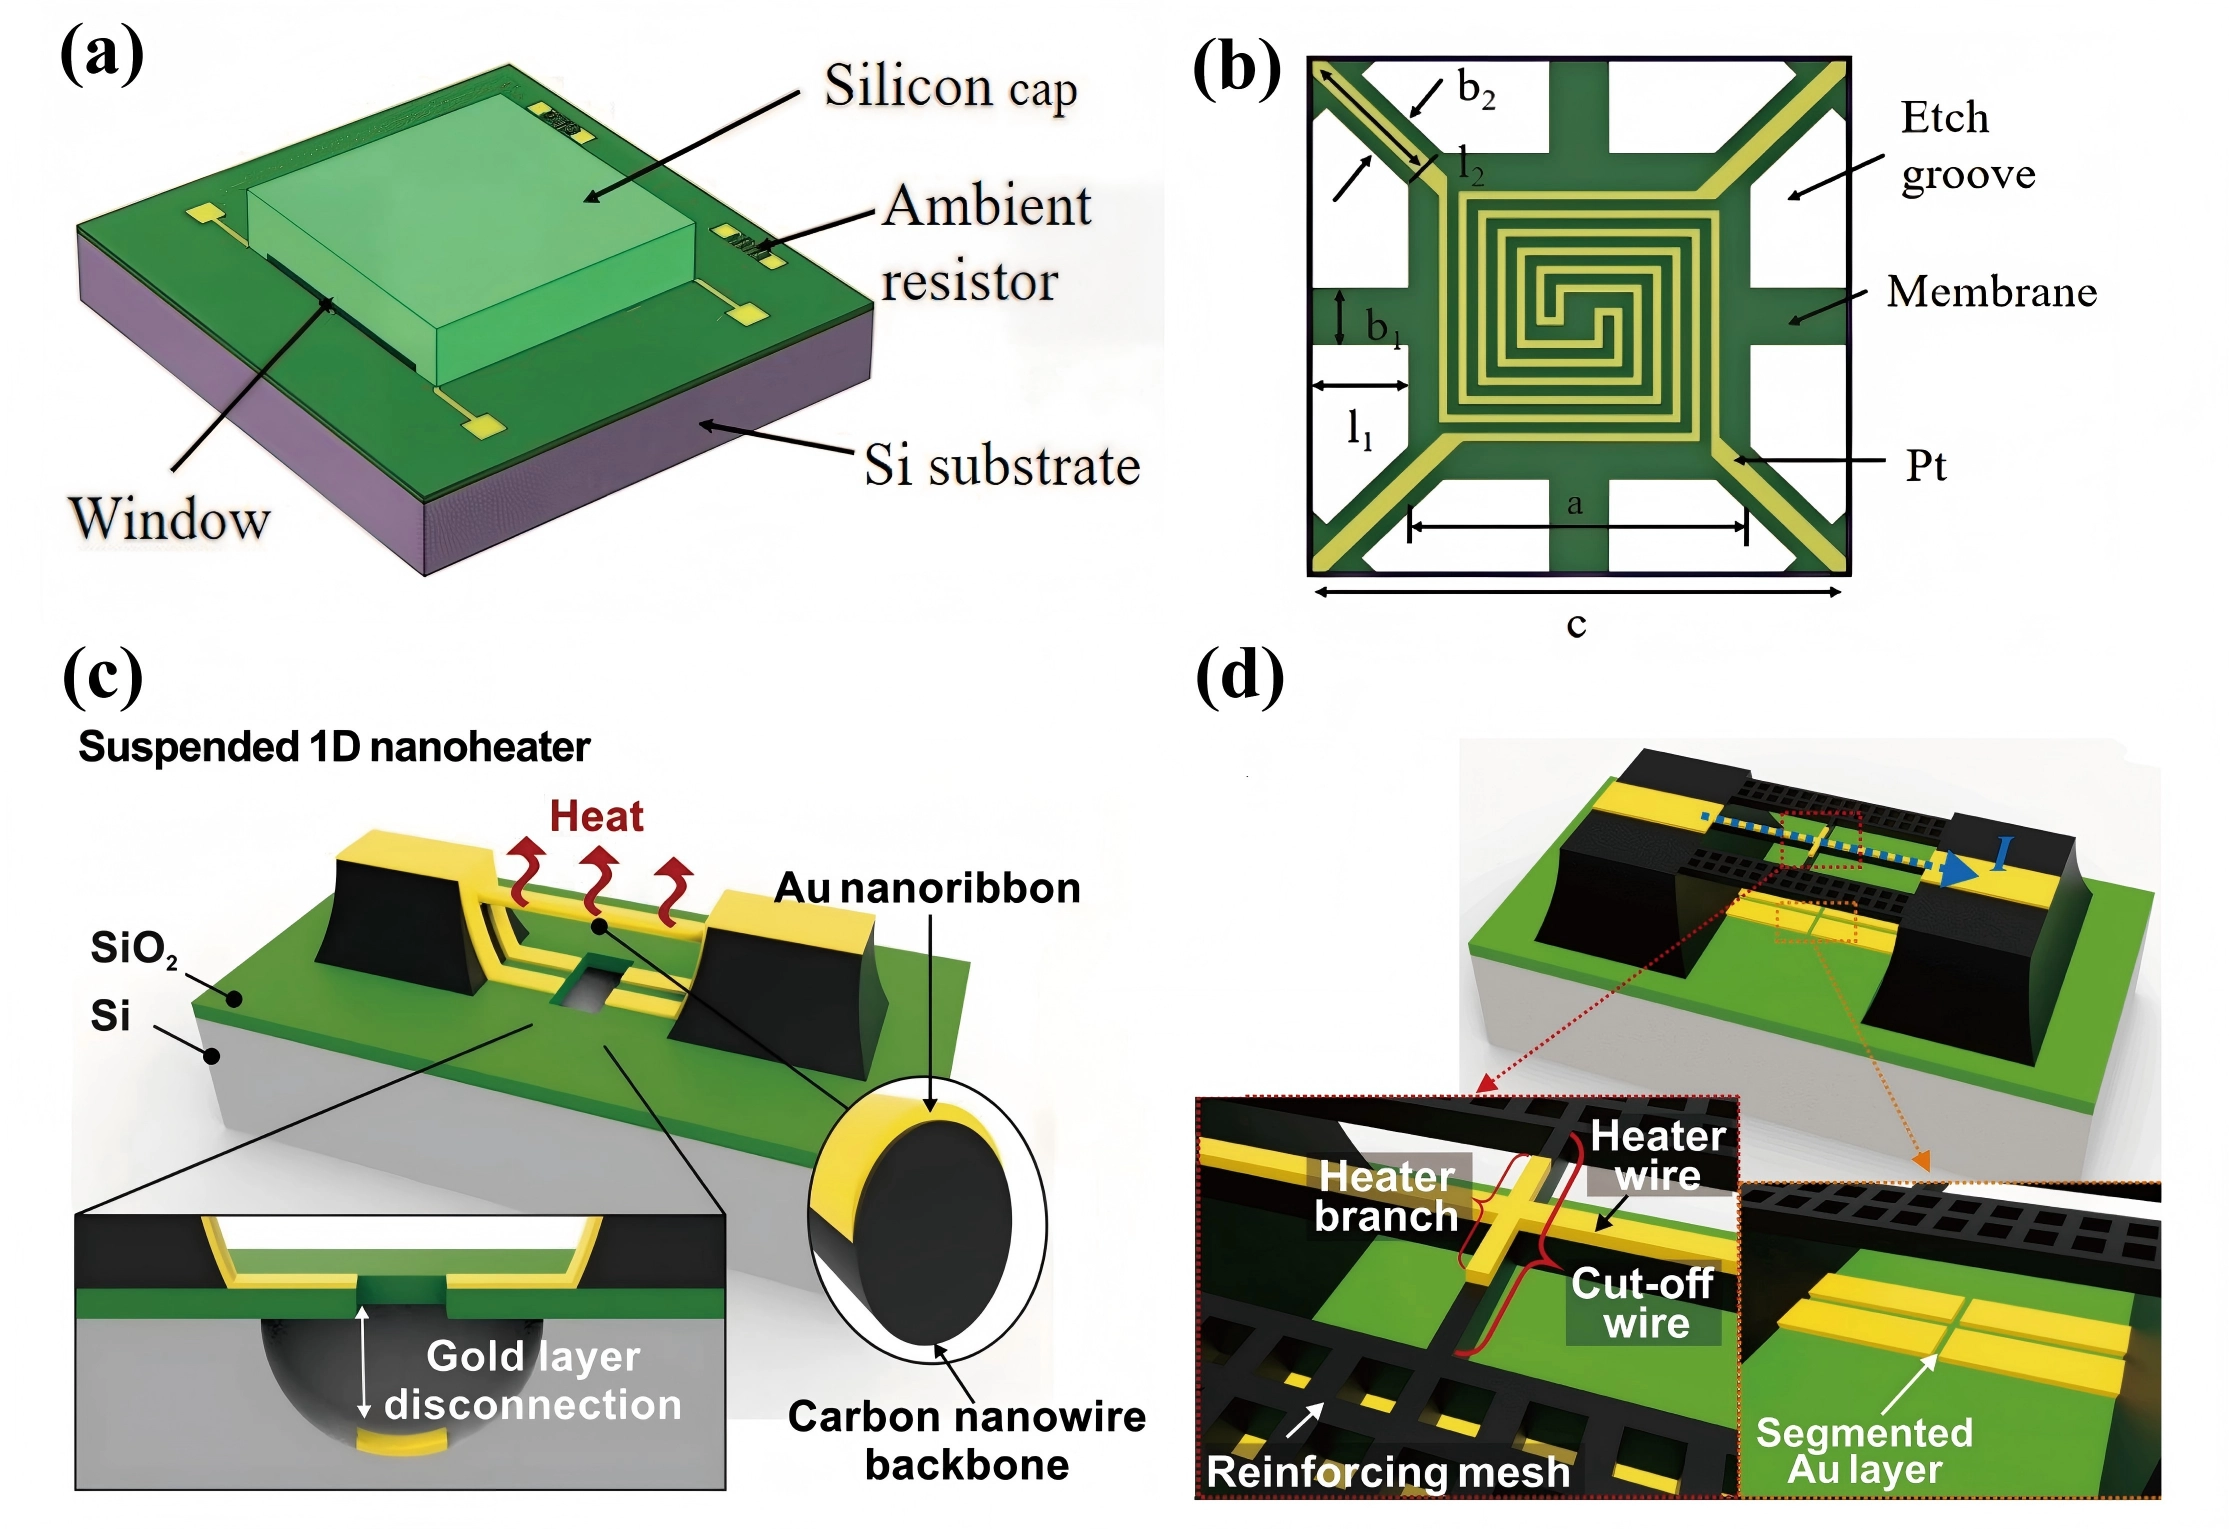
Figure 10. Schematic of the TCHS with a silicon cap. Republished with permission from[122]: (a) The chip structure; (b) The MHP which utilizes four edge support beams (length l1, width b1) and four corner support beams (length l2, width b2) to support the central hotplate. a is the length of the MHP side and c is the side length of the chip. The two generations of 1D gold nanowire heating strip structures: (c) The first-generation sensor featuring an integrated shadow mask. Inset: (left) sectional view of the disconnected metal line at the built-in shadow mask, (right) sectional view of the suspended nanoheater consisting of an Au nanoribbon and a carbon backbone. Republished with permission from[68]; (d) The second-generation sensor with a cut-off wire and reinforcing mesh. Inset: (left) enlarged view of the suspended 1D nanoheater, (right) enlarged view of segmented Au layer. Republished with permission from[60]. TCHS: thermal conductivity hydrogen sensor; MHP: micro-hotplate; 1D: one-dimensional.
4.2.2 Patterned microbridge
Compared to the thin-film structures, patterned microbridges exhibit faster response times (excluding the extrinsic time delays), due to further miniaturization and lower thermal mass, factors that are critical for enhancing the sensor’s identification capability[68]. Their minimal thermal mass and high aspect ratio enable rapid response to current pulses, making them well suited for transient-state operation, in which power consumption is significantly reduced. For instance, Cho et al.[68] recently developed a suspended 1D microbridge composed of a carbon nanowire skeleton and a gold nanoribbon heater using carbon MEMS technology, as illustrated in Figure 10c. By incorporating an integrated shadow mask, electron beam evaporation enabled selective deposition of the gold nanoribbon. The device’s small dimensions and high aspect ratio resulted in a thermal time constant as short as 0.64 μs and a power consumption of only 240 nW. A subsequent design[60] by them replaced the shadow mask with a cut-off wire and reinforcing mesh, as shown in Figure 10d, thereby enabling wafer-level batch fabrication.
Some recent representative examples of MEMS-based TCHS with various structural configurations are summarized in Table 2, comparing their key performance parameters, such as power consumption, size, LOD, response/recovery time (T90/T10), and sensitivity (S).
Table 2. Comparison of some recent representative MEMS-based TCHSs with various structures.
| Type | Heater/Substrate | Power/OT a | Size(μm) b | LOD (ppm) c | T90/T10 d | S(%-1) e | Ref |
| Film | Ni/SiN | 90 μW g/- | 800 × 250 × 1.1 | 2,000 (air) | ~6.5 ms h,i | 6.67 × 10⁻⁴ h | [13] |
| TiN/SiN | 27 mW f/46 °C | 10 h × 10 h × 0.05 | - | 1 s h/1 s h | 5.77 × 10⁻³ | [65] | |
| Pt/SiN | 1 mW f/40 °C | 10 h × 10 h × - | 50 (N2) | - | 7.91 × 10⁻³ | [122] | |
| Polysilicon/ SiN | 115 mW f,h/37 °Ch | 464 × 154 × 0.3 | - | - | - | [125] | |
| Pt/Ceramic | -f/200 °C | 3,000 × 6,000 ×- | 5,000 h (N2) | < 13 s/< 14 s | 2.5 × 10⁻³ h | [126] | |
| Pt/Al2O3 | -f | 2,000 h × 1,000 h × - | 170 (air) | 5.4 s/4.5 s | 3.287 mV j | [127] | |
| Pt/SiON | 7 mW f,h/92 °C h | 100 × 100 × 1.2 | 700 h (N2) | - | 9 × 10⁻³ h | [69] | |
| Bridge | Pt/SiN/SiO2 | 9.79 mW f/220 °C | 660 × 10 × 0.25 | 2,000 (air) | 5.64 ms/7.59 ms | 10.7 × 10⁻⁴ | [59] |
| Au/Carbon | 240 μW f; 240 nW g/100 °C | 80 × 0.25 × 0.4 | 56 (air) | 0.64 μs i | 5.6 × 10⁻⁴ h | [68] | |
| Au/Carbon | 300 μW f; 300 nW g/- | 80 × 0.45 × 0.8 | 1,000 h (air) | ~5 sh/~5 s h | 1 × 10⁻³ h | [128] | |
| Au/Carbon | 300 μW f; 300 nW g/- | 80 × 0.45 × 0.8 | 1074 (air) | 0.55 μs i | 1.34 × 10⁻³ | [60] | |
| Polysilicon/- | -f/398.8 °C | 100 × 6 × 1 | 1037 (N2) | 105 μs i | 1.9 × 10⁻² h | [129] | |
| Pt/SiN | 3.32 μW f/100 °C | 6 × 1 × 0.09 | 750 (Ar) | 6.1 s/9.3 s | 1.0 × 10⁻³ | [10] | |
| Pt/SiO2+SiN | 0.3 mW f,h/500 °C h | - | 500 h (air) | - | 1.76 × 10⁻² h | [14] |
a:OT: operating temperature of the heating element; b: Size: dimensions of the heating elements (length × width × thickness); c: These are values for hydrogen, and the content in the parentheses is the carrier gas; d: T90: response time; T10: recovery time; e: S: sensitivity, the slope of the gas response graph in terms of the gas concentration; f: The heater is under the constant operation mode, during which the power supply provides continuous current; g: The heater is under the PWM mode, during which the power supply provides pulsed current. h: The values are calculated from data in the references, estimated from images, or the minimum values presented in experiments; i: The thermal time constant of the heating element; j: The sensitivity is defined based on the output voltage signal. PWM: pulse-width-modulation; MEMS: micro-electro-mechanical system; LOD: limit of detection; TCHSs: thermal conductivity hydrogen sensors; OT: operating temperature.
4.3 Gas inlet design
The gas inlet design aims to optimize the heat transfer pathways, minimize external interference, and enhance detection accuracy. Common configurations include the direct-flow and diffusion-type inlets[57]. Regardless of the specific design, the detection chamber should be kept as compact as possible to suppress the convective effects[76,106]. With respect to flow direction, research has shown that a perpendicular-flow configuration yields a higher sensor response compared to the parallel-flow design[71]. In the perpendicular-flow design, the gas directly impinges on the heating element, which may induce eddy formation around the heater. In contrast, laminar flow is predominant in the parallel-flow design, where heat transfer is consequently limited.
4.3.1 The direct flow-type design
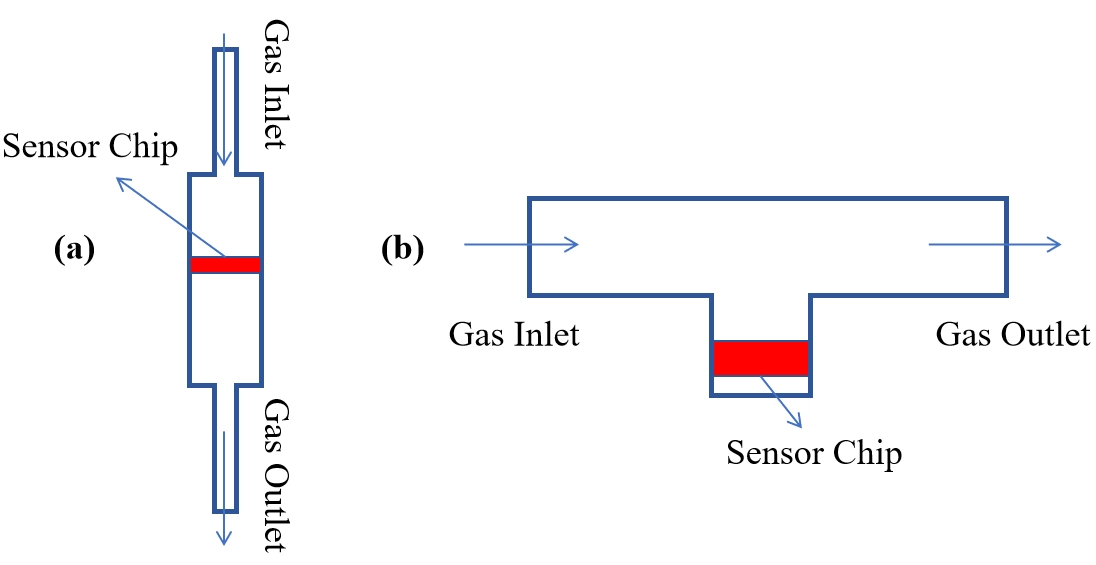
In the direct flow-type design, hydrogen is introduced to directly contact the sensing element[130], as illustrated in Figure 11a. This offers a simple structure, rapid gas renewal, and fast response, making it widely adopted in most TCHSs, particularly in early-generation systems[76,106]. However, fluctuations in gas flow velocity can alter the heat transfer conditions and increase noise levels, leading to reduced resolution and unstable output signals, which limit their suitability for high-precision detection[130]. Moreover, direct exposure to high-velocity gas flow may cause mechanical damage to the sensor structure, especially in the microbridge-based designs.
To address these issues, researchers incorporate damping structures, such as mesh caps, to stabilize flow and mitigate the impact of flow velocity fluctuations, while maintaining a relatively low and constant gas velocity.
For example, Zhang et al.[59] employed a polytetrafluoroethylene (PTFE) membrane, a waterproof and breathable material, at the inlet to reduce the flow-induced disturbances. Dong et al.[130] designed obstacles with varying geometric parameters, as shown in Figure 12a, to minimize the flow interference and effectively enhance the dynamic detection accuracy, as shown in Figure 12b. Some additional direct flow-type configurations[121,131] are illustrated in Figure 12c,d.
Figure 12. (a) Obstacle for mitigating flow effects: 1, base; 2, electrodes; 3, sensitive component; 4, obstacle. Republished with permission from[130]; (b) Effect of different carbon dioxide flow velocity on the voltage response of sensors with varying obstacle sizes; (c) Microchannel with reduced dead volume and four sensing cells, enhancing the sensor sensitivity. Republished with permission from[121]; (d) Channel design featuring two Pt resistors arranged in parallel on the same arm within a single channel. Republished with permission from[131].
4.3.2 The diffusion-type design
The diffusion-type design enables hydrogen to enter the sensitive region via diffusion, thereby avoiding direct impact on the sensor, as illustrated in Figure 11b. Customized channels can control the flow paths and intensity, reducing the effects of flow fluctuations. This design is widely employed in commercial devices for passive detection[52]. It offers superior stability compared to the direct flow-type design, but may exhibit slower response times due to prolonged diffusion, necessitating optimization of the channel structure.
For example, Wang et al.[63] designed three different diffusion channels, as shown in Figure 13a,b,c, effectively reducing the flow velocity near the heating element without affecting the recovery time, as shown in Figure 13d,e,f,g. Chen et al.[120] developed a micro thermal conductivity detector with a carefully designed diffusion channel, as shown in Figure 14, where the gas remained nearly stationary and was insensitive to the flow velocity variations in the main channel. This minimized the forced convection effects and increased the conductive heat dissipation from 88.23% to 94.94%.
Figure 13. (a) Top view of different channel designs (Type-I, Type-H, and Type-U); (b) 3D models used for simulation; (c) Cross-sectional view of the TCD (Type-I shown as an example) and (d) its structural diagram; Simulation results: flow velocity distribution at 0.5 μm above the hot film in (e) Type-I, (f) Type-H, and (g) Type-U, with arrows indicating flow direction; (h) Gas flow velocity at 0.5 μm above the center of the hot film across different designs. Republished with permission from[63]. 3D: three-dimensional; TCD: thermal conductivity detector.
Figure 14. Diffusion channel featuring an interlaced grid of heating wires to suppress the forced convection. Republished with permission from[120].
5. Influencing Factors of Sensing
Performance of a TCHS is influenced by various factors affecting the heat exchange, including temperature, humidity, flow velocity, pressure, gas density[132], and carrier gas composition[133], and so on. The following section outlines the main factors and their corresponding compensatory strategies.
5.1 Ambient temperature
All sensors are sensitive to ambient temperature variations, with TCHS being particularly susceptible. TCHSs operate over a wide range of ambient temperatures, from low-temperature environments (15-25 °C) used in pipeline leak detection to several hundred degrees Celsius encountered in nuclear reactor containment systems. Ambient temperature influences the thermal conductivity of hydrogen itself[134,135], as illustrated in Figure 5, which directly affects the heat exchange efficiency between the heating element and the ambient gas, leading to output drift, as shown in Figure 15. Furthermore, non-uniform temperature distribution across the heating element can disturb the baseline stability, thereby reducing sensitivity and accuracy[127].
Figure 15. The influence of ambient temperature and humidity on the stability of the zero point (the concentration of hydrogen is 0%) of a TCHS based on mixed carbon material modification. Republished with permission from[127]. RH: Relative humidity; TCHS: thermal conductivity hydrogen sensor.
The most common compensation method involves placing a reference element, exposed to the ambient environment or pure carrier gas, in close proximity to the sensing element, with both elements often integrated on the same chip. The two elements are connected to form a Wheatstone bridge[96,136]. When ambient conditions change, both undergo similar temperature variations, resulting in balanced output. However, when the gas composition in the detection chamber changes, only the sensing element responds, generating a measurable signal. In modern commercial sensors, a prevalent approach is to incorporate an independent temperature sensor that enables algorithm-based compensation.
5.2 Humidity
Humidity level influences the heat exchange efficiency between the heating element and the ambient gas. Emperhoff et al.[87] evaluated three commercial TCSs and found that humidity caused detection errors equivalent to up to 2 vol.% hydrogen. Zou et al.[127] designed a TCHS with the mixed carbon materials and analyzed the influence of ambient temperature and humidity on the stability of the zero point. They found that under constant ambient temperature, humidity fluctuations would lead to the calibration drift when air was used as the carrier gas, as the thermal conductivity of air-hydrogen mixtures varies with humidity level[13,87], as shown in Figure 15. Furthermore, the ambient temperature and humidity level have a coupling effect. In a high humidity environment, temperature has a greater impact on the output performance of the sensor, that is, water vapor will lead to poor cross-sensitivity of the sensor, and the higher the temperature, the greater the humidity, the more serious the impact. So, TCHS necessitates frequent recalibration.
Besides, the thermal conductivity of water vapor is significantly lower than that of hydrogen, as shown in Figure 5. When the humidity level is high, the measured value of hydrogen concentration may be lower than the actual value, as the heat dissipation decreases[69]. In addition, condensation may occur on the surface of the heating element under high humidity levels. However, since the heating element typically operates at a high temperature, it exhibits a degree of self-cleaning capability[137].
Compensation methods for humidity are analogous to those used for temperature compensation[138]. Apart from using a reference chamber, an effective approach is to increase the operating temperature of the heating element[69], as the thermal conductivity difference between the water vapor and the carrier gas, such as N2, will decrease, as illustrated in Figure 5.
5.3 Flow velocity
In TCHS, heat loss occurs through multiple pathways[139], as illustrated in Figure 3b. Heat loss via radiation and through the substrate is generally negligible[140,141]. However, convective heat transfer is highly uncertain and particularly sensitive to factors such as flow velocity and structural details[142]. A high flow velocity enhances the forced convection, which may obscure the relationship between the output signal and the thermal conductivity of hydrogen. Moreover, in micro-sensors, excessively high flow velocities can lead to structural deformation or collapse. Flow velocity fluctuations also adversely affect output stability. In Eq. (1), the heat transfer coefficient (h) does not directly correspond to thermal conductivity, as it includes contributions from convection. Therefore, minimizing the convection can improve the accuracy of thermal conductivity calculations.
To ensure dominance of the conductive heat transfer, the flow velocity needs to be sufficiently low to maintain the Péclet number (Pe), defined as the ratio of convective to conductive heat transfer rates, below 0.1[71]:
where v is the flow velocity. Therefore, the convection may be neglected, which greatly simplifies the problem, as flow details become insignificant and the Navier–Stokes equations need not be solved. However, an excessively low flow velocity may prolong the actual measurement response time[57].
Ideally, the performance of a TCHS should remain unaffected by variations in flow velocity[143]. Conventional equipment requires frequent recalibration under varying flow conditions, that increases the operational complexity[125]. With the rapid advancement of portable devices such as micro-gas chromatography systems, there is a growing demand for flow-independent TCHS[144]. Maintaining a low and stable flow velocity is the most fundamental approach[125,126,145]. Besides, the effect can be partly compensated by adding a reference channel with a reference gas flow[146], in which the temperatures are sensed by resistors in a Wheatstone bridge configuration, and a control loop is added for automatic gain control and imbalance compensation. A mesh cap with micropores can be installed over the sensor to reduce the flow velocity and protect the sensing elements, or complex enclosures can be designed.
Recently, Graaf et al.[125] proposed a dual-chamber configuration with different depths, as illustrated in Figure 16. The shallow chamber exhibits high sensitivity to the thermal conductivity of the surrounding gas, whereas the deep chamber shows low sensitivity and primarily responds to flow disturbances. By calculating the differential heating power between the two chambers, flow-rate-related interference can be effectively canceled out, especially for hydrogen. However, this results in a loss of the overall sensitivity compared to the single shallow cavity device, and relatively high power consumption. Romero et al.[147] theoretically demonstrated that the output signals can be independent of gas flow velocity within a certain range under alternating current (AC) excitation. They proposed a hybrid method combining AC and direct current (DC) measurements[148], where DC excitation is used to measure flow velocity and AC excitation to determine the thermal conductivity of the surrounding gas. Dong et al.[130] designed obstacles with varying geometric parameters, as shown in Figure 12a. When the gas flows toward the sensor, its velocity is reduced by the obstacle. Through simulations and experimental validation, they determined the optimal structural parameters. Chen et al.[120] designed a specialized diffusion channel, as illustrated in Figure 14, in which the heating wires form an interlaced grid to suppress forced convection. Zhang et al.[143] proposed a sensor incorporating multi-stage hot wires, where the output signal from the two central segments depends solely on the gas thermal conductivity, and is insensitive to flow velocity variations. However, this design results in higher power consumption.
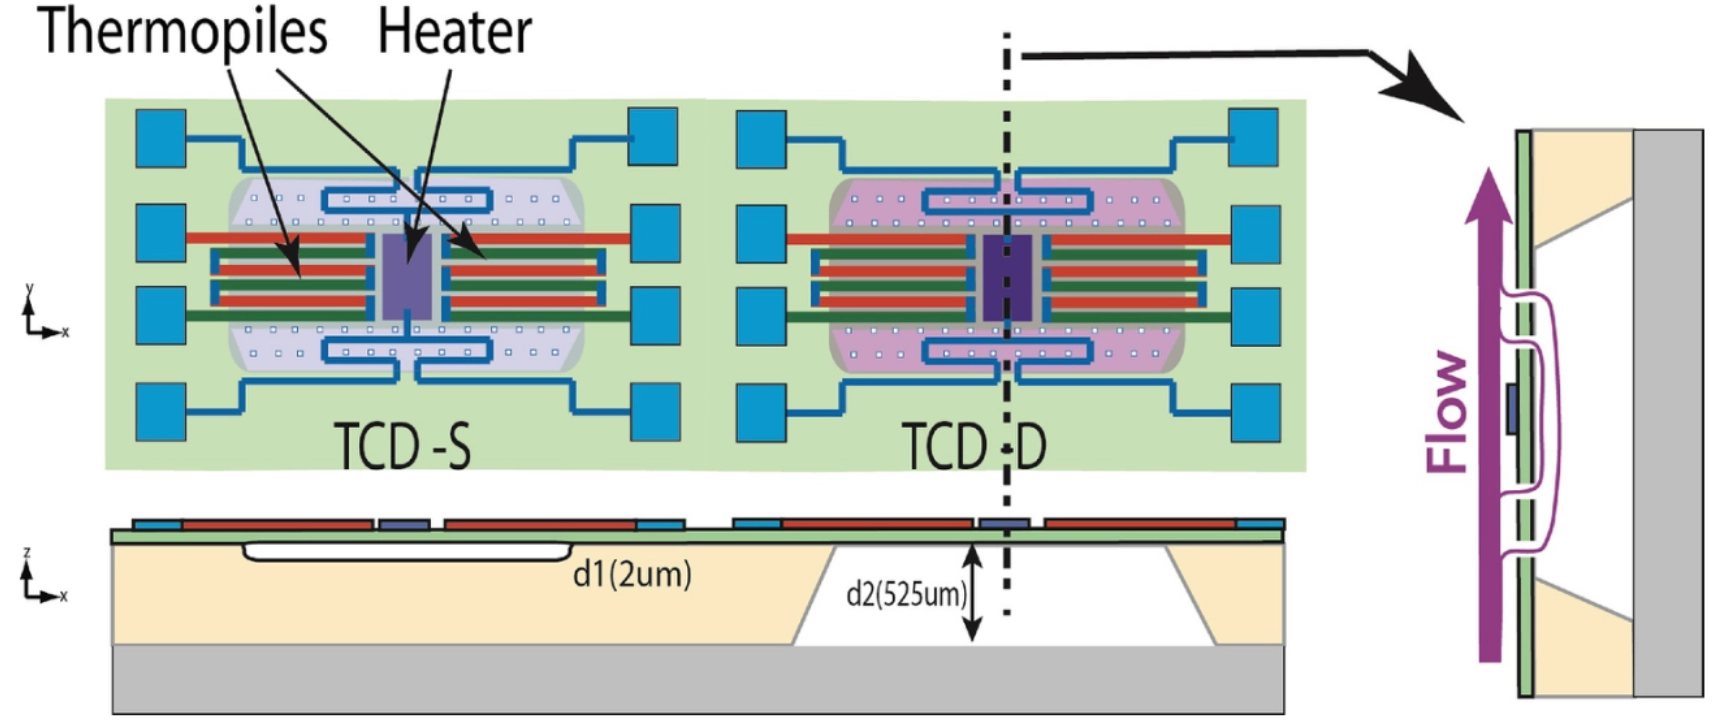
Figure 16. The Dual-TCD design: (a) top view and (b) cross-sectional view of the configuration. Republished with permission from[125]. TCD: thermal conductivity detector.
5.4 Pressure
The heat transfer behavior at the microscale solid–gas interface can vary significantly with changes in pressure. Experiments by Cheng et al.[62] with VO2 nanowires indicated that when pressure decreases to a level where the gas molecular mean free path becomes comparable to the device's characteristic length, the heat transfer coefficient (h) can be nearly 100 times higher than predicted with classical theories, as shown in Figure 17a. The authors qualitatively concluded that at very low pressures, gas molecules remove heat primarily through single collisions with the solid surface, resulting in a positive correlation between h and the collision frequency, which is proportional to pressure. Nevertheless, further research is still required. This phenomenon demonstrates that the pressure significantly influences heat transport at the microscale solid–gas interface, and established theories developed for macro-scale solid–gas interfaces[150-154] may require re-evaluation when applied to the microscale systems under extremely low pressure.
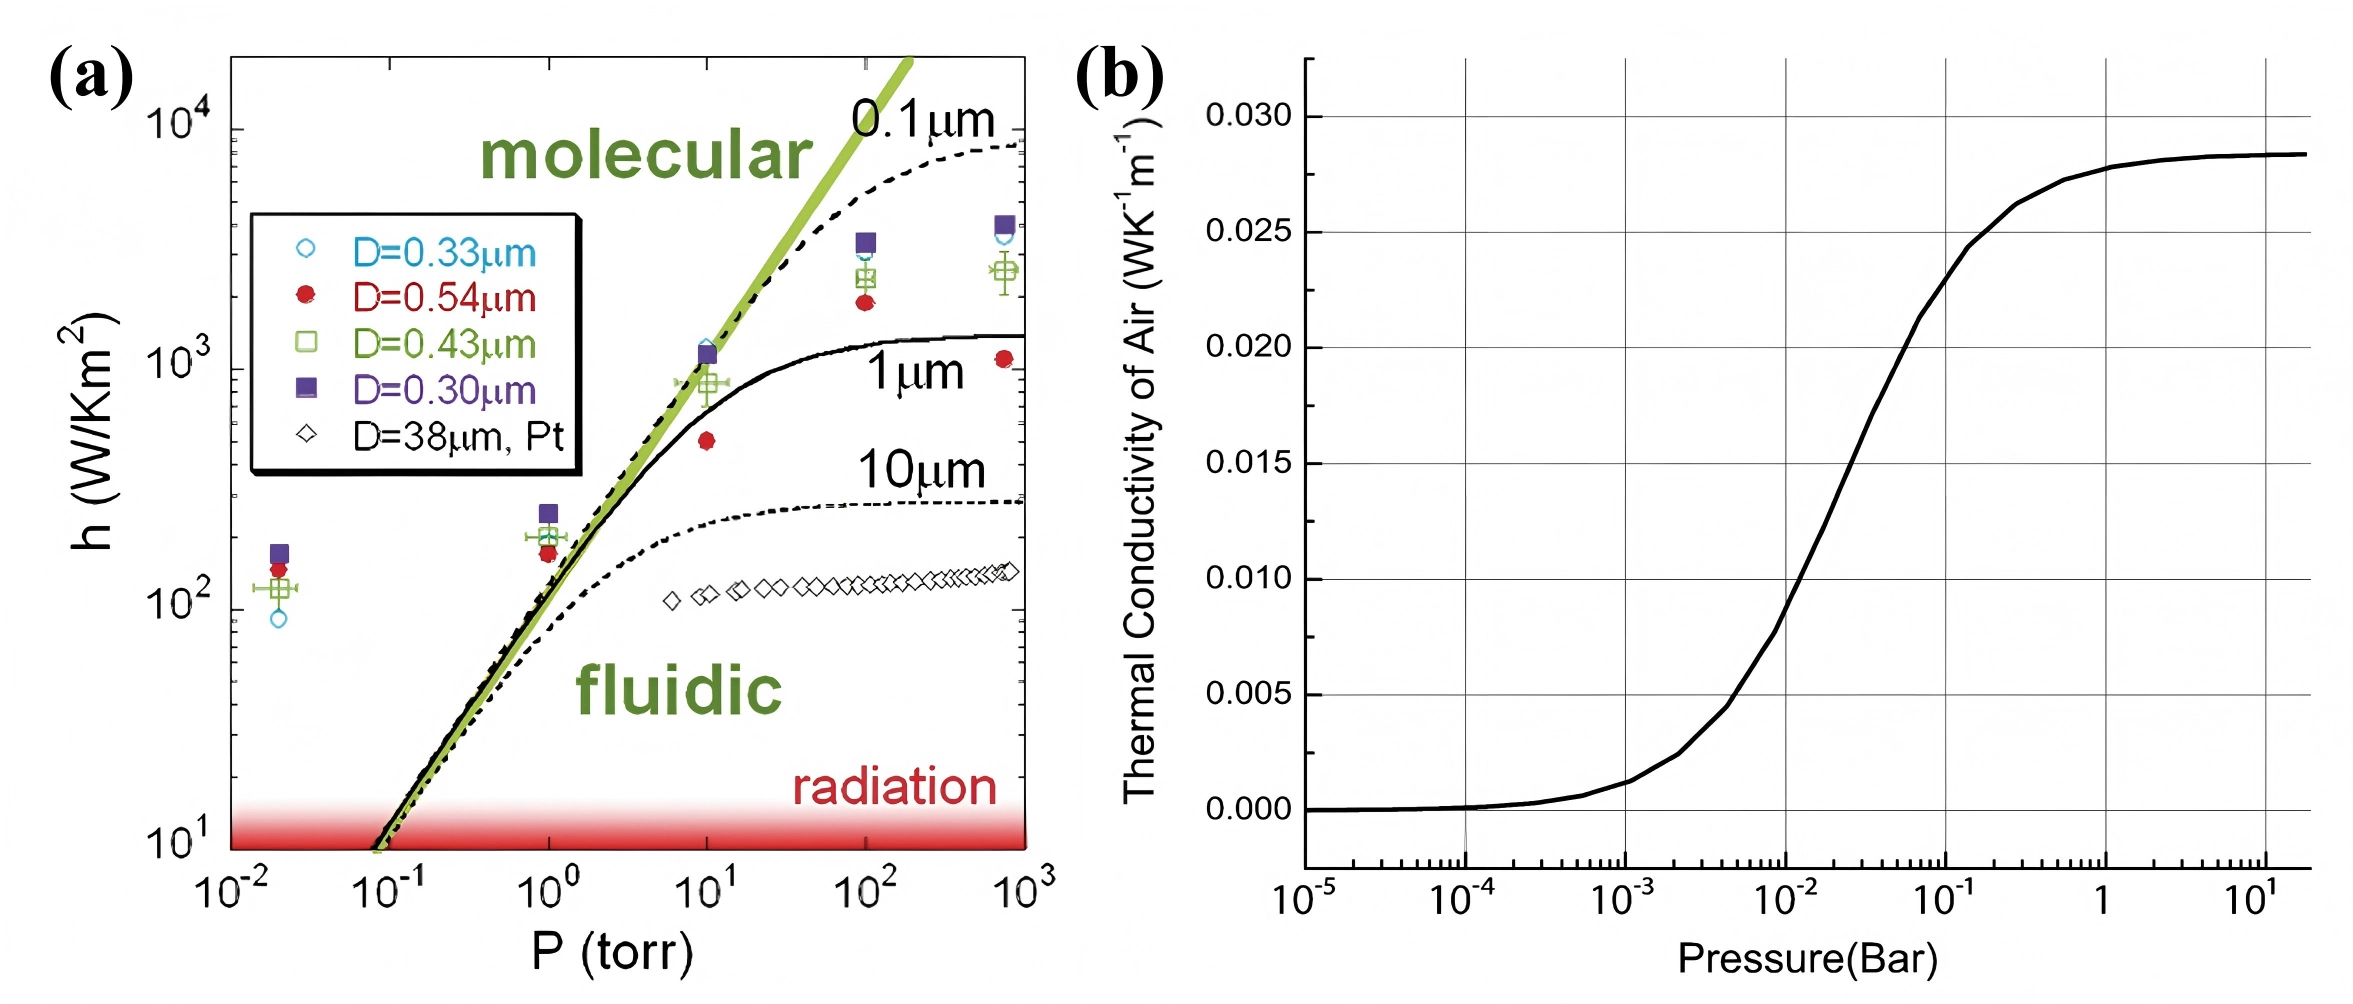
Simultaneously, pressure affects the thermal conductivity of gases[149,155,156]. Taking air as an example, the relationship between its thermal conductivity and pressure at 300K is illustrated in Figure 17b. In the pressure range from 10-3 to 1 Torr, the variation is particularly pronounced, leading to changes in the thermal conductivity of the air–hydrogen mixtures and potentially causing signal fluctuations, if air is used as the carrier gas. Sensors operating at atmospheric pressure are subject to considerably smaller effects. To improve measurement accuracy, dedicated pressure sensors combined with compensation algorithms can be implemented.
6. Recent Developments and Outlook
The following section provides an overview of recent literature surrounding TCHS. Based on these studies, we discuss the possible development directions of TCHS, smart gas sensing technology characterized by ML algorithms.
6.1 Recent developments
Structural optimization is a primary approach to improve the heat transfer efficiency and sensitivity of TCHS. Recently, some more sophisticated structural designs emerged with high heat transfer efficiency and excellent overall performance, in terms of the trace detection capability and power consumption. These designs all feature suspended structures.
Berndt et al.[13] developed a TCHS for automotive hydrogen detection, where the heating filament was embedded in a dielectric and connected to the substrate via only small suspensions to minimize heat loss, as shown in Figure 18a. Under the pulse width modulation mode, the sensor achieves a LOD of 2,000 ppm hydrogen, reliably operates within an ambient temperature range of -15 °C to 84 °C, and has a low power consumption (90 μW per measurement cycle). Zhang et al.[59] proposed a high heat transfer efficiency sensor based on three suspended bridges, including a serpentine-shaped platinum heater and two nickel temperature sensors, as shown in Figure 18b. They confirmed that the dumbbell-shaped structure achieved a higher heat transfer efficiency, with a low hydrogen detection limit of 0.2% and excellent long-term reproducibility for 2% hydrogen. Similarly, Xie et al.[14] developed a microbridge sensor with a curved heater fully surrounded by symmetrical temperature sensors, as shown in Figure 18d, which exhibited high linearity for hydrogen concentrations ranging from 0.5 to 3 vol.%. Wu et al.[10] developed a TCHS using single bare Pt nanowires, achieving ultra-low power consumption (3.32 μW) and high stability, as shown in Figure 18c. Through inductively coupled plasma (ICP) etching and tetramethylammonium hydroxide (TMAH) wet etching, they achieved near-complete thermal decoupling between the heater and the substrate. Cheng et al.[123] designed a dual-layer structure incorporating microcolumn fins and funnel-shaped microchannels, as shown in Figure 18e,f. The microchannels enhanced the stability of the gas flow above the sensing surface and suppressed the interference of the flow velocity, while the fins increased the heat exchange area. As a result, the response time of the sensor was shortened to 200 ms, and the LOD for hydrogen was as low as 10 ppm.
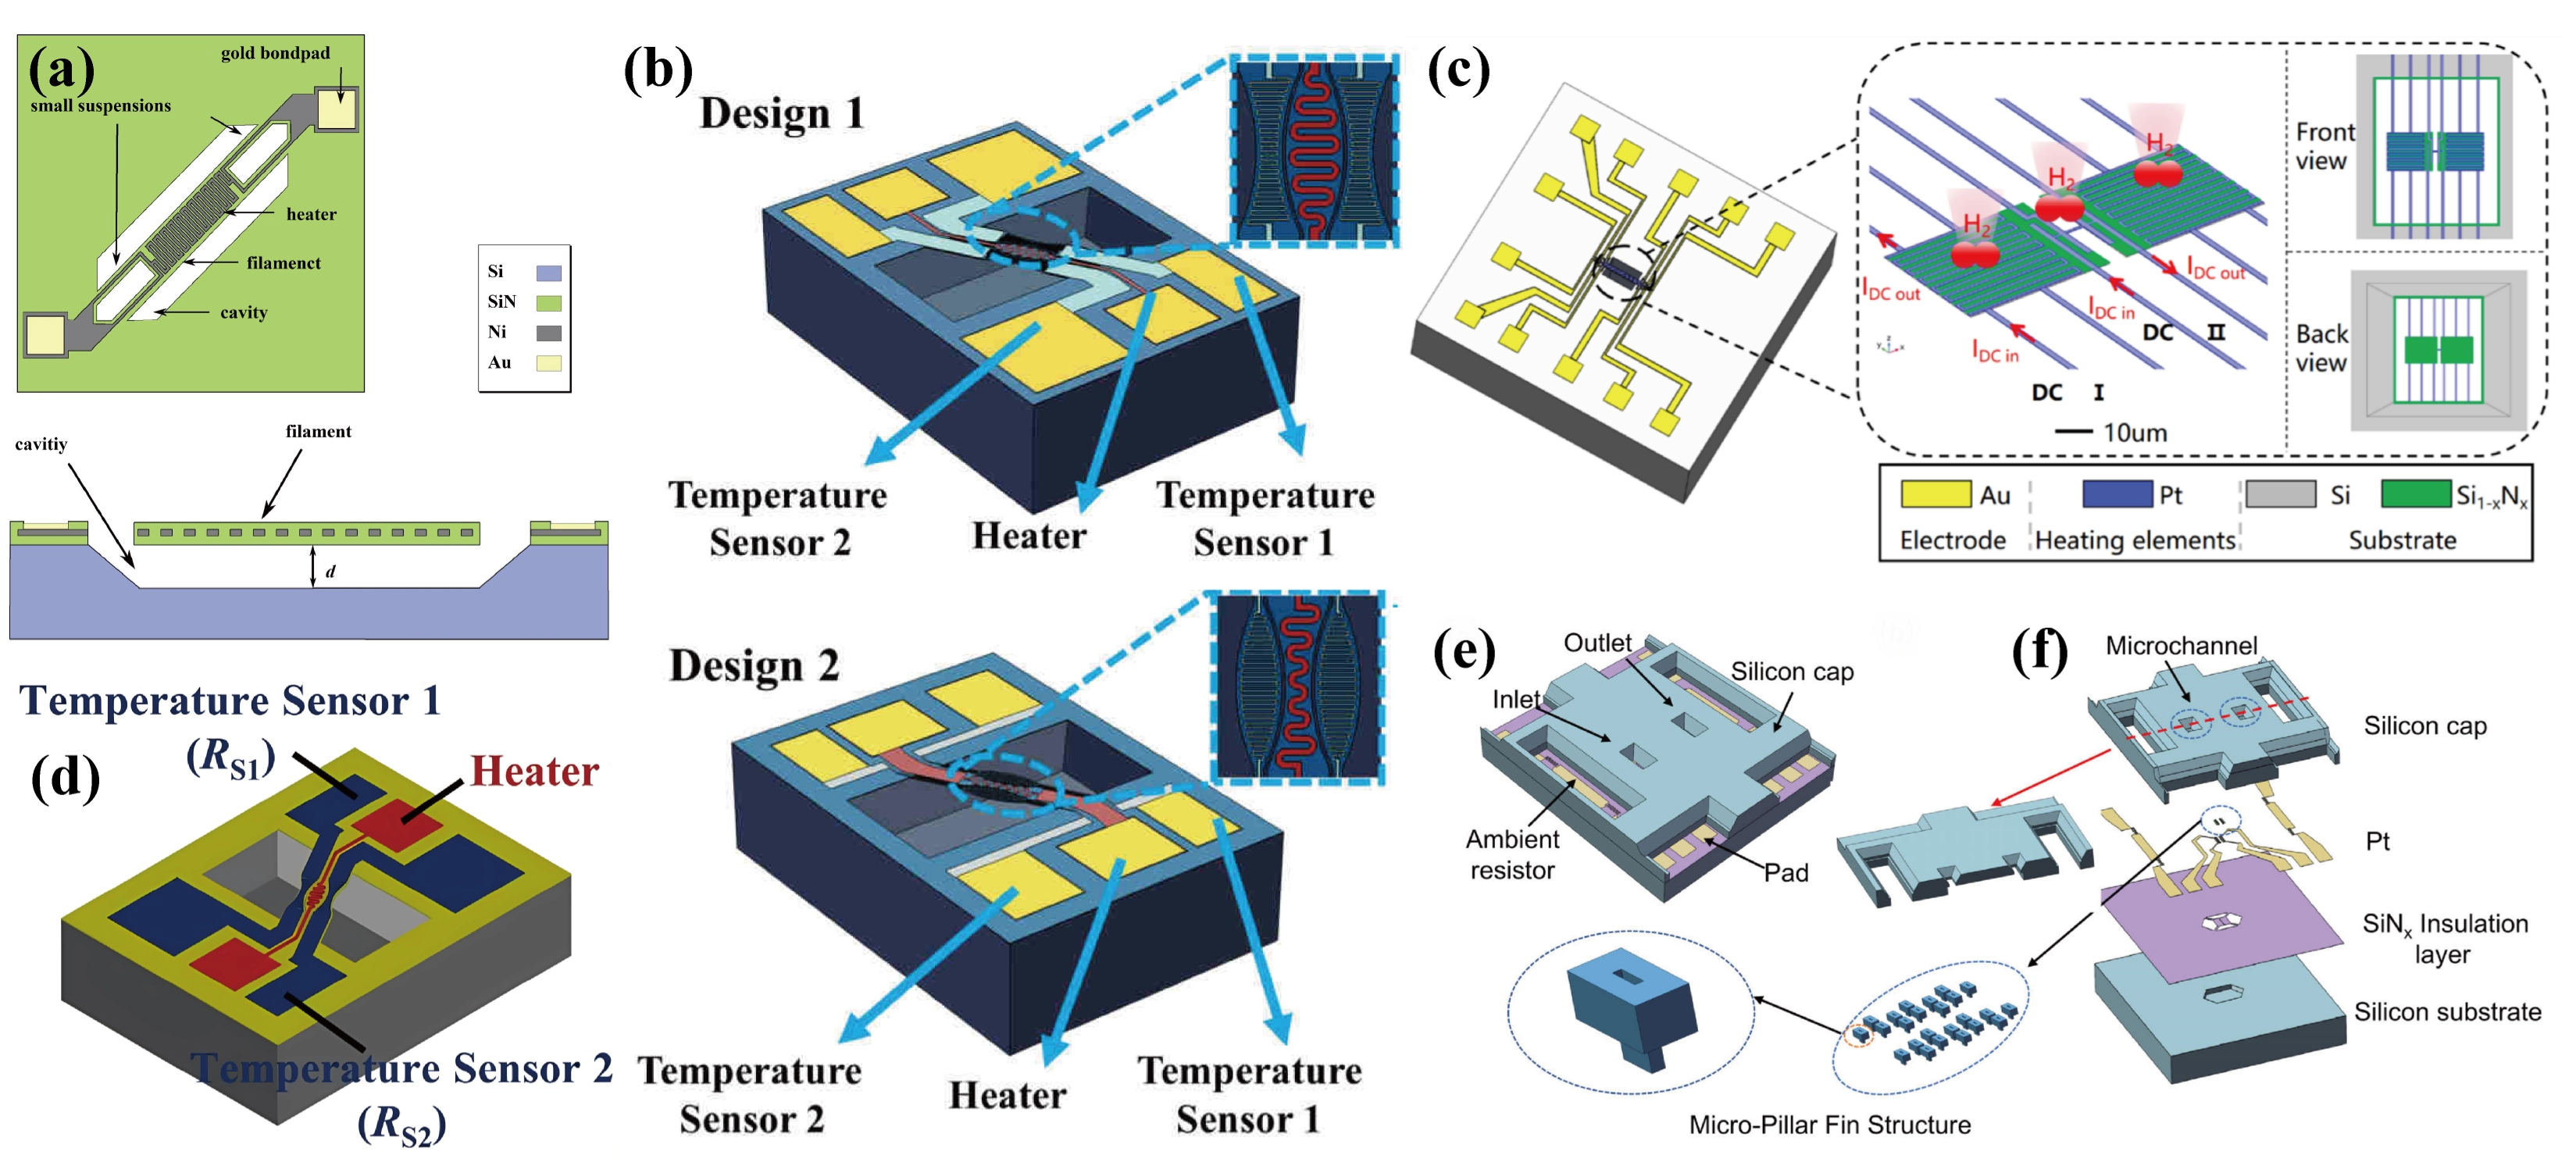
Figure 18. (a) Schematic top view and cross-section of the sensor chip after underetching the filament structure. Republished with permission from[13]; (b) Schematic diagram of the sensor. The upper is the shuttle-shaped sensor and the lower is the dumbbell-shaped sensor. Republished with permission from[59]; (c) Schematic of the sensor and its structural features. The red arrows show the direction of the DC heating current in the heating elements. “DC I” corresponds to the operation of serpentine elements and “DC II” corresponds to the operation of the bridge element. Republished with permission from[10]; (d) Schematic of the sensor. Republished with permission from[14]; Schematic of the sensor with dual-layer structure: (e) overall structure and (f) the exploded view highlighting the micropillar fin structure for enhanced thermal response and the microchannel designed to reduce flow interference. Republished with permission from[123]. DC: direct current.
Some researchers have also attempted to utilize the collaborative operation of multiple sensors to further enhance the capability of trace detection and selectivity of TCHS, while also enhancing its anti-interference capability to some extent. Collaborative operation of sensors can achieve complementary performance.
Leonardi et al.[126] demonstrated the co-integration of a TCHS and a MOS sensor on an alumina ceramic substrate, as shown in Figure 19a,b,c,d. The design achieved full coverage of the entire concentration range for hydrogen detection, and the LOD for hydrogen was 50 ppm. In addition, both sensors were controlled by a unified electronic unit, significantly reducing the system complexity and cost. Hayashi et al.[65] achieved the detection of 5 ppm hydrogen by integrating a capacitive sensor and a TCHS on a single chip (< 1mm2), as illustrated in Figure 19e. Although the selectivity of the TCHS is relatively low, data fusion with the capacitive sensor enabled effective elimination of interference from other gases. Additionally, Akimoto et al.[157] proposed a scheme of using multiple MEMS thermal conductivity detectors (TCDs) to work collaboratively to achieve real-time and high-precision detection of the concentration of each component in gas mixtures. By solving the intersection points of the inverse functions, the concentrations of each component can be uniquely determined. It is necessary that each TCD has a different ratio of sensitivity to gas A and gas B. Furthermore, the intersection should exist in the range of 0-100 vol.% for the obtained intersection to be significant. Kenari et al.[158] innovatively integrated the gas sensing and flow detection functions on a single chip, whose schematic diagram is shown in Figure 19f,g,h,i. The airflow transfers heat from upstream to downstream, inducing temperature variations in the sensing wires, which can be measured to enable flow monitoring. This shows that the gas sensing functionality can be integrated with other functionalities to meet diverse application requirements.
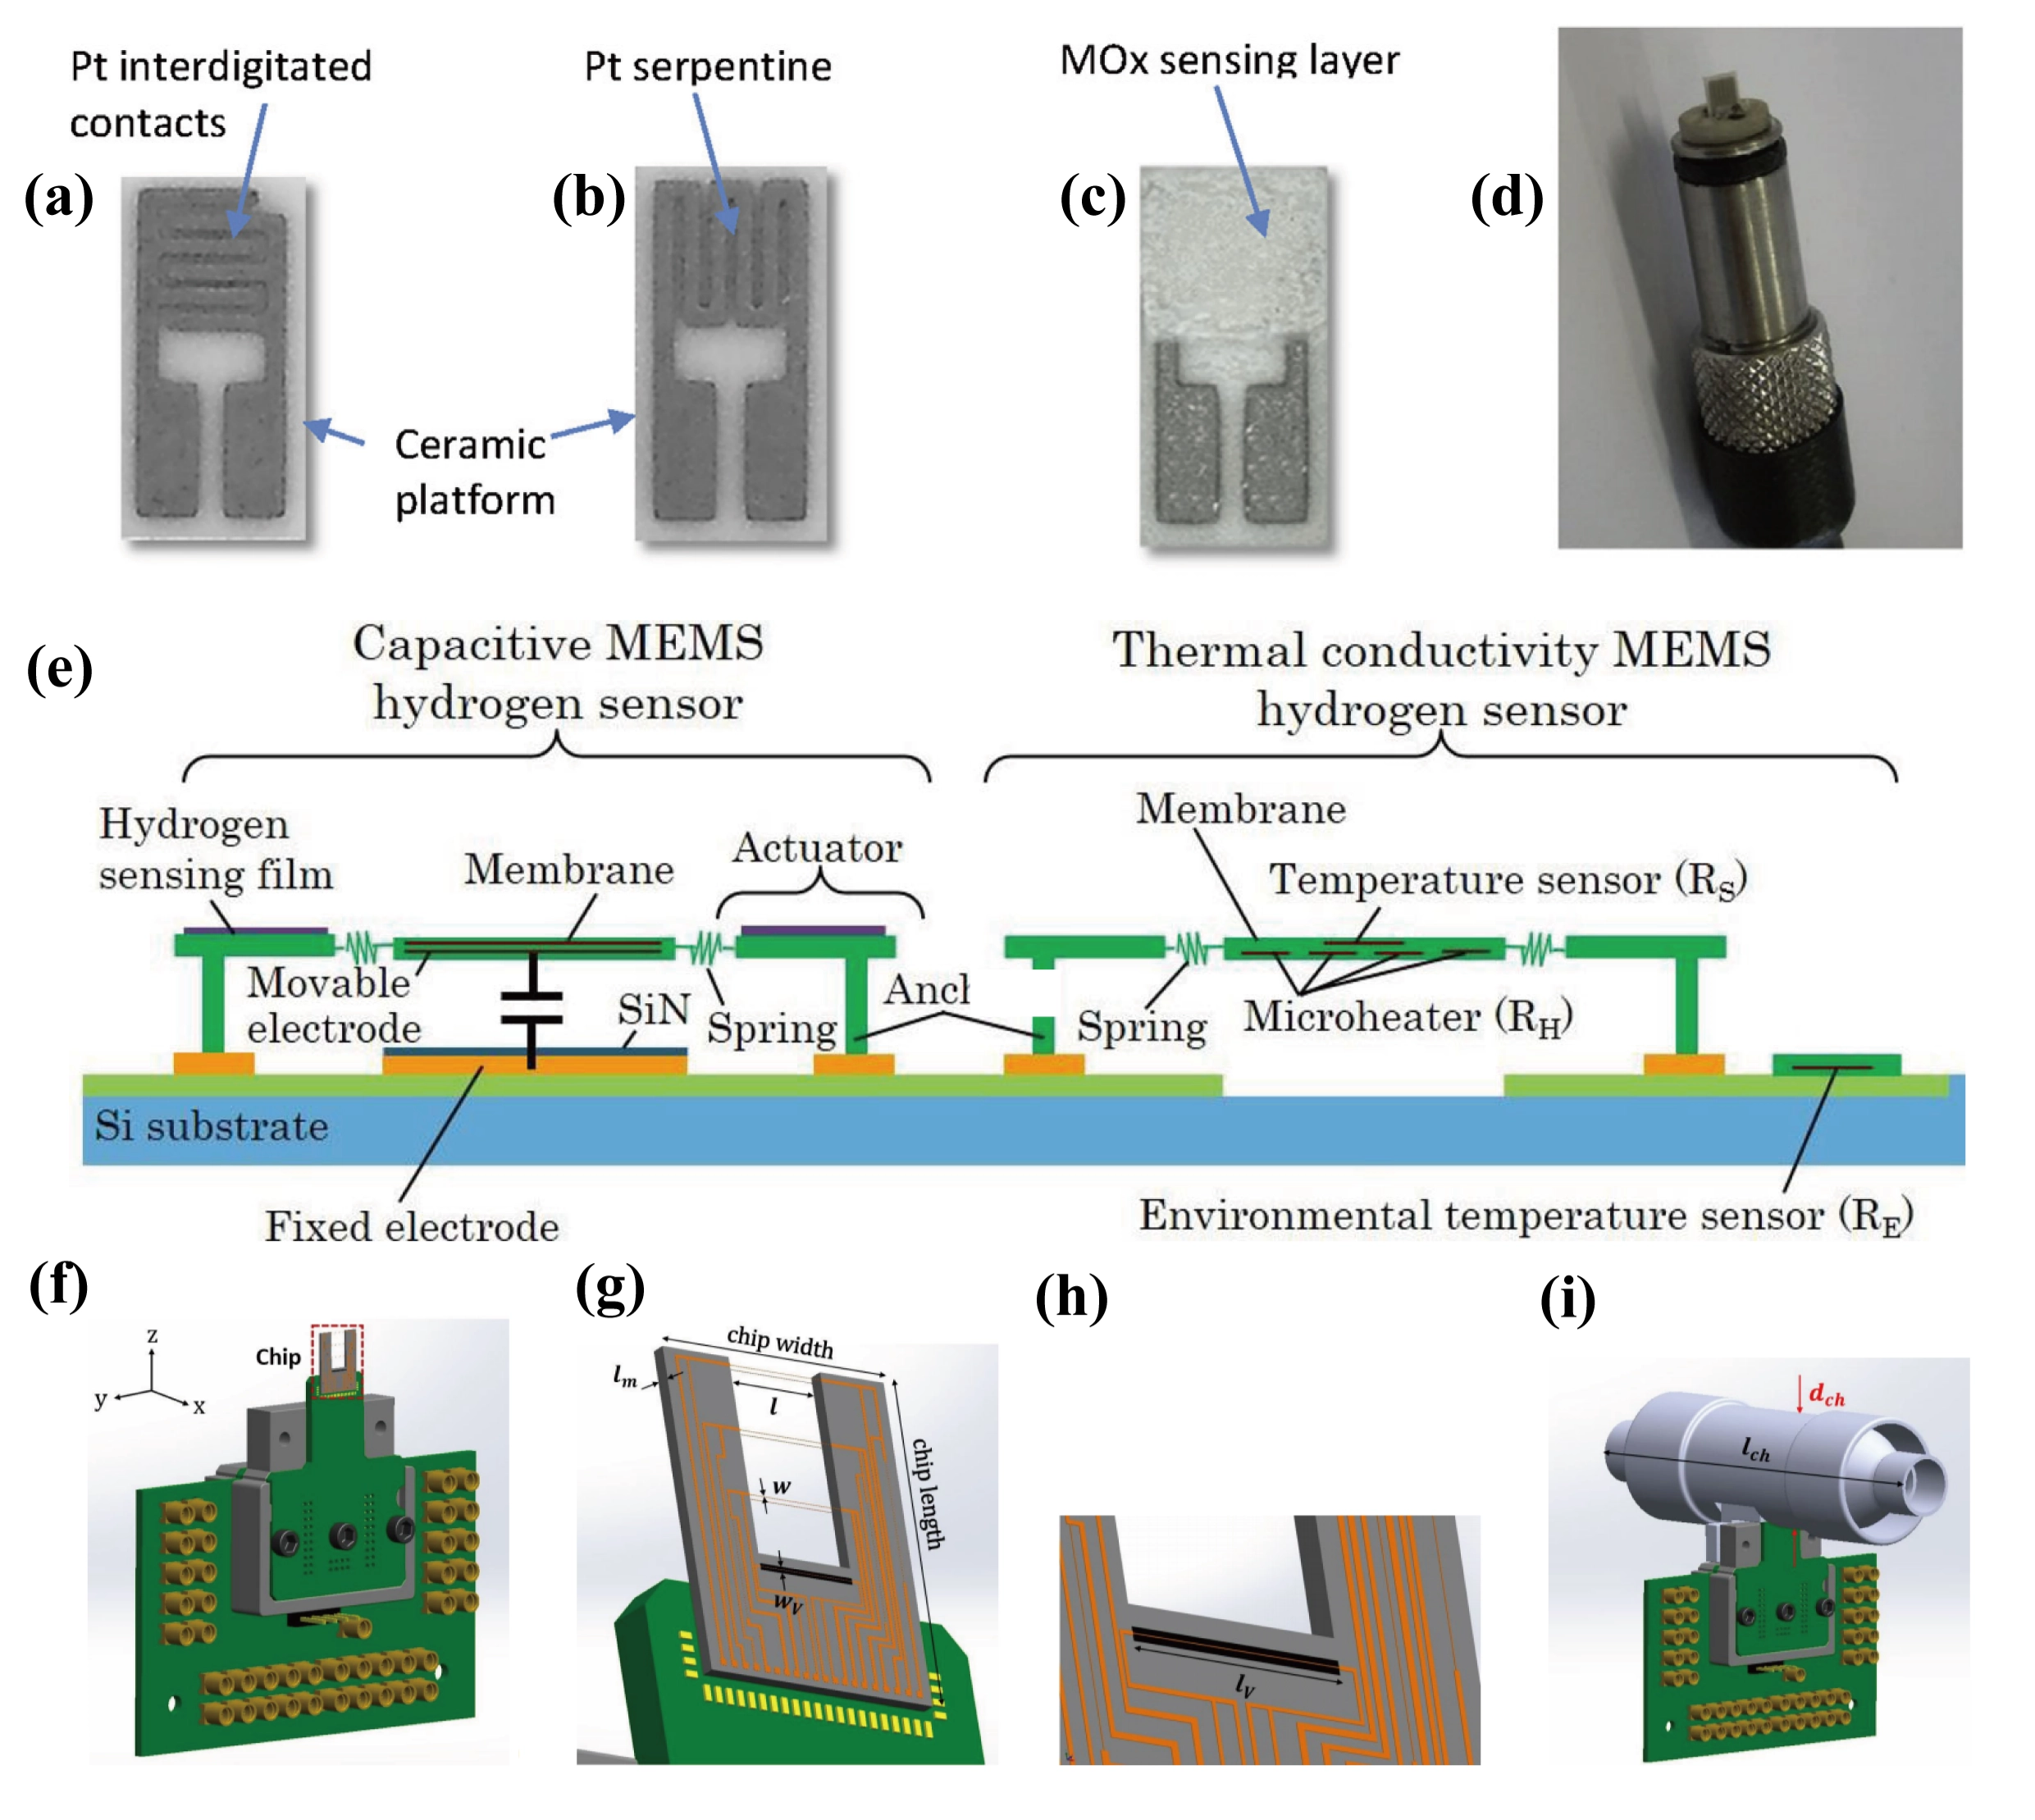
Figure 19. Integrated sensor combining a semiconductor-type gas sensor and a TCHS: (a) Front side of the ceramic substrate showing Pt interdigitated electrodes; (b) Back side featuring a Pt serpentine heater; (c) MOx sensing layer deposited on the Pt interdigitated electrodes; (d) Photograph of the sensor mounted on the holder. Republished with permission from[126]. (e) The configuration integrating a capacitive sensor and a TCHS. The capacitive sensor comprises an actuator coated with a hydrogen-sensitive film and a membrane incorporating a movable electrode. The actuator and membrane are connected via a high-thermal-resistance spring. In the TCHS, a suspended membrane containing a micro-heater and resistive temperature sensor is anchored through a spring structure. Republished with permission from[65]. The chip integrates gas recognition and flow detection functions: (f) Schematic drawing of the sensor on PCB; (g) Chip consisting of three pairs of wires realized at the front and back side of a silicon wafer to form calorimetric flow sensors and the TCS; (h) A close-up image of TCS with the cavity underneath; (i) The chip glued on the PCB inserted into the tube. Republished with permission from[158]. TCHS: thermal conductivity hydrogen sensor; PCB: printed circuit board; TCS: thermal conductivity sensor.
The development of advanced functional materials has opened new avenues for improving sensor sensitivity and response speed. Zou et al.[127] proposed a modified sensor using graphene-carbon nanotube mixed carbon materials as the carrier. Thanks to graphene’s high thermal conductivity and large specific surface area, and carbon nanotubes’ gas transport channels, the sensor achieved a sensitivity of 3.287 mV/1%H2, a response time of 5.4 s, and a LOD of 170 ppm. Besides, some researchers chose other materials as the heating element for their higher TCR values, such as Au[60,68], Ni[13], and polysilicon[129], to enhance the overall performance of TCHS.
6.2 Development directions of TCHS
With the rapid development of the hydrogen energy industry, the application scenarios of hydrogen detection are becoming increasingly diversified and complex. A single TCHS struggles to meet complex monitoring requirements, due to its inherent limitations, such as insufficient anti-interference ability in complex environments, limited capability of trace detection, and especially, poor selectivity. It is impossible to distinguish different gases with a single TCHS[158], since only the difference in thermal conductivity can be detected and a multidimensional feature space related to the gas mixture cannot be constructed[159]. As mentioned earlier, combining various sensors can address these issues to some extent. However, these devices are still not smart enough, namely, they cannot simultaneously and accurately identify each component and their concentrations in a complex gas mixture. This may well be the development direction of future gas sensors, including TCHS.
With the advancement of digital technology, the synergistic operation of sensor arrays composed of various types of sensors and ML, has proven effective in tackling these issues, especially in terms of selectivity, by identifying intricate patterns and relationships within large sensor datasets[160,161]. This data-driven method is the emerging smart gas sensing[162]. There are three key points in the technology[56]: sensor arrays made of various types of sensors, signal preprocessing for drift compensation and feature extraction, and gas pattern recognition, as shown in Figure 20. The general operation process of smart gas sensing is as follows, and more comprehensive review of smart gas sensing technology can be found in Feng et al.[56] and Yu et al.[159].
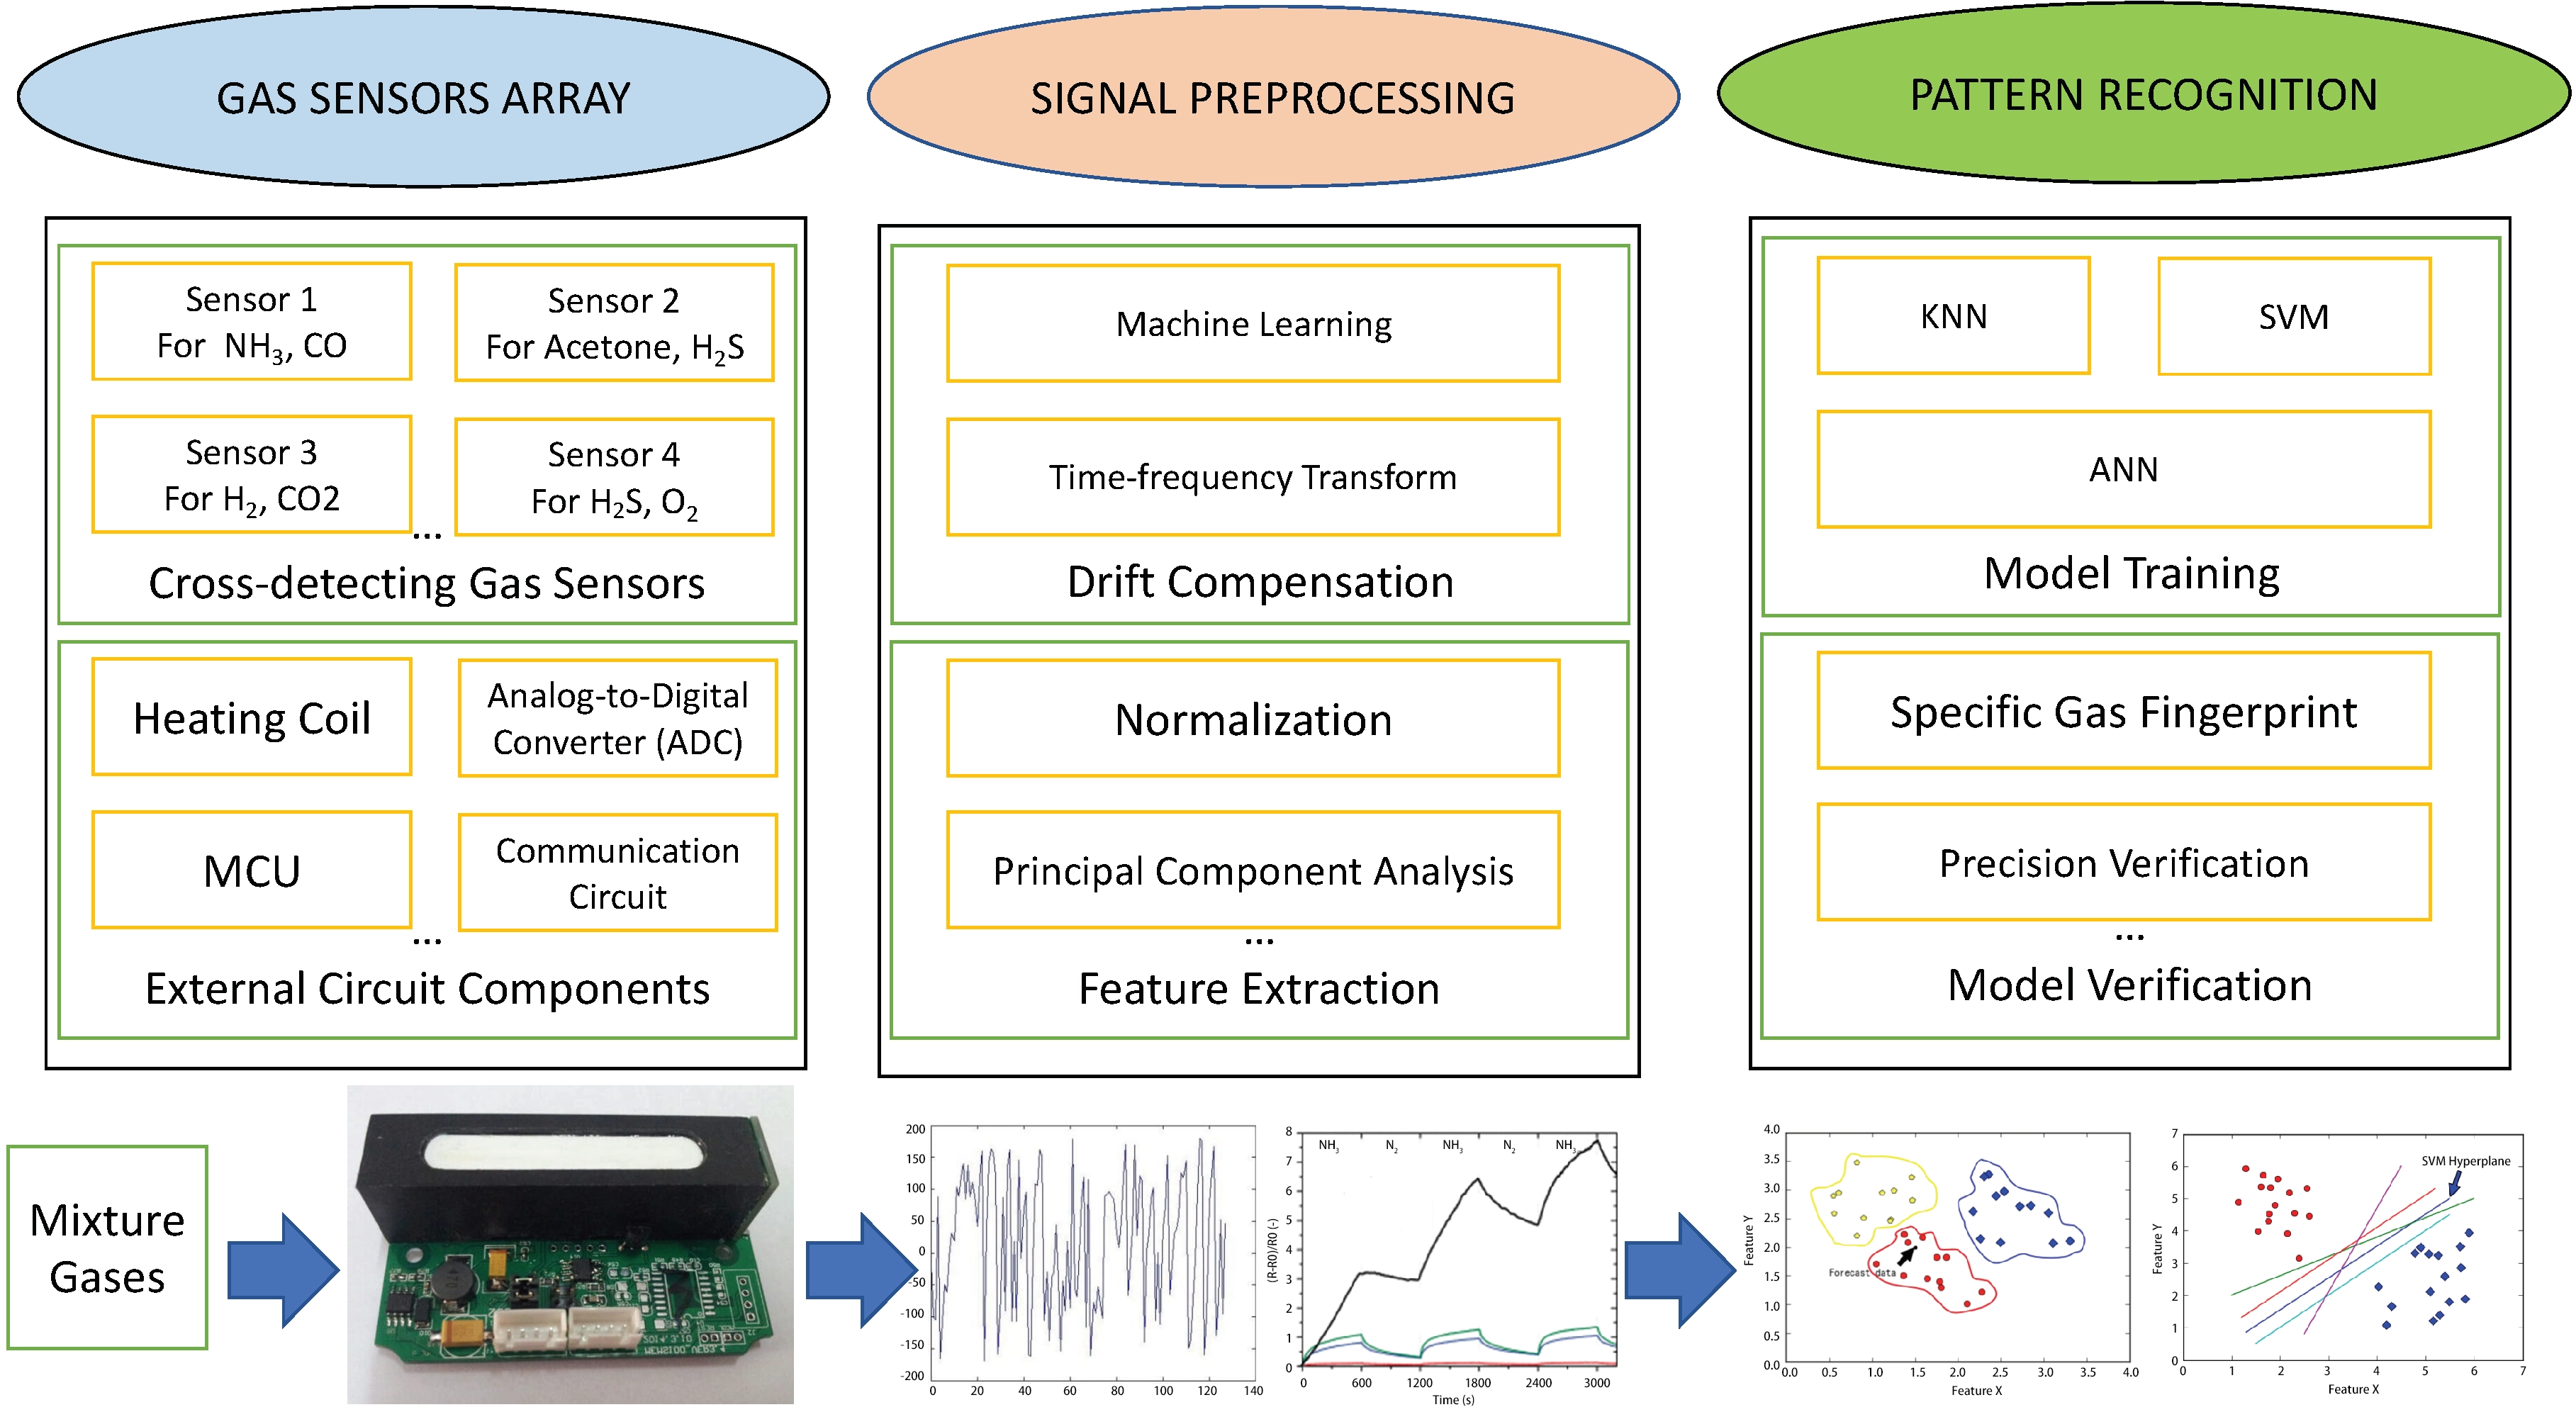
Figure 20. The step of smart gas sensing. Republished with permission from[56]. MCU: micro-controller unit; KNN: k-nearest neighbor; SVM: support vector machine; ANN: artificial neural network.
Initially, sensors in the array respond to the gas mixtures generating a unique set of signals called the gas fingerprint as the input of the system. For all resistive sensors, including TCHS, the inputs are typically variations in resistance, voltage, current, operating temperature, as well as other environmental variables such as relative humidity, flow rate, and pressure, while the outputs are mainly the presence or absence of the target gas, herein hydrogen, and the evolution of its concentration[163]. These original data will undergo preprocessing, such as normalization and drift compensation[164], as they have many problems such as low information utilization, noise, and error. Then, feature extraction is conducted to extract relevant characteristics of the target with less redundancy, followed by two types of models: classification models to detect hydrogen in a mixture, and regression models to estimate and predict its concentration.
Numerous machine learning algorithms are used in the ML process[163], such as support vector machine (SVM), k-nearest neighbors (KNN), artificial neural network (ANN), and so on. For feature extraction, the predominant method used is principal component analysis (PCA). Through applying orthogonal transformations on the set of observations which are interrelated to each other, they can be converted into a set of values of uncorrelated characteristics (the principal components), which retain the core information of the response curve while eliminating redundancy through data dimensionality reduction[165-167]. For classification and regression, the ANN model is widely used[164], which can approximate the complex nonlinear functional relationships between sensor signals and the target gas types and concentrations[168] through several stacked layers of artificial neurons.
Additionally, incorporating ML into a single sensor holds great promise, as the operation of a sensor array is complex and requires a large hardware setup for their implementation in a realistic application[169].
For example, Zhang et al.[170] proposed a sensor based on Pd/SnO2-TiO2/MXene heterojunction. SVM was used to accurately discriminate H2-NH3 mixtures with different proportions, and ANN enabled high-precision quantitative prediction of H2 and NH3 concentrations, as shown in Figure 21a,b. Luo et al.[171] proposed a pulse-driven MEMS gas sensor based on SnO₂ nanosheets, combined with LDA, KNN, and SVM algorithms to achieve accurate identification of H2, CO, and NH3. PCA was used to improve the classification accuracy by reducing dimensionality and highlighting the most significant features, as shown in Figure 21c,d. Li et al.[172] proposed a temperature-modulated sensor array based on PdAu-In₂O₃, combined with LDA, SVC, and SVR algorithms, achieving accurate identification and concentration prediction of H2, ethanol, and their mixed gases in different humidity environments, as shown in Figure 21e,f, with a qualitative classification accuracy of 97.62% for H₂ concentration prediction.
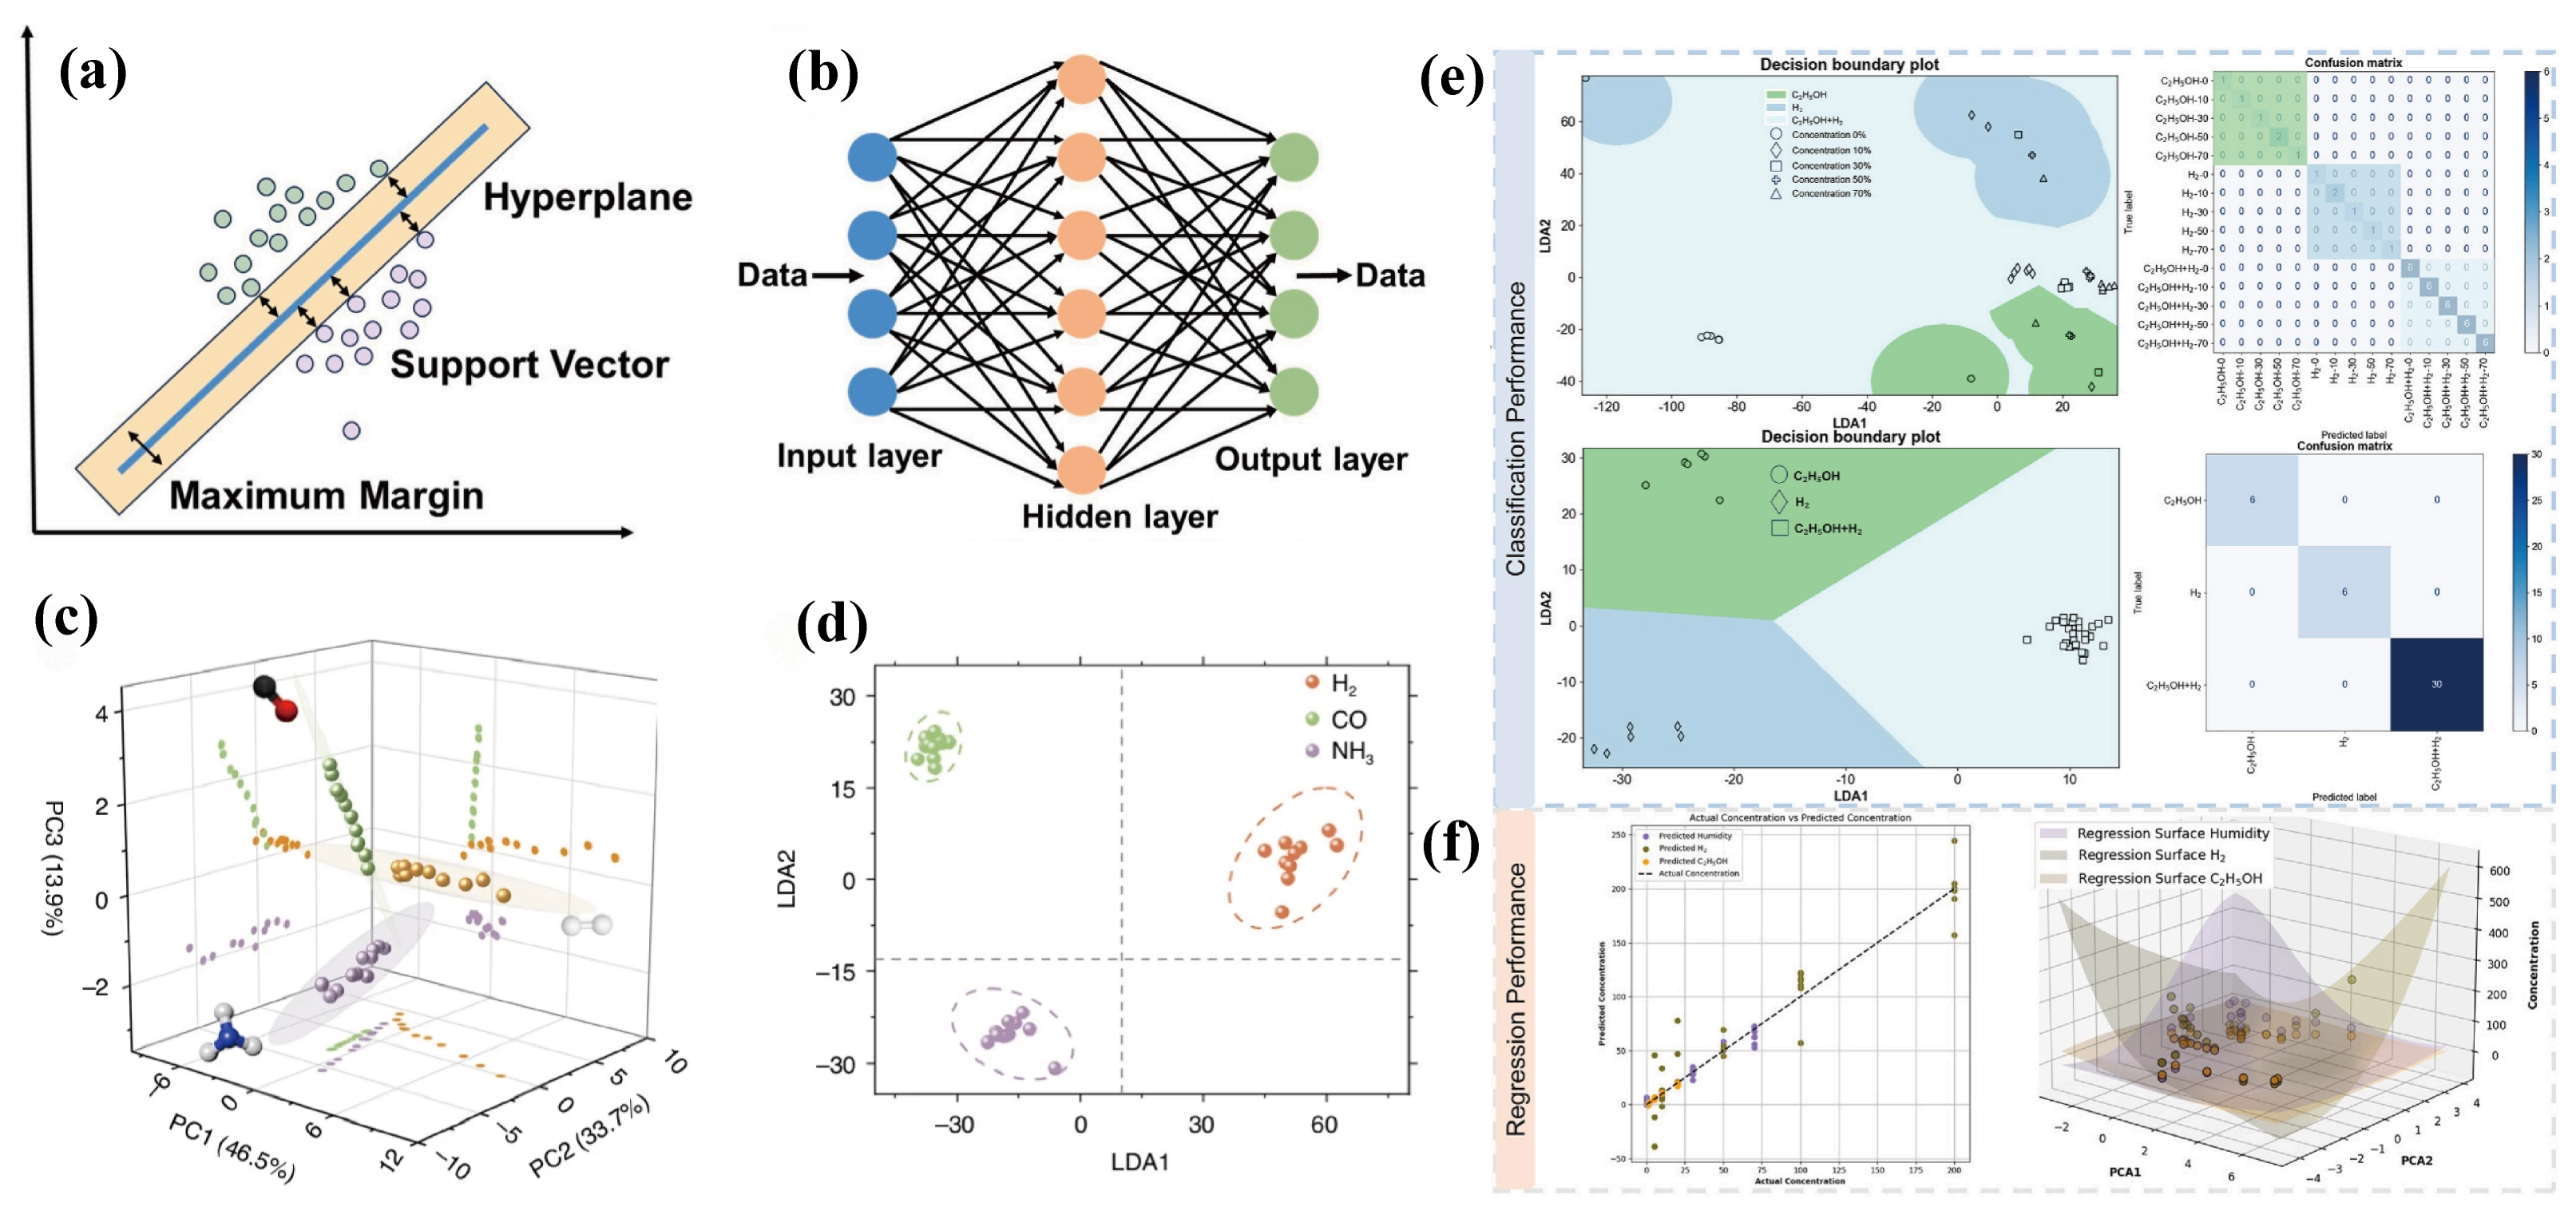
Figure 21. A neural network analysis strategy for detecting/discriminating NH3 and H2 with the senor: (a) Schematic of SVM; (b) Schematic of ANN. Republished with permission from[170]. Classification of three types of gases (H2, CO, NH3) realized by (c) PCA and (d) LDA algorithms. Republished with permission from[171]; (e) After applying LDA dimensionality reduction to the normalized features, classification is performed. The upper figure displays a 15-class classification of three gases (C2H5OH, H2, C2H5OH + H2) under five different humidity levels. In comparison, the lower figure shows the classification of the three gases alone (both include classification decision diagrams and confusion matrices); (f) Concentration Regression: Random forests are used for feature selection, followed by regression on humidity, H2 concentration, and ethanol concentration. The results present comparison plots of actual versus predicted concentrations and regression surface plots. Republished with permission from[172]. SVM: support vector machine; ANN: artificial neural network; LDA: linear discriminant analysis; KNN: k-nearest neighbors; PCA: principal component analysis; SVC: support vector classification; SVR: support vector regression.
Smart gas sensing has been extensively studied in other types of sensors[168,172-175]; however, more research is needed for TCHS. It is conceivable that integrating TCHS into sensor arrays, combined with machine learning to process much richer feature data, or incorporating machine learning into individual TCHS, should effectively enhance the device performance, especially in terms of selectivity[161].
Another development trend that warrants attention is the incorporation of functional materials into TCHS. Some materials that have the potential to enhance the performance of TCHS can be employed, especially in terms of the trace detection capability and selectivity. However, the use of these functional materials may cause TCHS to lose its significant advantage, long lifespan, because the sensing principle may no longer be purely physical. For example, phase change materials represented by palladium (Pd) and vanadium dioxide (VO2) may be introduced, as Pd has strong adsorption affinity for hydrogen[176], and the phase transition of VO2 is highly sensitive to the minimum heat loss caused by trace hydrogen[177]. Meanwhile, the heating element of TCHS can provide stable operation conditions with a relatively low power consumption[178]. Piezoresistive materials with excellent thermal stability can also be employed, as TCHS based on this material may detect the tiny thermal stress caused by trace hydrogen to address the issue of insufficient trace detection capability. For instance, the intrinsically conductive nanocellulose (CNCene) proposed by Li et al.[179] recently, has a high sensitivity of piezoresistive response and excellent thermal stability, which is also environmentally friendly and easy to micro-process. Choudhary et al.[180] recently conducted a comprehensive review of the emerging sensitive materials used in various types of hydrogen sensors, which have the potential to be introduced into the design of TCHS.
7. Conclusion
A comprehensive review of TCHS is presented, covering the working principles, operating modes, performance parameters, models for effective thermal conductivity of gas mixtures, structural designs, gas inlet configurations, influencing factors, and compensation strategies. Recent advancements and future development trends are highlighted, with special emphasis on the pivotal role of emerging smart gas sensing technology characterized by machine learning algorithms, which can simultaneously and efficiently process large amounts of information related to each gas, and then perform precise pattern recognition. TCHS will undoubtedly play an increasingly critical role across diverse fields, and the framework established in this work provides a systematic reference and facilitates the broader application of TCHS, thereby contributing to the safe utilization of hydrogen.
Acknowledgements
Minggang Xia would like to thank Prof. Baowen Li for the kind invitation to contribute to this review paper. DeepSeek-V3.2 was used solely for language polishing. The authors take full responsibility for the final manuscript.
Authors contribution
Ke F, Wu Z, Yin L, Cheng Z: Investigation, writing-original draft, writing-review & editing.
Xia M: Conceptualization, writing-review & editing, funding acquisition, resources, supervision.
Conflicts of interest
The authors declare no conflicts of interest.
Ethical approval
Not applicable.
Consent to participate
Not applicable.
Consent for publication
Not applicable.
Availability of data and materials
Not applicable.
Funding
This work was supported by the National Natural Science Foundation of China (Grant No. 11774278) and the CMC Rapid Support Project (Grant No. 61409220140).
Copyright
© The Author(s) 2026.
References
-
2. Dutta S. Review on solar hydrogen: Its prospects and limitations. Energy Fuels. 2021;35(15):11613-11639.[DOI]
-
3. Edwards PP, Kuznetsov VL, David WIF. Hydrogen energy. Phil Trans R Soc A. 2007;365(1853):1043-1056.[DOI]
-
4. Germscheidt RL, Moreira DEB, Yoshimura RG, Gasbarro NP, Datti E, dos Santos PL, et al. Hydrogen environmental benefits depend on the way of production: An overview of the main processes production and challenges by 2050. Adv Energy Sustain Res. 2021;2(10):2100093.[DOI]
-
5. Staffell I, Scamman D, Velazquez Abad A, Balcombe P, Dodds PE, Ekins P, et al. The role of hydrogen and fuel cells in the global energy system. Energy Environ Sci. 2019;12(2):463-491.[DOI]
-
6. Pan A, Liu J, Liu Z, Yang Y, Yang X, Zhang M. Application of hydrogen energy and review of current conditions. IOP Conf Ser Earth Environ Sci. 2020;526(1):012124.[DOI]
-
7. Abe JO, Popoola API, Ajenifuja E, Popoola OM. Hydrogen energy, economy and storage: Review and recommendation. Int J Hydrog Energy. 2019;44(29):15072-15086.[DOI]
-
8. Wang C, Zhao L, Qu J, Xiao Y, Deng J, Shu CM. Minireview on the leakage ignition and flame propagation characteristics of hydrogen: Advances and perspectives. Energy Fuels. 2023;37(8):5653-5666.[DOI]
-
9. Urs KMB, Sahoo K, Bhat N, Kamble V. Complementary metal oxide semiconductor-compatible top-down fabrication of a Ni/NiO nanobeam room temperature hydrogen sensor device. ACS Appl Electron Mater. 2022;4(1):87-91.[DOI]
-
11. Harumoto T, Fujiki H, Shi J, Nakamura Y. Extremely simple structure hydrogen gas sensor based on single metallic thin-wire under sweep heating. Int J Hydrog Energy. 2022;47(80):34291-34298.[DOI]
-
12. Simon I, Arndt M. Thermal and gas-sensing properties of a micromachined thermal conductivity sensor for the detection of hydrogen in automotive applications. Sens Actuat A Phys. 2002;97-98:104-108.[DOI]
-
13. Berndt D, Muggli J, Wittwer F, Langer C, Heinrich S, Knittel T, et al. MEMS-based thermal conductivity sensor for hydrogen gas detection in automotive applications. Sens Actuat A Phys. 2020;305:111670.[DOI]
-
14. Xie D, Zhang Y, He D, Yang Y, Liu R, Xing C, et al. A high heat transfer efficiency MEMS thermal conductivity gas sensor with bridge structure for hydrogen detection. In: 2024 IEEE 37th International Conference on Micro Electro Mechanical Systems (MEMS); 2024 Jan 21-25; Austin, USA. Piscataway: IEEE; 2024. p. 879-882.[DOI]
-
15. Harumoto T, Shi J, Nakamura Y, Fujiki H. Enhanced hydrogen gas detectability of sweep heating thin-wire thermal conductivity detector. Sens Actuat A Phys. 2023;358:114446.[DOI]
-
16. Zhang D, Sun YE, Jiang C, Zhang Y. Room temperature hydrogen gas sensor based on palladium decorated tin oxide/molybdenum disulfide ternary hybrid via hydrothermal route. Sens Actuat B Chem. 2017;242:15-24.[DOI]
-
17. Wang C, Jin J, Li Y, Ding W, Dai M. Design and fabrication of a MEMS-based gas sensor containing WO3 sensitive layer for detection of NO2. J Micro/Nanolith MEMS MOEMS. 2017;16(1):015002.[DOI]
-
21. Björnsson L, Hörnsten EG, Mattiasson B. Utilization of a palladium-metal oxide semiconductor (Pd-MOS) sensor for on-line monitoring of dissolved hydrogen in anaerobic digestion. Biotechnol Bioeng. 2001;73(1):35-43.[DOI]
-
23. Zhi Z, Gao W, Yang J, Geng C, Yang B, Tian C, et al. Amperometric hydrogen gas sensor based on Pt/C/Nafion electrode and ionic electrolyte. Sens Actuat B Chem. 2022;367:132137.[DOI]
-
25. Hwang BJ, Liu YC, Chen YL. Characteristics of Pt/Nafion® electrodes prepared by a Takenata–Torikai method in sensing hydrogen. Mater Chem Phys. 2001;69(1-3):267-273.[DOI]
-
27. Rîmbu GA, Pîslaru-Dănescu L, Zărnescu GC, Ștefănescu CA, Iordoc M, Teișanu AA, et al. Electrochemical sensor for hydrogen leakage detection at room temperature. Sensors. 2025;25(1):264.[DOI]
-
28. Jang W, Park JS, Lee KW, Roh Y. Methane and hydrogen sensing properties of catalytic combustion type single-chip micro gas sensors with two different Pt film thicknesses for heaters. Micro Nano Syst Lett. 2018;6(1):7.[DOI]
-
29. Lee EB, Hwang IS, Cha JH, Lee HJ, Lee WB, Pak JJ, et al. Micromachined catalytic combustible hydrogen gas sensor. Sens Actuat B Chem. 2011;153(2):392-397.[DOI]
-
30. Del Orbe DV, Yang H, Cho I, Park J, Choi J, Han SW, et al. Low-power thermocatalytic hydrogen sensor based on electrodeposited cauliflower-like nanostructured Pt black. Sens Actuat B Chem. 2021;329:129129.[DOI]
-
32. Theodoridis A, Andersson C, Nilsson S, Fritzsche J, Langhammer C. A catalytic-plasmonic Pt nanoparticle sensor for hydrogen detection in high-humidity environments. ACS Sens. 2025;10(11):8983-8994.[DOI]
-
33. Liu X, Dong H, Xia S. Micromachined catalytic combustion type gas sensor for hydrogen detection. Micro Nano Lett. 2013;8(10):668-671.[DOI]
-
35. Sirbuly DJ, Létant SE, Ratto TV. Hydrogen sensing with subwavelength optical waveguides via porous silsesquioxane-palladium nanocomposites. Adv Mater. 2008;20(24):4724-4727.[DOI]
-
36. Han H, Baik S, Xu B, Seo J, Lee S, Shin S, et al. Bioinspired geometry-switchable Janus nanofibers for eye-readable H2 sensors. Adv Funct Mater. 2017;27(29):1701618.[DOI]
-
37. Wong JY, Schell M. Zero drift NDIR gas sensors. Sens Rev. 2011;31(1):70-77.[DOI]
-
38. Vincent TA, Gardner JW. A low cost MEMS based NDIR system for the monitoring of carbon dioxide in breath analysis at ppm levels. Sens Actuat B Chem. 2016;236:954-964.[DOI]
-
40. Avetisov V, Bjoroey O, Wang J, Geiser P, Paulsen KG. Hydrogen sensor based on tunable diode laser absorption spectroscopy. Sensors. 2019;19(23):5313.[DOI]
-
41. Foorginezhad S, Mohseni-Dargah M, Falahati Z, Abbassi R, Razmjou A, Asadnia M. Sensing advancement towards safety assessment of hydrogen fuel cell vehicles. J Power Sources. 2021;489:229450.[DOI]
-
42. Hübert T, Boon-Brett L, Black G, Banach U. Hydrogen sensors–A review. Sens Actuat B Chem. 2011;157(2):329-352.[DOI]
-
43. Zhang C, Wang T, Zhang G, Gao R, Gao C, Wang Z, et al. Rational design and fabrication of MEMS gas sensors with long-term stability: A comprehensive review. Adv Sci. 2025;12(39):e11555.[DOI]
-
44. Chaparia M, Deepak , Choubey RK, Dwivedi UK. Metal oxide semiconductors for gas sensors: A comprehensive review of materials, mechanisms, and performance. Mater Sci Semicond Process. 2026;204:110280.[DOI]
-
45. Ramaiyan K, Tsui LK, Brosha EL, Kreller C, Stetter JR, Russ T, et al. Recent developments in sensor technologies for enabling the hydrogen economy. ECS Sens Plus. 2023;2(4):045601.[DOI]
-
46. Salimian F, Hemmati A, Ghaemi A. A review of nanostructured carbon dioxide sensors based on electrical and thermal conductivity. Results Eng. 2025;26:105633.[DOI]
-
47. Wang C, Yang J, Li J, Luo C, Xu X, Qian F. Solid-state electrochemical hydrogen sensors: A review. Int J Hydrog Energy. 2023;48(80):31377-31391.[DOI]
-
49. Crucello J, de Oliveira AM, Sampaio NMFM, Hantao LW. Miniaturized systems for gas chromatography: Developments in sample preparation and instrumentation. J Chromatogr A. 2022;1685:463603.[DOI]
-
50. Ejeian F, Azadi S, Razmjou A, Orooji Y, Kottapalli A, Ebrahimi Warkiani M, et al. Design and applications of MEMS flow sensors: A review. Sens Actuat A Phys. 2019;295:483-502.[DOI]
-
51. U.S. Department of Energy. Fuel Cell Technologies Program multi-year research, development, and demonstration plan: section 3.7 hydrogen safety, codes and standards [Internet]. Washington (DC): U.S. Department of Energy; 2015. Available from: https://www.energy.gov/sites/default/files/2015/06/f23/fcto_myrdd_safety_codes.pdf
-
52. Gardner ELW, Gardner JW, Udrea F. Micromachined thermal gas sensors: A review. Sensors. 2023;23(2):681.[DOI]
-
53. Clausius R. LXXI. On the conduction of heat by gases. Lond Edinb Dublin Philos Mag J Sci. 1862;23(157):512-534.[DOI]
-
54. Lindsay AL, Bromley LA. Thermal conductivity of gas mixtures. Ind Eng Chem. 1950;42(8):1508-1511.[DOI]
-
55. Li J, Zhao H, Wang Y, Zhou Y. Approaches for selectivity improvement of conductometric gas sensors: An overview. Sens Diagn. 2024;3(3):336-353.[DOI]
-
56. Feng S, Farha F, Li Q, Wan Y, Xu Y, Zhang T, et al. Review on smart gas sensing technology. Sensors. 2019;19(17):3760.[DOI]
-
57. Boon-Brett L, Black G, Moretto P, Bousek J. A comparison of test methods for the measurement of hydrogen sensor response and recovery times. Int J Hydrog Energy. 2010;35(14):7652-7663.[DOI]
-
58. Palmer PE, Weaver ER. Thermal conductivity method for the analysis of gases. J Frankl Inst. 1924;197(4):554-555.[DOI]
-
59. Zhang Y, Xie D, Yang Y, Xing C, Chen D, Xu L. High heat transfer efficiency MEMS thermal conductivity gas sensor for hydrogen. IEEE Sens J. 2024;24(19):29678-29686.[DOI]
-
60. Cho W, Yoo J, Kwak JH, Shin H. Suspended 1D nanoheaters for ultralow-power thermal conductivity detector-type gas sensors fabricated via a simple four-step wafer-scale process. Sens Actuat B Chem. 2025;443:138283.[DOI]
-
61. Mahdavifar A, Navaei M, Hesketh PJ, Findlay M, Stetter JR, Hunter GW. Transient thermal response of micro-thermal conductivity detector (µTCD) for the identification of gas mixtures: An ultra-fast and low power method. Microsyst Nanoeng. 2015;1:15025.[DOI]
-
64. Feng F, Tian B, Hou L, Yu Z, Zhou H, Ge X, et al. High sensitive micro thermal conductivity detector with sandwich structure. In: 2017 19th international conference on solid-state sensors, actuators and microsystems (TRANSDUCERS); 2017 June 18-22; Kaohsiung, Taiwan. Piscataway: IEEE; 2017.p.1433-1436.[DOI]
-
65. Hayashi Y, Yamazaki H, Masunishi K, Ono D, Saito T, Nakamura N, et al. Integrated hybrid MEMS hydrogen sensor with high sensitivity and high dynamic range. Electr Eng Jpn. 2021;214(2):e23317.[DOI]
-
66. Xie Y, Karamati A, Wang X. Transient electro-thermal technique for measuring the thermal diffusivity/conductivity of 1D/2D materials: From mm down to atomic scale thickness. Thermo X. 2025;1(1).[DOI]
-
67. Healy JJ, de Groot JJ, Kestin J. The theory of the transient hot-wire method for measuring thermal conductivity. Phys B+C. 1976;82(2):392-408.[DOI]
-
68. Cho W, Kim T, Shin H. Thermal conductivity detector (TCD)-type gas sensor based on a batch-fabricated 1D nanoheater for ultra-low power consumption. Sens Actuat B Chem. 2022;371:132541.[DOI]
-
69. Akasaka S, Terumoto K, Kanno I. Temperature dependence of accuracy of thermal conductivity hydrogen sensor. In: 2024 ieee sensors; 2024 Oct 20-23; Kobe, Japan. Piscataway: IEEE; 2024. p. 1-4.[DOI]
-
71. Cruz D, Chang J, Showalter S, Gelbard F, Manginell R, Blain M. Microfabricated thermal conductivity detector for the micro-ChemLab™. Sens Actuat B Chem. 2007;121(2):414-422.[DOI]
-
74. Rousseau E, Siria A, Jourdan G, Volz S, Comin F, Chevrier J, et al. Radiative heat transfer at the nanoscale. Nat Photonics. 2009;3:514-517.[DOI]
-
75. Zhukov VP, Pätz M. On thermal conductivity of gas mixtures containing hydrogen. Heat Mass Transf. 2017;53(6):2219-2222.[DOI]
-
76. Weaver ER, Palmer PE, Frantz HW, Ledig PG, Pickering SF. Automatic methods of gas analysis depending upon thermal conductivity. J Ind Eng Chem. 1920;12(4):359-366.[DOI]
-
77. Weber S. Theoretische und experimentelle untersuchungen über die Wärmeleitfähigkeit von gasgemischen. Ann Der Phys. 1917;359(23):481-502.[DOI]
-
78. Mathur S, Tondon PK, Saxena SC. Thermal conductivity of binary, ternary and quaternary mixtures of rare gases. Mol Phys. 1967;12(6):569-579.[DOI]
-
79. Udoetok ES. Thermal conductivity of binary mixtures of gases. Front Heat Mass Transf. 2013;4(2):1-5.[DOI]
-
80. Zhukov VP. Computational fluid dynamics simulations of a GO2/GH2 single element combustor. J Propuls Power. 2015;31(6):1707-1714.[DOI]
-
81. Gray P, Holland S, Maczek AOS. Thermal conductivities of binary gaseous mixtures of hydrogen, deuterium, oxygen and nitrous oxide. Trans Faraday Soc. 1969;65:1032.[DOI]
-
82. Mason EA, Saxena SC. Approximate formula for the thermal conductivity of gas mixtures. Phys Fluids. 1958;1(5):361-369.[DOI]
-
83. Poling BE, Prausnitz JM, O'Connell JP. The Properties of Gases and Liquids. 5nd ed. New York: McGraw-Hill; 2000.
-
84. Chung TH, Ajlan M, Lee LL, Starling KE. Generalized multiparameter correlation for nonpolar and polar fluid transport properties. Ind Eng Chem Res. 1988;27(4):671-679.[DOI]
-
85. Hirschfelder JO, Bird RB, Spotz EL. The transport properties for non-polar gases. J Chem Phys. 1948;16(10):968-981.[DOI]
-
86. Curtiss CF, Hirschfelder JO. Transport properties of multicomponent gas mixtures. J Chem Phys. 1949;17(6):550-555.[DOI]
-
88. Sheoran J, Kumar R. Design and Characteristics of various types of gas sensors for hydrogen sulfide gas detection - A Review. J Phys Conf Ser. 2022;2267(1):012008.[DOI]
-
89. Chu SY, Wu MJ, Yeh TH, Lee CT, Lee HY. Sensing mechanism and characterization of NO2 gas sensors using gold-black NP-decorated Ga2O3 nanorod sensing membranes. ACS Sens. 2024;9(1):118-125.[DOI]
-
90. Bhati VS, Kumar M, Banerjee R. Gas sensing performance of 2D nanomaterials/metal oxide nanocomposites: A review. J Mater Chem C. 2021;9(28):8776-8808.[DOI]
-
91. Ménil F, Susbielles M, Debéda H, Lucat C, Tardy P. Evidence of a correlation between the non-linearity of chemical sensors and the asymmetry of their response and recovery curves. Sens Actuat B Chem. 2005;106(1):407-423.[DOI]
-
92. Gerblinger J, Meixner H. Fast oxygen sensors based on sputtered strontium titanate. Sens Actuat B Chem. 1991;4(1-2):99-102.[DOI]
-
93. Tobias P, Mårtensson P, Göras A, Lundström I, Lloyd Spetz A. Moving gas outlets for the evaluation of fast gas sensors. Sens Actuat B Chem. 1999;58(1-3):389-393.[DOI]
-
94. Sawaguchi N, Nishibori M, Tajima K, Shin W, Izu N, Murayama N, et al. Practical test methods for hydrogen gas sensor response characterization. Electrochemistry. 2006;74(4):315-320.[DOI]
-
95. Hoffmann M, Wienecke M, Ciudin R. MEMS-based hydrogen sensors: A state of the art review. In: 2023 International Interdisciplinary PhD Workshop (IIPhDW); 2023 May 3-5; Wismar, Germany. Piscataway: IEEE; 2023. p. 1-4.[DOI]
-
96. Kaanta BC, Chen H, Lambertus G, Steinecker WH, Zhdaneev O, Zhang X. High sensitivity micro-thermal conductivity detector for gas chromatography. In: 2009 IEEE 22nd International Conference on Micro Electro Mechanical Systems; 2009 Jan 25-29; Sorrento, Italy. Piscataway: IEEE; 2009. p. 264-267.[DOI]
-
97. Jayaraj MK. Nanostructured metal oxides and devices: Optical and electrical properties. Singapore: Springer; 2020.[DOI]
-
98. International Organization for Standardization. ISO 26142:2010: Hydrogen detection apparatus—Stationary applications [Internet]. Geneva (CH): International Organization for Standardization; 2010. Avaliable from: https://cdn.standards.iteh.ai/samples/52319/a5cab00c94b942dd831df4fc3b2d0956/ISO-26142-2010.pdf
-
99. Yan M, Tylczak J, Yu Y, Panagakos G, Ohodnicki P. Multi-component optical sensing of high temperature gas streams using functional oxide integrated silica based optical fiber sensors. Sens Actuat B Chem. 2018;255:357-365.[DOI]
-
100. Faleh R, Othman M, Kachouri A, Aguir K. Recognition of O3 concentration using WO3 gas sensor and principal component analysis. In: 2014 1st International Conference on Advanced Technologies for Signal and Image Processing (ATSIP); 2014 March 17-19; Sousse, Tunisia. Piscataway: IEEE; 2014. p. 322-327.[DOI]
-
101. Tomchenko AA, Harmer GP, Marquis BT, Allen JW. Semiconducting metal oxide sensor array for the selective detection of combustion gases. Sens Actuat B Chem. 2003;93(1-3):126-134.[DOI]
-
103. International Union of Pure and Applied Chemistry. Commission on spectrochemical and other optical procedures for analysis. Pure Appl Chem. 1976;45(2):99-103.[DOI]
-
104. Chai H, Zheng Z, Liu K, Xu J, Wu K, Luo Y, et al. Stability of metal oxide semiconductor gas sensors: A review. IEEE Sens J. 2022;22(6):5470-5481.[DOI]
-
105. Swager TM, Pioch TN, Feng H, Bergman HM, Luo SL, Valenza JJ II. Critical sensing modalities for hydrogen: Technical needs and status of the field to support a changing energy landscape. ACS Sens. 2024;9(5):2205-2227.[DOI]
-
106. Daynes HA, Shakespear GA. The theory of the katharometer. Proc R Soc Lond Ser A Contain Pap a Math Phys Character. 1920;97(685):273-286.[DOI]
-
107. Minter CC. The thermal conductivity method of gas analysis. J Chem Educ. 1946;23(5):237.[DOI]
-
108. Gomi H, Yoshino T. Resistivity, Seebeck coefficient, and thermal conductivity of platinum at high pressure and temperature. Phys Rev B. 2019;100(21):214302.[DOI]
-
109. Ibbs TL, Hirst AA. The thermal conductivity of gas mixtures. Proc A. 1929;123(791):134-142.[DOI]
-
110. Browning BL. Gas analysis by measurement of the thermal conductivity [dissertation]. Rolla(MO): Missouri School of Mines and Metallurgy; 1931. Avaliable from: https://scholarsmine.mst.edu/professional_theses/308/
-
111. Choi KW, Jo MS, Lee JS, Yoo JY, Yoon JB. Perfectly aligned, air-suspended nanowire array heater and its application in an always-on gas sensor. Adv Funct Mater. 2020;30(39):2004448.[DOI]
-
113. Gardner JW, Varadan VK, Awadelkarim OO. Microsensors, MEMS, and smart devices. Hoboken: John Wiley & Sons; 2001.[DOI]
-
114. Han YF, Sun YZ, Wang M, Liu Q, Tao R. Products of sensors and MEMS. In: Wang Y, Chi MH, Lou JJ, Chen CZ. editors. Handbook of integrated circuit industry. Singapore: Springer; 2024. p. 357-381.
-
116. Petersen K. Silicon as a mechanical material. MRS Online Proc Libr. 1986;76(1):99-110.[DOI]
-
117. van Putten AFP. An integrated silicon double bridge anemometer. Sens Actuat. 1983;4:387-396.[DOI]
-
118. Narayanan S, Alfeeli B, Agah M. Two-port static coated micro gas chromatography column with an embedded thermal conductivity detector. IEEE Sens J. 2012;12(6):1893-1900.[DOI]
-
119. Chen X, Wong CKY, Yuan CA, Zhang G. Nanowire-based gas sensors. Sens Actuat B Chem. 2013;177:178-195.[DOI]
-
120. Chen B, Ma S, Zhu Y, Li W, Zhao B, Feng F. A micro thermal conductivity detector with diffusion channels suppressing the effect of forced convection. Microchem J. 2025;208:112521.[DOI]
-
122. Wang C, Jiao B, Liu X, Zhao C, Wu G, Liu R. Design of thermal conductivity gas sensor with silicon cap. In: 2023 IEEE 16th international conference on electronic measurement & instruments (ICEMI); 2023 August 9-11; Harbin, China. Piscataway: IEEE; IEEE 2023. p. 204-208.[DOI]
-
123. Cheng L, Chen Y, Jiang T, Wang J, Li X, Xu P. A study on micropillar fin-integrated thermal conductivity sensor for hydrogen response speed enhancement and flow rate interference suppression. IEEE Trans Electron Devices. 2025;72(6):3347-3351.[DOI]
-
124. Kaanta BC, Chen H, Zhang X. A monolithically fabricated gas chromatography separation column with an integrated high sensitivity thermal conductivity detector. J Micromech Microeng. 2010;20(5):055016.[DOI]
-
125. de Graaf G, Prouza AA, Ghaderi M, Wolffenbuttel RF. Micro thermal conductivity detector with flow compensation using a dual MEMS device. Sens Actuat A Phys. 2016;249:186-198.[DOI]
-
126. Leonardi SG, Bonavita A, Donato N, Neri G. Development of a hydrogen dual sensor for fuel cell applications. Int J Hydrog Energy. 2018;43(26):11896-11902.[DOI]
-
128. Cho W, Yoo J, Kwak JH, Shin H. Eco-friendly fabrication of suspended 1D nanoheaters for ultralow power TCD-type gas sensors. In: 2025 IEEE 38th International Conference on Micro Electro Mechanical Systems (MEMS); 2025 Jan 19-23; Kaohsiung, Taiwan. Piscataway: IEEE; 2025. p. 885-887.[DOI]
-
129. Struk D, Shirke A, Mahdavifar A, Hesketh PJ, Stetter JR. Investigating time-resolved response of micro thermal conductivity sensor under various modes of operation. Sens Actuat B Chem. 2018;254:771-777.[DOI]
-
130. Dong L, Xu Z, Xuan W, Yan H, Liu C, Zhao WS, et al. A characterization of the performance of gas sensor based on heater in different gas flow rate environments. IEEE Trans Ind Inf. 2020;16(10):6281-6290.[DOI]
-
131. Sun J, Chen T, Tan T, Wang D, Zhu X, Zhang X, et al. Fabrication and characterization of a novel micro-thermal conductivity detector for monitoring small-molecule gases. IEEE Sens J. 2020;20(19):11115-11121.[DOI]
-
132. Kestin J, Wakeham WA. Calculation of the influence of density on the thermal conductivity of gaseous mixtures. Ber Bunsenges Phys Chem. 1980;84(8):762-769.[DOI]
-
133. Bokhoven C, Dijkstra A. Effect of carrier gas on the sensitivity of thermal conductivity detectors. Nature. 1960;186:793-794.[DOI]
-
134. Holman JP. Heat Transfer. 9th ed. Boston: McGraw-Hill International Book Company; 2002.
-
135. Rothman AJ. Thermal Conductivity of Gases at High Temperatures [Internet]. Berkeley (CA): University of California Radiation Laboratory; 1954. Available from: https://escholarship.org/content/qt6vv328pc/qt6vv328pc.pdf?t=p0vhgm
-
137. Kimura M, Manaka J, Satoh S, Takano S, Igarashi N, Nagai K. Application of the air-bridge microheater to gas detection. Sens Actuat B Chem. 1995;25(1-3):857-860.[DOI]
-
138. Arndt M. Micromachined thermal conductivity hydrogen detector for automotive applications. In: SENSORS, 2002 IEEE; 2002 June 12-14; Orlando, USA. Piscataway: IEEE; 2002. p. 1571-1575.[DOI]
-
139. Dinh T, Nguyen T, Phan HP, Dau V, Dao D, Nguyen NT. Physical sensors: Thermal sensors. Encycl Sens Biosens. 2023;1:20-33.[DOI]
-
140. Lotfi A, Navaei M, Hesketh PJ. A platinum cantilever-based thermal conductivity detector for ammonia sensing using the 3-omega technique. ECS J Solid State Sci Technol. 2019;8(6):Q126-Q133.[DOI]
-
141. Mahdavifar A, Aguilar R, Peng Z, Hesketh PJ, Findlay M, Stetter JR, et al. Simulation and fabrication of an ultra-low power miniature microbridge thermal conductivity gas sensor. J Electrochem Soc. 2014;161(4):B55-B61.[DOI]
-
142. Kuo JTW, Yu L, Meng E. Micromachined thermal flow sensors: A review. Micromachines. 2012;3(3):550-573.[DOI]
-
143. Kaanta BC, Jonca AJ, Chen H, Zhang X. Temperature distribution on thermal conductivity detectors for flow rate insensitivity. Sens Actuat A Phys. 2011;167(2):146-151.[DOI]
-
145. Zhao B, Feng F, Tian B, Yu Z, Li X. Micro thermal conductivity detector based on SOI substrate with low detection limit. Sens Actuat B Chem. 2020;308:127682.[DOI]
-
146. Rastrello F, Placidi P, Scorzoni A, Cozzani E, Messina M, Elmi I, et al. Thermal conductivity detector for gas chromatography: Very wide gain range acquisition system and experimental measurements. IEEE Trans Instrum Meas. 2013;62(5):974-981.[DOI]
-
147. Reyes Romero DF, Kogan K, Cubukcu AS, Urban GA. Simultaneous flow and thermal conductivity measurement of gases utilizing a calorimetric flow sensor. Sens Actuat A Phys. 2013;203:225-233.[DOI]
-
148. Reyes-Romero DF, Cubukcu AS, Urban GA. Measurement and simulation of the frequency response of a thermal flow sensor at different flow speeds. Sens Actuat A Phys. 2013;189:168-176.[DOI]
-
149. Wu H, Grabarnik S, Emadi A, de Graaf G, Wolffenbuttel RF. Characterization of thermal cross-talk in a MEMS-based thermopile detector array. J Micromech Microeng. 2009;19(7):074022.[DOI]
-
150. Lafferty JM. Foundations of Vacuum Science and Technology. New York: John Wiley & Sons, Inc; 1998.
-
151. Incropera FP, DeWitt DP. Introduction to Heat Transfer. New York: John Wiley & Sons, Inc; 2002.
-
152. Langmuir I. The convection and conduction of heat in gases. Trans Am Inst Electr Eng. 1912;1:1229-1240.[DOI]
-
153. Brody I, Kőrösy F. Convection and conduction of heat in gases. J Appl Phys. 1939;10(8):584-596.[DOI]
-
154. Dickins BG. The effect of accommodation on heat conduction through gases. Proc A. 1934;143(850):517-540.[DOI]
-
155. Clifford AA, Gray P, Johns AI, Scott AC, Watson JTR. Thermal conductivities of argon, nitrogen and hydrogen between 300 and 400 K and up to 25 MPa. J Chem Soc Faraday Trans. 1981;77(11):2679.[DOI]
-
156. Moroe S, Woodfield PL, Kimura K, Kohno M, Fukai J, Fujii M, et al. Measurements of hydrogen thermal conductivity at high pressure and high temperature. Int J Thermophys. 2011;32(9):1887.[DOI]
-
157. Akimoto Y, Wang P, Kurui Y, Fujiwara N, Hiramatsu N, Ishibashi F, et al. Real-time sensing technology of mixed gas concentrations using multiple micromachined thermal conductivity detectors. Elect Comm Japan. 2025;108:e12473.[DOI]
-
159. Yu Y, Cao X, Li C, Zhou M, Liu T, Liu J, et al. A review of machine learning-assisted gas sensor arrays in medical diagnosis. Biosensors. 2025;15(8):548.[DOI]
-
160. Savio KT, Mishra A, Pandey AK, Singh SK, Sajana S, Adak C, et al. Data-driven approach toward the quantification of gases in a complex mixture using a non-selective single metal oxide gas sensor. ACS Sens. 2026.[DOI]
-
161. Pradyumn , Barman PB, Sil A, Hazra SK. Recent advancement in selective gas sensors and role of machine learning. J Alloys Compd. 2025;1030:180757.[DOI]
-
162. Stetter JR. Introduction: experimental methods in chemical sensor and sensor array evaluation and development. In: Ryan MA, Shevade AV, Taylor CJ, Homer ML, Blanco M, Stetter JR, editors. Computational methods for sensor material selection. New York: Springer; 2010. p. 3-46.[DOI]
-
164. Ghorbani B, Vijayaraghavan K. Developing a virtual hydrogen sensor for detecting fuel starvation in solid oxide fuel cells using different machine learning algorithms. Int J Hydrog Energy. 2020;45(51):27730-27744.[DOI]
-
165. Pandey V, Kumar A, Bharath SP, Auti CB, Kumar P, Gupta A, et al. Real-time hydrogen monitoring via Pd/g-C3N4 functionalized HEMT sensor with IoT connectivity and machine learning forecasting. Sens Actuat B Chem. 2026;450:139217.[DOI]
-
167. Luo W, Zheng Y, Liu Y, Li M. Identification of H2 and NH3 gases using calorimetric signals and transient response through machine learning. J Semicond. 2026;47(2):022303.[DOI]
-
168. Wang YT, Zou QK, Wang ZX, Jin T, Guo X. Intelligent early detection of lithium-ion battery thermal runaway via H₂/CO sensor arrays and signal processing algorithms. Sens Actuat B Chem. 2026;451:139337.[DOI]
-
169. Yaqoob U, Younis MI. Chemical gas sensors: Recent developments, challenges, and the potential of machine learning: A review. Sensors. 2021;21(8):2877.[DOI]
-
170. Zhang A, Zhang Y, Cheng W, Li X, Chen K, Li F, et al. Dual-gas sensing via SnO2-TiO2 heterojunction on MXene: Machine learning-enhanced selectivity and sensitivity for hydrogen and ammonia detection. Sens Actuat B Chem. 2025;429:137340.[DOI]
-
171. Luo W, Dai F, Liu Y, Wang X, Li M. Pulse-driven MEMS gas sensor combined with machine learning for selective gas identification. Microsyst Nanoeng. 2025;11:72.[DOI]
-
172. Li L, Zhou L, Chen Y, Chen X, Guo L, Zhang W, et al. Precision hydrogen detection in mixed atmospheres using temperature-modulated PdAu-In2O3 sensor arrays and machine learning algorithms. Chem Eng J. 2025;520:165633.[DOI]
-
173. Wu M, Wu Z, Chen H, Wu Z, Zhang P, Qi L, et al. A high-precision hydrogen sensor array based on Pt-modified SnO2 for suppressing humidity and oxygen interference. Chemosensors. 2025;13(8):294.[DOI]
-
175. Zappa D, Kaur N, Moumen A, Comini E. Metal oxide nanowire-based sensor array for hydrogen detection. Micromachines. 2023;14(11):2124.[DOI]
-
176. Kim KH, Jo MS, Kim SH, Kim B, Kang J, Yoon JB, et al. Long-term reliable wireless H2 gas sensor via repeatable thermal refreshing of palladium nanowire. Nat Commun. 2024;15:8761.[DOI]
-
178. Liu Q, Yao J, Wu Y, Wang Y, Ding G. Two operating modes of palladium film hydrogen sensor based on suspended micro hotplate. Int J Hydrog Energy. 2019;44(21):11259-11265.[DOI]
-
179. Li Z, Chen G, Guan J, Huang C, Gao Z, Chen X, et al. Confined graphitization of cellulose polymorphs enables high-performance piezoresistive electronics. Chem Eng J. 2025;523:168681.[DOI]
-
180. Choudhary M, Shrivastav A, Sinha AK, Chawla AK, Avasthi DK, Saravanan K, et al. Emerging nanomaterials for hydrogen sensing: Mechanisms and prospects. Int J Hydrog Energy. 2024;77:557-574.[DOI]
Copyright
© The Author(s) 2026. This is an Open Access article licensed under a Creative Commons Attribution 4.0 International License (https://creativecommons.org/licenses/by/4.0/), which permits unrestricted use, sharing, adaptation, distribution and reproduction in any medium or format, for any purpose, even commercially, as long as you give appropriate credit to the original author(s) and the source, provide a link to the Creative Commons license, and indicate if changes were made.
Publisher’s Note
Science Exploration remains a neutral stance on jurisdictional claims in published
maps
and institutional affiliations. The views expressed in this article are solely those
of
the author(s) and do not reflect the opinions of the Editors or the publisher.
Share And Cite


Science Exploration Style
Ke F, Wu Z, Yin L, Cheng Z, Xia M. Thermal conductivity hydrogen sensor: From fundamental principles to smart gas sensing applications. Thermo-X. 2026;2:202605. https://doi.org/10.70401/tx.2026.0017
Tips
Copy completed.
Submit a Manuscript
Author Instructions
Cite this Article
Article Metrics
0
View
0
Download
Cited
Article Updates

- Abstract
- Keywords
- 1. Introduction
- 2. Sensing Principle
- 3. Key Performance Parameters
- 4. Key Components and Structure
- 5. Influencing Factors of Sensing
- 6. Recent Developments and Outlook
- 7. Conclusion
- Acknowledgements
- Authors contribution
- Conflicts of interest
- Ethical approval
- Consent to participate
- Consent for publication
- Availability of data and materials
- Funding
- References
- Copyright
Science Exploration Style
Ke F, Wu Z, Yin L, Cheng Z, Xia M. Thermal conductivity hydrogen sensor: From fundamental principles to smart gas sensing applications. Thermo-X. 2026;2:202605. https://doi.org/10.70401/tx.2026.0017
copy
Share Link
copy