Predicting spatial transcriptomics from histology images: Progress, challenges, and directions

Kexin Xu
1,2

,
Hashem Koohy
1,2
,
Agne Antanaviciute
1,2,*
*Correspondence to:
Agne Antanaviciute, Medical Research Council (MRC) Translational Immune Discovery Unit, Weatherall Institute of Molecular Medicine (WIMM), University of Oxford, Oxford OX3 9DS, UK; Medical Research Council (MRC) WIMM Centre for Computational Biology, Weatherall Institute of Molecular Medicine (WIMM), University of Oxford, Oxford OX3 9DS, UK.
E-mail: agne.antanaviciute@rdm.ox.ac.uk
EXO. 2026;1:202619. 10.70401/EXO.2026.0020
Received: May 26, 2026Accepted: September 10, 2026Published: September 10, 2026
Abstract
Spatial transcriptomics (ST) maps gene expression within intact tissues, but its cost and technical complexity limit broad adoption. A growing body of deep-learning methods now seeks to infer ST directly from routine histology images, especially hematoxylin and eosin (H&E)-stained slides, with the aim of turning archived pathology material into virtual molecular data. This review examines more than 40 ST prediction models, comparing their data requirements, modelling strategies, evaluation practices, and translational potential. Recent advances in model architecture, histology foundation models, and higher-resolution in situ ST platforms have improved prediction performance and expanded the range of potential applications. However, most current methods still show limited robustness and generalisability, with performance constrained primarily by the quantity, quality, and diversity of available ST training data. Comparisons between models also remain difficult due to inconsistent pre-processing pipelines, training datasets and evaluation strategies. The field is increasingly recognising that progress depends not only on more sophisticated models, but also on standardised benchmarks, improved data harmonisation and clearer evaluation frameworks. Despite these limitations, ST prediction is already showing utility in research settings, including biomarker discovery, tissue domain inference, molecular super-resolution and large-scale analysis of archived histology cohorts. Emerging applications also include patient stratification, virtual molecular profiling and multi-modal pathology systems that integrate histology, transcriptomics and language models. As datasets continue to expand and models become more reliable, ST prediction has the potential to become an important component of next-generation digital pathology workflows.
Keywords
Digital pathology, spatial transcriptomics, deep learning, foundation model, biomarker prediction
1. Introduction
Spatial transcriptomics (ST) enables the measurement of gene expression within intact tissues while preserving spatial context and has rapidly become a transformative tool for mapping tissue microenvironments and cellular crosstalk[1-3]. Despite its transformative potential, routine use of ST outside of research settings remains limited by cost, assay complexity, infrastructural challenges, and stringent sample requirements. Analysed cohorts are still typically small, limiting the statistical power to detect associations with biomarkers, prognosis, and treatment response[4-6].
Although technologies vary, ST experiments often generate a haematoxylin and eosin (H&E)-stained histology image from the same tissue section or from a paired adjacent tissue section. H&E is inexpensive to acquire, ubiquitous in clinical pathology[7] and captures cellular and architectural tissue features that plausibly relate to molecular states. This pairing has motivated a growing body of literature on applying artificial intelligence and machine learning approaches to predict spatial gene expression directly from H&E images. If such models could accurately infer expression patterns from H&E, they would effectively project molecular data onto standard histology, turning archived slides into virtual molecular datasets.
Prediction of ST features from H&E images sits within the broader field of digital pathology, but unlike black-box histology-based predictors of outcomes, ST-prediction models can output intermediate molecular and cellular features, serving as a potentially interpretable link between image patterns and biological pathways that could guide hypothesis generation, biological discovery, and ultimately, clinical triage.
This review summarises the current data landscape for ST prediction, the modelling strategies proposed thus far, the empirical limits of current models, and the practical steps required to move from proof-of-concept models to robust, generalisable tools.
2. Assumptions Behind ST Prediction Models
ST prediction is typically formulated as a supervised learning task, in which an H&E image or small image patch is used to predict paired ST measurements from the same tissue. The objective is commonly posed as a regression problem, where a model aims to minimise the difference between measured and predicted gene expression. Most existing methods formulate this as regression of individual gene expression, although the underlying objective is more broadly to infer molecular features from tissue morphology.
Implicitly, this formulation assumes that morphological information captured in H&E provides sufficient information to reconstruct molecular states. It is therefore important to consider the biological assumptions underlying this task and where they might break down.
● H&E sufficiency: We assume that histological images capture enough morphological detail to enable predictions. This may be true for some cell-identity programmes, and even pathways such as cell cycle, immune activity, glycolysis, or hypoxia-associated transcriptional programmes, which may correlate with features such as necrosis and poorly perfused tumour regions[8]. However, other molecular programmes, including some metabolic pathways, may have a weaker or less readily detectable morphological footprint in routine histological stains, potentially limiting their predictability from histological images alone[8].
● Morphology-molecular coupling: We assume that cellular and tissue morphology systematically reflects underlying gene expression programmes. However, cells may alter their functions without immediate morphological consequences (metabolic shifts, transient signalling), limiting intrinsic predictability for those targets.
● Locality: We assume that gene expression measured by ST is a function of cell-intrinsic and local tissue-landscape effects. This is challenged by diffusible cues (cytokine, chemokine, or morphogen gradients), systemic factors (hormones and neural signalling), and cell migration, all of which can create non-local influences on gene expression.
● Temporal stability: We assume that changes in morphology and gene expression are roughly synchronous. Where transcriptional changes precede morphological manifestation, H&E-based models will lag, thereby reducing our ability to predict early or transient tissue states.
● Representative training data and label fidelity: We assume that training cohorts capture the morphological and molecular diversity of intended deployment settings and that the ST measurements themselves provide a reliable ground truth, not dominated by technical noise such as dropouts or transcript diffusion.
Although these assumptions underpin virtually all current ST prediction models, their extent and variation across tasks and biological domains remains largely unquantified[9,10]. Most studies evaluate prediction accuracy using broad gene-level correlation metrics, which provide little insight into which transcriptional programmes are recoverable from morphology. Consequently, the field still lacks a systematic understanding of what is and is not predictable from H&E and where the theoretical performance ceiling lies. It also remains unclear to what extent current models recover molecular states beyond inferring cell-type markers, as little analysis has been done to disentangle prediction of cell-identity markers from functional cell states[8]. To address this, prediction performance should be evaluated before and after adjusting for cell-type composition, or compared against composition-only baselines, to determine whether models capture molecular states rather than tissue composition alone. It will therefore be critical for future studies to move beyond reporting overall prediction accuracy and instead characterise the biological limits of ST prediction. For example, morphology-transcriptome coupling could be quantified by estimating shared variance between image embeddings and gene expression, while prediction performance could be stratified by biologically meaningful genes or pathways.
3. ST Data Ecosystem
Unlike many computer vision tasks, the principal limitation in ST prediction is not model architecture but the availability and quality of paired image-transcriptome data. The data landscape determines what models can learn. ST technologies are rapidly diversifying but can be broadly grouped into two categories: sequencing-based and imaging-based platforms, each with distinct characteristics and trade-offs (Figure 1)[11]. Sequencing-based ST, such as Visium and its lower-resolution predecessor[12], can capture whole transcriptome coverage at spot diameters of 55-100 μm, which typically encompass aggregates of 5-40 cells. These data can suffer from sparsity due to dropouts and introduce other sources of noise such as transcript diffusion. However, the next generation of these platforms, such as Visium HD, offers increased sensitivity and resolution. Imaging-based in situ ST (e.g., Merscope, CosMx, Xenium) achieves single-cell or subcellular resolution with higher sensitivity, but historically relied on targeted gene panels, creating measurement blind-spots. Recently, higher-resolution sequencing-based platforms, such as Visium High Definition (HD) and emerging next-generation high-plex or whole-transcriptome in situ assays (e.g., Atera, CosMx Whole Transcriptome (WTX)), aim to bridge the current divide between whole-transcriptome sequencing and high-resolution imaging. While ST prediction models have yet to be developed and benchmarked on these data at scale, they are expected to provide substantially richer training data and reduce current trade-offs between spatial resolution and transcriptome coverage. Consequently, no single ST platform provides optimal ground truth for every prediction task; the most appropriate platform depends on whether the objective is transcriptome-wide prediction, cell-level biomarker prediction, or inference of higher-order biological features such as cell types or tissue domains.
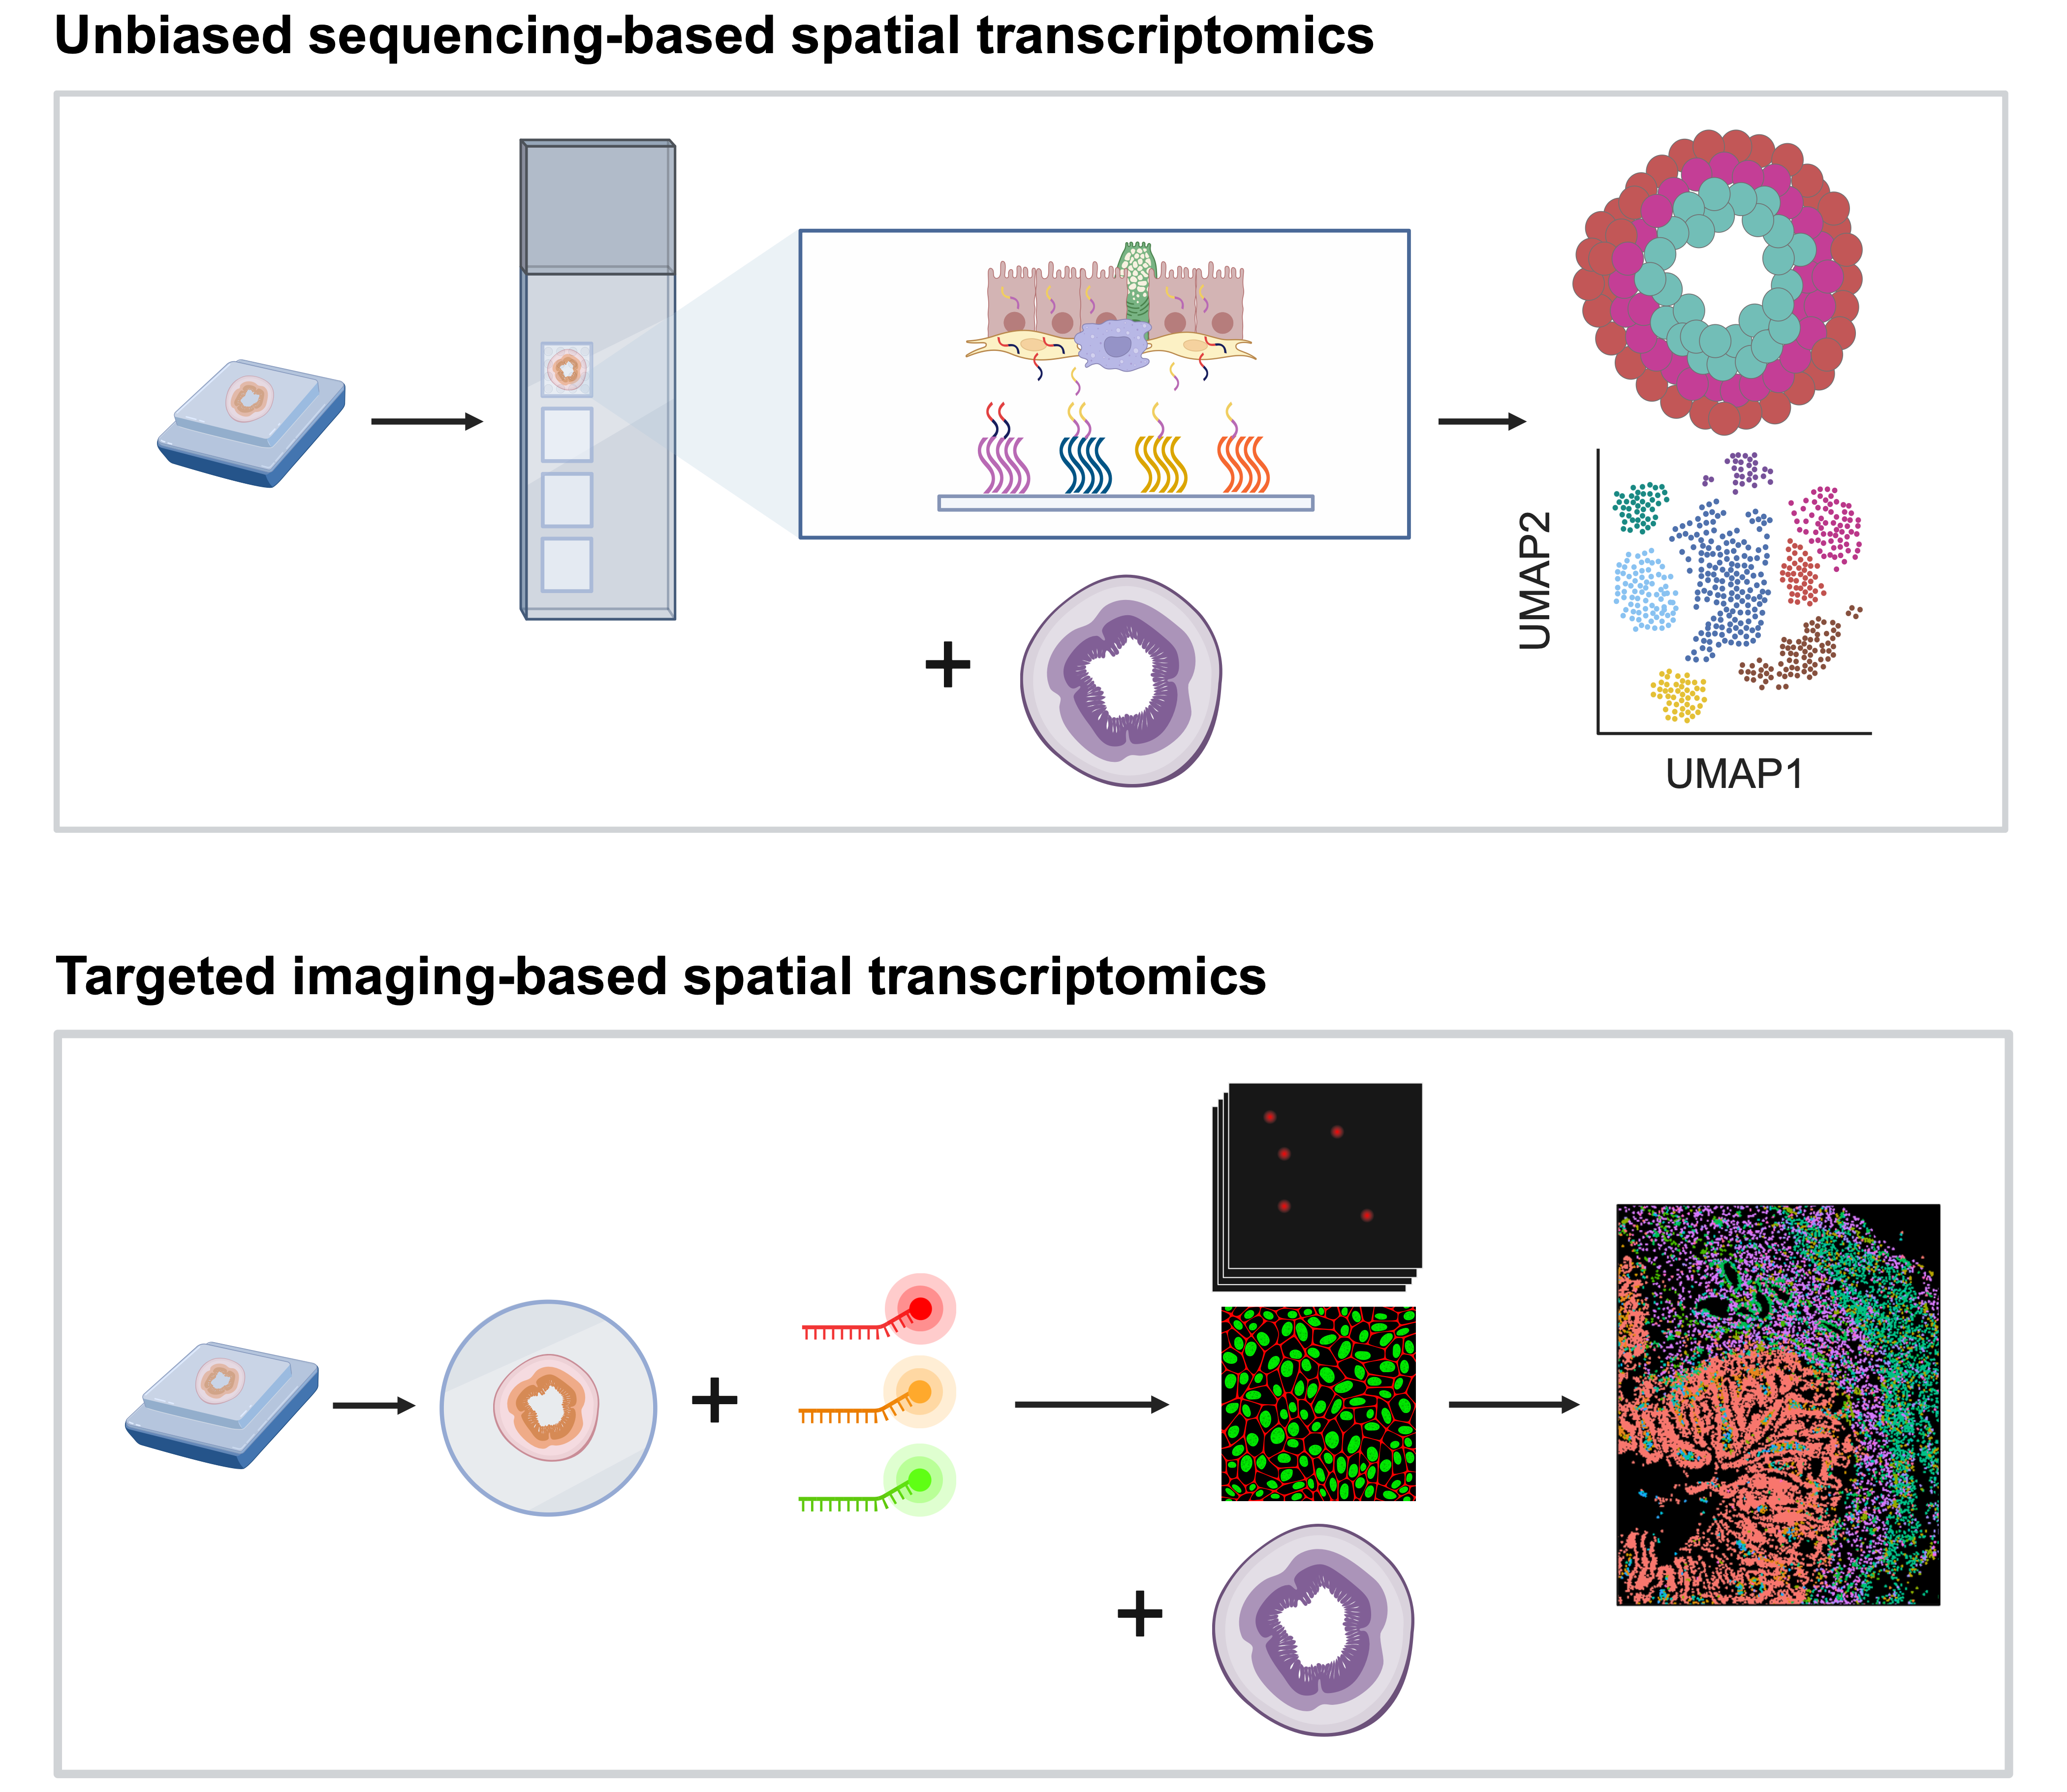
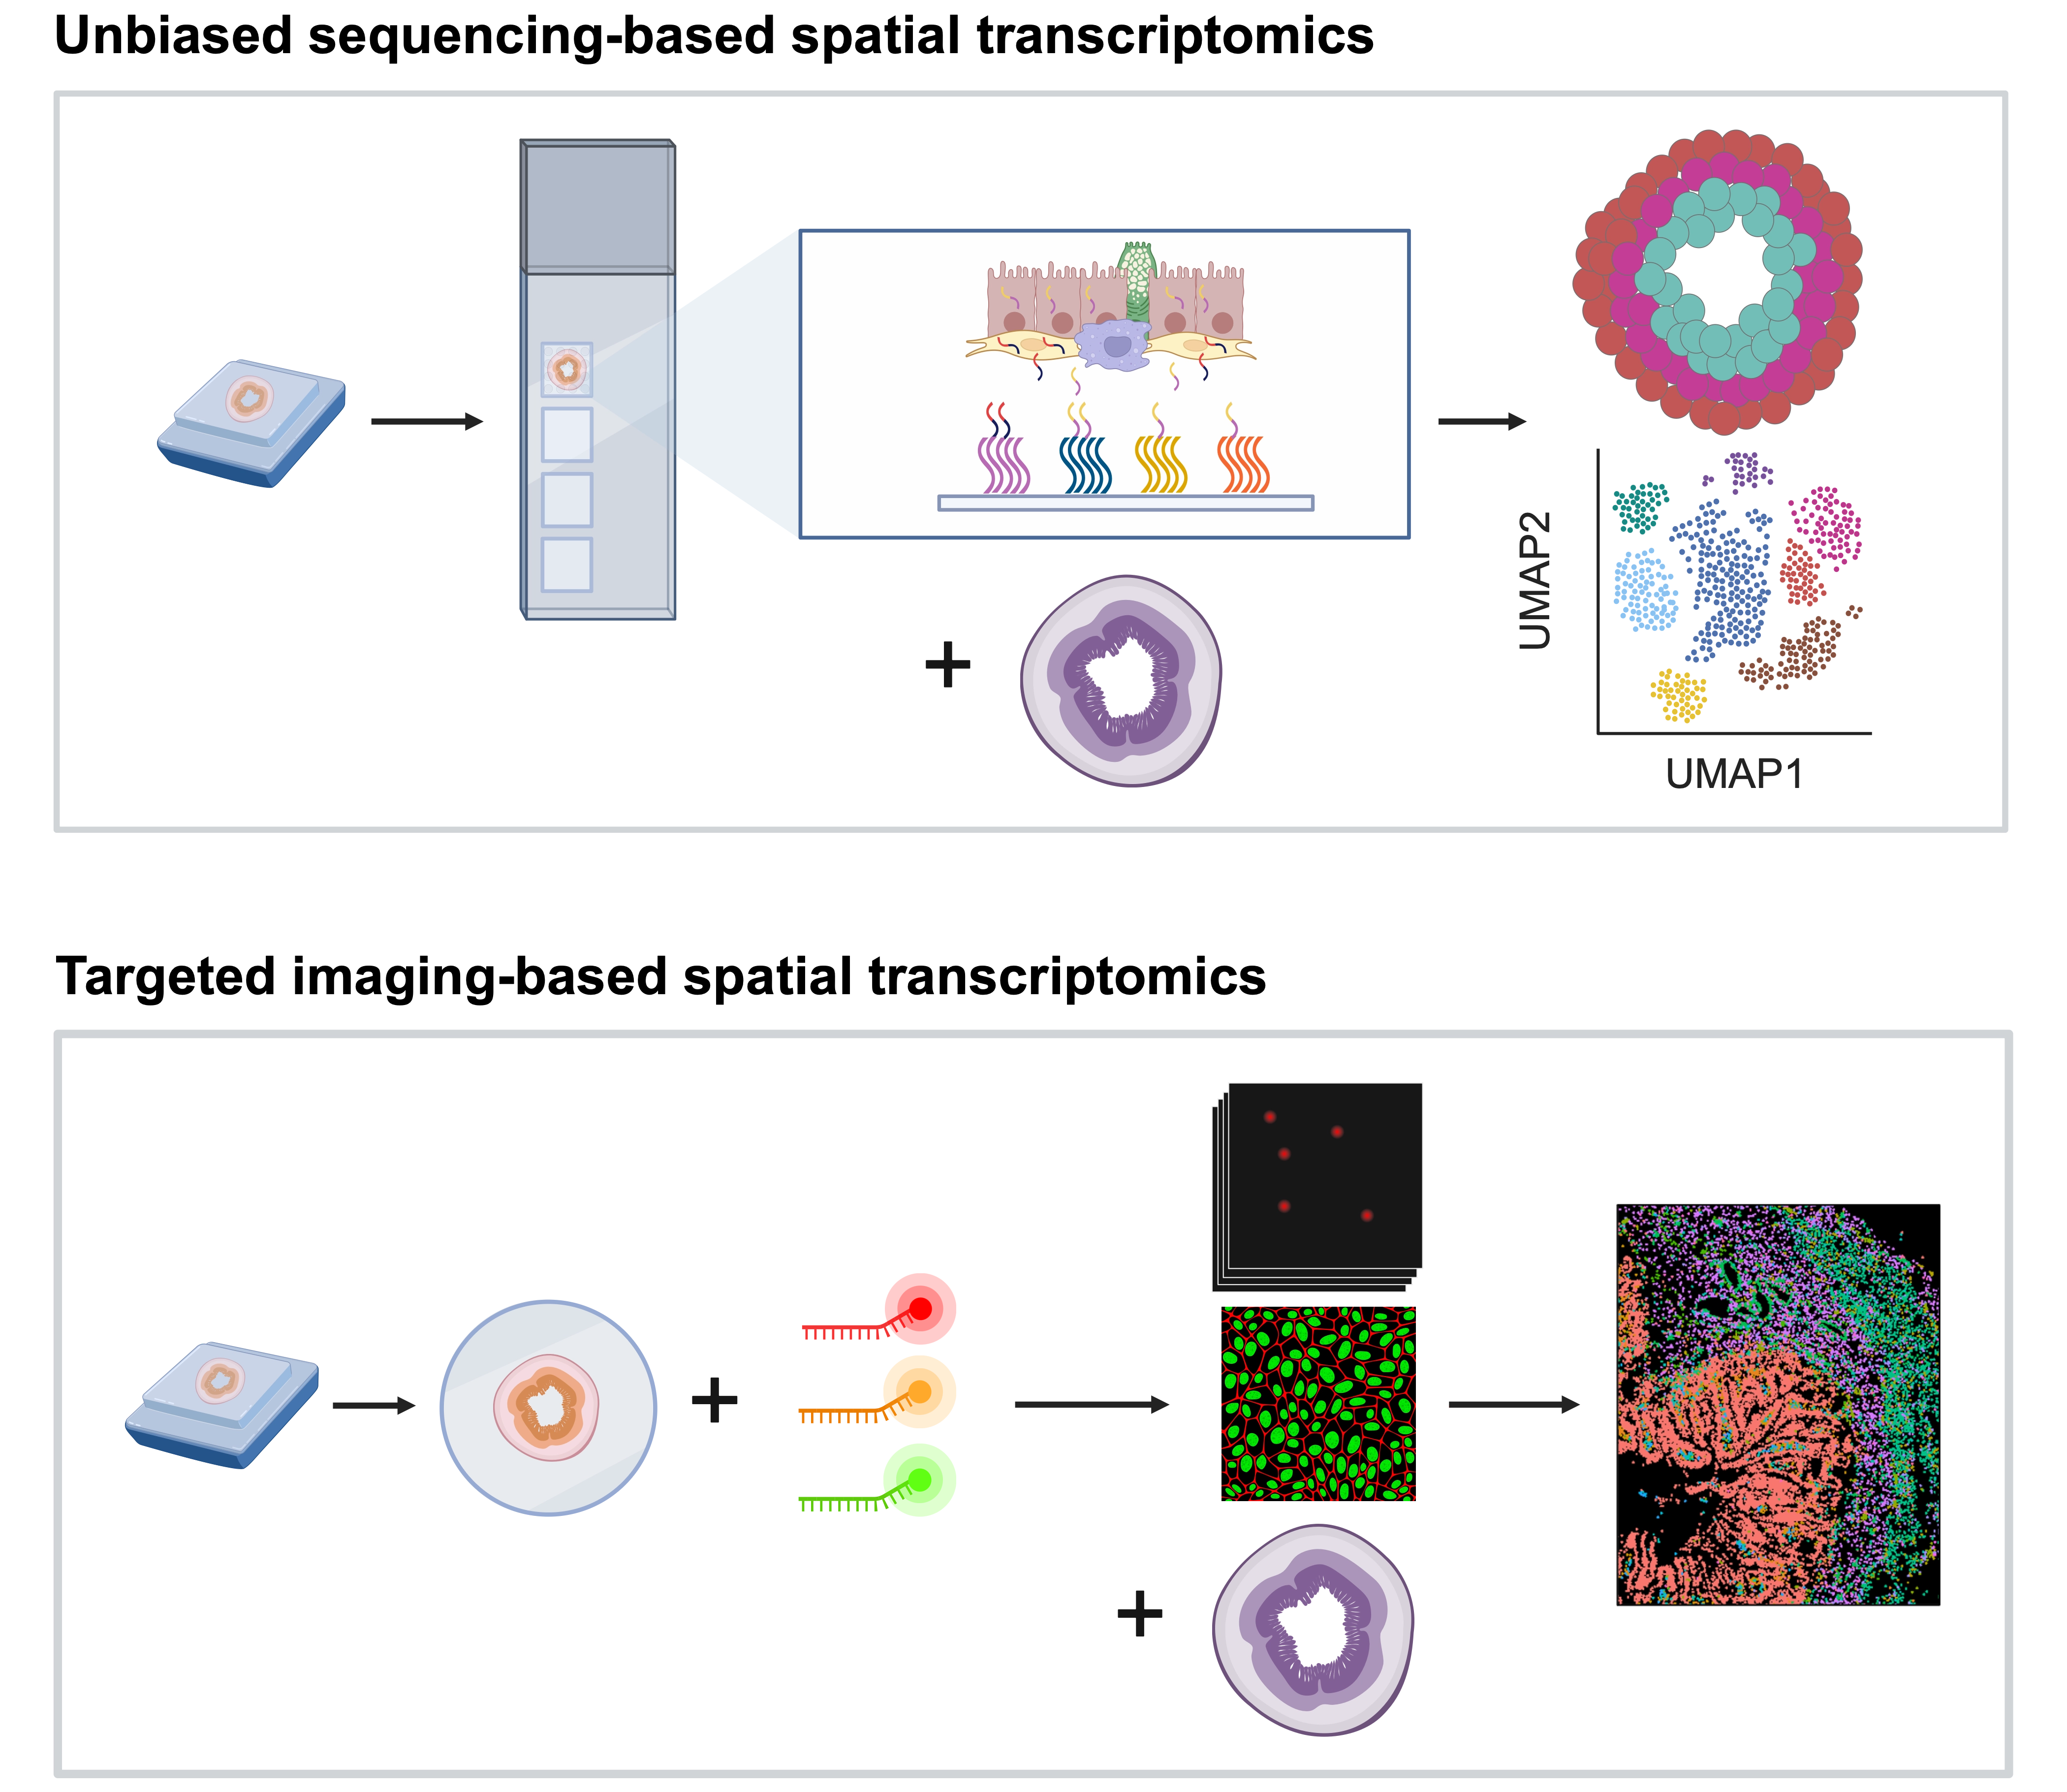
Figure 1. Spatial transcriptomics can be measured by sequencing- or imaging-based approaches. Sequencing-based approaches extract and sequence mRNAs from tissues with their location information. They measure the whole transcriptome but offer relatively low spatial resolution. Imaging-based approaches image mRNAs within tissues using fluorescent probes under microscopy. They rely on a targeted gene panel but offer subcellular resolution. Created in BioRender. Group, S. (2026) https://BioRender.com/z26r210. UMAP: Uniform Manifold Approximation and Projection.
Most methods to date have largely focused on lower-resolution ST datasets; the transition towards in situ ST, however, fundamentally changes the prediction task itself. Spot-based approaches need to infer expression from heterogeneous mixtures of cells, whereas single-cell imaging platforms enable cell-centred prediction and direct inference of cell-specific expression or cell-type composition. In single-cell ST, one can create pseudo-spots by summing up transcripts in one patch[13], or perform cell-centred patching to enable gene prediction at single-cell resolution[14]. Cell segmentation masks could further be used to focus models on cellular morphology, although accurate cell segmentation remains a key unresolved challenge in the field. Transcript misassignment from neighbouring cells has also been demonstrated to substantially alter cell-level expression patterns[15], introducing considerable label noise directly into training data. Consequently, the effective performance ceiling for cell-level prediction strongly depends on the fidelity of the underlying ST measurements.
While training models on single-cell-level data is attractive, as this generates orders of magnitude more image-transcriptome pairs than spot-based datasets, it is computationally far more intensive. As datasets continue to grow from thousands of spots to millions of cells, both training and inference efficiency will become increasingly important, favouring methods that scale efficiently to larger datasets. It is also critical to remember that data quantity is not the same as data diversity: in situ ST represents finer sampling of the same tissue rather than additional biological variation and does not replace the need for larger cohorts encompassing diverse patients, tissues, and disease states.
The chemistry and tissue-processing protocol of each ST platform influence not only gene expression measurements but also histology images (Figure 2). For instance, Visium allows an H&E image from the same tissue section, whereas other ST assays are destructive (e.g., Merscope, which requires a tissue clearing step) and therefore H&E can only be acquired from adjacent tissue sections. Tissue preparation, staining protocols, scanner hardware, and image acquisition workflows differ substantially across ST platforms and between different laboratories, introducing systematic variations in morphology and image appearance. Together, these technical differences complicate model training, transfer across datasets, and comparison between studies.
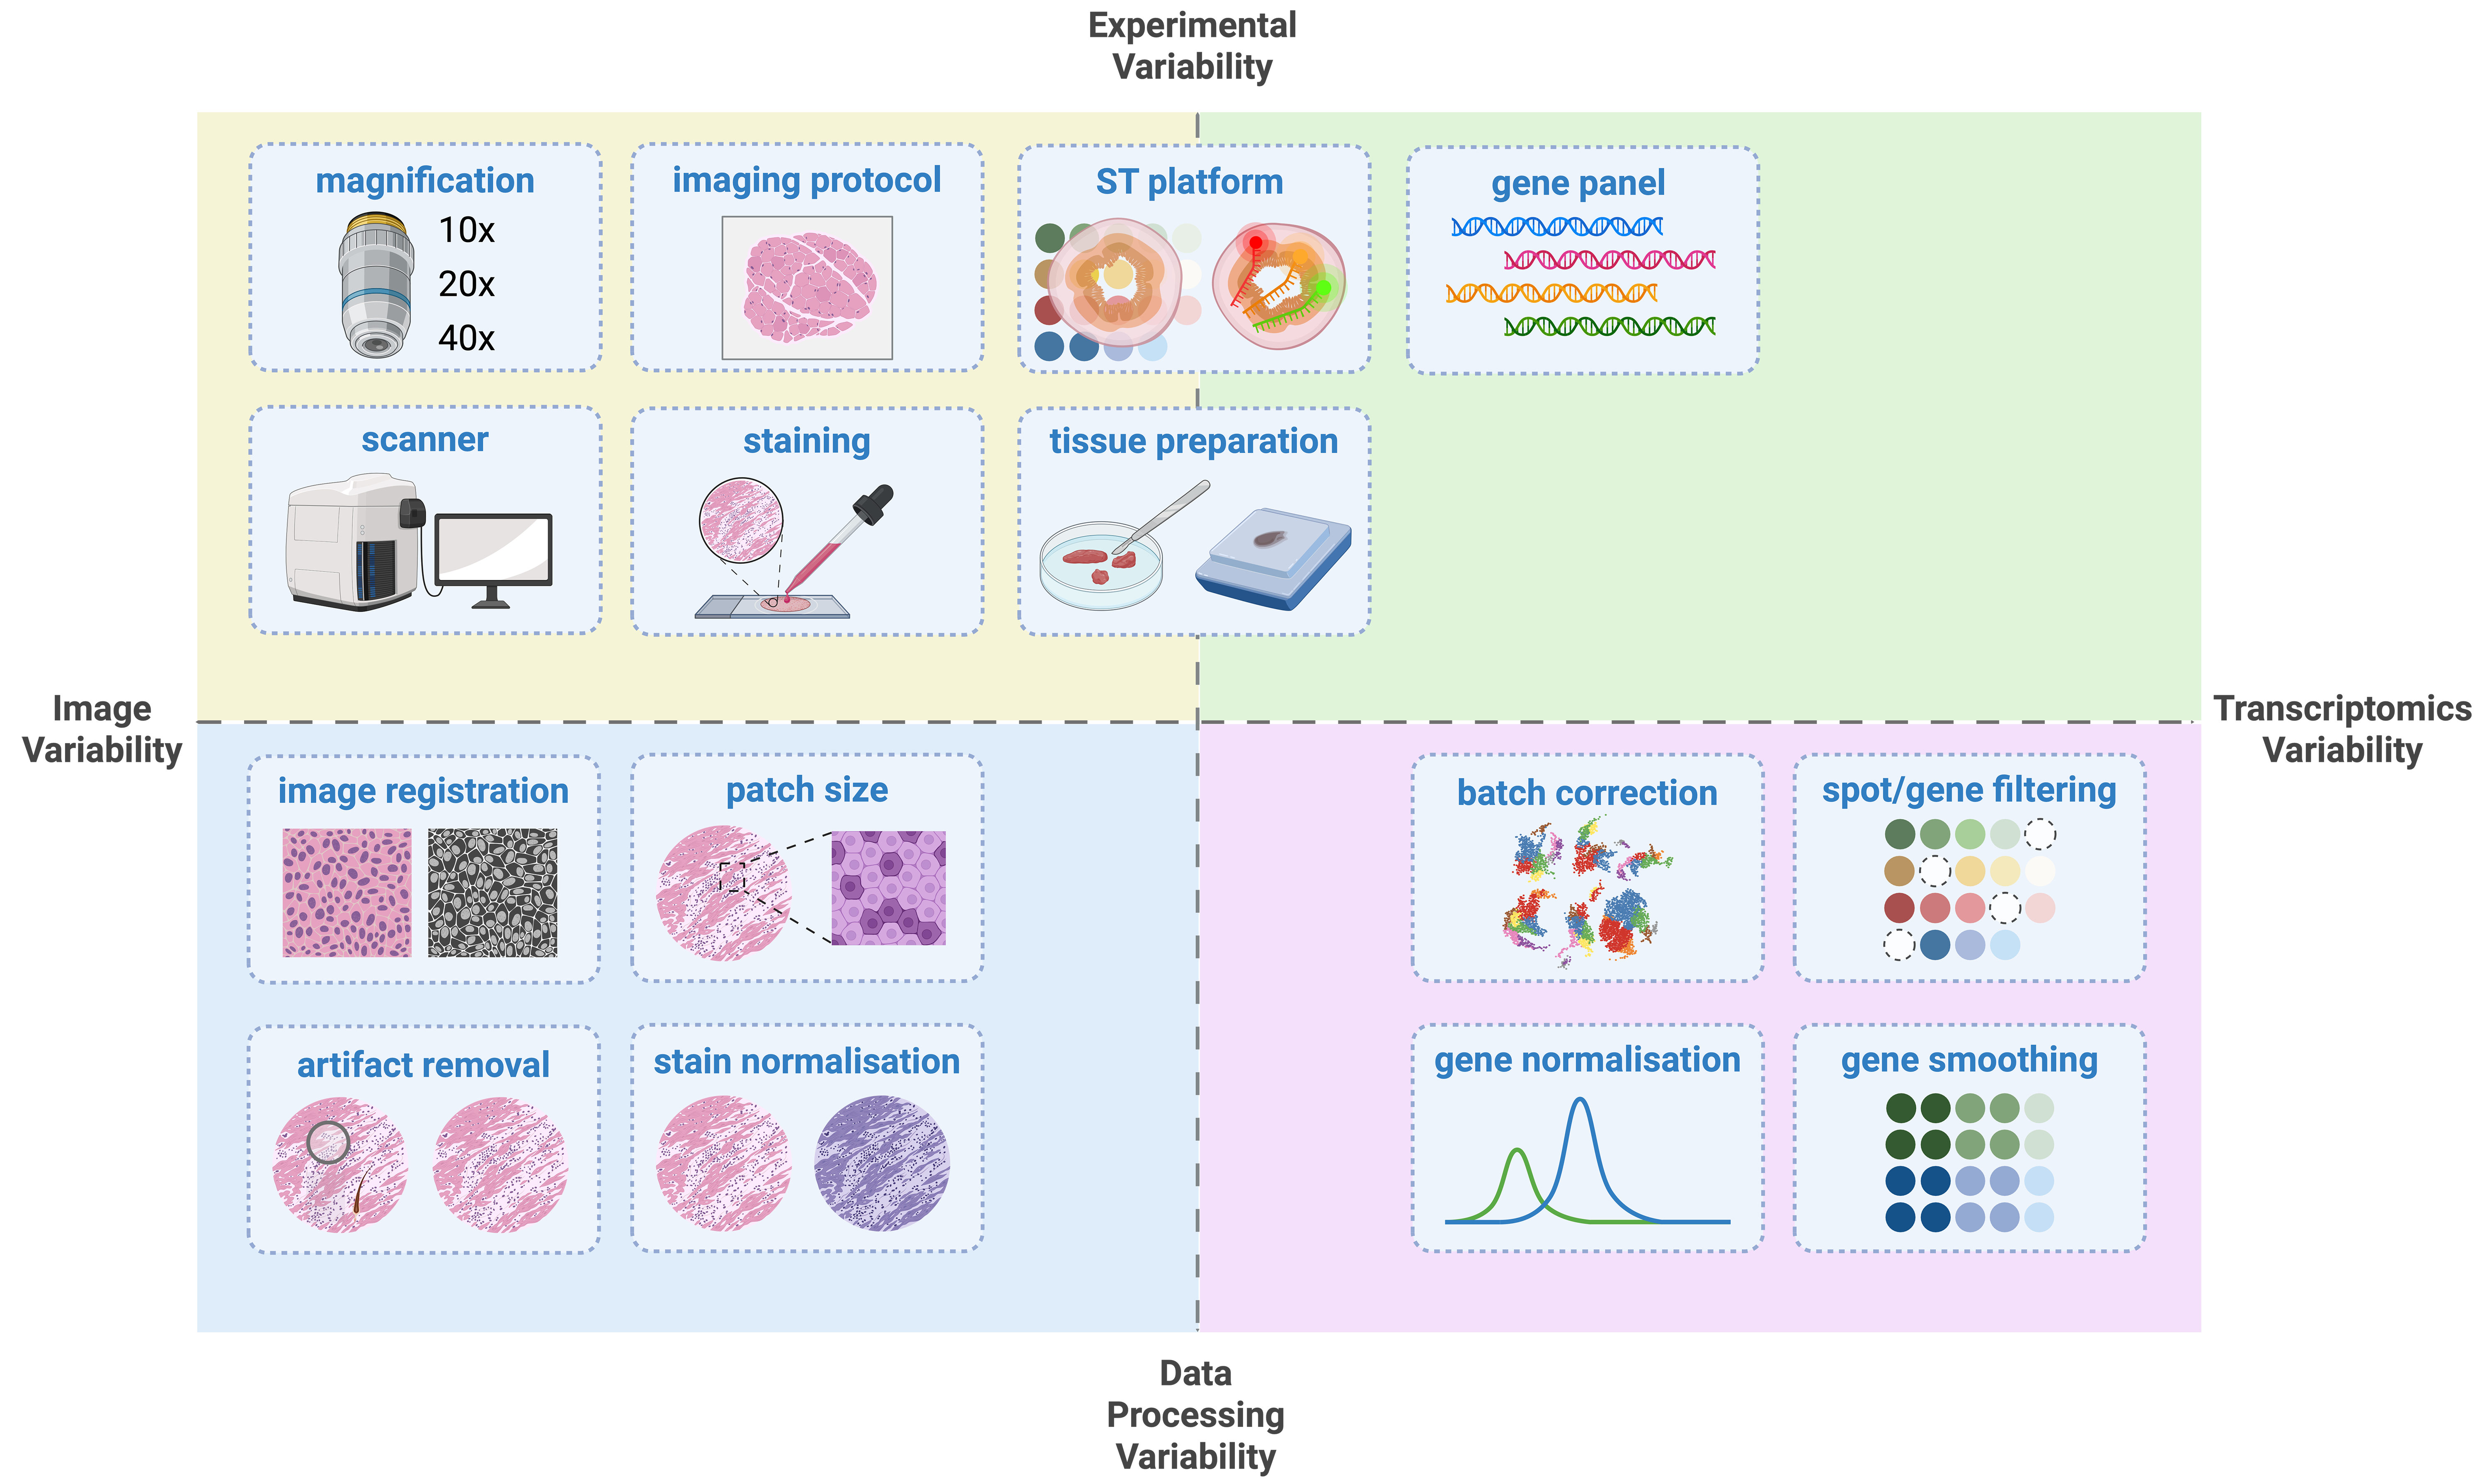
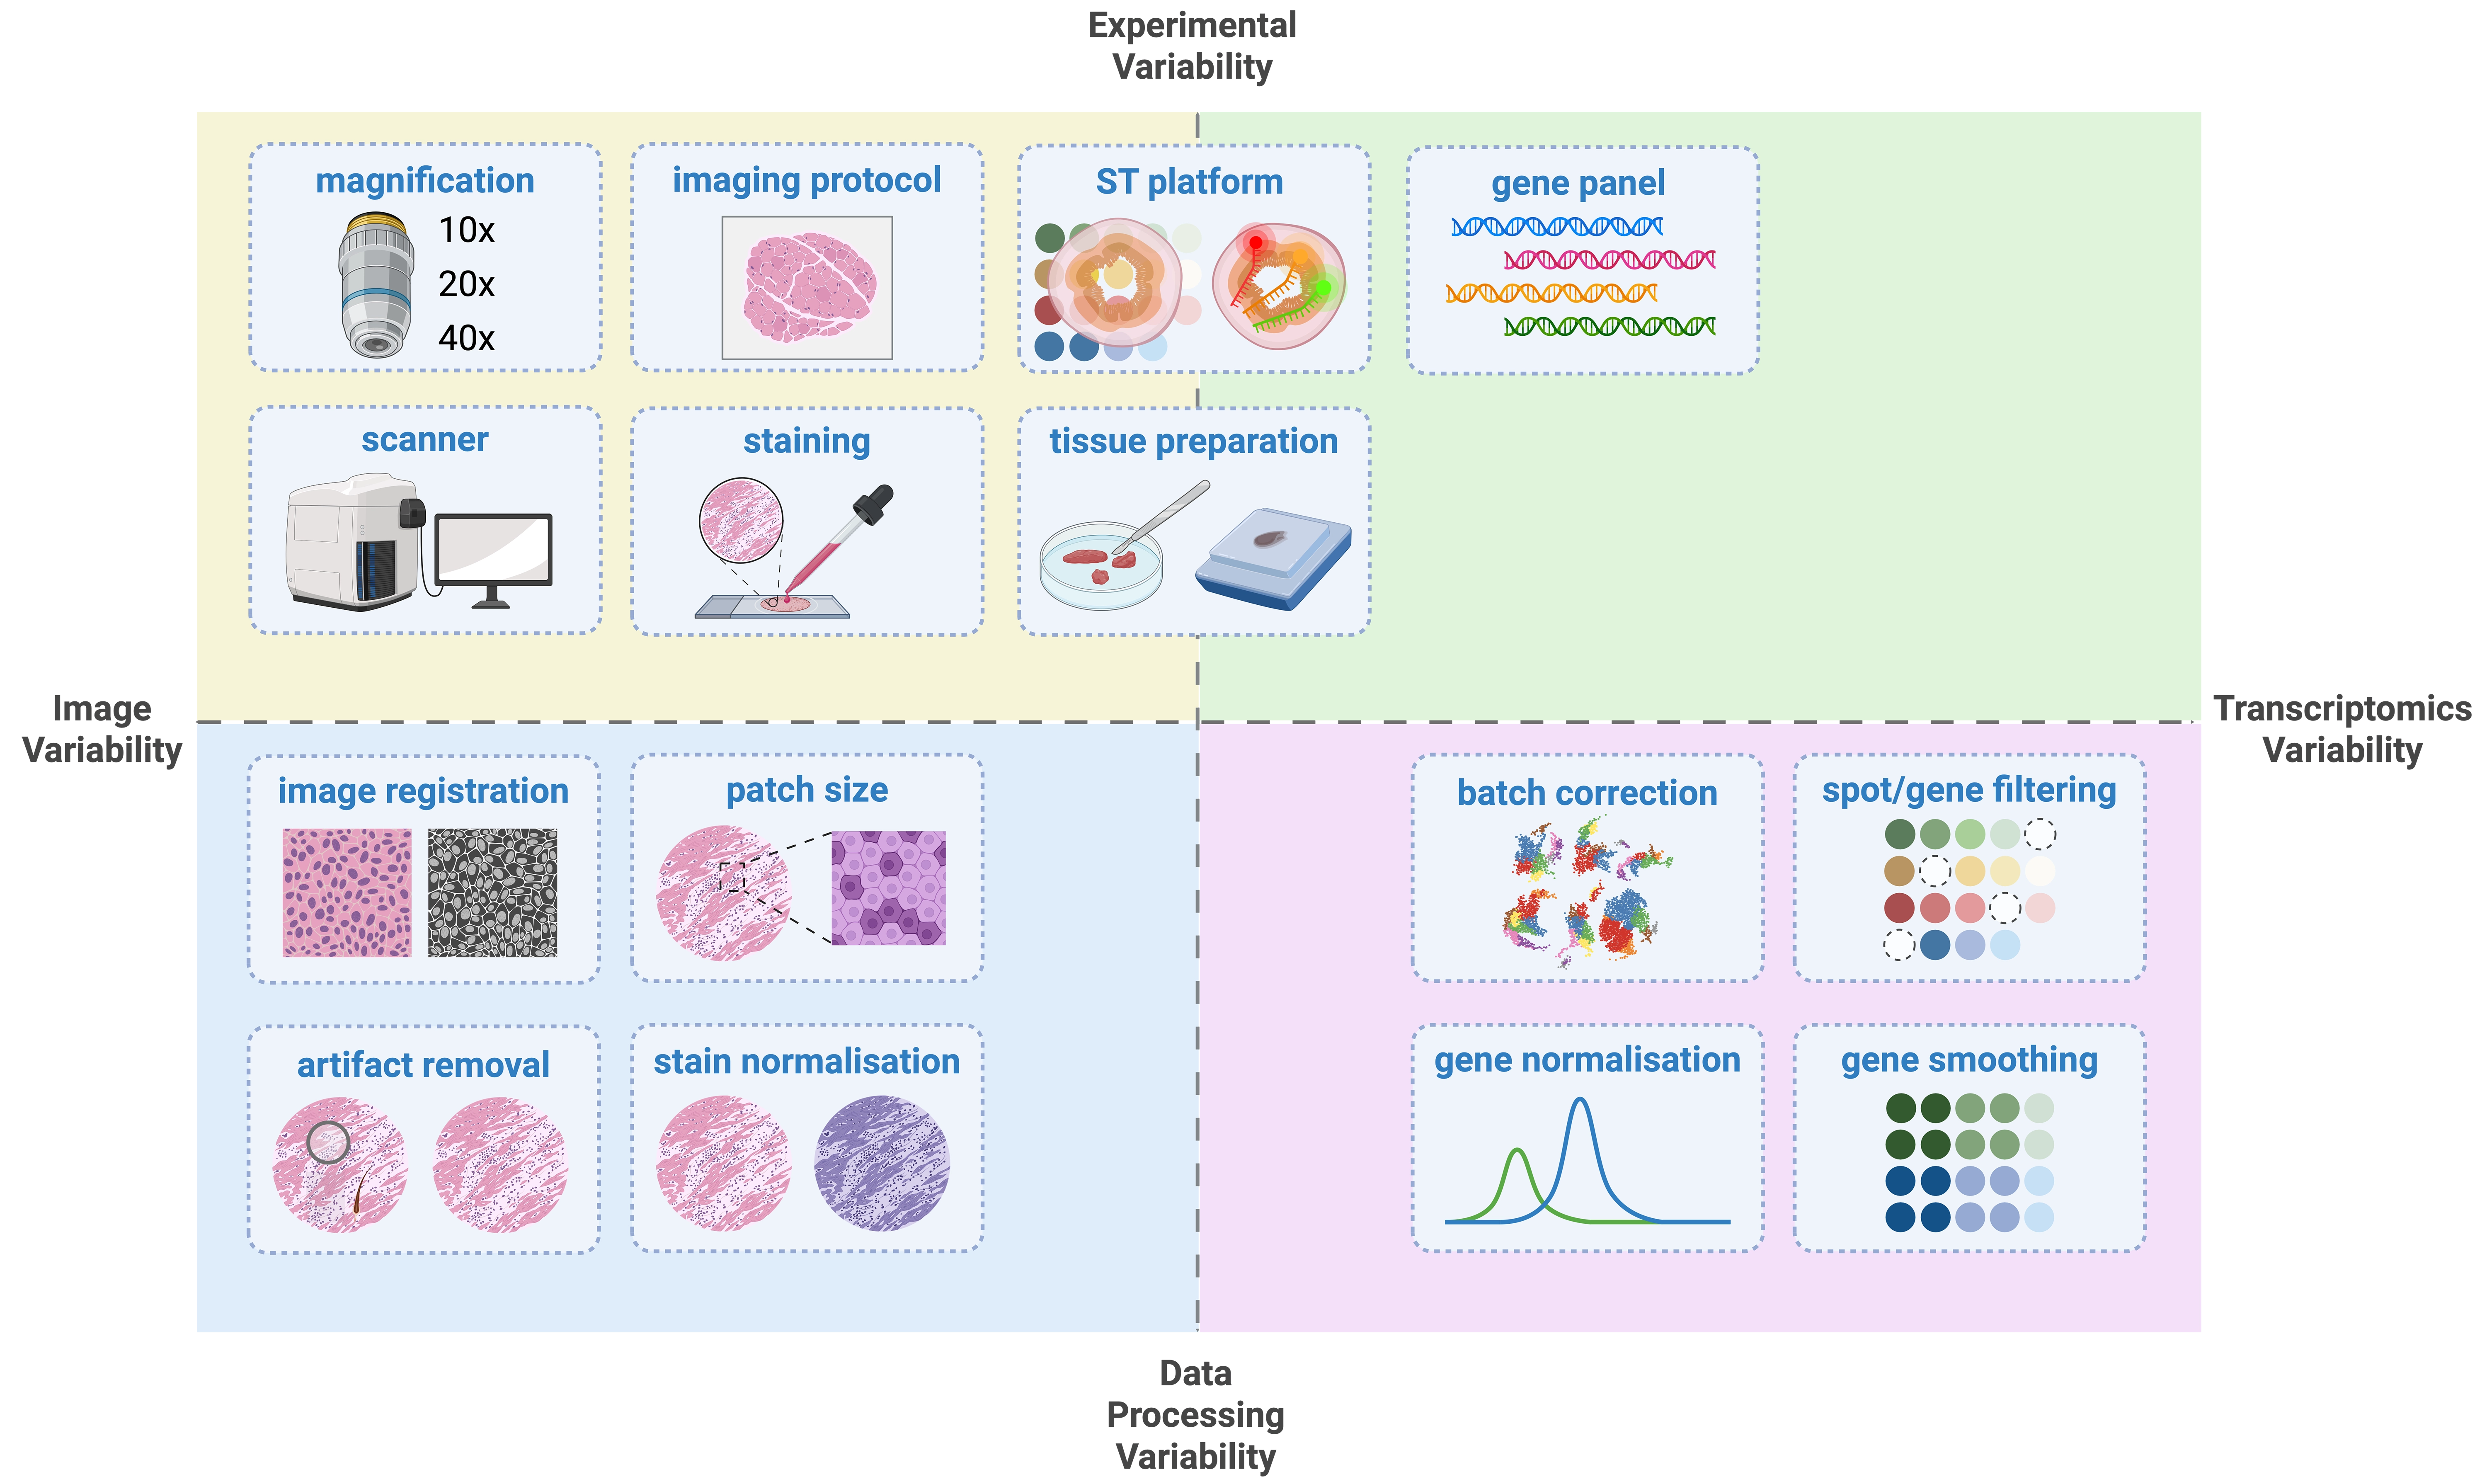
Figure 2. Variability exists in spatial transcriptomics both in image and transcriptomic data, caused by differences in experimental conditions and data processing pipelines. Created in BioRender. Group, S. (2026) https://BioRender.com/bdx691c. ST: spatial transcriptomics.
Both formalin-fixed paraffin-embedded (FFPE) and fresh-frozen optimal-cutting-temperature (OCT)-embedded tissues are used, and each preservation method introduces characteristic artefacts. FFPE fixation can alter nuclear size, while over-fixation may cause tissue shrinkage, distortion, and pigment artefacts. Staining protocols also vary widely between laboratories, causing variations in nuclear colour, cytoplasmic tone, and overall hue and intensity. Different slide-scanner hardware contributes to different colour rendering and image contrast. Furthermore, histology images are captured at different stages of the platform workflow, e.g., early in Visium but after molecular imaging in Xenium. Although these procedures are largely non-destructive, prolonged imaging and processing still subtly distort tissue morphology, producing small artefacts in the final histological image. Together, these create major challenges for learning from diverse image data.
While ST technologies have exploded in popularity in recent years, individual datasets remain relatively small, often too small for robust model training. Since 2022, the number of public human datasets on Gene Expression Omnibus (GEO) has grown rapidly, with Visium dominating with over 600 sections (Figure 3a). Many additional datasets are reported in publications but are not consistently deposited or maintained. For in situ ST datasets specifically, there is currently no single data repository or minimal data deposition standard agreed upon by the community.
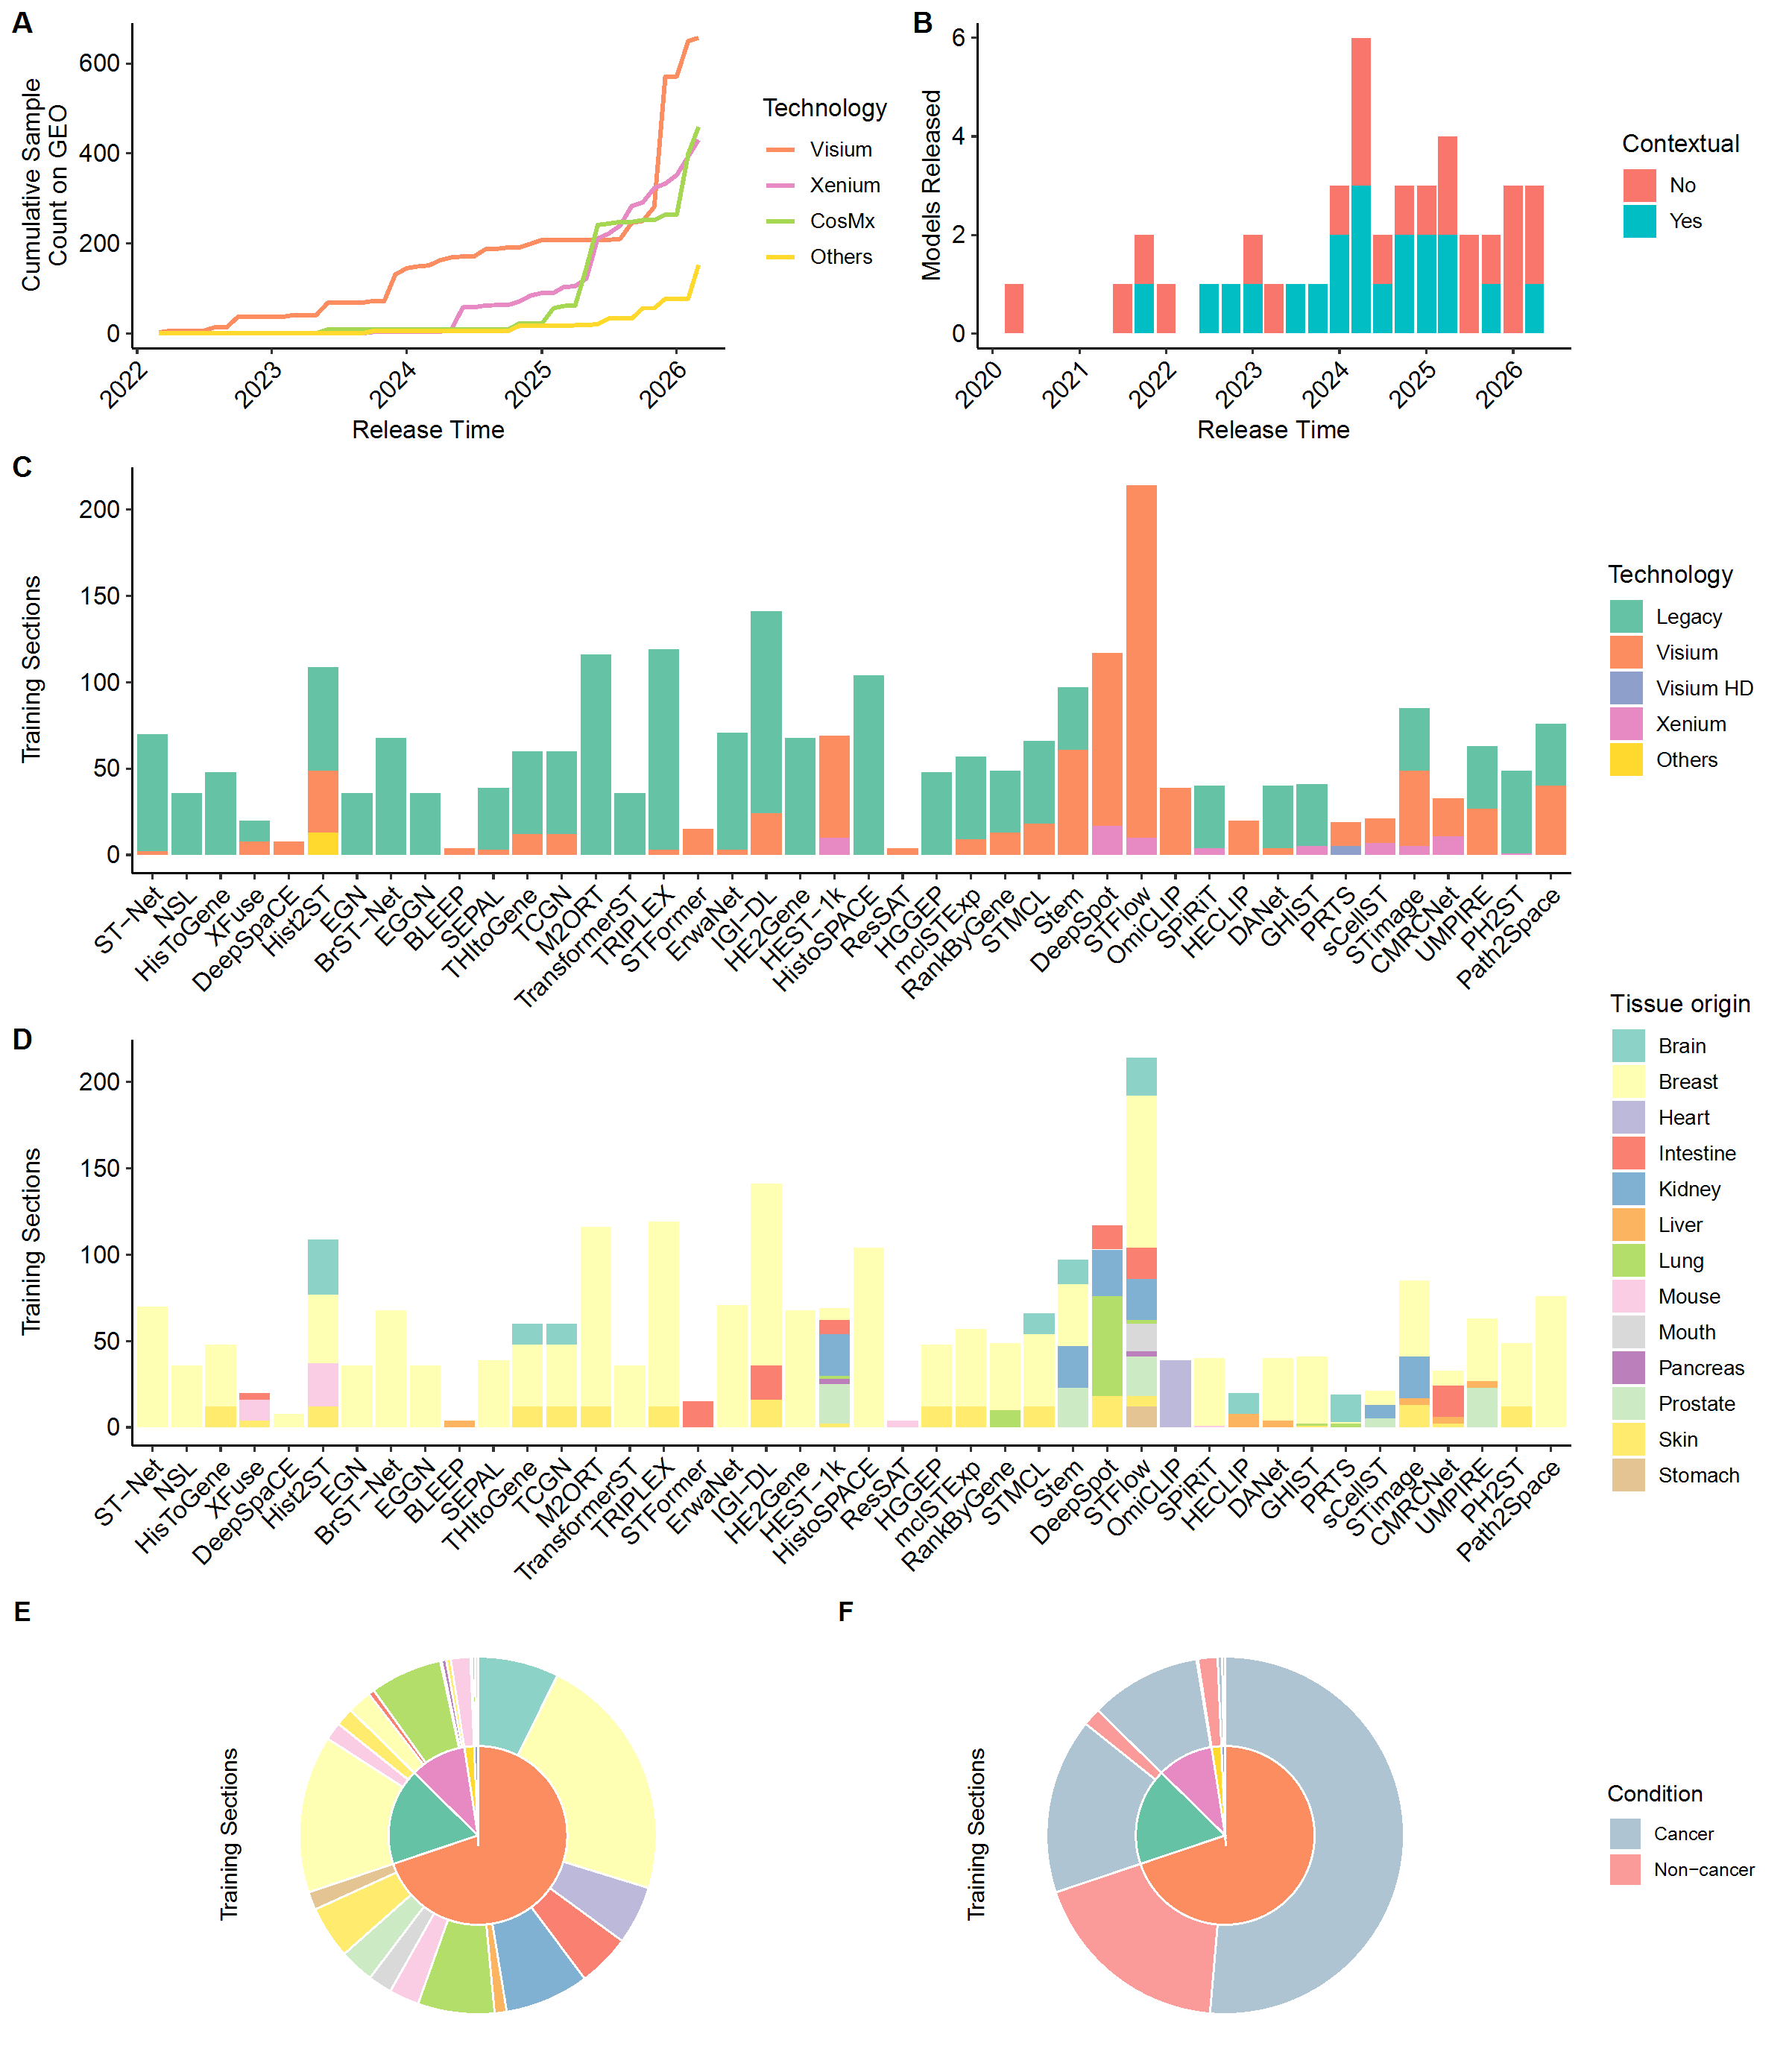
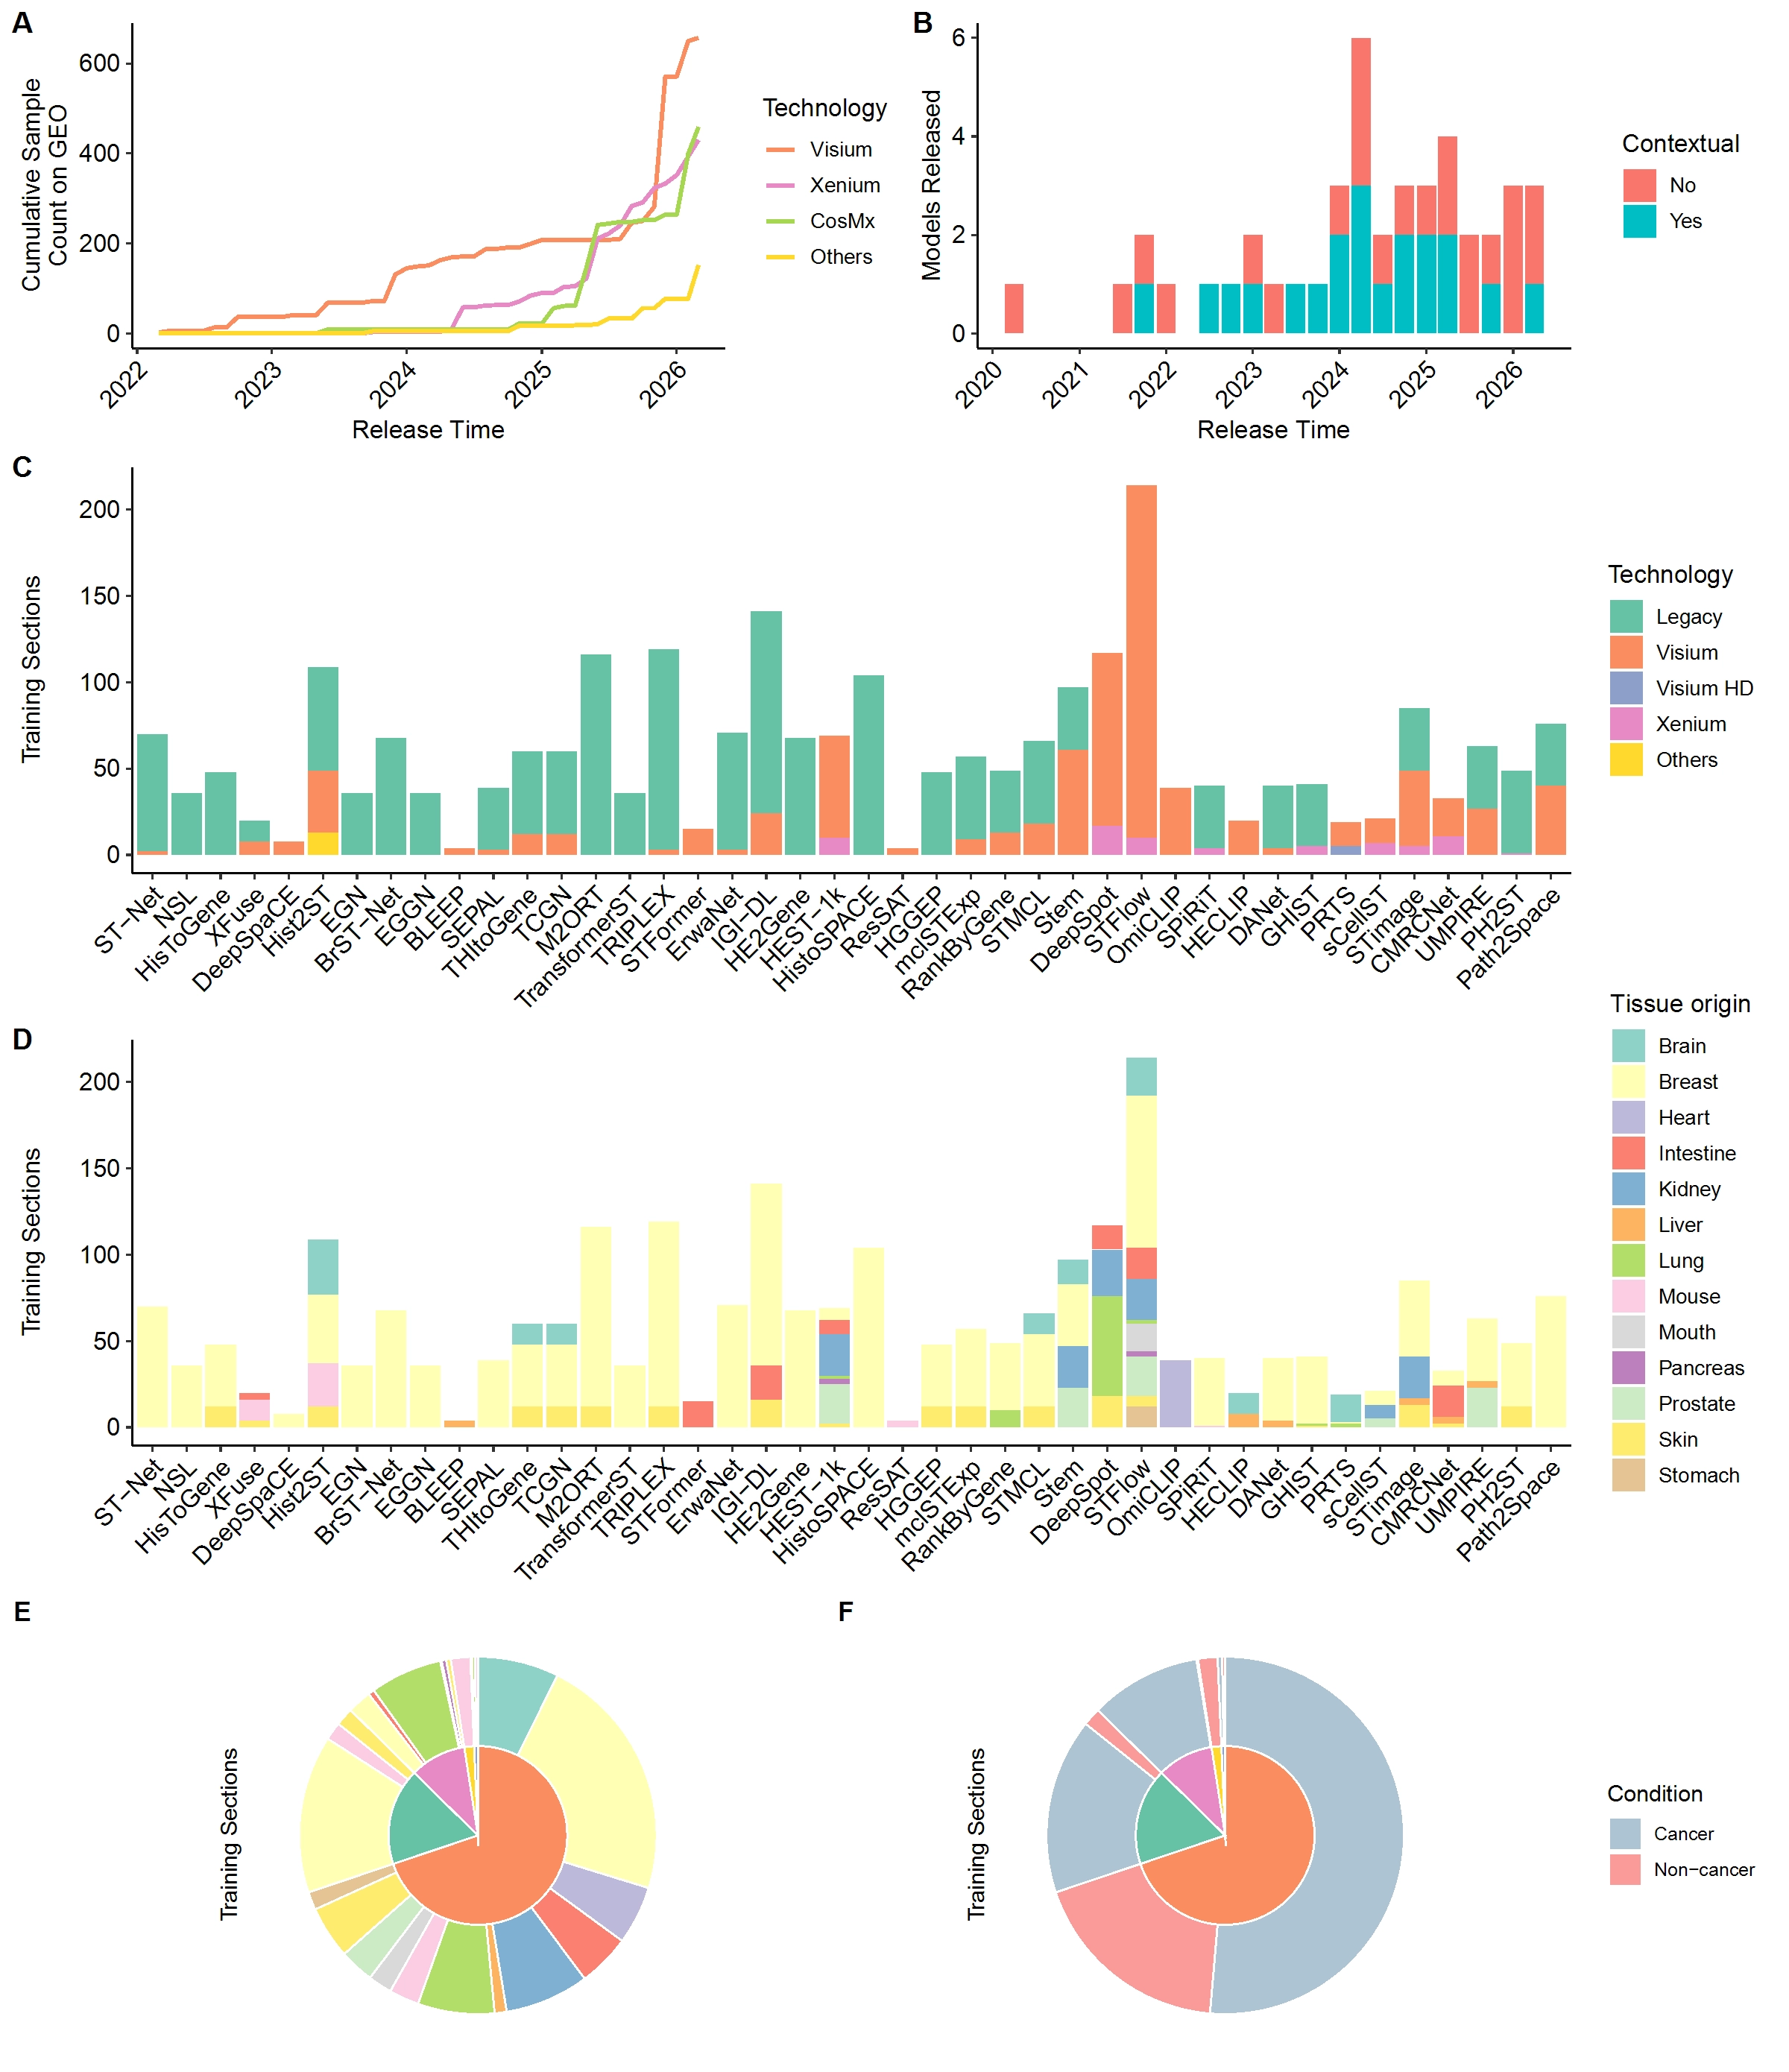
Figure 3. (a) There has been a boom in ST data on GEO over the past two years (up to Apr 6, 2026); (b) ST prediction models can be categorised into single-patch and contextual models. While single-patch models focus only on local image patches, contextual models consider the neighbourhood or the location of the patch within the slide; (c) Limited data were generally used to train the 43 existing models, organised in the order of publication. Most earlier models were trained mainly on the legacy Visium predecessor data. The plot does not include recently curated large ST corpora used for pre-training; (d) Most models were trained predominantly on breast data; (e,f) Breast tissue and cancer are the predominant tissue and disease categories, respectively, in the training data. ST prediction models were identified via Google searches using keywords such as “spatial transcriptomics prediction from H&E”, “histology-based spatial transcriptomics imputation”, “virtual spatial transcriptomics”, “spatial biomarker prediction from H&E”, and “gene expression prediction from H&E”, up to Jul 4, 2026. Cross-references were used to identify further literature. The review included articles in peer-reviewed journals, conference proceedings, and preprints. For preprints, study inclusion was determined using robustness of results, novelty of methods, transparency and completeness in reporting, and improvements in prediction performance. In cases of duplicate or highly similar publications, the most comprehensive version was included. STPath was exclusively trained on large ST corpora so was not included in panels C&D for illustration clarity. ST: spatial transcriptomics; GEO: Gene Expression Omnibus; H&E: hematoxylin and eosin.
To date, ST prediction models have been trained and evaluated on more than 60 datasets, both public and internal (Table 1 and Figure 3b,d,e,f). These datasets are widely spread across different tissues and organs, but with a heavy skew towards cancer datasets, in particular breast and skin (Figure 3e,f). Most datasets also come from Visium or its lower resolution predecessor (Figure 4). Individual dataset sizes range from 1 to 81 sections, totalling around 750 sections (Table 1). As a result of data limitations, most models were trained on < 100 sections, often on the same datasets. Moreover, as models often focused on legacy breast cancer data, it is hard for them to generalise across organs, diseases, and ST platforms (Figure 3c,d and Figure 4). Compared to other digital pathology tasks that used up to 30,000 sections[16], the field of ST prediction is significantly constrained by data availability and is still in its infancy. Therefore, expanding the quality and quantity of training dataset is paramount for performance improvement.
Table 1. Datasets used to train and validate models that predict ST from H&E images, excluding recent large ST corpora curated for pre-training.
| Tissue | Dataset | Sections | Platform | Total spots/cells | Extra information |
| Human breast | Legacy breast cancer[17] | 68 | Legacy | 30,612 | 23 donors, triplicates |
| Legacy HER2 breast cancer[18] | 36 | Legacy | 13,620 | 8 donors | |
| Legacy breast cancer (Ståhl)[12] | 1 | Legacy | 995 | ||
| Visium breast cancer[19] | 3 | Visium | Unknown | ||
| Visium breast cancer (Monjo)[20] | 8 | Visium | 17,600 | 2 donors, 3 serial sections | |
| Visium invasive ductal breast carcinoma (10X-ST-Net) | 2 | Visium | Unknown | ||
| Visium breast cancer (10X-STimage) | 3 | Visium | 10,255 | ||
| Visium breast cancer (10X-Hist2ST) | 4 | Visium | Unknown | ||
| Visium breast cancer (10X-TRIPLEX) | 3 | Visium | 12,683 | ||
| Visium breast cancer (10X – RankByGene) | 2 | Visium | 8,711 | ||
| Visium breast cancer (10X-SEPAL) | 2 | Visium | 7,785 | 1 donor, serial sections | |
| Visium breast cancer (10X-sCellST) | 1 | Visium | 2,518 | ||
| Visium HER2 breast cancer[21] | 6 | Visium | 15,611 | ||
| Visium breast cancer (10X-ErwaNet) | 6 | Visium | 24,263 | ||
| Visium breast cancer (STimage-1K4M) | 81 | Visium | 142,722 | ||
| Visium breast cancer (HEST-1k – Path2Space) | 5 | Visium | Unknown | 4 donors | |
| Visium invasive ductal carcinoma axillary lymph nodes (HEST-1k)[22] | 4 | Visium | 19,960 | 2 donors | |
| Visium triple-negative breast cancer[23] | 22 | Visium | 56,567 | 14 donors | |
| Visium high-plasticity triple-negative breast cancer[24] | 4 | Visium | Unknown | 4 donors | |
| Visium breast cancer (Human Tumour Atlas Network)[25] | 9 | Visium | Unknown | 7 donors | |
| Visium HD breast cancer (10X) | 1 | Visium HD | Unknown | ||
| Xenium breast cancer[19] | 3 | Xenium | 148,000 | ||
| Xenium breast cancer (Tan)[26] | 5 | Xenium | 1,294,600 | 5 donors | |
| Xenium breast cancer (10X-HEST-1k) | 2 | Xenium | 1,780,000 | 2 donors | |
| Xenium breast cancer (10X-sCellST) | 6 | Xenium | Unknown | 3 donors | |
| Human skin | Legacy skin cutaneous squamous cell carcinoma[27] | 12 | Legacy | 6,630 | 4 donors |
| Visium skin squamous cell carcinoma[28] | 4 | Visium | 8,885 | Serial sections | |
| Visium metastatic melanoma[29] | 18 | Visium | Unknown | 7 donors | |
| Visium melanoma[26] | 13 | Visium | 15,209 | 10 donors | |
| Xenium melanoma (10X) | 1 | Xenium | 47,000 | ||
| Xenium skin cutaneous melanoma (10X-HEST-1k) | 2 | Xenium | 159,000 | 2 donors | |
| Human brain | Visium dorsolateral prefrontal cortex[30] | 12 | Visium | 59,904 | 3 donors |
| Visium Alzheimer’s brain[31] | 20 | Visium | Unknown | 3 donors | |
| Visium brain cancer (STimage-1K4M) | 22 | Visium | 47,432 | ||
| Human liver | Visium liver[32] | 4 | Visium | 9,269 | Serial sections |
| Visium primary sclerosing cholangitis liver[32] | 4 | Visium | 19,968 | Serial sections | |
| Human kidney | Visium kidney cancer (HEST-1k)[33] | 24 | Visium | 67,008 | 24 donors |
| Visium kidney cancer with tertiary lymphoid structures[34] | 3 | Visium | Unknown | ||
| Visium kidney cancer[35] | 6 | Visium | 16,131 | ||
| Visium kidney[36] | 23 | Visium | 146,460 | 22 donors | |
| Human lung | Visium lung cancer with tertiary lymphoid structures[34] | 5 | Visium | Unknown | |
| Visium lung cancer[37] | 36 | Visium | 80,000 | 8 donors | |
| Visium lung fresh frozen[38] | 6 | Visium | Unknown | 2 donors | |
| Visium lung organoid[39] | 4 | Visium | 1,831 | ||
| Visium HD lung cancer (10X) | 2 | Visium HD | Unknown | Serial sections | |
| Xenium lung adenocarcinoma (10X) | 1 | Xenium | 89,000 | ||
| Xenium lung cancer (10X-HEST-1k) | 2 | Xenium | 162,000 | ||
| Xenium lung cancer[40] | 45 | Xenium | 1,630,319 | 35 donors | |
| Human intestine | Visium ileum[28] | 4 | Visium | 13,119 | Serial sections |
| Visium colorectal cancer[41] | 14 | Visium | 20,733 | 7 donors, serial pairs | |
| Visium colorectal cancer (Gao)[42] | 10 | Visium | 41,492 | 10 donors | |
| Visium colorectal cancer (Qi)[43] | 2 | Visium | 8,437 | 2 donors | |
| Visium colorectal cancer (STFormer)[44] | 1 | Visium | 2,660 | ||
| Visium colorectal cancer (STimage-1K4M) | 4 | Visium | 16,096 | ||
| Xenium colorectal cancer[45] | 4 | Xenium | 924,597 | ||
| Human heart | Visium heart[46] | 39 | Visium | Unknown | |
| Human prostate | Visium prostate cancer (HEST-1k)[47] | 23 | Visium | 30,000 | 2 donors |
| Human pancreas | Xenium pancreatic cancer (10X-HEST-1k) | 3 | Xenium | 332,000 | 3 donors |
| Human mouth | Visium oral cancer (STimage-1K4M) | 16 | Visium | 43,680 | |
| Human stomach | Visium stomach cancer (STimage-1K4M) | 12 | Visium | 37,404 | |
| Mouse | Legacy mouse olfactory bulb[12] | 12 | Legacy | Unknown | |
| Space-TREX mouse brain[48] | 8 | Space-TREX | Unknown | ||
| Stereo-seq mouse brain[49] | 5 | Stereo-seq | Unknown | ||
| Visium mouse brain (HEST-1k)[50] | 14 | Visium | Unknown | ||
| Visium mouse brain (10X) | 4 | Visium | 12,165 | 2 serial pairs | |
| Visium mouse brain (10X-C) | 2 | Visium | 4,532 | ||
| Visium HD mouse brain (10X) | 2 | Visium HD | 134,363 | ||
| Xenium whole mouse (10X) | 1 | Xenium | 1,360,000 |
Legacy: Visium precursor technology. Numbers of spots were reported for Visium, and numbers of cells were reported for Visium HD and Xenium. ST: spatial transcriptomics; H&E: haematoxylin and eosin; HD: high definition; HER2: human epidermal growth factor receptor 2.
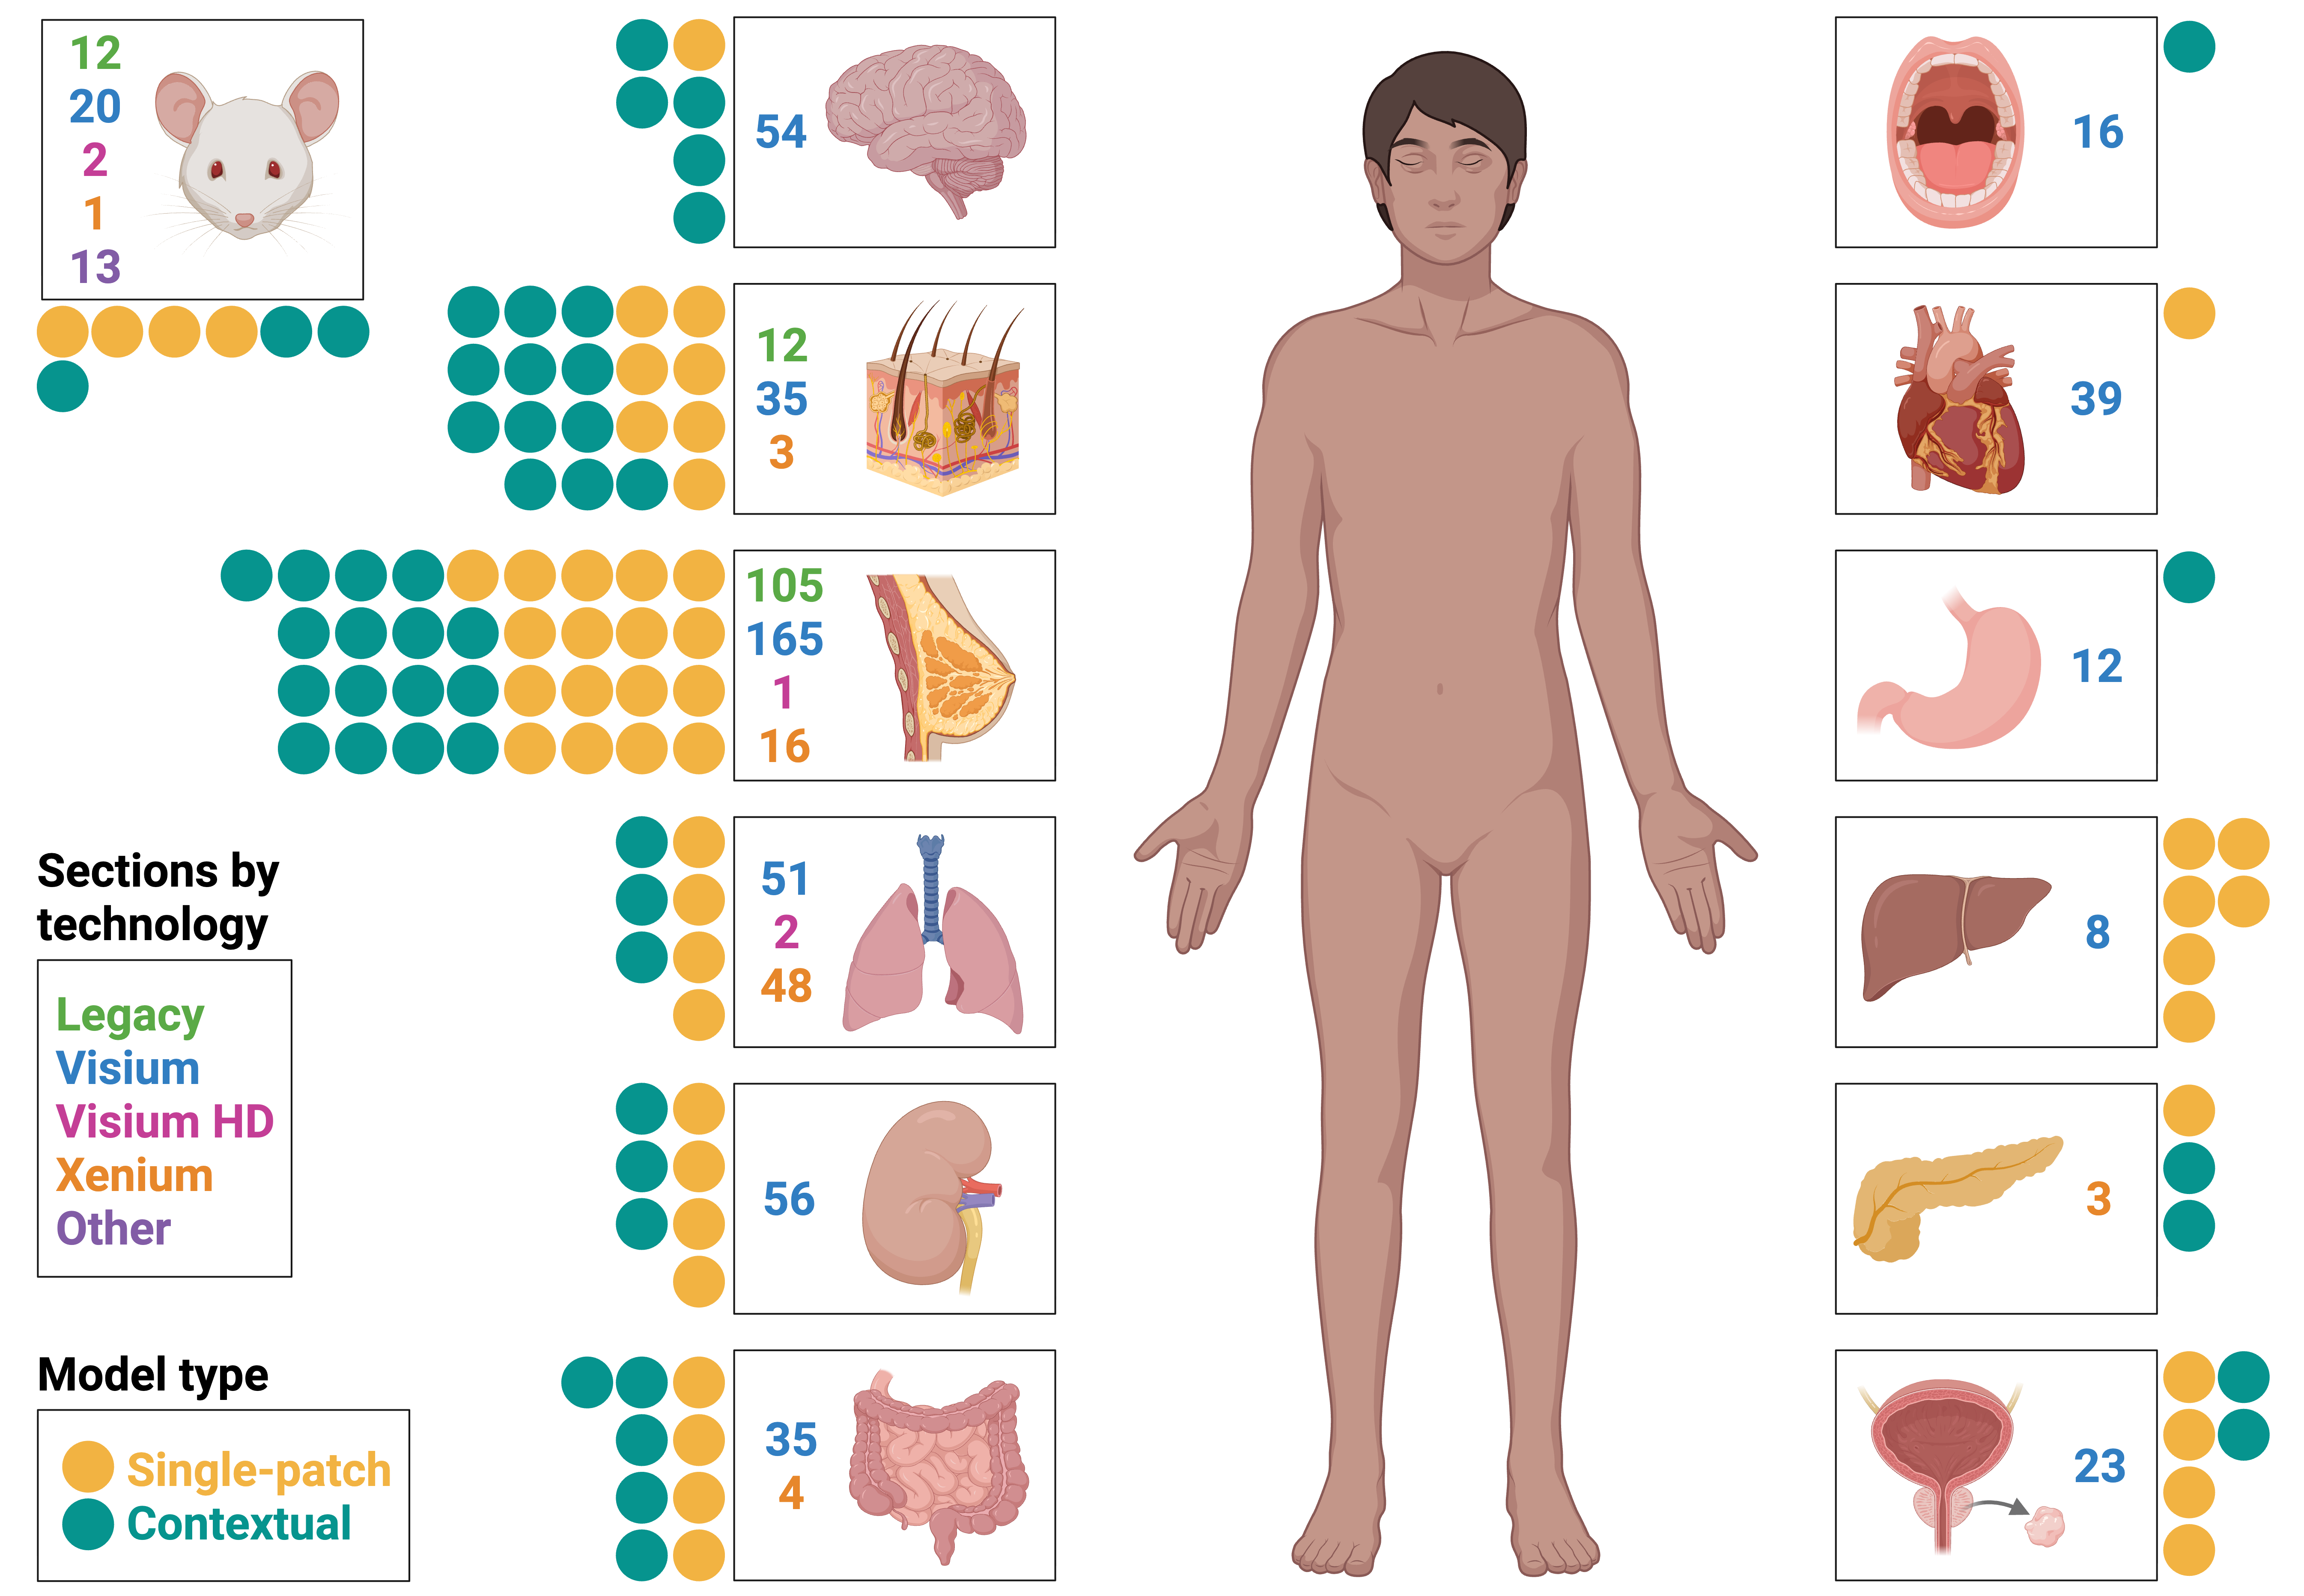
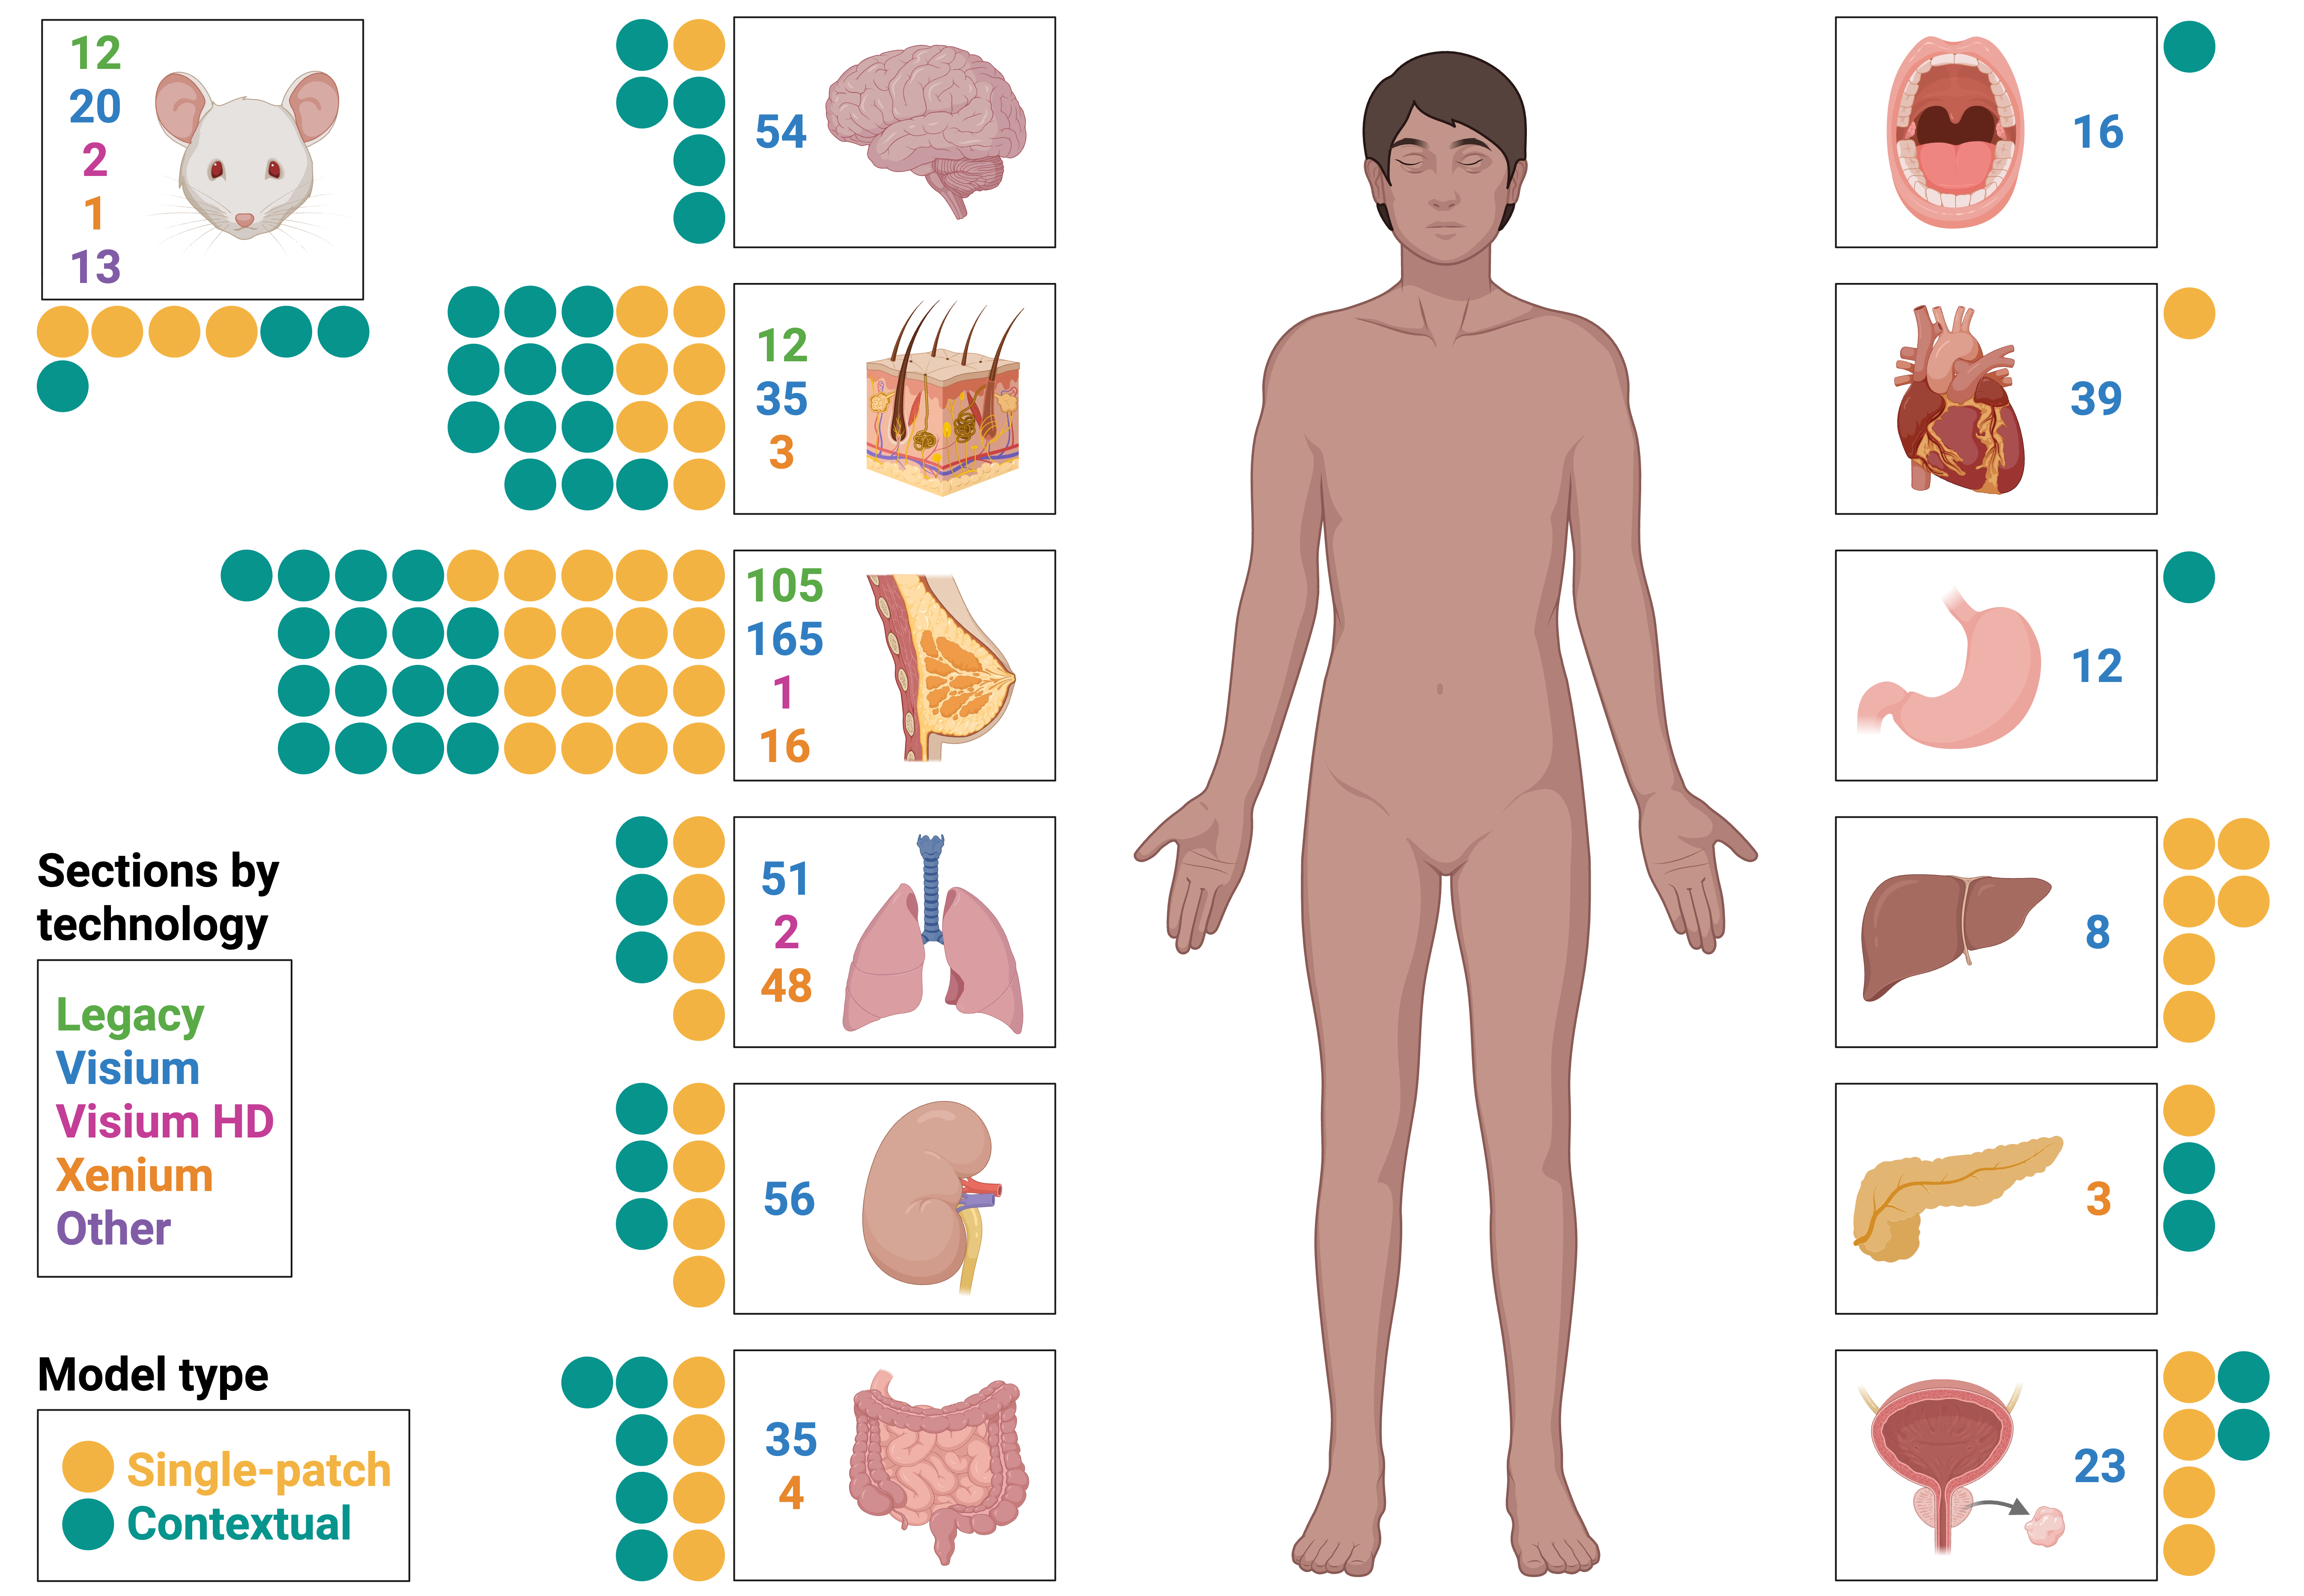
Figure 4. Existing models have been trained and evaluated on diverse spatial transcriptomics data of human and mouse tissues using different technologies (129 legacy Visium sections, 514 Visium sections, 75 Xenium sections, 5 Visium HD sections, and 13 other sections from Space-TREX and Stereo-seq). Each dot represents a model, with duplications if the model was trained on several organs. Forty-one models were shown. Data from recently curated large datasets were not shown as they were mainly used to pre-train but not evaluate models. Created in BioRender. Group, S. (2026) https://BioRender.com/srqvtqa. HD: high definition.
Furthermore, disease datasets beyond cancer remain largely unexplored. It is still uncertain whether condition-specific gene expression patterns can be reliably inferred in diseases where tissue morphology might not differ as markedly as in tumour-normal contrasts. A recent challenge based on a Xenium inflammatory bowel disease dataset highlighted this gap: the competition included only diseased samples and no healthy controls[51]. Thus, it remains unclear whether the top models were able to capture inflammation-specific transcriptional signatures.
To move forward, the ST prediction community requires diverse, curated gold standard datasets processed using the current best practices. Due to the diversity in ST platforms and processing approaches, much of the available data are fragmented and cannot be easily integrated. Unified cross-platform feature representations, for example, based on cell types, cell states, tissue domains, or even foundation-model gene embeddings[52], could facilitate training across technologies. Broad, pan-tissue datasets will remain important for learning generalisable image and transcriptomic representations; however, maximising task-specific performance is likely to require deep, disease-specific cohorts spanning many patients, centres, and technical conditions.
Recently, four large corpora were curated: HEST-1k[13], STimage-1K4M[53], ST-bank[54], and ViSTomics-4M[55] (Table 2). To standardise data pre-processing, HEST-1k developed a library covering alignment, tissue segmentation, patching, and transcriptomics harmonisation. Together, this represents a major step forward for the research community and new models using this resource are emerging, with HEST-1k being one of the widely used corpora[56-59]. However, all four corpora are heavily skewed towards Visium and its precursor technology, with minimal high-resolution data (Xenium and Visium HD). Furthermore, three organs (spinal cord, brain, and breast tissue) accounted for around half the data in some corpora[13,53]. The data coverage for any one specific domain is low, as some corpora are broadly equally split between human and mouse samples. As many datasets include serial sections and repeated donors, users need to consider the biological diversity of the dataset as well as a robust train-test-split strategy to avoid data leakage. As imaging-based ST platforms become more widely adopted, it is anticipated that future data corpora would include more high-resolution datasets. We hope to see more curated, domain-specific datasets of diverse organs and diseases. A community framework for minimal data deposition standards for ST data would go a long way towards addressing our data availability issues. This means not only improving our standards for image data deposition in terms of resolution and format requirements but also upholding metadata standards. Repositories such as CELLxGENE[60], designed for single-cell datasets, are a strong template for what is needed in the spatial community and have been the cornerstone of facilitating artificial intelligence applications in single-cell transcriptomics.
Table 2. Existing ST corpora broadly focused on Visium and its legacy technology.
| ST corpus | Sections | Studies | Organ / tissue types | Most prevalent organs | Paired image-gene patches | Technology | Species |
| HEST-1k (v1.3.0)[13] | 1,276 | 180 | 26 | Spinal cord, brain, breast | 2,100,000 | 43% legacy 47% Visium 3% Visium HD 7% Xenium | 54% human 46% mouse |
| STimage-1K4M[53] | 1,149 | 131 | 50 | Brain, breast | 4,293,195 | 13% legacy 87% Visium ~0 (0.3)% Visium HD | 59% human 36% mouse 5% other/unspecified |
| ST-bank[54] | 1,007 | 113 | 32 | Brain, heart, breast | 2,185,571 | 100% Visium | 100% human |
| ViSTomics-4M[55] | 1,390 | 181 | 30 | Brain, lung, skin | 4,070,000 | 100% Visium | 100% human |
The numbers were taken directly from the publications and include serial sections, repeated donors, non-human samples, and multiple assays from the same specimen. ST: spatial transcriptomics; HD: high definition.
4. ST Data Pre-processing Strategies
Another critical challenge for ST predictions is the choice of data pre-processing and feature selection strategies for both transcriptome and image data. These choices determine the biological signal presented to the learning algorithm and can substantially influence both prediction performance and comparability between studies (Figure 2).
For transcriptome data processing, commonly used approaches include gene and spot filtering, gene smoothing or imputation, batch correction, and normalisation. Filtering low-expression genes or spots can reduce sparsity but risks excluding biologically important signals, such as those arising from rare cell types or tissue structures. Some models, such as ST-Net, TRIPLEX, SEPAL, and Path2Space, apply neighbourhood smoothing or imputation to mitigate dropouts[17,61-63]. While these can improve correlations with measured data, excessive imputation risks over-smoothing and loss of true biological signal.
Likewise, although most studies apply some form of normalisation (e.g., log, library-size, min-max, cell size), no consensus pipeline specifically for ST predictions has emerged. For newer in situ-based ST platforms, the field is still actively debating the best, if any, data normalisation methods, as improper application of commonly used “default” approaches can create artefactual transcriptomic signals in the data[64]. Normalisation should prioritise preservation of biological signal rather than maximising benchmark performance. For example, some studies[13,63] reported higher Pearson correlations after log-normalisation than library-size normalisation. However, as ST library size often exhibits strong spatial variation across tissue regions, improved performance may partly reflect shortcut learning, with the models exploiting spatial differences in transcript abundance rather than learning biologically meaningful variation in gene expression.
Pre-processing choices can also introduce technical bias and data leakage. Non-linear transformations can shift the distribution of gene expression values, thereby impacting Pearson’s correlation which measures linear associations[65]. Additionally, whole dataset scaling can result in data leakage as information in the test set is used to scale the training set. Similarly, spatial smoothing, batch correction, and cross-slide integration performed before train-test splitting can artificially inflate reported performance.
Batch correction and cross-slide integration, although integral to ST data analysis workflows for biological discoveries, are rarely applied for ST prediction and were used only in BLEEP and SEPAL[62,66]. Batch correction remains somewhat controversial: while it reduces technical bias, it may also remove meaningful variation in small datasets[65,67-70]. Despite these challenges, data harmonisation will likely become increasingly important as the field moves towards cross-platform modelling[58]. Overall, there has been a disconnect between data pre-processing approaches for predictive model training and the best practices used by the ST data science community for data analysis, and it will be important in future work to bridge the gap between these two closely related fields by adopting best-practice pre-processing techniques that preserve biological signals, rather than inflating predictive correlation[71].
In image data, as H&E slide images are gigapixel-scale, they are typically split into patches for model training. Patch size and magnification can affect model performance: so far, multi-scale approaches combining cellular detail and tissue architecture appear to be more effective[34,61,72]. As ST prediction moves towards single-cell resolution, patching strategies will likely need to evolve towards cell-centred representations. H&E stain variability adds another layer of complexity: stain normalisation has shown benefits in some models, although no single approach is consistently superior in independent benchmarks[73]. Simple image data augmentation (e.g., rotation, flipping, colour shifts) is widely used to improve model robustness. Image registration poses an additional challenge. While some platforms (e.g., Visium) produce aligned data, most imaging platforms need an additional registration step to align ST morphology images and H&E images. Currently, there is no consensus registration pipeline, and registration methods are rarely described in sufficient detail to enable reproducibility or comparison across studies.
5. Model Architectures and Representation
Despite the challenges and data limitations discussed above, more than 40 models for ST prediction have been developed to date. Their key strategies and performance are summarised in Table 3 and the key developmental milestones are shown in Figure 5. The majority were trained on mini-bulk spot-level rather than single-cell resolution data and rely on deep learning to automatically extract morphological features associated with transcriptomic signal.
Table 3. Comparison of popular models that were originally developed to predict ST from H&E images (until Jul 4th, 2026). Models that were originally developed for bulk transcriptomics prediction but were later adapted by others to predict ST, such as DeepPT[91] were excluded.
| Study | Performance | Dataset | Model | Spatial context | Loss | Patch (pixels) | Image pre-processing | Gene pre-processing |
| ST-Net[17] | CV: positive R in 102 genes External validation: mean R: 0.33 | Legacy breast cancer (250 HEGs) Visium invasive ductal breast carcinoma (10X) (234 HEGs) (external validation) | DenseNet-121 (pre-trained) | No | MSE | 224 | Augmentation | Normalisation + log transformation + neighbourhood smoothing |
| NSL*^[114] | CV: 12 genes with R > 0.50 | Legacy HER2 breast cancer (250 HEGs) | Stain deconvolution matrix + regression | No | MSE | 256 | None | Log transformation |
| XFuse[28] | Visium: test serial sections: mean R: 0.72-0.76 Legacy: test section: median R: 0.60 | Visium skin squamous cell carcinoma (11,025 genes) Legacy mouse olfactory bulb (100 HEGs) Visium ileum (100 HEGs) | Statistical model + recognition & generative networks | No | KL divergence | 512 or 768 | Augmentation | Normalisation + log transformation |
| DeepSpaCE[20] | Test section: mean R: 0.13 | Visium breast cancer (Monjo) (18,542 genes) | VGG-16 (pre-trained) | No | Smooth L1 loss | 224 | Augmentation | Spot quality filter + normalisation |
| BrST-Net[86] | CV: 237 genes with positive R, 24 genes with R > 0.50, 123 genes with 0.30 < R < 0.50 | Legacy breast cancer (250 HEGs) | EfficientNet-b0 + auxiliary network | No | Cross entropy | 224 | Stain normalisation + brightness standardisation + augmentation | Gene quality filter + spot quality filter |
| BLEEP*^[62] | Test serial section: mean R: 0.22 (8 marker genes) and 0.17 (50 MVGs & HEGs) | Visium liver (3,467 MVGs) | ResNet-50 (pre-trained) + FCN (gene encoder) + bimodal contrastive representation learning + query-reference imputation | No | Cross entropy | 224 | None | Normalisation + log transformation + batch correction |
| M2ORT*[72] | Test sections: mean R: 0.45-0.51 | Legacy breast cancer (250 MVGs) Legacy HER2 breast cancer (250 MVGs) Legacy skin cutaneous squamous cell carcinoma (250 MVGs) | ViT (multi-scale) | No | MSE | 224 | None | Normalisation + log transformation |
| IGI-DL[42] | CV: mean R: 0.20-0.34 External validation: mean R: 0.20-0.29 | Visium colorectal cancer (Gao) (179 HESVGs) Visium colorectal cancer (Qi) (179 HESVGs) (external validation) Legacy breast cancer (187 HESVGs) Legacy HER2 breast cancer (187 HESVGs) Legacy breast cancer (Ståhl) (186 HESVGs) (external validation) Legacy skin cutaneous squamous cell carcinoma (487 HESVGs) Visium skin squamous cell carcinoma (467 HESVGs) (external validation) | ResNet-18 + HoverNet + Graph Isomorphism Network | No | MSE | 200 | Stain normalisation | Normalisation + log transformation |
| HE2Gene[97] | Test sections: mean R: 0.18 (250 HEGs) and 0.05 (all genes) | Legacy breast cancer (19,699 genes) | ResNet-50 (pre-trained) + multi-task learning + auxiliary loss | No | MSE | 224 | Augmentation | Gene quality filter + spot quality filter + normalisation + log transformation |
| HEST-1k*^[13] | CV: mean R: 0.49-0.56 (Xenium) and 0.23-0.39 (Visium) | Xenium breast cancer (50 MVGs) Xenium breast cancer (10X-HEST-1k) (50 MVGs) Visium invasive ductal carcinoma axillary lymph nodes (HEST-1k) (50 MVGs) Visium prostate cancer (HEST-1k) (50 MVGs) Xenium pancreatic cancer (10X-HEST-1k) (50 MVGs) Xenium skin cutaneous melanoma (10X-HEST-1k) (50 MVGs) Visium colorectal cancer (8 sections) (50 MVGs) Visium kidney cancer (HEST-1k) (50 MVGs) Xenium lung cancer (10X-HEST-1k) (50 MVGs) | ResNet50 (pre-trained) or H&E foundation models (CTransPath, Remedis, Phikon, UNI, CONCH, GigaPath, Virchow, Virchow 2, H-Optimus-0, UNIv1.5) + PCA + ridge regression | No | MSE | 224 | None | Gene quality filter + log transformation |
| HistoSPACE[115] | CV: mean R: 0.56 | Legacy breast cancer (19,699 genes) Legacy HER2 breast cancer (2 genes) (external validation) | Autoencoder (histology trained)[116]+ convolution blocks | No | MSE + MAE (Huber loss) | 128 | Stain normalisation | Gene quality filter |
| RankByGene*[117] | External validation: mean R: 0.10-0.21 | Legacy HER2 breast cancer (15,000 genes) Visium breast cancer (10X) (250 HEGs & marker genes) (external validation) Visium lung fresh frozen (19,000 genes) Visium lung organoid (250 HEGs & marker genes) (external validation) | H&E foundation model (UNI) + MLP | No | Gene-image contrastive loss (InfoNCE) + cross-model ranking loss + intra-modal distillation loss | 224 | None | Normalisation + log transformation + neighbourhood smoothing |
| Stem*^[59] | Test sections: mean R: 0.28-0.60 | Legacy HER2 breast cancer (300 HEVGs, 1,000 DEGs) Visium kidney (200 HEVGs, 200 MVGs) Visium prostate cancer (HEST-1k) (200 HEVGs) Visium mouse brain (HEST-1k) (200 HEVGs) | Diffusion transformer with H&E foundation model (UNI + CONCH) | No | KL divergence (with MSE) | 224 | Augmentation | Log transformation |
| OmiCLIP[54] | CV: median R: 0.39 | All data in ST-bank (1,007 sections, 32 organs) (pre-training) Visium heart (300 HEGs) | ViT + causal masking transformer (gene encoder) + contrastive learning + weighted query-reference imputation | No | Contrastive loss | 224 | None | Spot quality filter + normalisation |
| HECLIP[118] | Test serial section: mean R: 0.22-0.29 (50 HEGs & MVGs) | Visium liver (~3,500 MVGs & HEGs) Visium primary sclerosing cholangitis liver (~3,500 MVGs & HEGs) Visium dorsolateral prefrontal cortex (~3,500 MVGs & HEGs) | ResNet-50 + spot encoder + bimodal contrastive representation learning + query-reference imputation | No | Cross entropy (image-only) | 256 | Augmentation | Normalisation + log transformation |
| DANet[119] | Test sections: mean R: 0.09 (legacy) and 0.20-0.23 (50 MVGs & HEGs, Visium) | Legacy HER2 breast cancer (785 HEGs) Visium liver (serial sections) (3,467 MVGs) | DenseNet + Mamba (state space model – gene encoder) + residual Kolmogorov-Arnold Networks | No | Cross entropy | 112 + 224 | None | None |
| GHIST[14] | Legacy: CV: median R: 0.16 Xenium breast: intra-slide CV: median R: 0.44-0.60 | Legacy HER2 breast cancer (785 MVGs) Xenium breast cancer (313 genes, 50 MVGs, 50 SVGs) Xenium melanoma (10X) (382 genes) (cell type prediction) Xenium lung adenocarcinoma (10X) (377 genes) (cell type prediction) | Multi-task deep learning | No | MSE | 256 (Xenium) & 112 (Legacy) | Stain normalisation + augmentation | Gene quality filter + log transformation |
| PRTS[120] | Test: mean R: 0.20-0.33 | Visium HD mouse brain (1,820 DEGs) Visium HD lung cancer (1,656 DEGs) Visium HD breast cancer (1,147 DEGs) Visium mouse brain | ViT + MLP | No | Cross entropy + MSE | 16 + 256 | None | Cell & spot quality filter + log normalisation |
| SCellST[56] | Test sections: mean R: 0.06-0.17 | Visium prostate cancer (HEST-1k) (5 sections) (500 MVGs & SVGs) Visium kidney cancer (HEST-1k) (8 sections) (500 MVGs & SVGs) Visium breast cancer (10X) (1,000 SVGs) Xenium breast cancer (100 genes) (external validation) Xenium breast cancer (10X) (100 genes) (external validation) | CellViT + ResNet50 (pre-trained/Moco v3 self-supervised learning) | No | MSE | 48 | None | Gene quality filter + cell quality filter + normalisation + log transformation |
| STimage[26] | CV: mean R: 0.18 (legacy) and 0.38 (Visium non-breast) Visium test sections: median R: 0.05-0.13 External validation: median R: 0.09 | Legacy HER2 breast cancer (737 MVGs) Visium breast cancer (1,522 functional genes) Visium breast cancer (10X) (982 MVGs) Visium melanoma (100 best predicted genes) Visium primary sclerosing cholangitis liver (100 best predicted genes) Visium kidney cancer (100 best predicted genes) Xenium breast cancer (Tan) (106 genes) (external validation) | ResNet-50 (pre-trained)/H&E foundation models (CTransPath, Phikon, UNI, CONCH, GigaPath, Virchow 2, H-Optimus) + ensemble learning | No | Negative log likelihood | 299 | Stain normalisation + augmentation | Gene quality filtering |
| CMRCNet[57] | CV: mean R: 0.20-0.53 (50 HEGs & MVGs) and 0.10-0.35 (250 HEGs & MVGs) | Visium invasive ductal carcinoma axillary lymph nodes (HEST-1k) (250 HEGs & MVGs) Xenium skin cutaneous melanoma (10X-HEST-1k) (250 HEGs & MVGs) Visium colorectal cancer (4 sections) (250 HEGs & MVGs) Xenium colorectal cancer (250 HEGs & MVGs) Xenium breast cancer (250 HEGs & MVGs) Xenium breast cancer (10X-HEST-1k) (250 HEGs & MVGs) Visium primary sclerosing cholangitis liver (250 HEGs & MVGs) | ViT + FCN (gene encoder) + bimodal contrastive representation learning + self-normalising network + query-reference imputation | No | Cross entropy + MSE | 224 | Augmentation | Normalisation + log transformation |
| UMPIRE[55] | CV: mean R: 0.29 | All data in ViSTomics-4M (1,390 sections, 30 tissues/organs, 20,310 genes) (pre-training) Legacy HER2 breast cancer (50 MVGs & HEGs) Visium liver (50 MVGs & HEGs) Visium prostate cancer (HEST-1k) (5 sections) (50 MVGs & HEGs) | H&E foundation model (UNI, Phikon) + gene foundation model (Visiumformer, Nicheformer) + cross-modal alignment + weighted query-reference imputation | No | Masked language modelling loss + symmetric contrastive learning loss + MSE | 224 | None | Spot quality filter |
| Path2Space[63] | CV: median R: 0.16 (legacy) and 0.38 (Visium) External validation: median R: 0.33-0.40 | Visium triple-negative breast cancer (14,068 genes) Legacy HER2 breast cancer (785 MVGs) Visium high-plasticity triple-negative breast cancer (14,068 genes) (external validation) Visium breast cancer (Human Tumour Atlas Network) (14,068 genes) (external validation) Visium breast cancer (HEST-1k) (14,068 genes) (external validation) | H&E foundation model (CTransPath) + MLP + ensemble learning | No | MSE | 224 | Image quality filter + stain normalisation + augmentation | Gene quality filter + log transformation + neighbourhood smoothing |
| HisToGene*[98] | CV: median R: 0.0-0.3 | Legacy HER2 breast cancer (785 MVGs) Legacy skin cutaneous squamous cell carcinoma (134 MVGs) | ViT | Yes | MSE | 112 | None | Gene quality filter + normalisation + log transformation |
| Hist2ST[90] | CV: mean R: 0.05 - 0.21 | Legacy HER2 breast cancer (785 MVGs) Legacy skin cutaneous squamous cell carcinoma (134 MVGs) Visium Alzheimer’s brain (1,000 MVGs) Visium dorsolateral prefrontal cortex (1,000 MVGs) Visium breast cancer (10X) (1,000 MVGs) Legacy mouse olfactory bulb (1,000 MVGs) Space-TREX mouse brain (1,000 MVGs) Stereo-seq mouse brain (1,000 MVGs) | CNN (Convmixer) + ViT + GCN (GraphSAGE) + LSTM | Yes | MSE + negative log likelihood | 112 | Augmentation | Gene quality filter + normalisation + log transformation |
| EGN*^[121] | CV: mean/median R: 0.20-0.23 | Legacy breast cancer (250 HEGs) | ViT + Exemplar learning | Yes | MSE + Pearson's correlation loss | Whole image | None | Log transformation + normalisation |
| EGGN (EGN v2)[122] | CV: mean/median R: 0.29-0.31 | Legacy breast cancer (250 HEGs) | ResNet-18 (pre-trained) + GraphSAGE + GCN (exemplar learning) | Yes | MSE + Pearson's correlation loss | Whole image | None | Log transformation + normalisation |
| SEPAL*^[65] | Test: mean R: 0.00 (legacy) and 0.38 (Visium serial sections) | Legacy breast cancer (256 SVGs) Visium breast cancer (10X) (256 SVGs) | ViT + GNN | Yes | MSE | 224 | None | Spot quality filter + gene quality filter + normalisation + log transformation + median imputation + batch correction |
| THItoGene[99] | CV: mean/median R: 0.18-0.25 | Legacy HER2 breast cancer (785 MVGs) Legacy skin cutaneous squamous cell carcinoma (171 MVGs) Visium dorsolateral prefrontal cortex (8 layer-marker genes) | Dynamic convolution + Efficient-Capsule network + ViT + graph attention network | Yes | MSE | 112 | Augmentation | Gene quality filter + normalisation + log transformation |
| TCGN[105] | CV: mean/median R: 0.12-0.23 | Legacy HER2 breast cancer (785 MVGs) Legacy skin cutaneous squamous cell carcinoma (171 MVGs) Visium dorsolateral prefrontal cortex (1,000 MVGs) | CNN + ViT + GNN | Yes | MSE | 112 (legacy Visium) or 56 (Visium) | Augmentation | Gene quality filter + normalisation + log transformation |
| TransformerST[123] | Test sections: mean R: 0.23 | Legacy HER2 breast cancer (50 MVGs) | ViT + adaptive graph transformer + cross-scale internal GNN | Yes | MSE | Whole image | None | None |
| TRIPLEX*^[61] | CV: mean R: 0.21-0.37 External validation: mean R: 0.12-0.14 | Legacy breast cancer (250 HEGs)Legacy HER2 breast cancer (250 HEGs) Legacy skin cutaneous squamous cell carcinoma (250 HEGs) Visium breast cancer (10X) (250 HEGs) (external validation) | ResNet-18 (histology trained)[124]+ hierarchical ViT | Yes | MSE | 224 + 1120 + whole image | Augmentation | Normalisation + log transformation + neighbourhood smoothing |
| STFormer*^[44] | CV: median R: 0.25External validation: median R: 0.15 | Visium colorectal cancer (418 MVGs) Visium colorectal cancer (STFormer) (1,000 MVGs) (external validation) | DenseNet-121 + cross-WSI transformer | Yes (cross-WSI) | MSE | 128 | Augmentation (AdaIN) | Normalisation |
| ErwaNet[125] | CV: mean R: 0.33 (legacy) & 0.84 (Visium) | Legacy breast cancer (250 HEGs) Visium breast cancer (10X) (250 HEGs) | ResNet-18 (pre-trained) + GCN + edge-relational module + window-attentional module + MLP | Yes | MSE + Pearson's correlation loss | Whole image | None | Normalisation + log transformation |
| ResSAT*[126] | Test sections: mean R: 0.22-0.24 | Visium mouse brain (10X) (1,000 MVGs) | ResNet50 + self-attention transformer | Yes | MSE | 224 | None | Normalisation + log transformation |
| HGGEP[127] | CV: mean/median R: 0.19 | Legacy HER2 breast cancer (785 MVGs) Legacy skin cutaneous squamous cell carcinoma (171 MVGs) | ShuffleNet V2 (pre-trained) + gradient enhancement module + convolutional block attention module + ViT + hypergraph association module + LSTM + MLP | Yes | MSE + Zero-Inflated Negative Binomial loss | 112 | None | Gene quality filter |
| MclSTExp[128] | CV: mean R: 0.19-0.32 | Legacy HER2 breast cancer (785 MVGs) Legacy skin cutaneous squamous cell carcinoma (171 MVGs) Visium HER2 breast cancer (685 MVGs) Visium breast cancer (685 MVGs) | DenseNet-121 (pre-trained) + transformer (gene & position encoder) + contrastive learning + weighted query-reference imputation | Yes | Cross entropy | 224 | None | Gene quality filter + normalisation + log transformation |
| STMCL[85] | CV: mean R: 0.11-0.31 | Legacy HER2 breast cancer (785 MVGs) Legacy skin cutaneous squamous cell carcinoma (171 MVGs) Visium HER2 breast cancer (50 MVGs) Visium dorsolateral prefrontal cortex (84 MVGs) | DenseNet-121 (pre-trained) + MLP (gene & position encoder) + contrastive learning + weighted query-reference imputation | Yes | Cross entropy | 224 | None | Gene quality filter + normalisation + log transformation |
| DeepSpot*[34] | CV: mean R: 0.04-0.11 (Visium) and 0.16 (Xenium) | Visium metastatic melanoma (5,000 MVGs) Visium kidney cancer (HEST-1k) (5,000 MVGs) Visium kidney cancer with tertiary lymphoid structures (5,000 MVGs) Visium lung cancer (5,000 MVGs) Visium lung cancer with tertiary lymphoid structures (5,000 MVGs) Visium colorectal cancer (8 sections) (5,000 MVGs) Xenium lung cancer (17 sections) (300 MVGs) | Deep-set neural networks + H&E foundation models (UNI, Phikon, H-optimus-0) | Yes | MSE | Variable | None | Normalisation + log transformation |
| STFlow*^[89] | CV & test sections: mean R: 0.51-0.70 (Xenium) and 0.12-0.42 (Visium) | Xenium breast cancer (50 MVGs) Xenium breast cancer (10X-HEST-1k) (50 MVGs) Xenium pancreatic cancer (10X-HEST-1k) (50 MVGs) Xenium skin cutaneous melanoma (10X-HEST-1k) (50 MVGs) Visium colorectal cancer (10 sections) (50 MVGs) Visium kidney cancer (HEST-1k) (50 MVGs) Xenium lung cancer (10X – HEST-1k) (50 MVGs) Visium invasive ductal carcinoma axillary lymph nodes (HEST-1k) (50 MVGs) Visium breast cancer (STimage-1K4M) (50 MVGs) Visium brain cancer (STimage-1K4M) (50 MVGs) Visium skin squamous cell carcinoma (50 MVGs) Visium oral cancer (STimage-1K4M) (50 MVGs) Visium prostate cancer (HEST-1k) (7 sections) (50 MVGs) Visium stomach cancer (STimage-1K4M) (50 MVGs) Visium colorectal cancer (STImage-1K4M) (50 MVGs) | H&E foundation model (UNI) + flow matching + frame-averaging-based transformer | Yes | MSE | 256 | None | Log transformation |
| SPiRiT*[76] | Xenium: test cells: all genes with positive RLegacy: CV: 142 genes with positive R | Xenium breast cancer (313 genes)Xenium whole mouse (10X) (379 genes) Legacy HER2 breast cancer (250 HEGs) | ViT | Yes | MSE | Whole image | Augmentation | Log transformation |
| STPath[58] | Test sections: mean R: 0.27 (200 MVGs) External validation: mean R: 0.37 | All data in HEST-1K & STImage-1K4M (983 sections, 17 organs) (38,984 genes) External validation:Xenium breast cancer (50 MVGs) Xenium breast cancer (10X-HEST-1k) (50 MVGs) Visium prostate cancer (HEST-1k) (50 MVGs) Xenium pancreatic cancer (10X-HEST-1k) (50 MVGs) Xenium skin cutaneous melanoma (10X-HEST-1k) (50 MVGs) Visium colorectal cancer (8 sections) (50 MVGs) Visium kidney cancer (HEST-1k) (50 MVGs) Xenium lung cancer (10X – HEST-1k) (50 MVGs) Visium invasive ductal carcinoma axillary lymph nodes (HEST-1k) (50 MVGs) | H&E foundation model (GigaPath) + spatial-aware transformer | Yes | MSE | 256 | None | Log transformation |
| PH2ST[129] | CV (intra-slide): mean R: 0.34–0.48 External validation (serial section): mean R: 0.51 | Legacy HER2 breast cancer (785 HEGs) Legacy skin cutaneous squamous cell carcinoma (171 HEGs) Xenium breast cancer (1 slide) (21 genes) (external validation) | H&E foundation model (UNI) + dual-scale hypergraph + ViT + cross-attention module + prompt-guided representation refinement | Yes | MSE | 224 | None | Gene quality filter + normalisation + log transformation |
CV: cross-validation; R: Pearson’s correlation; MSE: mean squared error; MAE: mean absolute error; HEG: highest-expressed gene; MVG: most variable gene; HEVG: highest-expressed variable gene; DEG: differentially expressed gene; SVG: spatially variable gene; HESVG: highest-expressed spatially variable gene; KL divergence: Kullback-Leibler divergence; MLP: multi-layer perceptron; ViT: vision transformer; CNN: convolutional neural network; FCN: fully connected network; WSI: whole-slide image; GCN: graph convolutional network; GNN: graph neural network; LSTM: long short-term memory; PCA: principal component analysis; H&E: haematoxylin and eosin; HER2: human epidermal growth factor receptor 2. *: preprint; ^: conference paper.
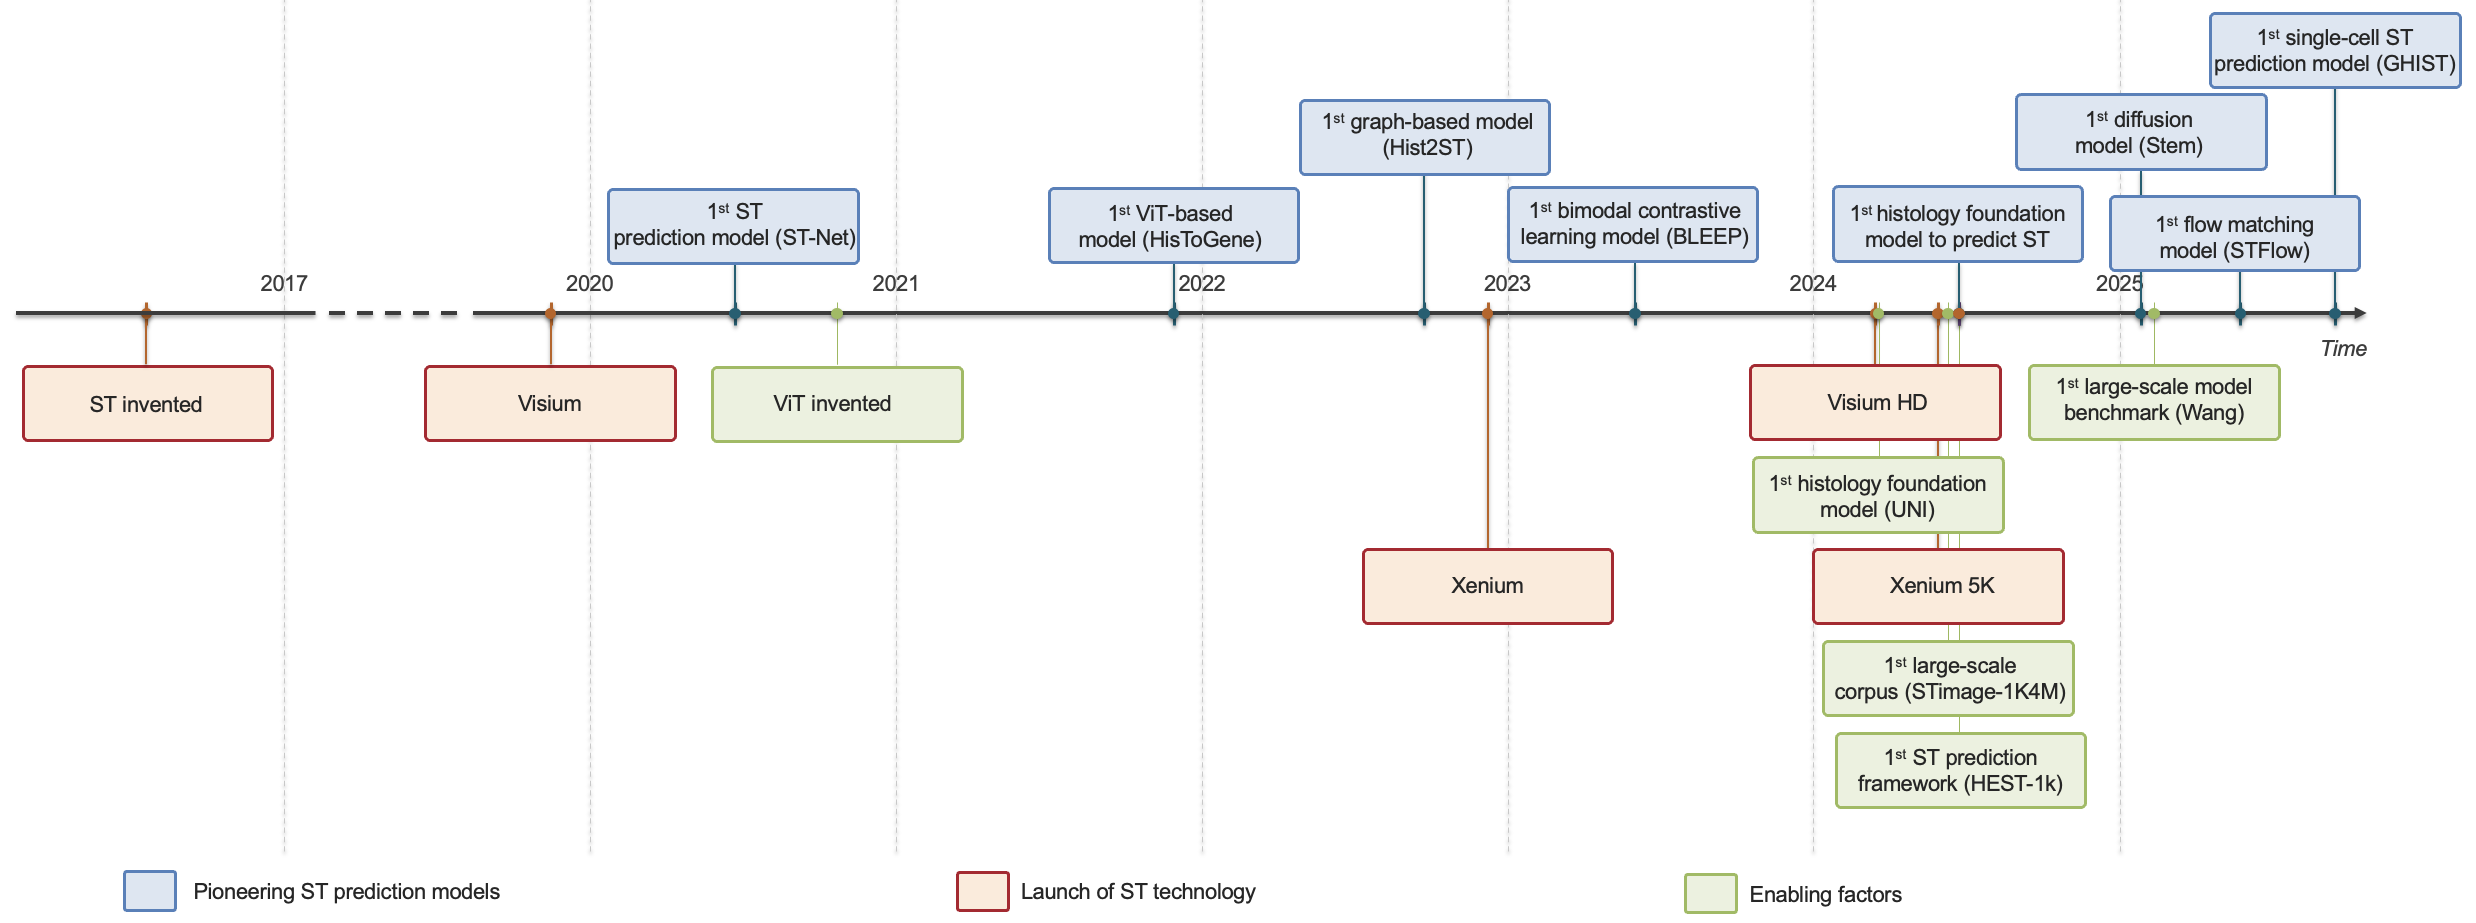
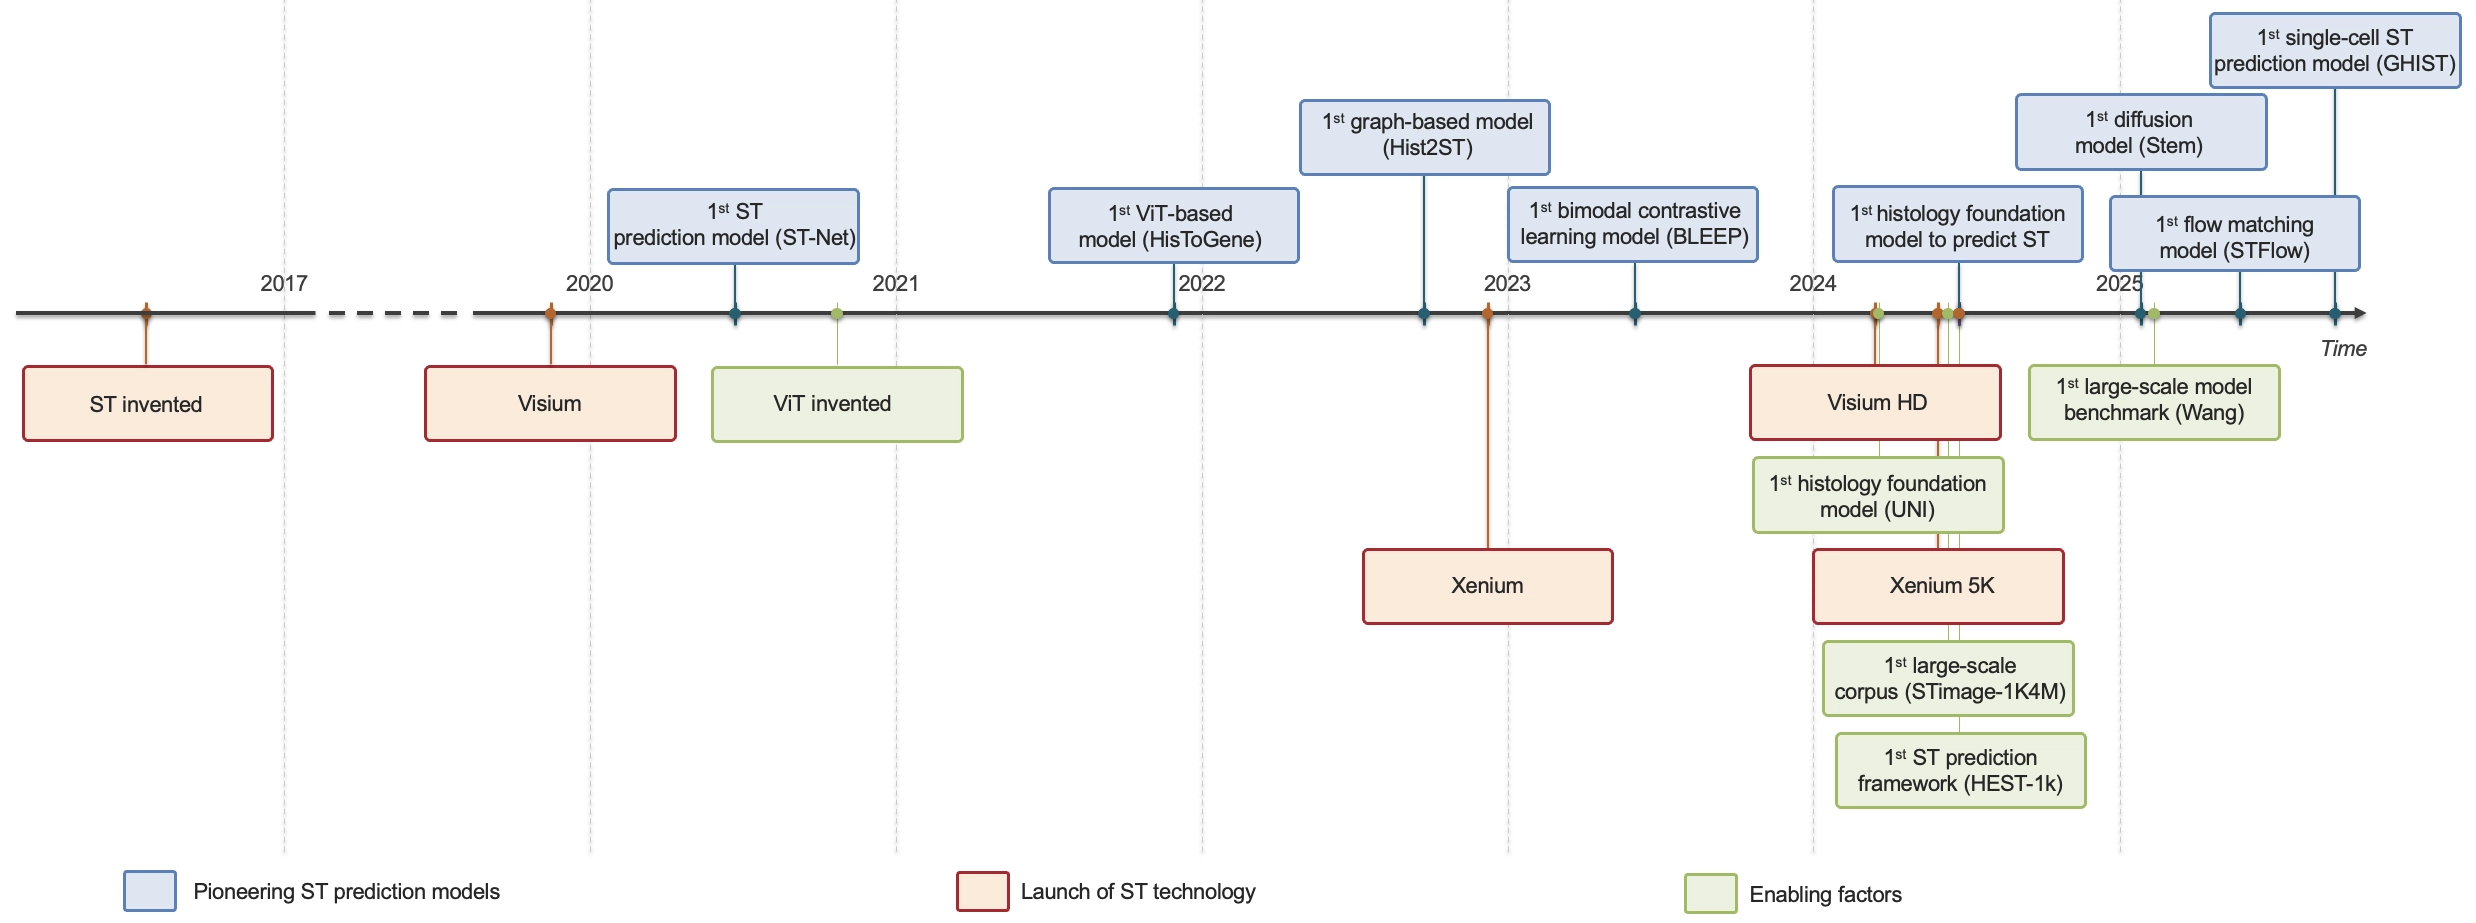
Figure 5. Milestones in ST prediction from histology were driven by a mixture of ST platform development, digital pathology advances, dataset curation, training framework development, and benchmarking efforts. ViT: vision transformer; ST: spatial transcriptomics; HD: high definition.
The initial models treated each ST spot and its corresponding image patch as an independent training pair. These single-patch models performed patch-wise regression to predict expression values using convolutional neural networks (CNNs) such as ResNet, EfficientNet, or VGG, either from baseline training or after pre-trained on ImageNet. In contrast, contextual models incorporate spatial dependencies across patches through graph neural networks (GNNs) and vision transformers (ViTs). GNNs encode local neighbourhoods, though often spanning only a small number of adjacent spots, to model structural tissue relationships, while ViTs integrate positional information to capture broader tissue architectures and longer-range dependencies.
Although these contextual designs were expected to enhance performance by incorporating broader morphological context into predictions, benchmarking studies and evaluation experiments[34,72,74] have revealed no strong, consistent benefit over simpler CNNs. Including the contextual module often yielded only marginal increases in performance, suggesting that the scale and sparsity of current ST data constrain the benefits of larger models or long-range contextual information. Wide spot spacing, small sample sizes, and over-smoothing in GNNs may all contribute to the muted gains observed. Importantly, the appropriate scale of contextual information remains unclear. Most current GNNs aggregate information from only a small number of neighbouring spots, capturing relatively local tissue context, whereas many biologically relevant structures extend over much larger spatial scales. It is critical to understand which levels of tissue organisation contribute meaningful predictive information. Contextual information could become more valuable for imaging-based ST platforms that achieve single-cell resolution, where spatial continuity may support better relational learning. In the meantime, hybrid architectures such as DeepSpot, TRIPLEX, and M2ORT[34,61,72] have attempted to balance complexity and data constraints through multi-scale or hierarchical feature integration across concentric patches and magnifications.
The scarcity of training data has also driven widespread adoption of transfer learning. Pre-training on large image corpora, most commonly ImageNet[75], allows models to capture visual primitives such as edges and textures that can transfer to histology. Several studies, including ST-Net and SPiRiT, have reported higher accuracy when initialised with ImageNet weights[17,76]. Building on this success, recent pan-tissue H&E foundation models (CTransPath[77], GigaPath[78], Phikon[79], UNI[80], CONCH[81], Virchow[82], Virchow2[83], and H-Optimus-0[84]) have been adapted for ST prediction. Foundation models are large vision models trained on many H&E images from multiple organs and diseases, typically via self-supervised learning. Through extensive training, these models learn to represent H&E images as embeddings that effectively capture morphological features. These embeddings can be used for various downstream tasks, such as biomarker prediction and diagnosis, and usually outperform models without histology-based pre-training[13]. To further improve performance, foundation models could be fine-tuned on tissue- and disease-specific data prior to ST inference[13]. However, most current H&E foundation models were pre-trained on relatively large tissue patches. If ST prediction moves towards cell-centred representations for high-resolution platforms, the input image distribution may begin to differ substantially from those seen during pre-training. Existing foundation models may therefore require fine-tuning or adaptation for cell-level prediction. Fusing multiple foundation models produced only modest gains[26], likely due to feature misalignment, but in the future, using consensus representations across models could provide more stable improvements.
The relationship between model size and performance remains ambiguous. For CNNs and ViTs, smaller architectures such as EfficientNet-B0 or ResNet-50 frequently outperform larger ones, likely due to reduced overfitting[62,66,85,86]. Among foundation models, findings are mixed: some favour compact networks and others larger ones, but model capacity is closely intertwined with the scale of the pre-training corpus[13]. In practical terms, smaller models tend to offer better efficiency unless extensive, domain-relevant pre-training data are available.
With growth in both the size and resolution of training data, computational efficiency also requires careful consideration. Smaller patch-based models treat each image patch as an individual training sample and therefore avoid loading large tissue regions into memory, whereas ViT- and GNN-based models have many parameters and high demands on memory and compute time[74], sometimes leading to out-of-memory errors in benchmarking studies[87,88]. As imaging-based ST data become more common, a single slide can contain hundreds of thousands of training patches, compared with several thousand in Visium (Table 1). ViT-based models may therefore be unsuitable for cell-centred gene prediction if the number of patches is too large to load into memory simultaneously. When choosing model architectures, investigators should weigh the value of contextual information against model size, performance, memory requirements, training time, and the size and resolution of the dataset. Fortunately, foundation models can simplify ST model training because image features can be extracted with a frozen foundation model and only a lightweight prediction head, such as a linear layer, decision-tree-based model, or a small multi-layer perceptron, needs to be trained[13].
Beyond architectural choices, the community is increasingly rethinking how ST prediction itself should be formulated. Most existing models cast it as a regression problem, mapping image features directly to gene expression. Others adopt more innovative strategies: contrastive learning frameworks, first adopted by BLEEP[62], align image and expression embeddings to enable retrieval-based inference; GHIST[14] integrates single-cell RNA-seq references to estimate cell-type compositions and infer expression through weighted averaging; Stem introduces a generative framework conditioned on histology[59]; and STFlow additionally adopts flow matching[89] (Figure 5). These alternative formulations are usually preceded by methodological developments in general computer vision and may offer novel ways to encode the underlying biology.
6. Model Performance
Despite the diverse modelling strategies described above, current methods for ST prediction generally perform modestly. The mean or median Pearson’s correlation coefficients (R) between predicted and measured gene expression typically range from 0.0 to 0.6, often below thresholds for practical application. Moreover, it was difficult to perform cross-study comparisons, as papers often report different prediction targets, validation strategies, ST platforms, and evaluation metrics.
A major source of inconsistency arises from variation in prediction targets. Models have been trained on heterogeneous gene sets, including the most highly expressed, variable, or spatially variable genes, differentially expressed genes, and cluster-specific marker genes. These targets naturally vary between datasets, and this heterogeneity frustrates comparison. Comparing models that predict only marker genes with those predicting the entire transcriptome is inherently unfair, as the former task is substantially easier. Marker genes are more tightly linked to morphology, making them more predictable than broadly variable or highly expressed genes, as seen in ST-Net, DeepSpaCE, STimage, BLEEP, and Hist2ST[17,20,26,62,90]. More recent studies have focused on spatially variable genes, which are also easier to predict.
Validation strategies further complicate interpretation. The most robust approach, external validation on unseen datasets of the same tissue type, has been rare, although it is increasingly being adopted as more data become available, as seen in ST-Net, IGI-DL, HistoSPACE, RankByGene, sCellST, STimage, TRIPLEX, STFormer, STPath, PH2ST, and Path2Space (Table 3). Most models, however, rely on leave-one-patient-out, leave-one-section-out, or hold-out validations, with decreasing generalisability as the strategy becomes less stringent. Testing on consecutive or intra-section regions tends to yield inflated results due to morphological similarity. Besides testing on the same or consecutive slides, there might be other sources of data leakage. For instance, testing on slides from the same donor, serial sections, or even neighbouring tissue regions, can inflate correlation performance due to reduced biological variation; unfortunately, exact evaluation strategies are often not reported. Beyond validation on independent datasets, few studies[20] have confirmed predictions using orthogonal experimental assays such as RNA in situ hybridisation, immunohistochemistry, or alternative ST platforms. Such validation would provide stronger evidence that models can recover biologically meaningful signals rather than dataset-specific correlations and will become increasingly important as ST prediction moves towards clinical and biological applications.
Several benchmarking studies have attempted to provide an objective comparison of model performance, reporting that no model consistently dominates and performance varies across ST platforms. The first cross-model evaluation compared six methods on breast cancer sections, identifying Hist2ST, BLEEP, and STimage as top performers but noting poor external generalisability and low overall R values (0.1-0.3)[73]. A larger study subsequently assessed 11 models across five datasets covering multiple tissues, assessing prediction accuracy, generalisability, translational relevance, usability, and computational efficiency[74]. It concluded that DeepPT, EGN, and Hist2ST performed most consistently, though no single model excelled across all criteria, with most genes still predicted poorly (R ≈ 0.0-0.4). Extending this scope, HEST-1k tested 11 models, including 10 H&E foundation models, on 70 datasets spanning nine organs and two platforms[13]. It reported that the performance increased with model and training-data size but varied widely across tissues and ST platforms, likely reflecting both biological differences in morphology-gene relationships and technical factors such as batch effects and measurement quality. Reported performance should therefore be interpreted relative to the biological difficulty of the prediction task rather than as an absolute measure of model quality.
While Pearson’s R has been widely used to assess model performance, it captures only one aspect of prediction performance and may be particularly sensitive to the sparsity of ST data resulting from gene dropout. Employing a variety of performance metrics could provide a more comprehensive performance assessment, such as Mutual Information, Jensen-Shannon divergence, normalised root mean squared error, structural similarity index, and area under the curve[74]. More importantly, evaluation should increasingly consider biologically meaningful downstream tasks, such as biomarker prediction, pathway activity, tissue domain identification, or cell-state inference, rather than relying solely on transcript-wise correlations. Current evidence suggests that ST platform choice exerts a greater influence on prediction accuracy than model architecture itself[13]. Notably, there was a marked performance increase from Visium to Xenium data. This may be due to the higher sensitivity and specificity of Xenium, leading to less gene dropout and transcript diffusion. However, it is important to be mindful of the panel design bias in Xenium, as target panels tend to include only biologically relevant genes which are more likely to be reflected in morphology and therefore easier to predict. Higher spatial resolution also does not automatically imply more comprehensive or less biased biological information.
The lack of standardised reporting further hampers comparison and reproducibility. As different studies use different gene sets, pre-processing pipelines, validation splits, and performance metrics, it is difficult to compare model performance. To improve transparency, reproducibility, and cross-study comparisons, we therefore propose a minimal reporting standard for future ST prediction studies (Box 1).
Box 1. Proposed minimal reporting standards for ST prediction studies.
| Data | Dataset accession(s), tissue type, sample IDs, donors, ST platform, train-test splits, dataset diversity, sample inclusion/exclusion criteria |
| Prediction Task | Gene/feature selection strategy (e.g. marker genes, spatially variable genes, pathways, cell types, cell states), biological rationale and intended downstream application (e.g. biomarker prediction, tissue domain identification, patient stratification) |
| Pre-processing: Transcriptomics | Filtering, normalisation, smoothing, batch correction and whether pre-processing parameters were fitted using training data only |
| Pre-processing: Image | Stain normalisation, patch size, magnification, augmentation, registration |
| Model | Architecture, foundation model use, frozen vs fine-tuned |
| Validation Strategy | External validation cohorts, donor/section split, use of serial sections, biological independence of test/train samples and whether any donors appear in both sets |
| Performance | Performance metrics (e.g., Pearson’s R, RMSE, mutual information, spatial agreement), performance stratified by prediction target (selected genes vs transcriptome, morphology-positive vs morphology-negative genes where possible), uncertainty estimates and comparison with appropriate baselinesNegative results: genes or targets that consistently fail prediction |
| Reproducibility | Release codes, trained models, full pre-processing pipelines, configuration files, exact train/test sample IDs |
| Computational Efficiency | Training time, inference time, GPU memory requirements, model size and scalability to larger datasets |
RMSE: root mean squared error; ST: spatial transcriptomics.
7. Alternative Prediction Targets
The challenge of ST prediction has prompted a broader reconsideration of prediction targets. Whole-transcriptome reconstruction is often noisy and difficult to interpret, whereas predicting biologically structured outputs, such as cell types, gene signatures, or spatial domains, offers clearer utility. For instance, predicting specific types of immune infiltrates in cancer could inform prognosis, while predicting disease-specific cell states might improve understanding of complex chronic diseases, such as inflammatory and fibrotic diseases.
Several studies have demonstrated improved clinical and functional relevance by predicting coarser and more biologically informed targets. DeepPT, for example, achieved greater accuracy and stronger biological associations when predicting cancer gene signatures rather than individual genes[91], while DeepSpaCE successfully distinguished tumour and non-tumour regions based on predicted gene clusters[20]. Additionally, DeepPathway demonstrated that directly predicting gene pathways was superior to deriving pathway scores from predicted genes, arguing that pathways, as aggregations of multiple biological signals, mitigate individual gene fluctuations[92].
Recently, the development of single-cell foundation models has opened the possibility of predicting gene embeddings across gene panels. Single-cell foundation models are pan-organ models pre-trained on large corpora of single-cell transcriptomics data, such as Geneformer and scGPT[93,94]. Like H&E foundation models, these models can derive embeddings from gene expression data to encode gene-gene relationships. These embeddings could provide a unifying framework for integrating different gene panels used in imaging-based ST platforms, which would otherwise be nearly impossible. Establishing a common feature space based on these embeddings, as done in UMPIRE[55], could enable comparison and aggregation of predictions across technologies. Individual gene-expression values can then be reconstructed from the embeddings. While showing considerable promise, representations from single-cell foundation models are currently still largely driven by batch effects[95] and cross-modal alignment with H&E encoders can often worsen ST prediction[96]. This field is still in its infancy and under investigation, and it may benefit from more diverse single-cell transcriptomics training data and tissue- or disease-specific fine-tuning before application.
8. Research Applications
While current model performance and dataset size limit immediate clinical translation, expanding ST datasets and improving model generalisability may soon make in silico predictions useful for research. Nonetheless, widespread application will require rigorous benchmarking across external datasets, training on data from different centres and diverse ancestries, standardised metrics, and uncertainty estimates to ensure reliability.
A tangible application of ST prediction is biomarker discovery and hypothesis generation. Tasks requiring the accurate prediction of a small number of genes, such as key biomarkers or the top variable genes, seem already within reach in the near term. Even moderate correlations (R > 0.5) can suffice for exploratory or semi-quantitative applications. For hypothesis generation, models trained on small ST cohorts can be deployed across large H&E repositories to map predicted gene expression or pathway activity, enabling morphological interpretation at scale. For example, ST-Net applied to The Cancer Genome Atlas Breast Invasive Carcinoma (TCGA-BRCA) images revealed spatial separation of tumour and immune markers consistent with low lymphocyte infiltration, while DeepSpot and HE2Gene identified biologically meaningful marker distributions in breast and renal cancers[17,34,97]. Such applications can highlight potential mechanisms and guide further targeted experimental exploration.
Another tangible use is tissue domain inference. Despite poor per-gene correlations, clustering of predicted expression often reproduces or even surpasses pathologist annotations, sometimes even outperforming measured gene profiles by denoising technical artefacts such as dropouts or batch effects[90,98,99]. Spatially aware clustering methods that integrate coordinates or images, such as STMask[100] or STAGATE[101], tend to outperform purely expression-based approaches. Using predicted ST to derive tissue clusters can effectively generate unbiased and molecularly derived histology labels compared to manual annotation, which could be useful in training histology models to perform tissue segmentation. More broadly, ST prediction could be used as a scalable label generator for the large collections of H&E images that lack annotations.
ST prediction can also address the intrinsic sparsity of current technologies by performing super-resolution imputation. Models such as DeepSpaCE and HisToGene have been used to impute gene expression in unmeasured or inter-spot regions, producing denser and more continuous maps that, for example, delineate invasive fronts in cancer tissues[20,98]. Applying these types of models to overlapping or sub-spot patches effectively performs super-resolution virtual imputation, potentially recovering fine-scale structures that are otherwise not measured. Clustering at higher spatial granularity improved alignment with histological structures, supporting the notion that finer spatial resolution yields biologically coherent domains[98]. Nevertheless, independent high-resolution or orthogonal validation is needed to establish the validity of super-resolution imputation.
These approaches extend naturally to reconstructing 3D ST maps from consecutive tissue sections. By predicting expression in adjacent slices, models could generate virtual volumetric molecular atlases that reveal tissue organisation and cell–cell interactions along the z-axis, analogous to approaches using measured consecutive ST slices from mouse brain, human heart, and human tumours[102]. Nonetheless, careful registration is needed to reduce alignment errors.
Even at current accuracy levels, model predictions could support study design, data triage, and downstream modelling. For instance, slides with high predicted biomarker expression could be prioritised for costly assays, reducing experimental burden. Predicted gene features might also serve as inputs for downstream modelling, such as estimating mechanical properties[103]. Beyond primary tissues, models could assess maturation and heterogeneity in engineered tissues or organoids, or even be applied across species to investigate evolutionary conservation.
Future extensions will likely involve multi-modal integration. As spatial technologies increasingly measure proteins, microRNAs, metabolites, and chromatin accessibility, ST models could be adapted to predict or integrate these complementary layers. Recent work already demonstrates prediction of multiplex proteomics from H&E images and the feasibility of multi-omics models combining transcriptomics, genomics, and morphology to predict thousands of biomarkers and clinical outcomes[104]. Multi-modal integration could also enable cross-modal imputation, such as denoising noisy proteomic data and filling missing modalities to support discovery.
Overall, in silico ST offers an accessible platform for biological discovery. It enables large-scale screening of archived histology images to infer transcriptional states, perform virtual studies, fill temporal gaps in developmental or time-course datasets, and facilitate multi-modal integration.
9. Clinical Applications
As predicting ST from routine H&E slides could drastically reduce the time and cost associated with molecular assays, it has substantial longer-term translational potential in diagnostics, patient stratification, and histology copilots.
Integrating predicted molecular maps with histopathology could enable semi-automated decision support for cancer grading, inflammation scoring, or prognostic evaluation. For instance, several models have demonstrated that spatial predictions can be aggregated to generate bulk-level gene-expression profiles[17,34,105]. Such predictions have subsequently been used for clinically relevant downstream analyses, including tumour subtype classification and patient-outcome prediction[17,34]. Although similar work has yet to extend beyond oncology, experience from general digital pathology suggests that analogous applications are feasible, including detecting infections[106,107], fibrosis[108], and inflammatory[109] or muscular diseases[110]. Although these studies did not include predicting ST, one could speculate that pre-training on transcriptomic data might enhance downstream diagnostic tasks.
Beyond diagnostic classification, in silico ST could aid patient stratification and outcome prediction. The GHIST study, for instance, demonstrated that spatial metrics derived from predicted single-cell ST, such as the spatial colocalisation of cell types or gene autocorrelation–had stronger survival associations than bulk RNA-seq features[14]. Spatial relationships between immune and tumour cells, already known to predict prognosis and therapy response, could be captured more robustly through predicted ST. Similar principles could extend to inflammatory and autoimmune diseases, where, for example, lymphocyte distribution can be prognostic. By identifying drug-target or resistance-related markers, ST models could ultimately inform precision treatment decisions and pre-emptive therapeutic escalation.
Recently, in silico ST and histology have been integrated with large language models and AI agents to provide natural language reasoning and generate histopathology reports. Following the publication of CellWhisperer[111], a chatbot that allows users to interrogate single-cell gene expression data with natural language, SpotWhisperer[112] additionally integrated H&E images and in silico ST, allowing users to use natural language to query histopathology slides to identify gene expression patterns and key morphological structures. Furthermore, a recent multi-modal model, spEMO, integrated H&E foundation models, large language models, and in silico ST to generate transcriptomics-informed histopathology reports, effectively acting as a histology “copilot”[113].
Ultimately, in silico ST holds promise as both a research accelerator and a future clinical adjunct. While substantial progress is still needed in model generalisability, benchmarking, and uncertainty quantification, continued convergence of large-scale datasets, foundation models, and multi-modal integration points toward a future where virtual molecular profiling becomes an integral component of pathology and translational research.
10. Challenges and Future Directions
Several key questions remain before ST prediction can become a robust research or clinical tool. So far, the field has largely framed ST prediction as a general machine learning problem, optimising models to maximise average prediction accuracy across broad gene sets, despite overall performance remaining modest. However, biological and clinical value of predicting every measured gene is questionable. Instead, future models should be developed with specific downstream applications in mind. For example, a model that accurately predicts a small number of clinically relevant biomarkers may ultimately prove more useful than one achieving higher performance across thousands of highly variable genes. Aligning prediction objectives with biological or clinical questions, rather than broad benchmark metrics, is therefore likely to yield greater translational impact.
This also requires a better understanding of the biological limits of H&E-based prediction. Which genes, pathways, and cell states are intrinsically predictable from morphology, and which are not? To what extent are current models predicting cell identity, tissue composition, or genuine molecular states? Because models have largely been optimised against broad gene-level correlation metrics, relatively little effort has been devoted to understanding which biological features are actually recoverable from histology. Most commonly used prediction targets, such as highly variable or spatially variable genes, are themselves strongly associated with broad tissue architecture, making it unclear whether current models can distinguish finer-grained biological variation, such as rare cell populations or functional differences within the same cell type. For example, in predicting cancer immunotherapy response, can H&E distinguish exhausted vs. cytotoxic T-cell states in tumours, or is it primarily predicting the presence of T cells through broad CD3-associated signals? Answering these questions will help define realistic performance ceilings and focus future efforts on biologically tractable prediction tasks, rather than attempting to predict the entire transcriptome.
To date, most research has focused on improving ST prediction models themselves, while comparatively little attention has been given to understanding where these models provide meaningful biological or clinical value. Outside of recent successes such as Path2Space[63] which demonstrated large-scale virtual molecular profiling in breast cancer, few studies have explored downstream applications beyond proof-of-concept prediction. Identifying the most useful prediction targets therefore remains a major open question. Robust prediction of relatively simple features, such as selected diagnostic biomarkers, cell types, or tissue domains, may already be sufficient for many pathology applications. More ambitious applications, such as patient stratification, treatment response prediction, or explainable prognostic models, may benefit from using ST-derived features as biologically interpretable intermediate labels rather than relying directly on H&E images. Indeed, more accurate ST prediction offers a scalable means of generating molecularly informed labels for otherwise unannotated large-scale histology datasets, which could open opportunities for the development of many explainable digital pathology models. Whether these predicted molecular and cellular features can also drive biological discovery by generating testable hypotheses about disease mechanisms remains an exciting and largely unexplored direction. Beyond current applications in oncology, ST predictions could be applied to study tissue development and regeneration, inflammatory and autoimmune diseases, fibrosis, ageing, host-pathogen interactions–areas where large collections of H&E images exist but molecular profiling remains limited.
Future progress will likely depend primarily on better data. Thus far, the largest improvements in prediction performance have come from improvements in training data and histology foundation models. While broad pan-tissue H&E-ST collections, such as HEST-1k, ST-bank, and STimage, are highly valuable for developing broadly generalisable models, accurate ST prediction is likely to depend on deep, disease-specific cohorts containing sufficient patient numbers, biological heterogeneity, and multi-centre variation. This is particularly important for clinically relevant applications, where the objective is rarely to generalise across organs but rather to robustly predict molecular states within a specific disease. ST prediction has rapidly evolved from proof-of-concept studies to a diverse field spanning multiple spatial platforms, modelling strategies, and applications. This review argues that future progress will depend less on increasingly complex architectures than on larger and more diverse datasets, biologically meaningful prediction tasks, and rigorous evaluation frameworks. Rather than replacing experimental ST, in silico ST is likely to complement it by extending molecular analyses to the vast collections of existing H&E images, creating new opportunities for biological discoveries and digital pathology.
Acknowledgements
K.X. gratefully acknowledges scholarship support from the Clarendon Fund and the Radcliffe Department of Medicine Studentship.
Authors contribution
Xu K, Antanaviciute A: Conceptualization, methodology, writing-original draft, writing-review & editing.
Koohy H: Writing-review & editing.
Conflicts of interest
The authors declare no conflicts of interest.
Ethical approval
Not applicable.
Consent to participate
Not applicable.
Consent for publication
Not applicable.
Availability of data and materials
All quantitative summaries and literature-derived timelines presented in Figure 3, Figure 4, Figure 5, Table 1, and Table 2 were manually extracted from the cited publications and public repository records, primarily GEO. No original experimental, clinical, or patient-level data were generated for this review. For studies using internal or otherwise non-public datasets, only the sample information reported in the corresponding publications was used. The data that support the findings of this study are available from the corresponding author upon reasonable request.
Funding
This work was supported by the Wellcome Trust (Grant No. 315684/Z/24/Z to A. A).
Copyright
© The Author(s) 2026.
References
-
1. Moses L, Pachter L. Museum of spatial transcriptomics. Nat Methods. 2022;19(5):534-546.[DOI]
-
8. Winter D, Vonficht D, Le Bescond L, Gebbe C, Rosati M, Chen RJ, et al. Data-efficient multimodal alignment for histopathology-based molecular prediction. arXiv [Preprint]. 2026.[DOI]
-
9. Maan H, Ji Z, Sicheri E, Tan TJ, Selega A, Gonzalez R, et al. Multi-modal disentanglement of spatial transcriptomics and histopathology imaging. bioRxiv [Preprint]. 2025.[DOI]
-
10. Chelebian E, Avenel C, Wählby C. Combining spatial transcriptomics with tissue morphology. Nat Commun. 2025;16:4452.[DOI]
-
13. Jaume G, Doucet P, Song A, Lu M, Almagro-Pérez C, Wagner S, et al. HEST-1k: A dataset for spatial transcriptomics and histology image analysis. In: Advances in Neural Information Processing Systems 37; 2024 Dec 10-15; Vancouver, Canada. La Jolla: Neural Information Processing Systems Foundation, Inc.; 2024. p. 53798-53833.[DOI]
-
14. Fu X, Cao Y, Bian B, Wang C, Graham D, Pathmanathan N, et al. Spatial gene expression at single-cell resolution from histology using deep learning with GHIST. Nat Methods. 2025;22(9):1900-1910.[DOI]
-
17. He B, Bergenstråhle L, Stenbeck L, Abid A, Andersson A, Borg Å, et al. Integrating spatial gene expression and breast tumour morphology via deep learning. Nat Biomed Eng. 2020;4(8):827-834.[DOI]
-
20. Monjo T, Koido M, Nagasawa S, Suzuki Y, Kamatani Y. Efficient prediction of a spatial transcriptomics profile better characterizes breast cancer tissue sections without costly experimentation. Sci Rep. 2022;12:4133.[DOI]
-
24. Coutant A, Cockenpot V, Muller L, Degletagne C, Pommier R, Tonon L, et al. Spatial transcriptomics reveal pitfalls and opportunities for the detection of rare high-plasticity breast cancer subtypes. Lab Invest. 2023;103(12):100258.[DOI]
-
25. Mo CK, Liu J, Chen S, Storrs E, Targino da Costa ALN, Houston A, et al. Tumour evolution and microenvironment interactions in 2D and 3D space. Nature. 2024;634(8036):1178-1186.[DOI]
-
26. Tan X, Mulay O, Xie J, MacDonald S, Kim T, Zhou C, et al. Robust and interpretable prediction of gene markers and cell types from spatial transcriptomics data. Nat Commun. 2026;17:1781.[DOI]
-
31. Chen WT, Lu A, Craessaerts K, Pavie B, Sala Frigerio C, Corthout N, et al. Spatial transcriptomics and in situ sequencing to study Alzheimer's disease. Cell. 2020;182(4):976-991.e19.[DOI]
-
34. Nonchev K, Dawo S, Silina K, Moch H, Andani S, Tumor Profiler Consortium, et al. DeepSpot: Leveraging spatial context for enhanced spatial transcriptomics prediction from H&E images. medRxiv [Preprint]. 2025.[DOI]
-
35. Raghubar AM, Matigian NA, Crawford J, Francis L, Ellis R, Healy HG, et al. High risk clear cell renal cell carcinoma microenvironments contain protumour immunophenotypes lacking specific immune checkpoints. npj Precis Oncol. 2023;7:88.[DOI]
-
36. Lake BB, Menon R, Winfree S, Hu Q, Melo Ferreira R, Kalhor K, et al. An atlas of healthy and injured cell states and niches in the human kidney. Nature. 2023;619(7970):585-594.[DOI]
-
39. Gracia Villacampa E, Larsson L, Mirzazadeh R, Kvastad L, Andersson A, Mollbrink A, et al. Genome-wide spatial expression profiling in formalin-fixed tissues. Cell Genom. 2021;1(3):100065.[DOI]
-
42. Gao R, Yuan X, Ma Y, Wei T, Johnston L, Shao Y, et al. Harnessing TME depicted by histological images to improve cancer prognosis through a deep learning system. Cell Rep Med. 2024;5(5):101536.[DOI]
-
44. Zhan G, Du X, Liu J, Li Y, Lin L, Li J, et al. STFormer: Learning to explore spot relationships for spatial transcriptomics prediction from histology of colorectal cancer. In: 2024 46th annual international conference of the IEEE engineering in medicine and biology society (EMBC); 2024 Jul 15-19; Orlando, USA. Piscataway: IEEE; 2024. p. 1-4.[DOI]
-
45. Oliveira MF, Romero JP, Chung M, Williams S, Gottscho AD, Gupta A, et al. Characterization of immune cell populations in the tumor microenvironment of colorectal cancer using high-definition spatial profiling. bioRxiv [Preprint]. 2024.[DOI]
-
48. Ratz M, von Berlin L, Larsson L, Martin M, Westholm JO, La Manno G, et al. Clonal relations in the mouse brain revealed by single-cell and spatial transcriptomics. Nat Neurosci. 2022;25(3):285-294.[DOI]
-
50. Vicari M, Mirzazadeh R, Nilsson A, Shariatgorji R, Bjärterot P, Larsson L, et al. Spatial multimodal analysis of transcriptomes and metabolomes in tissues. Nat Biotechnol. 2024;42(7):1046-1050.[DOI]
-
51. Crunch Lab. Part 1 autoimmune disease machine learning challenge. Available from: https://hub.crunchdao.com/competitions/broad-1
-
52. Baek S, Song K, Lee I. Single-cell foundation models: Bringing artificial intelligence into cell biology. Exp Mol Med. 2025;57(10):2169-2181.[DOI]
-
55. Han M, Yang D, Cheng J, Zhang X, Chen Z, Kuang H, et al. Towards unified molecule-enhanced pathology image representation learning via integrating spatial transcriptomics. Pattern Recognit. 2026;172:112458.[DOI]
-
57. Liu J, Eckstein M, Wang Z, Feuerhake F, Merhof D. Spatial transcriptomics expression prediction from histopathology based on cross-modal mask reconstruction and contrastive learning. Med Image Anal. 2026;108:103889.[DOI]
-
58. Huang T, Liu T, Babadi M, Ying R, Jin W. STPath: A generative foundation model for integrating spatial transcriptomics and whole-slide images. npj Digit Med. 2025;8:659.[DOI]
-
59. Zhu S, Zhu Y, Tao M, Qiu P. Diffusion generative modeling for spatially resolved gene expression inference from histology images. arXiv [Preprint]. 2025.[DOI]
-
60. CZI Cell Science Program, Abdulla S, Aevermann B, Assis P, Badajoz S, Bell SM, et al. CZ CELLxGENE Discover: A single-cell data platform for scalable exploration, analysis and modeling of aggregated data. Nucleic Acids Res. 2025;53(D1):D886-D900.[DOI]
-
61. Chung Y, Ha JH, Im KC, Lee JS. Accurate spatial gene expression prediction by integrating multi-resolution features. In: 2024 IEEE/CVF Conference on Computer Vision and Pattern Recognition (CVPR); 2024 Jun 16-22; Seattle, USA. Piscataway: IEEE; 2024. p. 11591-11600.[DOI]
-
62. Xie R, Pang K, Chung SW, Perciani CT, MacParland SA, Wang B, et al. Spatially resolved gene expression prediction from H&E histology images via bi-modal contrastive learning. In: Advances in Neural Information Processing Systems 36; 2023 Dec 10-16; New Orleans, USA. San Diego: Neural Information Processing Systems Foundation, Inc; 2023. p. 70626-70637.[DOI]
-
63. Shulman ED, Campagnolo EM, Lodha R, Chung Y, Stemmer A, Cantore T, et al. AI-predicted spatial transcriptomics unlocks breast cancer biomarkers from pathology. Cell. 2026;189(14):4225-4240.E25.[DOI]
-
65. Mejia G, Cárdenas P, Ruiz D, Castillo A, Arbeláez P. SEPAL: Spatial gene expression prediction from local graphs. In: 2023 IEEE/CVF International Conference on Computer Vision Workshops (ICCVW); 2023 Oct 2-6; Paris, France. Piscataway: IEEE; 2023. p. 2286-2295.[DOI]
-
66. Ludington L, Ouardini K, Secheresse X, Loeb R, Pignet A, Domingues OD, et al. Comprehensive benchmarking of batch integration methods for spatial transcriptomics using a large-scale cancer atlas. bioRxiv [Preprint]. 2026.[DOI]
-
67. Zhang Y, Hou Q. Towards a better understanding of batch effects in spatial transcriptomics: Definition and method evaluation. bioRxiv [Preprint]. 2025.[DOI]
-
70. Li S, Lücken M, Marioni JC, Teichmann SA, He P. Toward informed batch correction for single-cell transcriptome integration. Nat Comput Sci. 2026;6(2):123-133.[DOI]
-
71. Grases D, Porta-Pardo E. A practical guide to spatial transcriptomics: Lessons from over 1000 samples. Trends Biotechnol. 2026;44(5):1230-1242.[DOI]
-
72. Wang H, Du X, Liu J, Ouyang S, Chen YW, Lin L. M2ORT: Many-to-one regression transformer for spatial transcriptomics prediction from histopathology images. arXiv [Preprint]. 2024.[DOI]
-
73. Jiang Y, Xie J, Tan X, Ye N, Nguyen Q. Generalization of deep learning models for predicting spatial gene expression profiles using histology images: a breast cancer case study. bioRxiv [Preprint]. 2023.[DOI]
-
74. Wang C, Chan AS, Fu X, Ghazanfar S, Kim J, Patrick E, et al. Benchmarking the translational potential of spatial gene expression prediction from histology. Nat Commun. 2025;16:1544.[DOI]
-
75. Deng J, Dong W, Socher R, Li LJ, Li K, Li FF. ImageNet: A large-scale hierarchical image database. In: 2009 IEEE Conference on Computer Vision and Pattern Recognition; 2009 Jun 20-25; Miami, USA. Piscataway: IEEE; 2009. p. 248-255.[DOI]
-
76. Zhao Y, Alizadeh E, Liu Y, Xu M, Mahoney JM, Li S. Abstract LB087: Inferring single-cell spatial gene expression with tissue morphology via explainable deep learning. Cancer Res. 2025;85(8_Supplement_2):LB087.[DOI]
-
79. Filiot A, Ghermi R, Olivier A, Jacob P, Fidon L, Camara A, et al. Scaling self-supervised learning for histopathology with masked image modeling. medRxiv [Preprint]. 2023.[DOI]
-
81. Lu MY, Chen B, Williamson DFK, Chen RJ, Liang I, Ding T, et al. A visual-language foundation model for computational pathology. Nat Med. 2024;30(3):863-874.[DOI]
-
83. Zimmermann E, Vorontsov E, Viret J, Casson A, Zelechowski M, Shaikovski G, et al. Virchow2: Scaling self-supervised mixed magnification models in pathology. arXiv [Preprint]. 2024.[DOI]
-
84. Saillard C, Jenatton R, Llinares-López F, Mariet Z, Cahané D, Durand E, et al. H-optimus-0. 2024. Available from: https://github.com/bioptimus/releases/tree/main/models/h-optimus/v0
-
85. Shi Z, Zhu F, Min W. Inferring multi-slice spatially resolved gene expression from H&E-stained histology images with STMCL. Methods. 2025;234:187-195.[DOI]
-
86. Rahaman MM, Millar EKA, Meijering E. Breast cancer histopathology image-based gene expression prediction using spatial transcriptomics data and deep learning. Sci Rep. 2023;13:13604.[DOI]
-
87. Li W, Zhang D, Peng E, Shen S, Alinejad-Rokny H, Liu Y, et al. HiST: Histological images reconstruct tumor spatial transcriptomics via MultiScale fusion deep learning. Adv Sci. 2026;13(13):e14351.[DOI]
-
89. Huang T, Liu T, Babadi M, Jin W, Ying R. Scalable generation of spatial transcriptomics from histology images via whole-slide flow matching. arXiv [Preprint]. 2025.[DOI]
-
91. Hoang DT, Dinstag G, Shulman ED, Hermida LC, Ben-Zvi DS, Elis E, et al. A deep-learning framework to predict cancer treatment response from histopathology images through imputed transcriptomics. Nat Cancer. 2024;5(9):1305-1317.[DOI]
-
92. Ahsan MA, Hanley KP, Fergie M, O'Leary C, Borst G, Roncaroli F, et al. DeepPathway: Predicting pathway expression from histopathology images. bioRxiv [Preprint]. 2025.[DOI]
-
94. Cui H, Wang C, Maan H, Pang K, Luo F, Duan N, et al. scGPT: Toward building a foundation model for single-cell multi-omics using generative AI. Nat Methods. 2024;21(8):1470-1480.[DOI]
-
95. Kedzierska KZ, Crawford L, Amini AP, Lu AX. Zero-shot evaluation reveals limitations of single-cell foundation models. Genome Biol. 2025;26(1):101.[DOI]
-
96. Gindra RH, Palla G, Nguyen M, Wagner SJ, Tran M, Theis FJ, et al. A large-scale benchmark of cross-modal learning for histology and gene expression in spatial transcriptomics. In: 2025 IEEE/CVF International Conference on Computer Vision Workshops (ICCVW); 2025 Oct 19-20; Honolulu, USA. Piscataway: IEEE; 2025. p. 1193-1203.[DOI]
-
98. Pang M, Su K, Li M. Leveraging information in spatial transcriptomics to predict super-resolution gene expression from histology images in tumors. bioRxiv [Preprint]. 2021.[DOI]
-
100. Min W, Fang D, Chen J, Zhang S. Dimensionality reduction and denoising of spatial transcriptomics data using dual-channel masked graph autoencoder. bioRxiv [Preprint]. 2024.[DOI]
-
101. Dong K, Zhang S. Deciphering spatial domains from spatially resolved transcriptomics with an adaptive graph attention auto-encoder. Nat Commun. 2022;13:1739.[DOI]
-
102. Wang G, Zhao J, Yan Y, Wang Y, Wu AR, Yang C. Construction of a 3D whole organism spatial atlas by joint modelling of multiple slices with deep neural networks. Nat Mach Intell. 2023;5(11):1200-1213.[DOI]
-
105. Xiao X, Kong Y, Li R, Wang Z, Lu H. Transformer with convolution and graph-node co-embedding: An accurate and interpretable vision backbone for predicting gene expressions from local histopathological image. Med Image Anal. 2024;91:103040.[DOI]
-
106. Post CS, Cheng J, Pantanowitz L, Westerhoff M. Utility of machine learning to detect cytomegalovirus in digital hematoxylin and eosin–stained slides. Lab Invest. 2023;103(10):100225.[DOI]
-
109. Reigle J, Lopez-Nunez O, Drysdale E, Abuquteish D, Liu X, Putra J, et al. Using deep learning to automate eosinophil counting in pediatric ulcerative colitis histopathological images. medRxiv [Preprint]. 2024.[DOI]
-
111. Schaefer M, Peneder P, Malzl D, Lombardo SD, Peycheva M, Burton J, et al. Multimodal learning enables chat-based exploration of single-cell data. Nat Biotechnol. 2025.[DOI]
-
112. Schaefer M, Nonchev K, Awasthi A, Burton J, Koelzer VH, Rätsch G, et al. Molecularly informed analysis of histopathology images using natural language. bioRxiv [Preprint]. 2025.[DOI]
-
113. Liu T, Huang T, Ding T, Wu H, Humphrey P, Perincheri S, et al. Leveraging multi-modal foundation models for analysing spatial multi-omic and histopathology data. Nat Biomed Eng. 2026;10(8):1714-1731.[DOI]
-
114. Dawood M, Branson K, Rajpoot NM, Minhas FUAA. All you need is color: Image based spatial gene expression prediction using neural stain learning. In: Kamp M, Koprinska I, Bibal A, Bouadi T, Frénay B, Galárraga L, et al, editors. Machine learning and principles and practice of knowledge discovery in databases. Cham: Springer; 2021. p. 437-450.[DOI]
-
115. Kumar S, Chatterjee S. HistoSPACE: Histology-inspired spatial transcriptome prediction and characterization engine. Methods. 2024;232:107-114.[DOI]
-
116. Aresta G, Araújo T, Kwok S, Chennamsetty SS, Safwan M, Alex V, et al. BACH: Grand challenge on breast cancer histology images. Med Image Anal. 2019;56:122-139.[DOI]
-
117. Huang W, Xu M, Hu X, Abousamra S, Ganguly A, Kapse S, et al. RankByGene: Gene-guided histopathology representation learning through cross-modal ranking consistency. arXiv [Preprint]. 2024.[DOI]
-
118. Wang Q, Chen WJ, Su J, Wang G, Song Q. HECLIP: Histology-enhanced contrastive learning for imputation of transcriptomics profiles. Bioinformatics. 2025;41(7):btaf363.[DOI]
-
121. Yang Y, Hossain MZ, Stone EA, Rahman S. Exemplar guided deep neural network for spatial transcriptomics analysis of gene expression prediction. In: 2023 IEEE/CVF Winter Conference on Applications of Computer Vision (WACV); 2023 Jan 2-7. Waikoloa, USA. Piscataway: IEEE; 2023. p. 5028-5037.[DOI]
-
122. Yang Y, Hossain MZ, Stone E, Rahman S. Spatial transcriptomics analysis of gene expression prediction using exemplar guided graph neural network. Pattern Recognit. 2024;145:109966.[DOI]
-
124. Ciga O, Xu T, Martel AL. Self supervised contrastive learning for digital histopathology. Mach Learn Appl. 2022;7:100198.[DOI]
-
125. Chen C, Zhang Z, Tang P, Liu X, Huang B. Edge-relational window-attentional graph neural network for gene expression prediction in spatial transcriptomics analysis. Comput Biol Med. 2024;174:108449.[DOI]
-
128. Min W, Shi Z, Zhang J, Wan J, Wang C. Multimodal contrastive learning for spatial gene expression prediction using histology images. Brief Bioinform. 2024;25(6):bbae551.[DOI]
-
129. Niu Y, Liu J, Zhan Y, Shi J, Zhang D, Reinius M, et al. PH2ST: Prompt-guided hypergraph learning for spatial transcriptomics prediction in whole slide images. Med Image Anal. 2026;110:104008.[DOI]
Copyright
© The Author(s) 2026. This is an Open Access article licensed under a Creative Commons Attribution 4.0 International License (https://creativecommons.org/licenses/by/4.0/), which permits unrestricted use, sharing, adaptation, distribution and reproduction in any medium or format, for any purpose, even commercially, as long as you give appropriate credit to the original author(s) and the source, provide a link to the Creative Commons license, and indicate if changes were made.
Publisher’s Note
Science Exploration remains a neutral stance on jurisdictional claims in published
maps
and institutional affiliations. The views expressed in this article are solely those
of
the author(s) and do not reflect the opinions of the Editors or the publisher.
Share And Cite


Science Exploration Style
Xu K, Koohy H, Antanaviciute A. Predicting spatial transcriptomics from histology images: Progress, challenges, and directions. EXO. 2026;1:202619. https://doi.org/10.70401/EXO.2026.0020
Tips
Copy completed.
Submit a Manuscript
Author Instructions
Cite this Article
Article Metrics
0
View
0
Download
Cited
Article Updates

- Abstract
- Keywords
- 1. Introduction
- 2. Assumptions Behind ST Prediction Models
- 3. ST Data Ecosystem
- 4. ST Data Pre-processing Strategies
- 5. Model Architectures and Representation
- 6. Model Performance
- 7. Alternative Prediction Targets
- 8. Research Applications
- 9. Clinical Applications
- 10. Challenges and Future Directions
- Acknowledgements
- Authors contribution
- Conflicts of interest
- Ethical approval
- Consent to participate
- Consent for publication
- Availability of data and materials
- Funding
- References
- Copyright
 Get citation
Science Exploration Style

Xu K, Koohy H, Antanaviciute A. Predicting spatial transcriptomics from histology images: Progress, challenges, and directions. EXO. 2026;1:202619. https://doi.org/10.70401/EXO.2026.0020
copy
Share Link
copy