Imaging thermal properties of thermal interface materials using frequency-domain thermoreflectance microscopy
Yuhan Yao
1,2

,
Haobo Yang
1
,
Ronggui Yang
1,3,*
,
Xin Qian
1,*
*Correspondence to:
Ronggui Yang, College of Mechanics and Engineering Science, Peking University, Beijing 100871, China; School of Energy and Power Engineering, Huazhong University of Science and Technology, Wuhan 430074, Hubei, China.
E-mail: ronggui@pku.edu.cn
Xin Qian, School of Energy and Power Engineering, Huazhong University of Science and Technology, Wuhan 430074, Hubei, China. E-mail: xinqian21@hust.edu.cn
Xin Qian, School of Energy and Power Engineering, Huazhong University of Science and Technology, Wuhan 430074, Hubei, China. E-mail: xinqian21@hust.edu.cn
Thermo-X. 2026;2:202612. 10.70401/tx.2026.0020
Received: March 17, 2026Accepted: June 02, 2026Published: June 02, 2026
Abstract
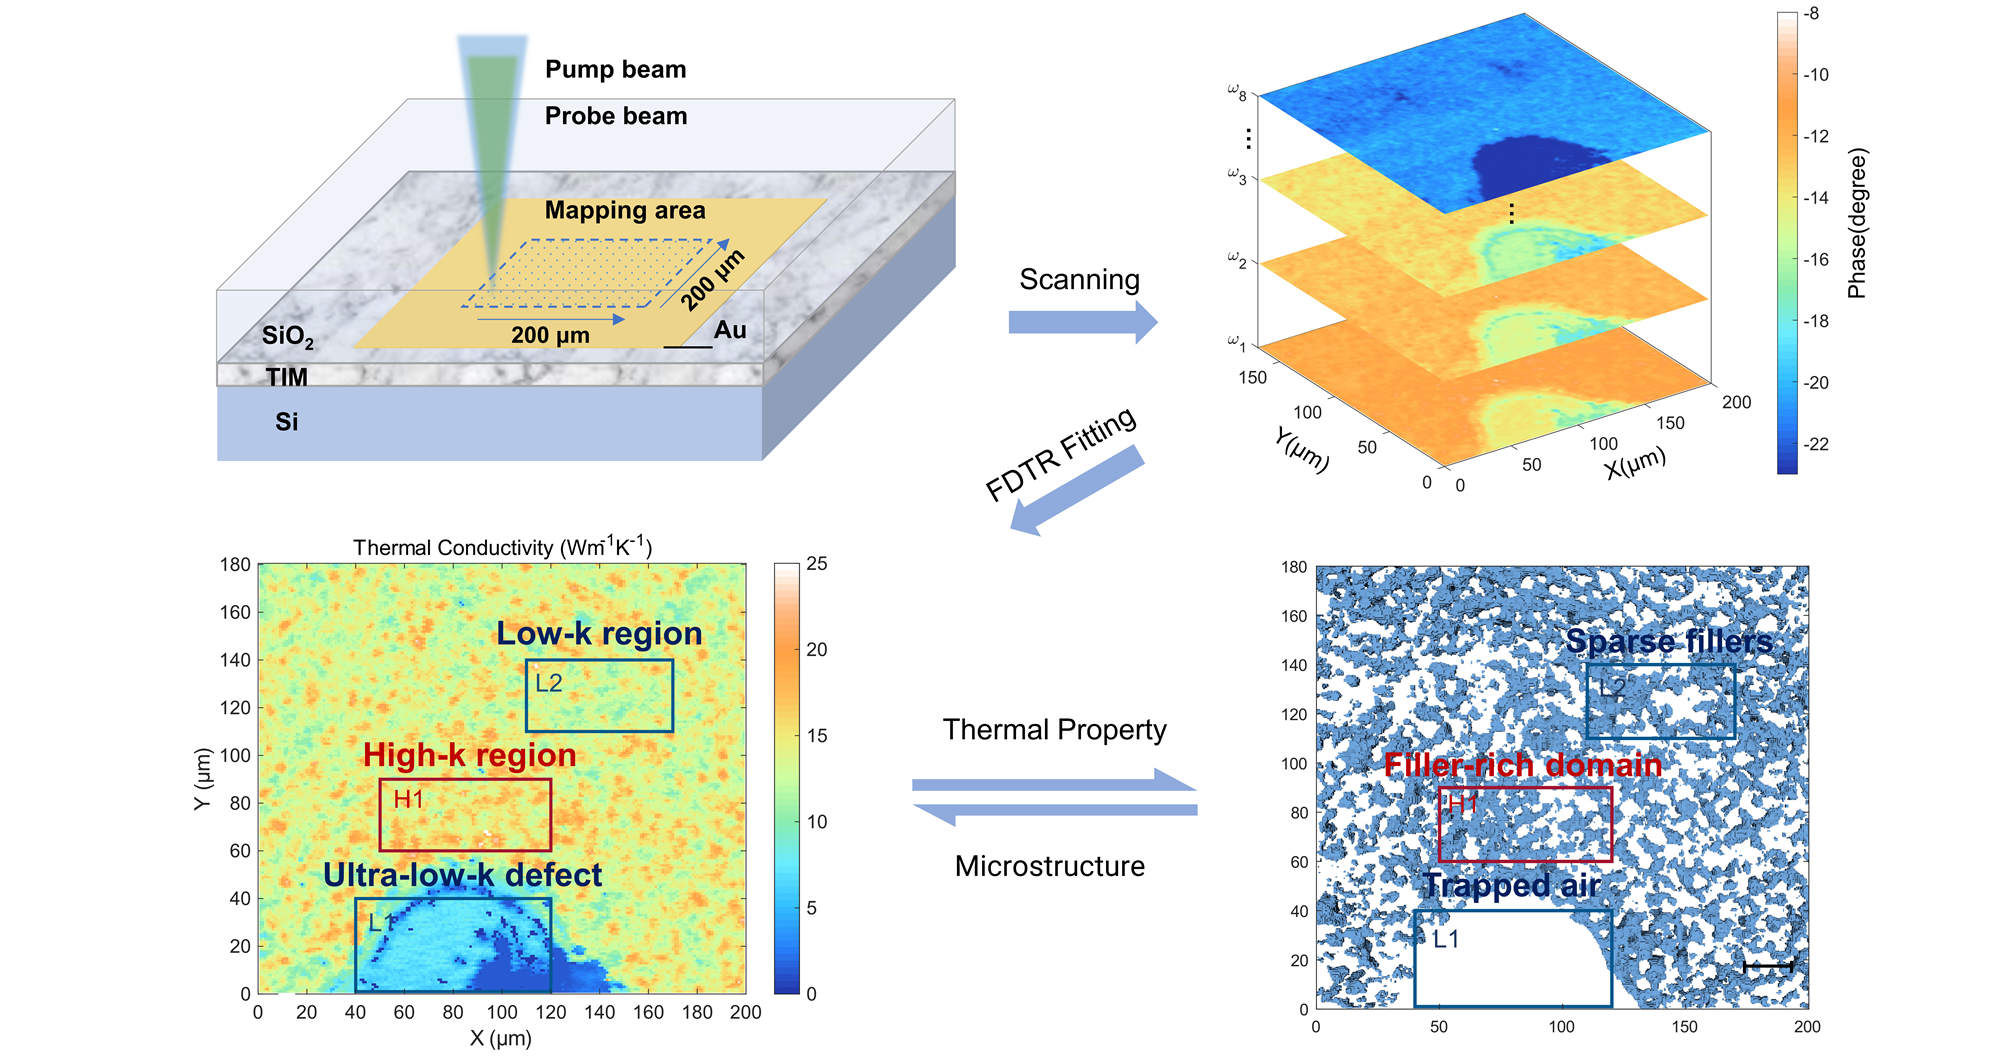
Imaging thermal properties at the microscale is crucial for unveiling the structure-property relation and developing next-generation thermal management materials. Here, we apply a frequency-domain thermoreflectance (FDTR) microscopy for imaging the thermal conductivity and interfacial thermal conductance of thermal interface materials (TIMs). A fixture customized for imaging thermal properties of TIMs is developed, where the sample is sandwiched between a silica slide coated with a metal transducer and a substrate wafer, and the thermal transport properties are extracted using a bidirectional thermal model. The thermal conductivity of TIMs loaded with thermally conductive particles is profiled with micrometer resolution, and significant local non-uniformity is observed. Pressure-dependent FDTR imaging during loading and unloading reveals the local redistribution of conductive filler particles. Correlative micro-computed tomography reveals that the high thermal conductivity regions correspond to the aggregation of thermally conductive particles. Further statistical analysis of the FDTR image unveiled the asymmetrical and long-tailed probabilistic distribution of thermal conductivity values. Through statistical modeling, we demonstrate that this asymmetry originates from the lognormal size distribution of microparticles. Our work sheds light on the structure-property relation between microstructure and thermal conductivity distribution of TIMs at the microscale.
Graphical Abstract
Keywords
Frequency-domain thermoreflectance, thermal interface materials, thermal mapping, thermal management
1. Introduction
With the increased miniaturization and performance of electronics[1-3], thermal management has become a critical issue. The local heat flux near hot spots can exceed the average heat flux by an order of magnitude[4] and induce significant thermal stress, resulting in accelerated aging and performance degradation[5]. To mitigate these challenges, thermal interface materials (TIMs) are employed to enhance the interfacial heat transport between the electronics and the heat sink[6-8]. In recent years, the thermal conductivity of TIM has been significantly enhanced through microstructure engineering strategies, such as introducing interconnected filler networks[9-12] and improving filler-matrix and filler-filler interfacial thermal transport via surface functionalization, covalent bonding[13-15], and noncovalent modifications[16-18]. Nevertheless, the lack of thermal property visualization tools has severely limited the understanding of the structure-property correspondence of TIMs with micro/nano-architectures, which is crucial for developing next-generation thermal management materials. Thermal property mapping can also serve as datasets for training machine learning models, for AI-assisted optimization and design of TIMs with superb heat transfer performance.
However, commonly used thermal metrology methods for characterizing TIMs, either the steady-state measurement based on ASTM D5470[19-21], or transient methods such as laser flash analysis[22] and photoacoustic measurements[23,24], are primarily developed to measure the overall macroscale thermal conductivity or interfacial resistances without spatial resolution. While infrared microscopy methods can image temperature maps of the cross-sections of TIMs under heating load, extracting local thermal conductivity and interfacial resistances remains a very challenging inverse problem[25,26]. Spatial thermal property mapping requires local measurements on micrometer scales. Pump-probe thermoreflectance techniques, including time-domain thermoreflectance (TDTR)[27,28] and frequency-domain thermoreflectance (FDTR)[29], rely on depositing a metal transducer layer on the sample surface, and using the pump and probe beams for laser heating and sensing of the thermoreflectance signal. TDTR and FDTR have been widely used to characterize thermal properties of bulk semiconductors[30,31], thin films[32,33], and van der Waals materials[34], as well as TIMs[35-38]. This noncontact, local heating and sensing scheme enables thermal property imaging through point-by-point scanning across the sample surface[39-41]. However, when performing thermal property imaging, the sample surface must be smooth and flat with a roughness below 10 nm and free of surface wrinkles. This is extremely hard to achieve when depositing a transducer layer on TIMs with mechanical flexibility and fluidity.
In this work, we employ FDTR microscopy to visualize the microscale thermal-property heterogeneity of particle-filled TIMs. Unlike conventional TIM measurements that yield spatially averaged thermal resistance or thermal conductivity, our approach resolves the local thermal conductivity and interfacial thermal conductance within a sandwiched TIM layer. We observed that the local thermal properties in an Al2O3/ZnO-loaded thermal grease are highly non-uniform, exhibiting clustered high-conductivity domains and localized low-conductivity defects. Correlative micro-CT imaging further demonstrates that these thermal features are closely associated with the filler architecture, specifically, filler aggregation, filler-deficient regions, and pores. We also perform pressure-dependent FDTR imaging during loading and unloading to examine how averaged thermal properties, local conductive features, and interfacial contact evolve under compression. We further performed statistical analysis of the property image and find that the thermal conductivity values deviate from the normal distribution, and instead exhibit an asymmetric long-tailed probabilistic distribution. We develop a statistical model clarifying that the asymmetry in thermal-property distribution originates from the lognormal distribution of particle size and spatial randomness of filler particles. This work extends the capability of FDTR microscopy for profiling the thermal property of thermal management materials at microscales.
2. Methods
2.1 Measurement setup
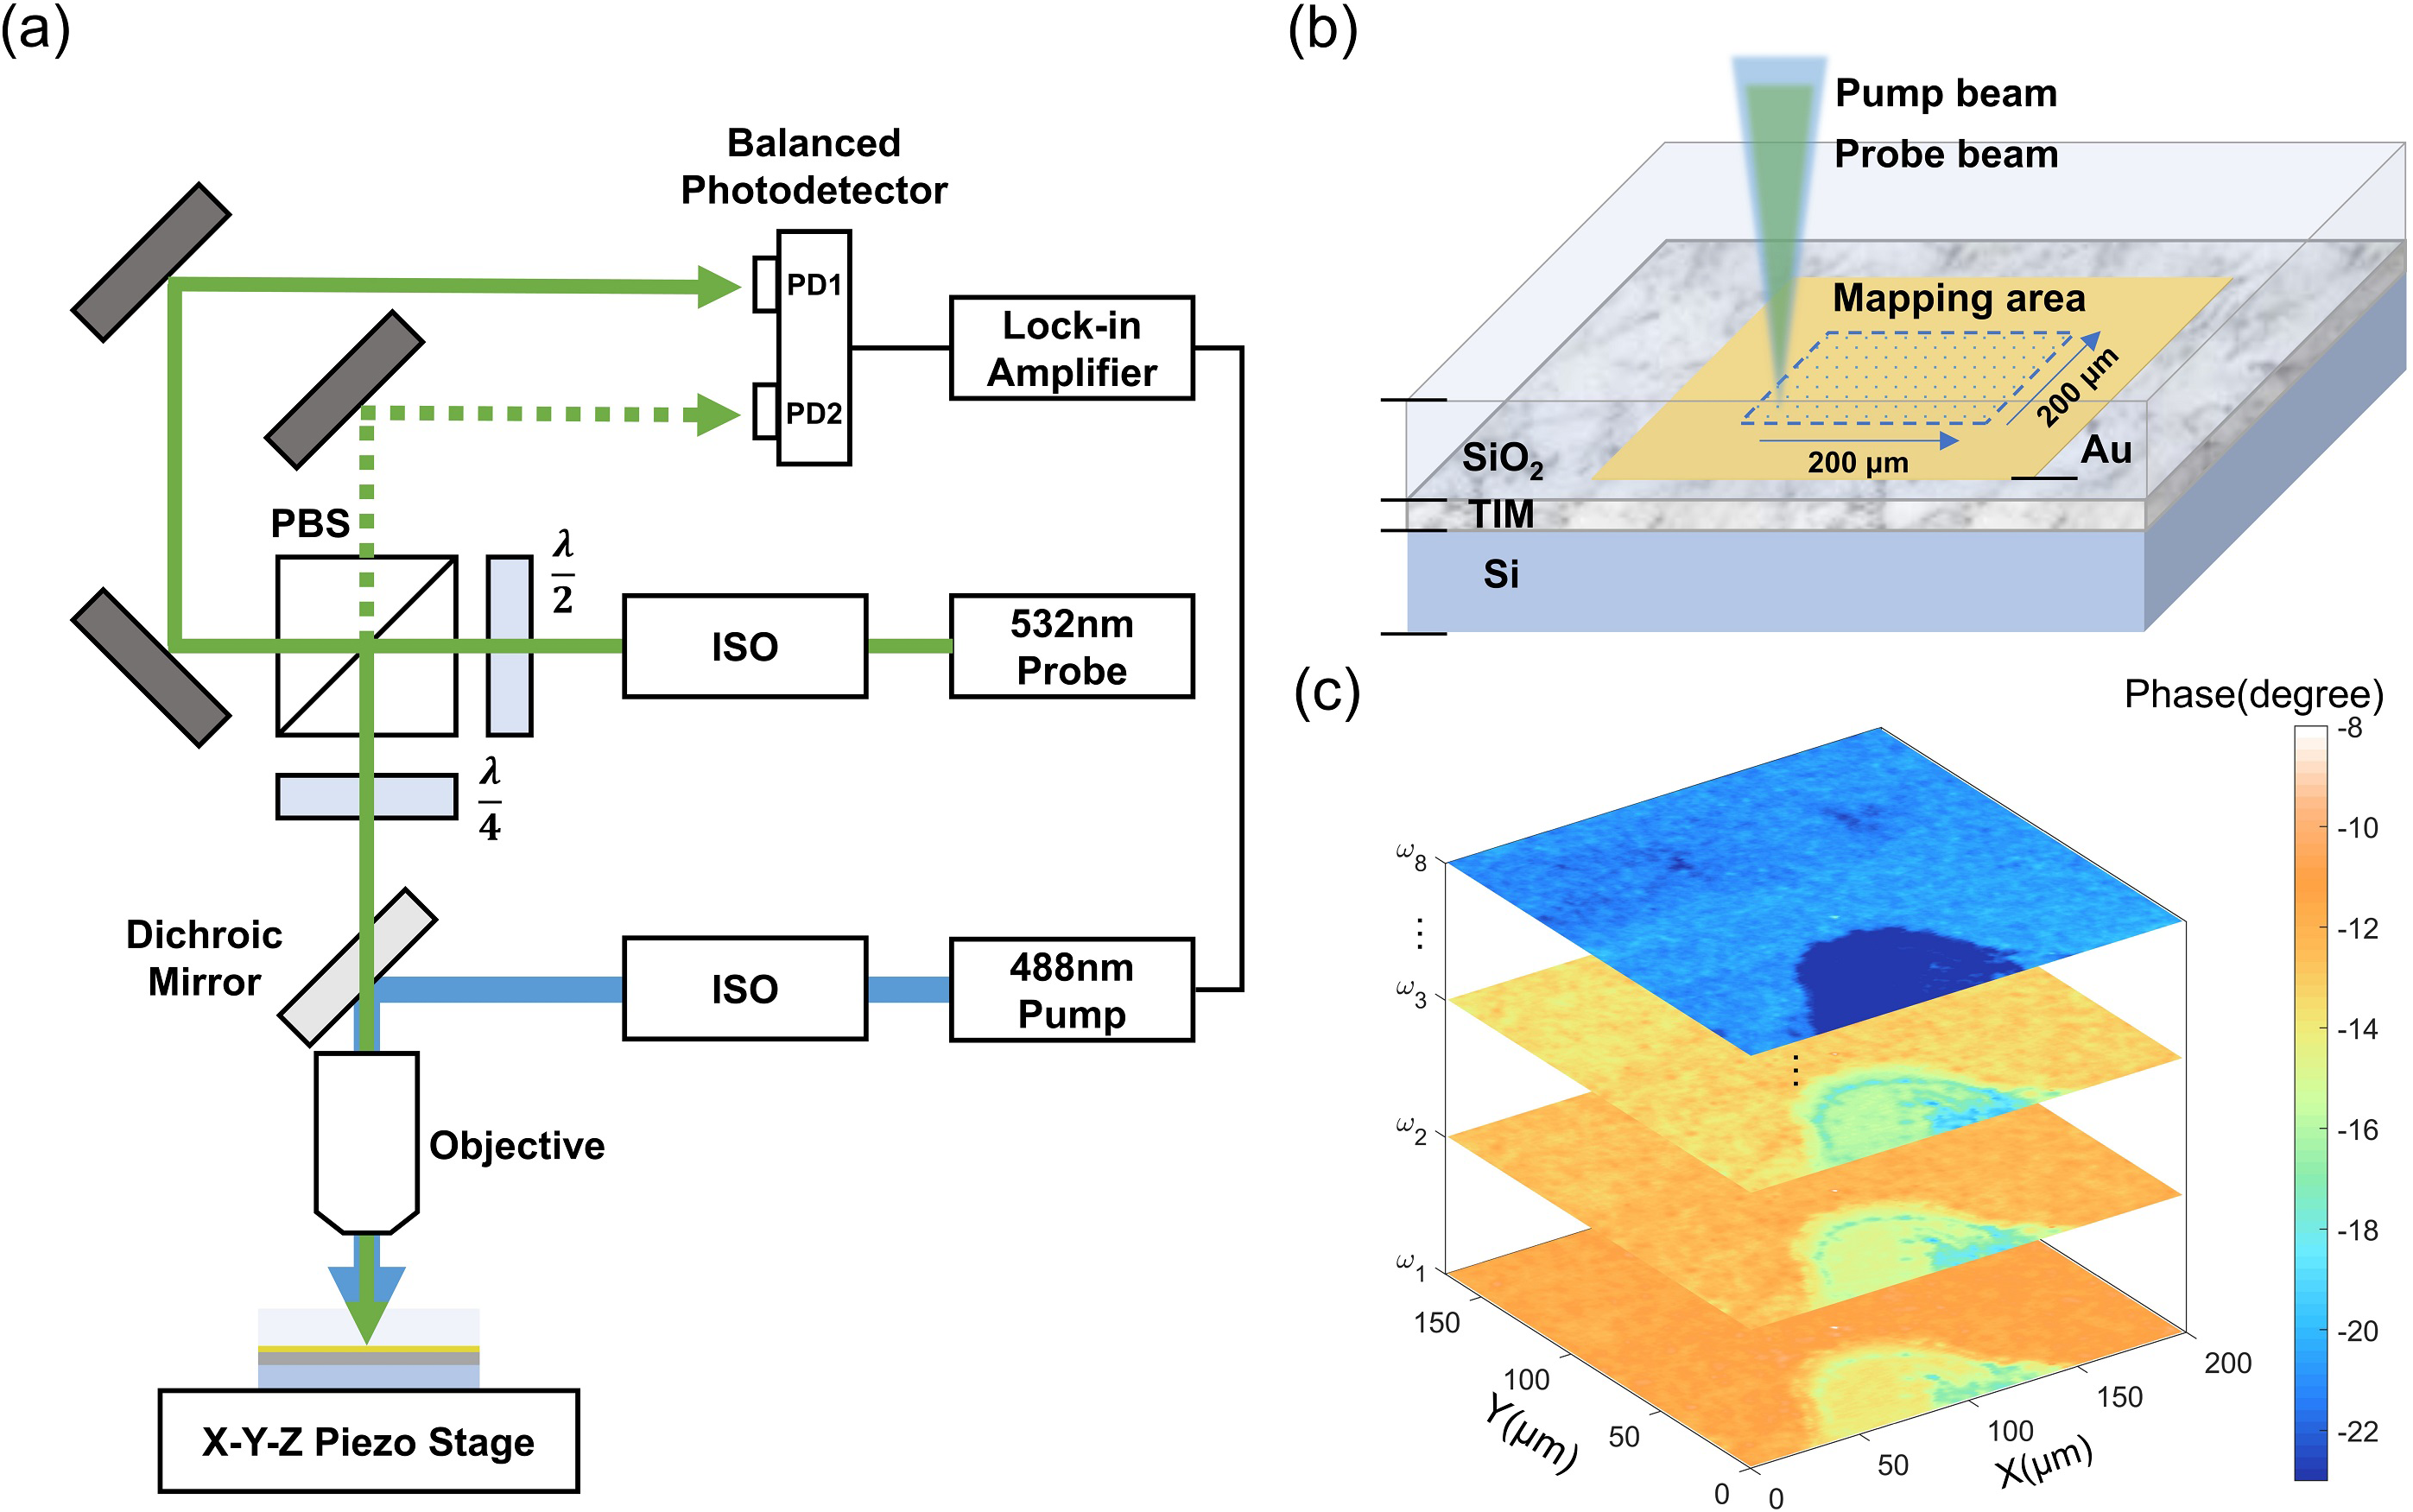
Thermal property mapping of TIMs is performed using FDTR, as illustrated in Figure 1a. In FDTR measurements, a modulated pump laser generates a diffusive thermal wave, while a probe laser captures the harmonic response from the reflected beam. The pump beam with a wavelength of 488 nm for heating the sample is modulated with a sinusoidal signal using a Zurich Instruments HF2LI lock-in amplifier. The probe beam (with a 532 nm wavelength) is coaxially aligned with the pump beam and focused on the same spot on the sample surface for detecting the thermoreflectance signal. To enhance the signal-to-noise ratio in the low-frequency regime, a balanced photodetector comprised of two well-matched photodiodes, PD1 and PD2, is used. A polarizing beamsplitter divides the probe beam into a signal path, which is focused onto and reflected from the sample toward PD1, and a reference path to PD2. By rotating a half-wave plate to balance the intensities of PD1 and PD2 and differencing their photocurrents within the detector, we effectively suppress the common-mode noise inherent in the probe laser.

Figure 1. Thermal property mapping system for TIMs. (a) Optical configuration of the FDTR scanning system; (b) Schematic of thermal property scanning and sample configuration for TIMs characterization; (c) Phase images captured at different modulation frequencies. TIMs: thermal interface materials; FDTR: frequency-domain thermoreflectance; PBS: polarizing beamsplitter; ISO: isolator.
To ensure an optically flat and smooth transducer surface, we prepare the TIM sample in a sandwich fixture, as illustrated in Figure 1b. Scanning electron microscopy (SEM) and the corresponding energy dispersive spectroscopy images reveal that the TIM consists of a polydimethylsiloxane (PDMS) matrix incorporated with micrometer-sized Al2O3 particles and ZnO nanoparticles (Figure S1). A 110 nm gold transducer film was deposited by electron-beam evaporation on a double-side-polished fused silica slide purchased from MTI Corporation (Ra < 5 Å). The gold thickness is well above 50 nm to ensure optical opacity of the transducer layer. The low roughness of the polished fused silica slide provides a smooth reflective surface for FDTR measurements. The TIM was first applied onto the silicon substrate and leveled using a doctor blade to ensure an initially uniform coating. The transducer-coated silica slide was then placed onto the TIM surface and compressed using the fixture with four spring-loaded screws. The contact pressure was estimated to be approximately 36 psi based on the force measured by a force sensor and the contact area. The bondline thickness of the TIM layer was determined to be approximately 12.8 μm from micro-CT cross-sectional images, which also confirmed that the thickness is uniform across the imaging area (Figure S2). The sample was mounted on a piezoelectric stage with a 200 μm XYZ travel range and a 1 nm stepping precision. Both the pump and probe beams are focused through the silica substrate onto the gold transducer surface. Thermal property images were generated by performing point-by-point scans across the mapping area. At each scanning location, the phase of the thermal response was recorded across eight modulation frequencies using a lock-in amplifier. The phase images captured at different modulation frequencies are shown in Figure 1c.
2.2 Local thermal property measurements
Our FDTR microscopy set-up builds the thermal property image in a pixel-by-pixel manner, and thermal properties are extracted from local frequency-sweep measurements. Different from the conventional geometry with the transducer on the top layer, the pump beam in our setup passes through the silica layer and the generated heat will propagate bidirectionally, as shown in Figure 2a. We therefore use the bidirectional thermal model[42] to extract thermal properties from FDTR signals. For each layer, the temperature rises (θ) and heat fluxes (Q) at the top and bottom surfaces are related by a thermal transfer matrix M:
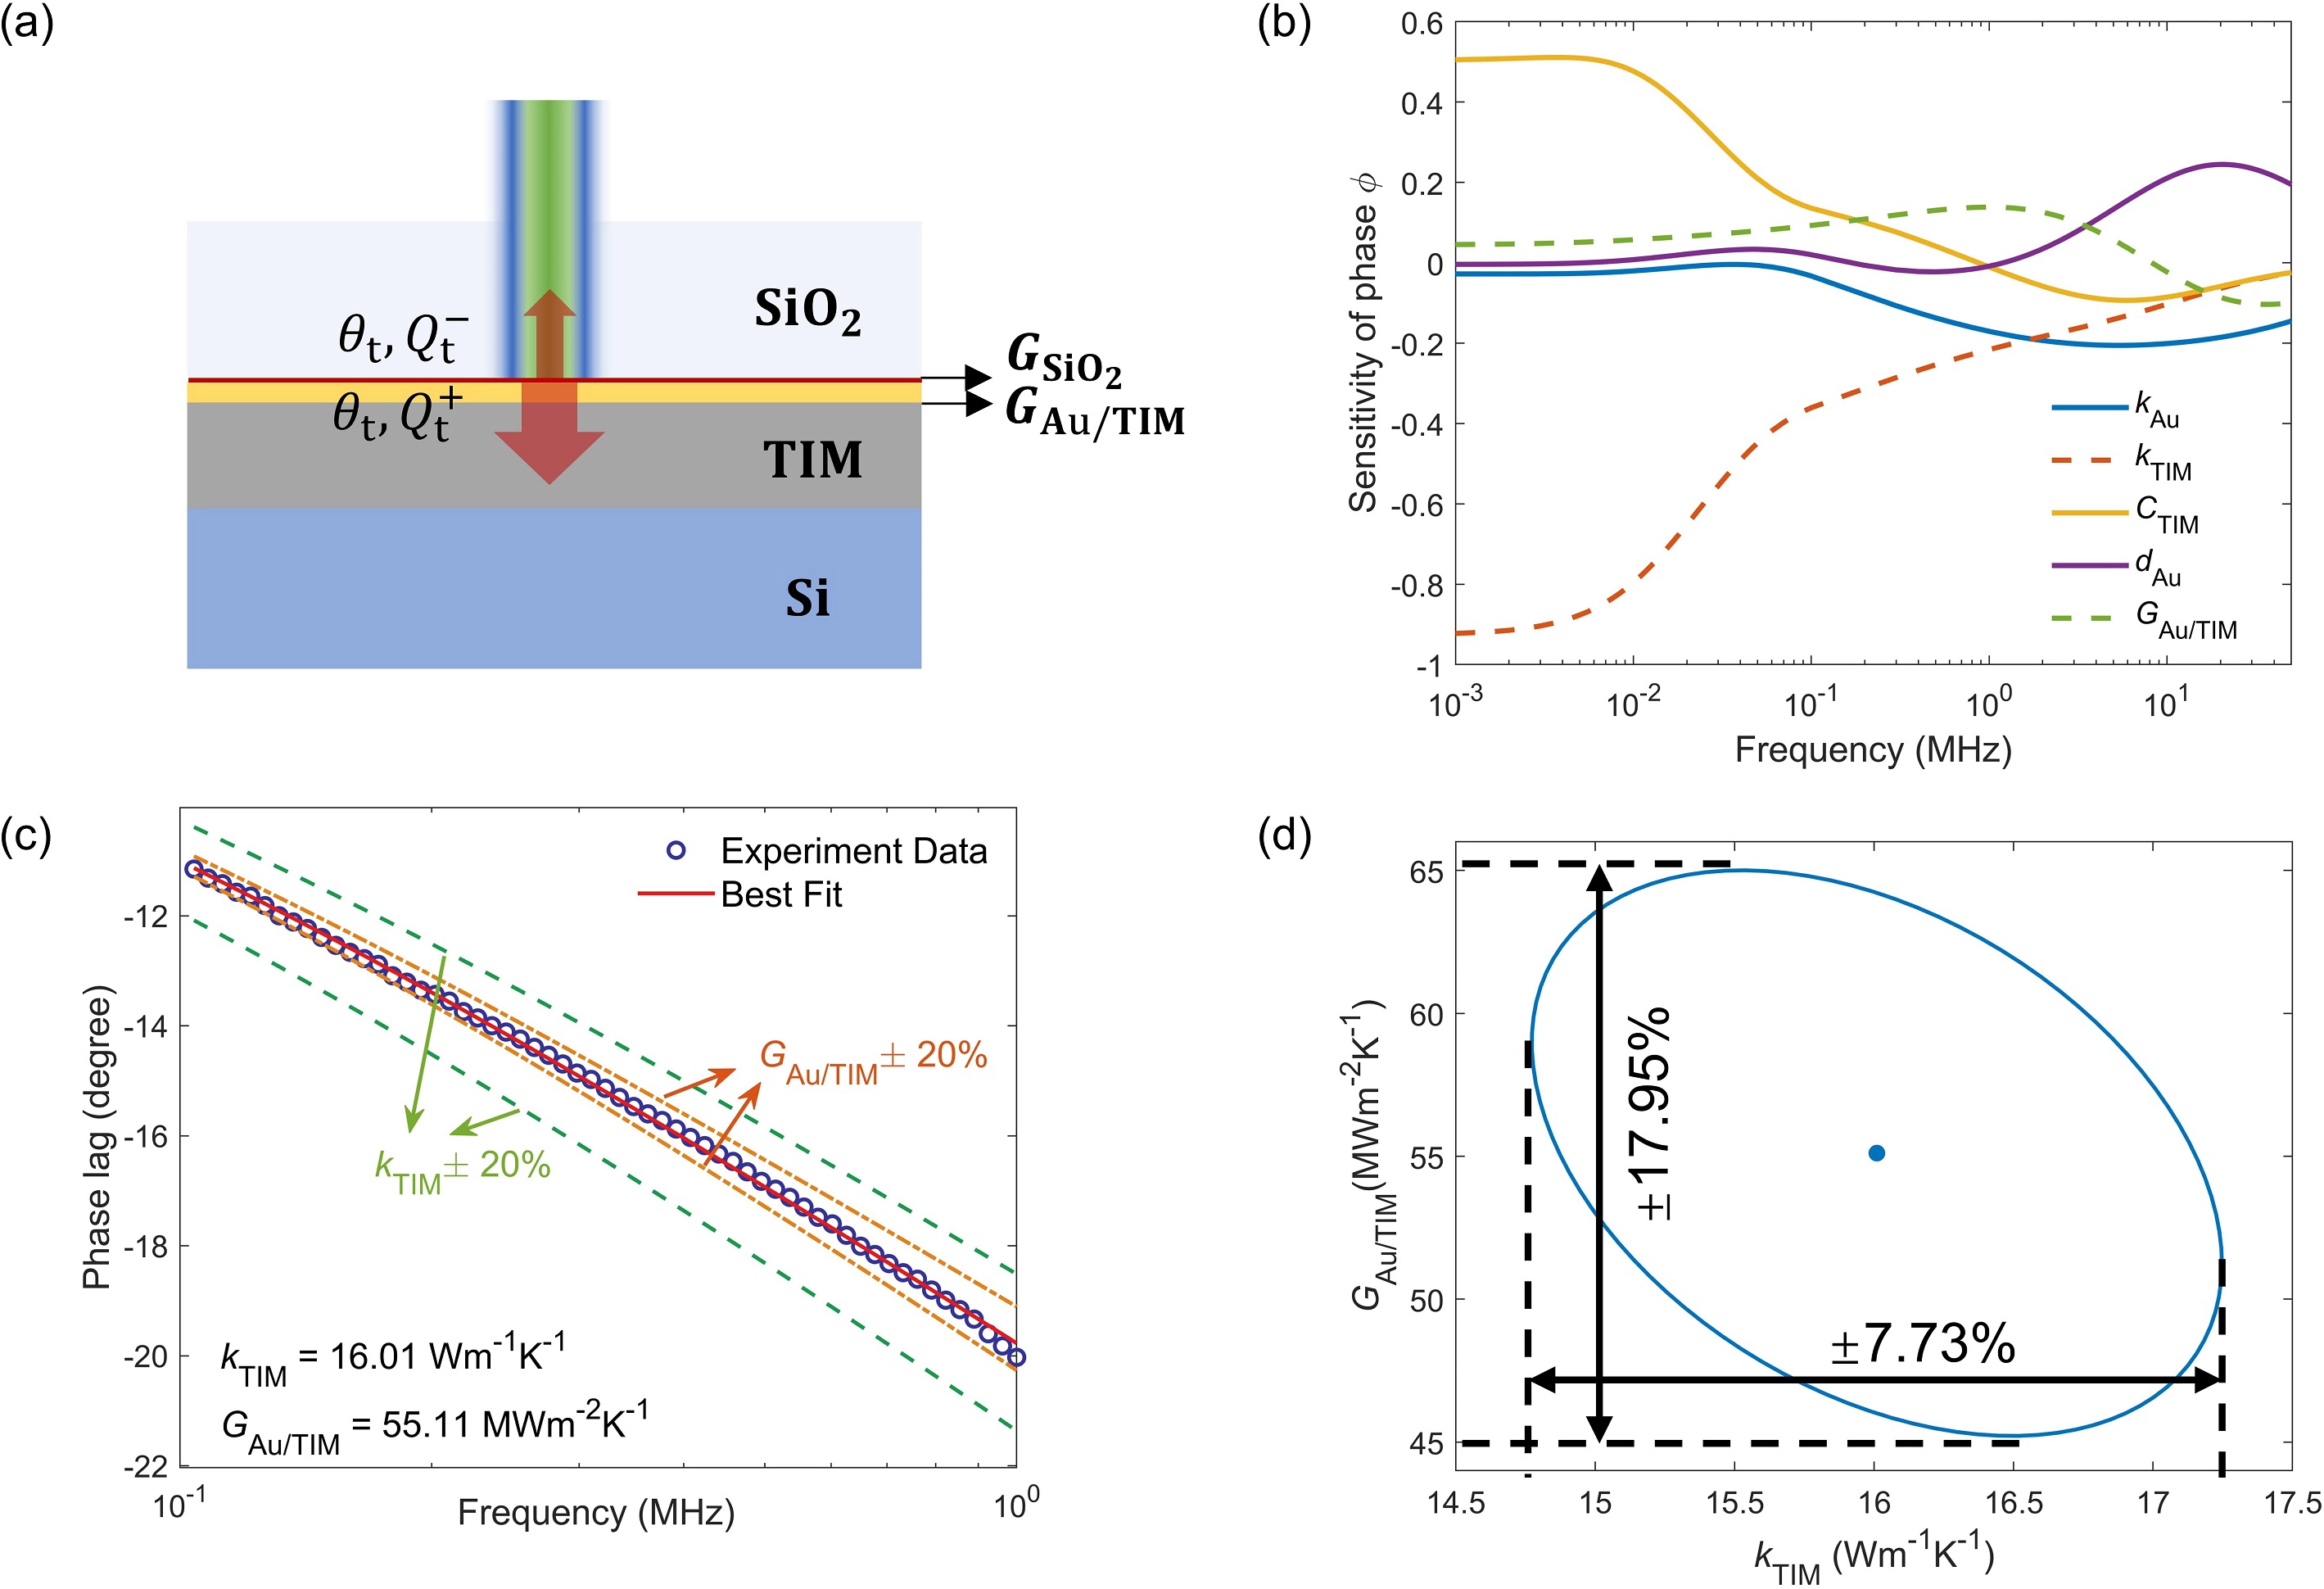
Figure 2. Single point FDTR measurement on the TIM. (a) Thermal model for bidirectional heat conduction into the TIM and the silica slide; (b) Calculated sensitivity of thermal phase ϕ to thermal properties of the TIM; (c) Frequency-sweep FDTR signal obtained on the TIM sample with the best fit value kTIM = 16.01 W m-1 K-1 and GAu/TIM = 55.11 MW m-2 K-1; (d) Confidence interval for the FDTR measurement on the TIM. FDTR: frequency-domain thermoreflectance; TIM: thermal interface material.
where the subscripts b and t represent the bottom and top surfaces, respectively; d is the thickness of the sample layer, and
where the superscript + denotes the heat flux propagating in the +z direction (downward), Mn is the transfer matrix of the n-th layer defined in Eq. (1), and Tn,n-1 is the transfer matrix of the interface between the (n-1)-th and the n-th layer:
where Gn,n-1 is the interfacial thermal conductance. Similarly, the upward heat conduction can also be written as follows:
An adiabatic boundary condition is assumed at the bottom and top surfaces of the fixture[42], therefore
which represents the thermal response to a unit point source. In FDTR measurements, both the pump and the probe beams have a Gaussian profile of intensity, and the complex thermal response function is calculated as:
where wpump and wprobe are the 1/e2 radii of the pump and probe laser spots respectively, and β is a constant proportional to the laser power, thermoreflectance coefficient, and the gain of the photodetector. The phase angle of H(ω) is typically used to extract thermal properties.
Thermal conductivity and the interfacial thermal conductance are extracted by fitting the predicted phase to the experimental phase using nonlinear least squares regression.
Figure 2b shows the sensitivity analysis of the phase signal to different thermal properties. Sensitivity is defined as the logarithmic derivative Sx = ∂lnϕ/∂lnx[45], where x denotes the fitting or input parameter in the thermal model. Parameters used to calculate the sensitivities are calibrated and listed in Table S1. The frequency-dependent sensitivities arise from the variation in sensing depth with the modulation frequency of the pump laser. While the actual sensing depth is simultaneously determined by the laser spot size and the heating frequency[46,47], our experiments are based on a fixed spot size, therefore we can use the simplified penetration length
A representative FDTR signal of the TIM sample is shown in Figure 2c. Multi-parameter fitting via least-squares minimization yields kTIM = 16.01 W m-1 K-1 and GAu/TIM = 55.11 MW m-2 K-1. An uncertainty analysis of the extracted thermal properties is performed by implementing the multivariate error propagation scheme based on the Jacobian matrix[48]. The confidence interval has an elliptical shape as shown in Figure 2d, the relative uncertainty of the thermal conductivity of the TIM kTIM is 7.73%, and that of the interfacial thermal conductance GAu/TIM is 17.95%. These results are consistent with reported values[49] and manufacturer specifications.
3. Results and Discussion
3.1 Thermal property mapping
Figure 3a,b present the mapping of thermal conductivity and interfacial conductance, respectively. The results reveal significant heterogeneity at the microscale with a randomly scattered distribution of high-thermal-conductivity regions. The area-averaged thermal conductivity calculated from our mapping is 12.97 W m-1 K-1, which is comparable to the macroscopic value of 13.64 W m-1 K-1 measured via ASTM D5470[49]. Local peak values reach nearly 20 W m-1 K-1, while in voids or defect areas within the sample, the thermal conductivity drops to approximately 0.1 W m-1 K-1. The spatial distribution of interfacial thermal conductance GTIM exhibits similar microscale heterogeneity. Regions with high thermal conductivity generally correspond to high interfacial conductance. This positive correlation occurs because local agglomerations of conductive fillers not only enhance local heat transfer but also create more effective contact points at the interface[50].
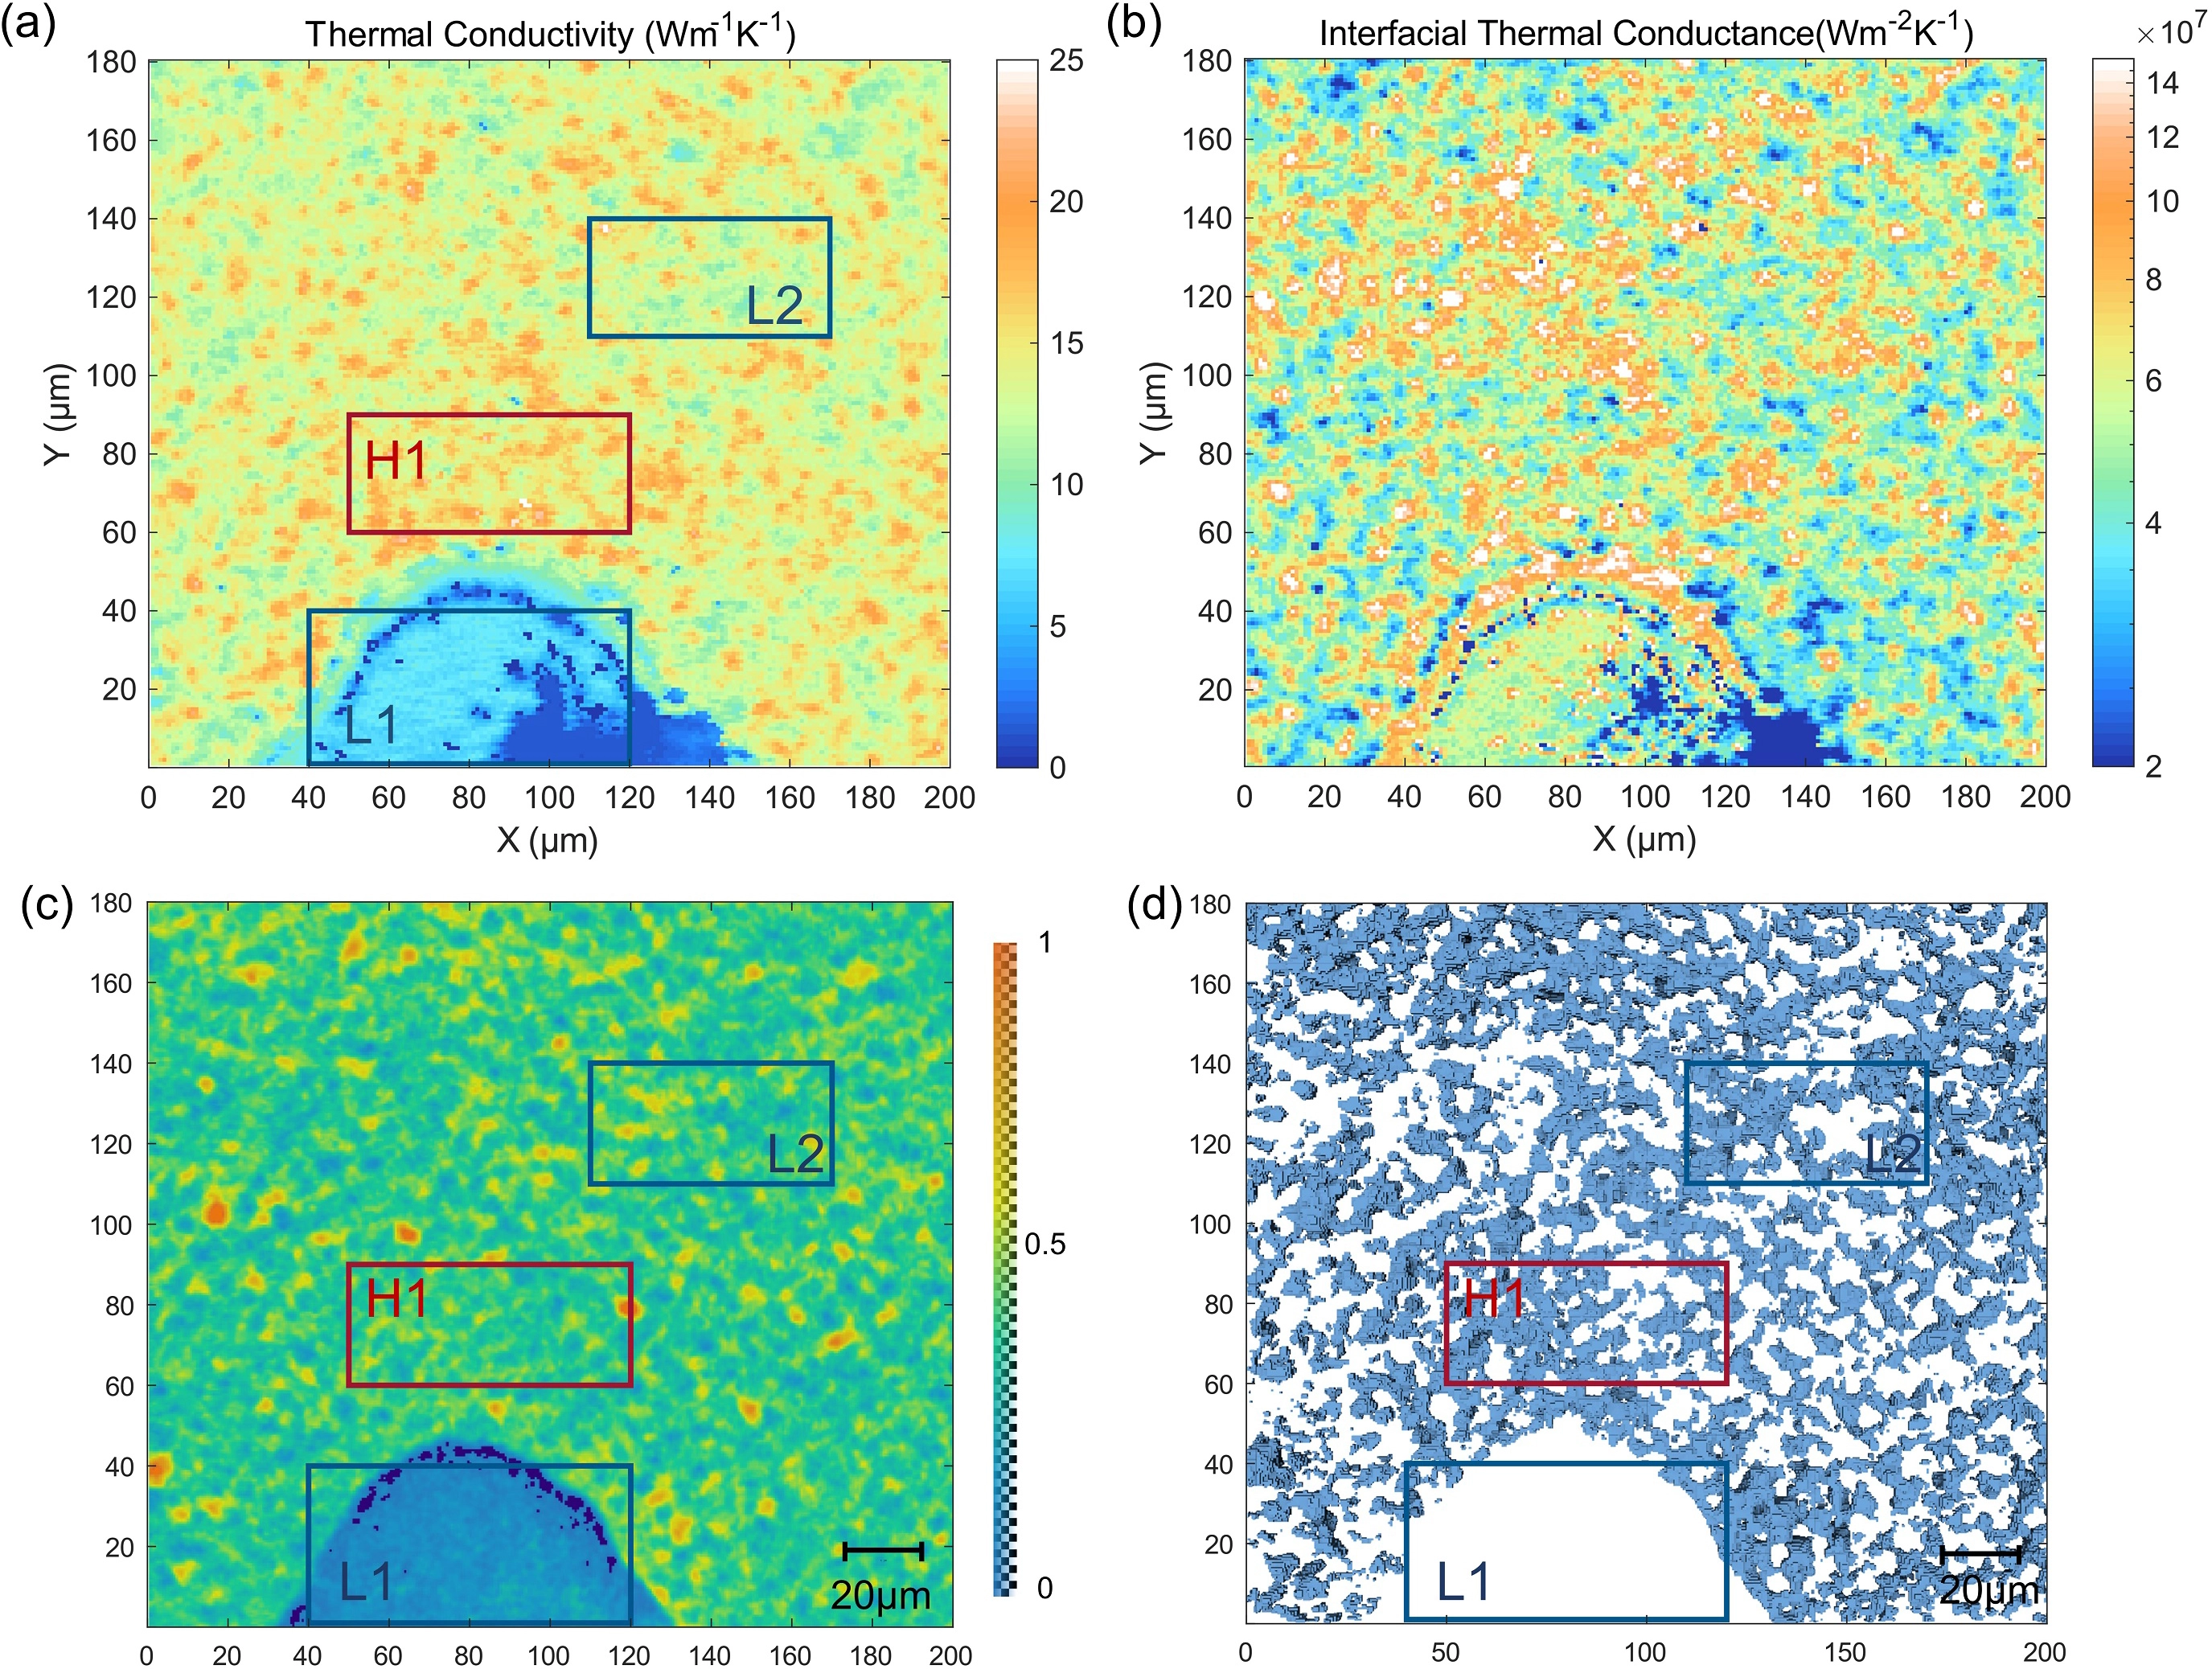
Figure 3. Thermal conductivity mapping of the TIM and its correlation with microstructure. (a) Spatial distribution of thermal conductivity and (b) interfacial thermal conductance; (c) The corresponding micro-CT slice and (d) threshold-segmented 3D reconstruction of the contact area, with the dimensionless intensity values obtained by linearly normalizing the CT grayscale signals from 0 to 1 for visualization. TIM: thermal interface material; CT: computed tomography.
To achieve structural visualization of the same area used for FDTR mapping under the same loading, we used micro-CT imaging that is able to penetrate across the transducer layers without disassembling the sample fixture. The co-registration of the micro-CT image and the FDTR image is based on aligning the edges of the square-shaped transducer films. Alignment details are presented in Section S5, with an alignment uncertainty of approximately 0.6 μm. As shown in Figure 3c, the thermally conductive filler particles correspond to the areas with high intensity values, because the higher density of particles attenuates X-rays more strongly than the polymer matrix[51]. Figure 3d shows the 3D reconstruction image obtained by applying a threshold segmentation to Figure 3c. The blue regions represent aggregated fillers, and the white regions indicate areas with lower densities containing voids or low concentrations of oxide fillers.
To further demonstrate the structural-property correspondence, we selected three representative regions for further comparison: H1 with lots of scattered areas of high local thermal conductivity, L1 covering the assembly void defect, and L2 with relatively low local thermal conductivity. The CT images of region H1 indicate a filler-rich, spatially connected structure, suggesting percolated local heat-conduction pathways. In contrast, region L1 contains low-density voids with very low local thermal conductivity. These voids are introduced due to trapped air during the fixture assembly, as indicated by the low-density area detected by the CT imaging, see Figure 3c,d. The agreement between the thermal conductivity map and CT image demonstrates the capability of detecting defects in TIMs using FDTR microscopy. The L2 region exhibits lower thermal conductivity than the average, manifested as lower grayscale intensity in the CT slice and a filler-deficient structure in the reconstructed 3D image. These areas are characterized by a sub-average filler concentration where the isolated particles fail to establish percolating networks. Interestingly, the spatial mapping of GTIM also reveals localized high-conductance domains that do not consistently overlap with high-k regions and exhibit smaller cluster sizes. We attribute this discrepancy to the intimate mechanical contact between individual Al2O3 particles and the gold transducer under compression, which locally enhances GTIM even in regions with moderate bulk thermal conductivity[50].
3.2 Thermal property evolution under varying contact pressures
To investigate the effect of contact pressure on the thermal properties of TIMs, FDTR imaging was performed at different pressures during both loading and unloading processes. The contact pressure was increased from 10 psi to 40 psi and then released to 0 psi. The measurement commenced at 10 psi because a minimum compressive load is required to flatten the thermal grease and establish reliable contact between the TIM and the transducer. The FDTR measurements at each pressure were conducted using a 10× objective with pump and probe beam radii of approximately 2.5 μm along the x-direction and 2.7 μm along the y-direction, over a modulation frequency range of 0.1-1 MHz.
Figure 4a,b show the area-averaged thermal conductivity and interfacial thermal conductance as a function of contact pressure, respectively. During loading and unloading, the averaged thermal conductivity remains nearly constant from 10 to 40 psi, and decreases when the pressure is further unloaded to zero. On the other hand, the interface conductance shows weak pressure dependence, possibly because the fluidity of the thermal grease ensured sufficient contact with the transducer layer.
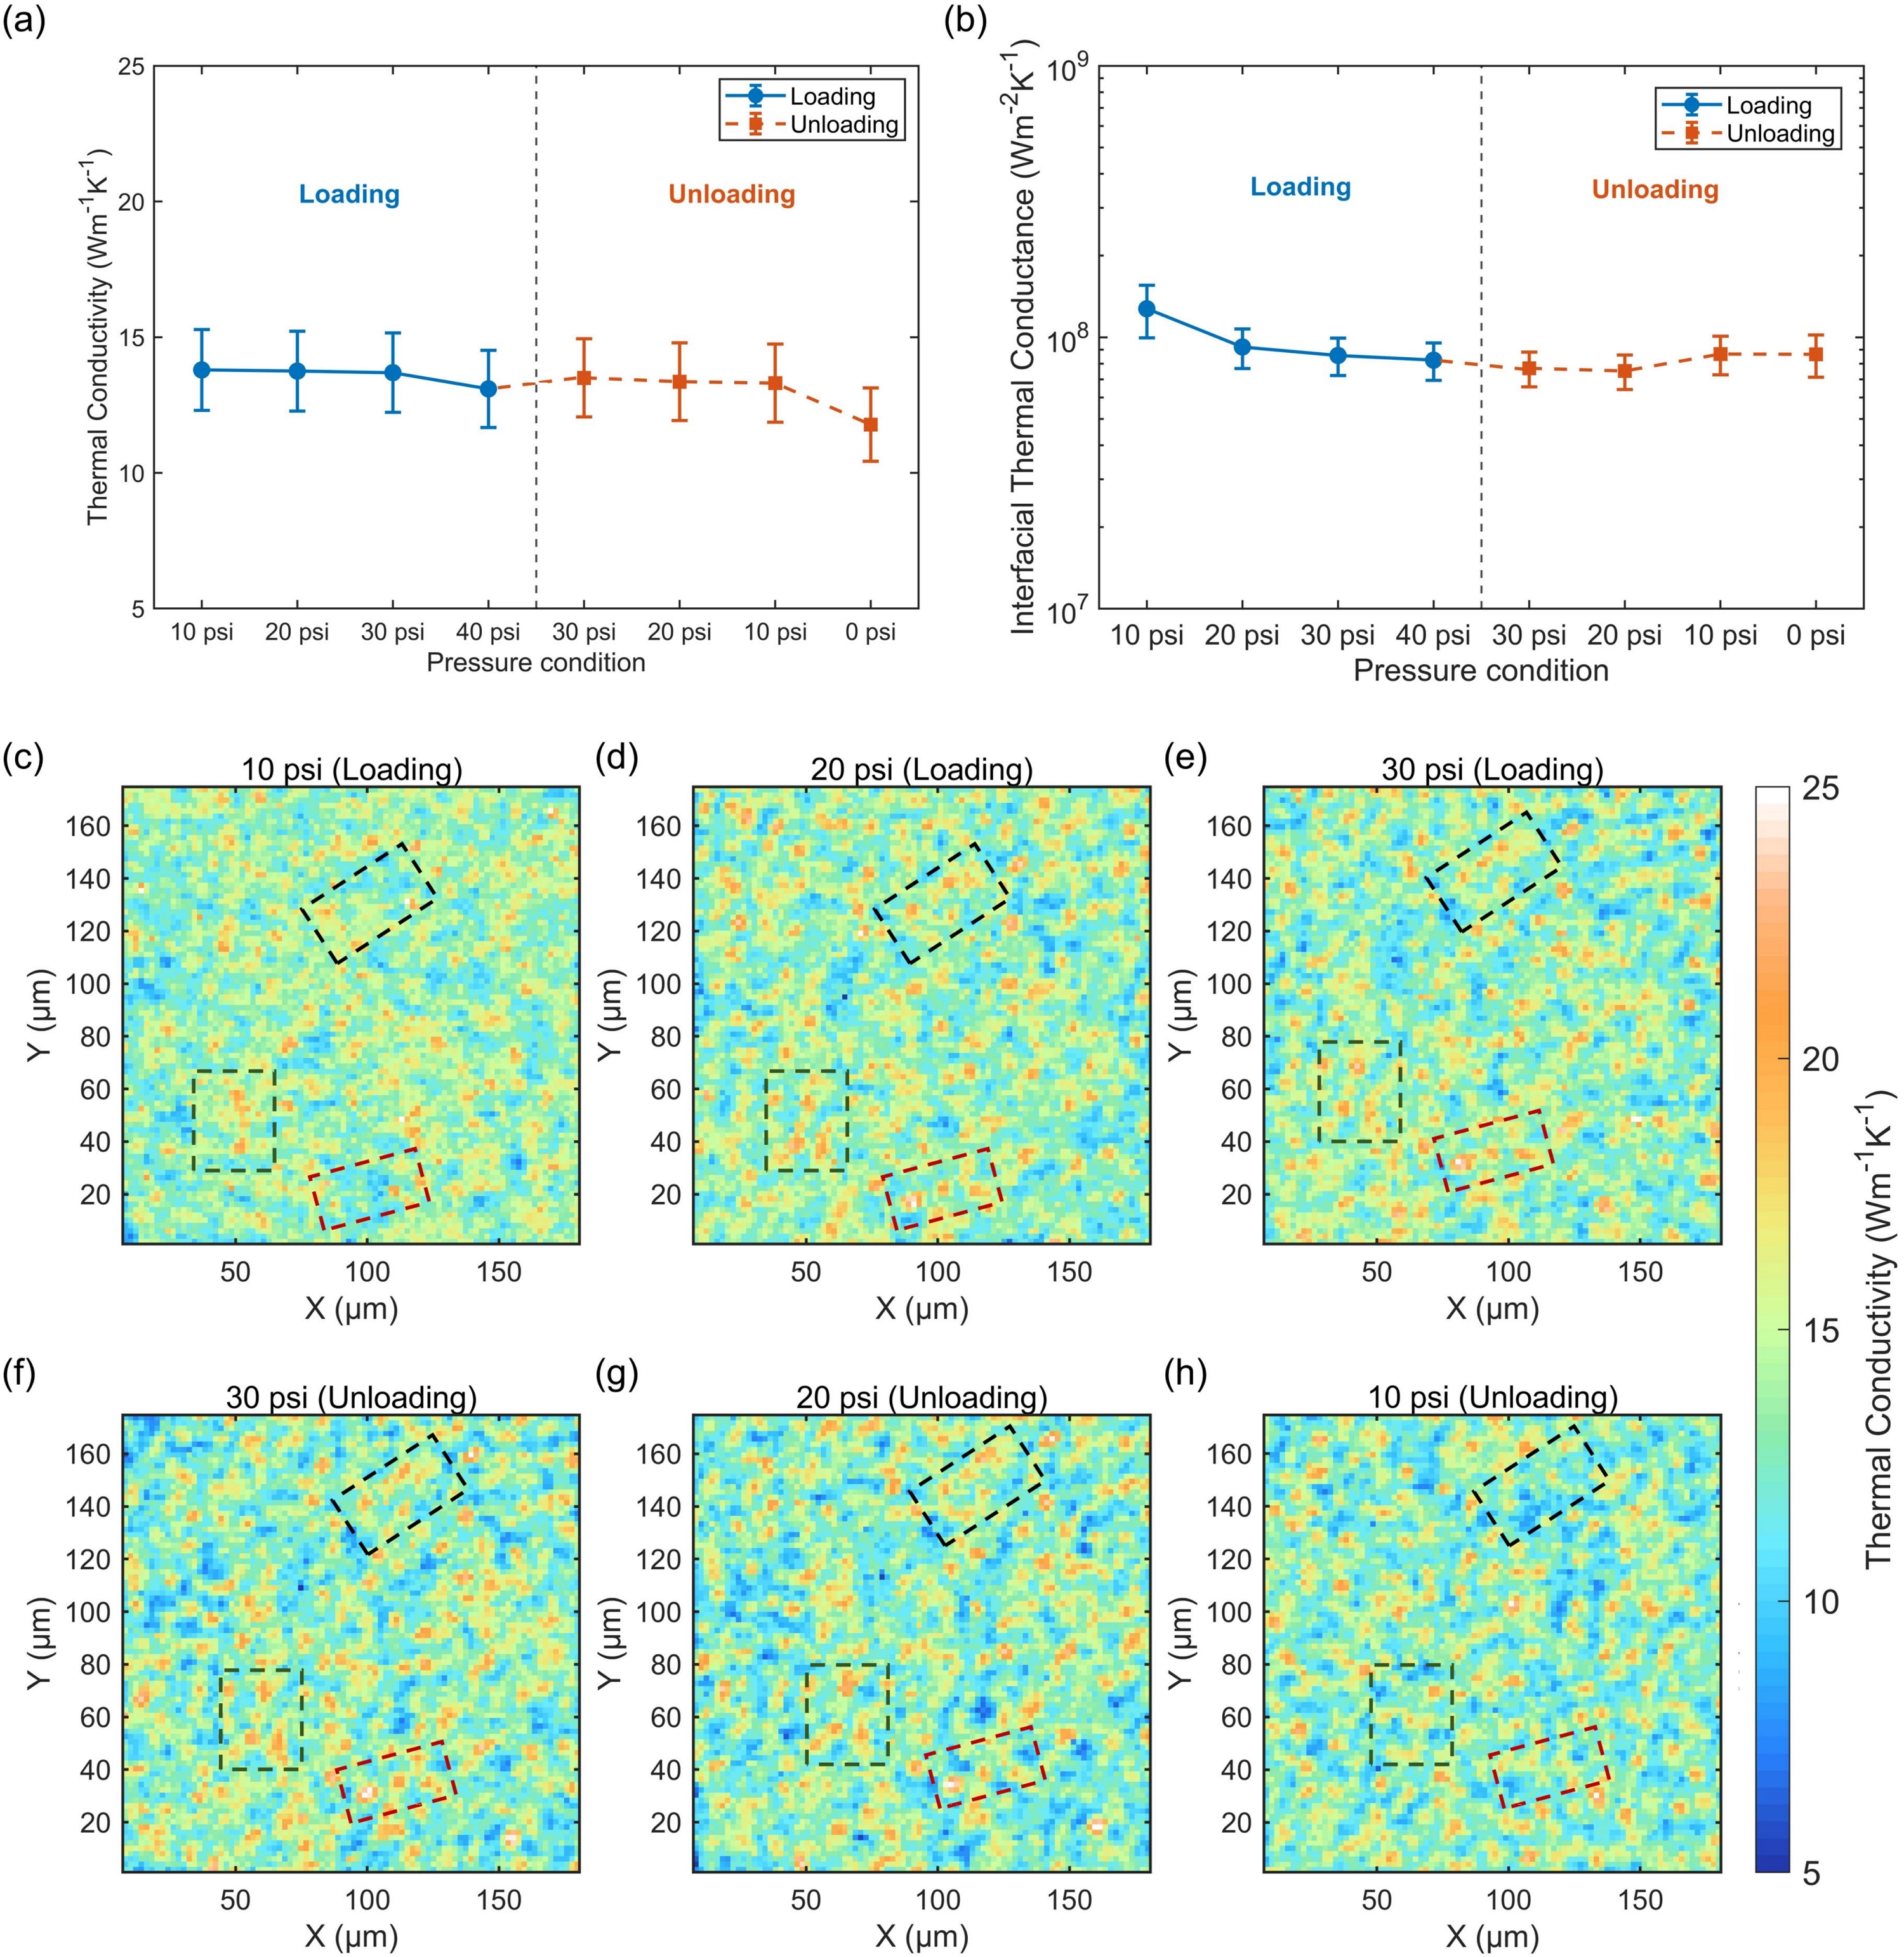
Figure 4. Thermal property evolution of the TIM under varying contact pressures. (a) Thermal conductivity and (b) interfacial thermal conductance as a function of contact pressure during loading and unloading processes; (c-h) Thermal conductivity maps at different contact pressures during loading and unloading processes. TIM: thermal interface material.
Figure 4c,d,e,f,g,h further visualize the evolution of the local thermal-conductivity maps during loading and unloading. When the loading is increased from 10 to 20 psi, the scattered pattern of high-thermal conductivity areas is re-arranged, as indicated in the squared areas in Figure 4c,d. Interestingly, further increasing the loading does not rearrange the high-thermal conductivity patterns, instead, these features appear to shift slightly, which may be associated with pressure-induced creep or lateral displacement of the thermal grease, see squared areas in Figure 4d,e. Similar flowing behavior of high-thermal conductivity region is also observed in the unloading cycle (Figure 4f,g), and the high-thermal conductivity areas are re-arranged again when the pressure is further reduced from 20 psi to 10 psi (Figure 4g,h). Such behavior is consistent with the weak pressure-dependent thermal conductivity: the translation of thermally conductive particles does not alter the heat conductive pathways from 20 psi to 40 psi. These imaging results demonstrate that FDTR can be used as an in situ thermal characterization tool for TIMs under different contact pressure.
3.3 Statistical analysis of thermal conductivity
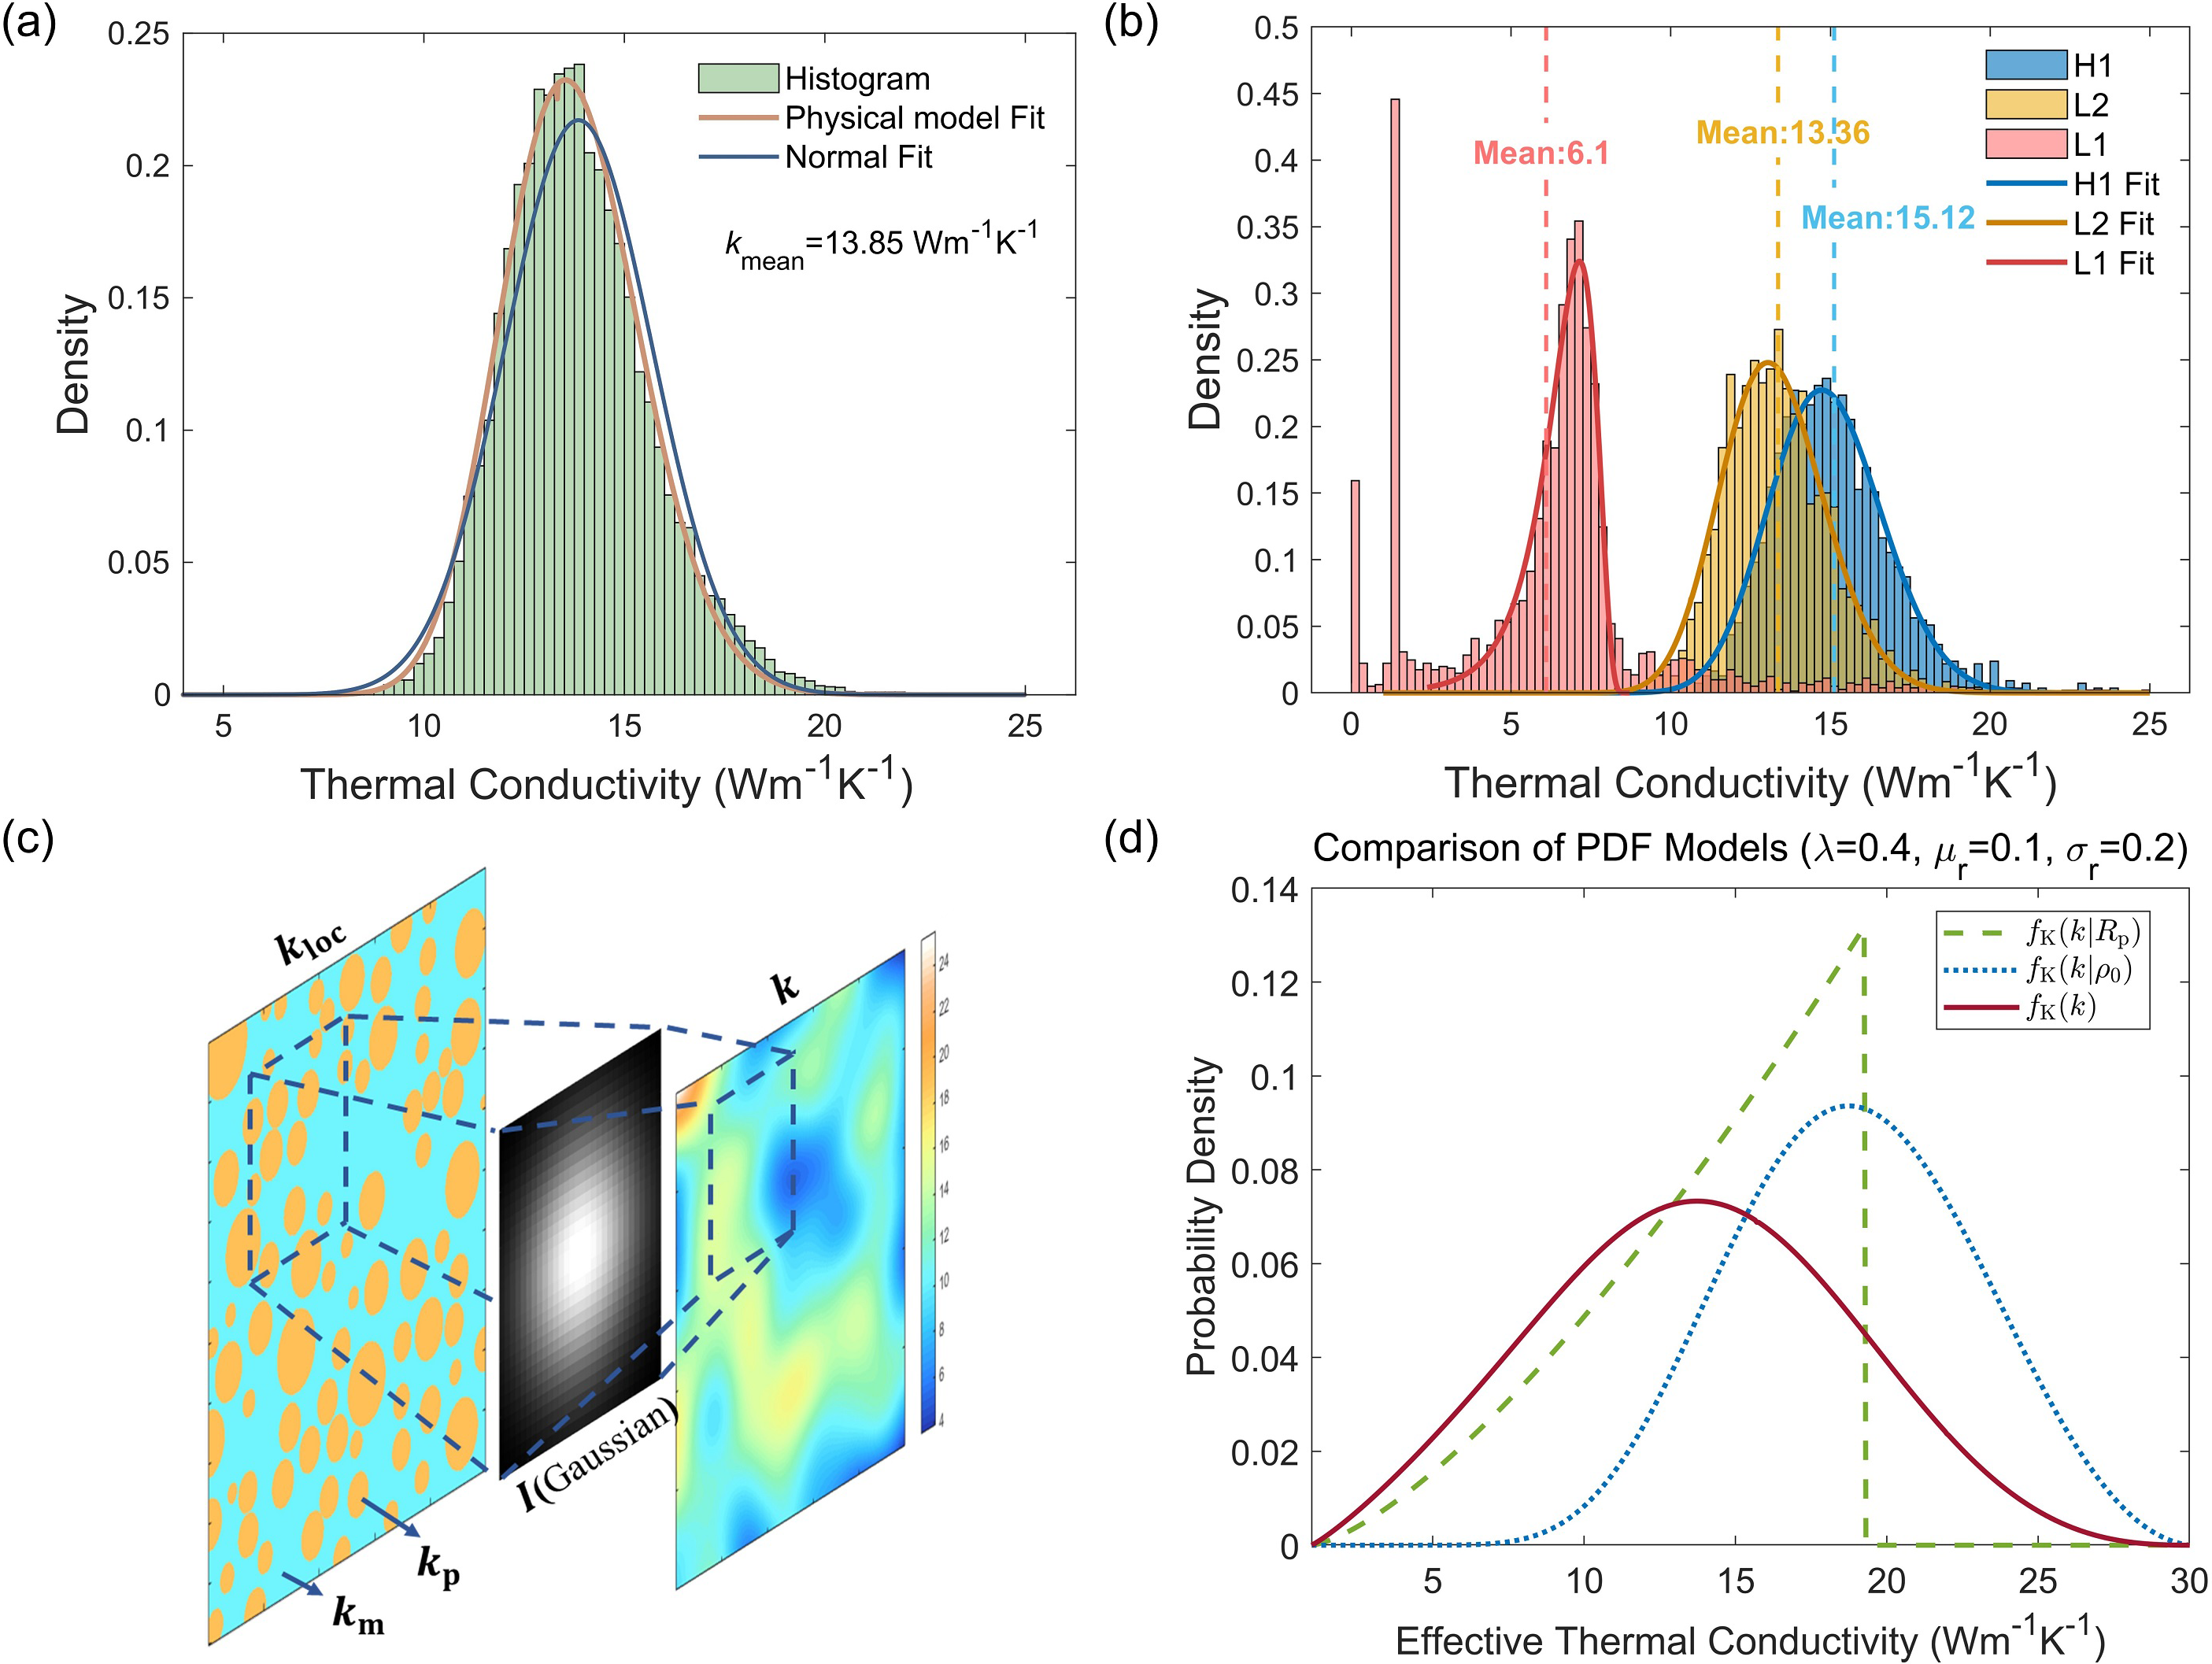
We conducted a statistical analysis of the thermal conductivity distribution within a representative 200 μm × 100 μm area, spanning from 80 μm to 180 μm along the y-axis of Figure 3a. We have excluded the pore-containing region such that the thermal conductivity histogram reflects its intrinsic statistical distribution. As shown in Figure 5a, the probability distribution exhibits an asymmetric profile that deviates from the standard Gaussian form. The measured average thermal conductivity is 13.85 W m-1 K-1, which is in agreement with reported values[49] and manufacturer specifications. To further quantify the spatial heterogeneity of the thermal conductivity across the sampled domain, a statistical analysis of the thermal conductivity distribution within the sub-regions is presented in Figure 5b. Results indicate that the H1 region exhibits a higher average conductivity than the global mean due to the locally dense filler distribution, while the L2 region shows diminished values owing to sparse filler density; both regions display a positively skewed distribution, featuring a distinct long tail.

Figure 5. (a) Overall probability density distribution of thermal conductivity in TIMs and (b) statistical distributions of thermal conductivity across representative sub-regions and the corresponding statistical fitting using Eq. (15); (c) Schematic diagram of the Gaussian convolution model used to determine the effective thermal conductivity; (d) PDFs of the effective thermal conductivity calculated under different stochastic effects. TIMs: thermal interface materials; PDFs: probability density functions.
To explain the origin of the thermal conductivity distribution, we developed a statistical model. The measurement process of FDTR is modeled as a convolution of the ground truth thermal conductivity with a multiplicative superposition of two Gaussian expressions, as illustrated in Figure 5c. The measured effective thermal conductivity, k, is expressed as the integral of the local intrinsic thermal conductivity distribution, kloc(r), weighted by the effective beam intensity distribution, P(r), over the entire plane:
where r0 denotes the center of the laser spot. The normalized intensity distribution of the heating and probe beams, P(r), is given by
where ρ = |r - rp| and ρ0 = |r0 - rp| are distances relative to the particle center, and H(ρ0,Rp) represents the geometric overlap factor between the particle and the laser spot. The rigorous evaluation of H(ρ0,Rp) involves a mathematically intractable integral of Bessel functions I0. To further simplify the numerical behavior, the Gaussian Aperture Approximation, a method widely adopted in fields such as Particle Image Velocimetry, is employed to model the hard-edge particle as an equivalent soft-edge Gaussian distribution[54,55]. This approximation effectively captures the primary features of the particle-beam interaction while simplifying the governing equations into an analytical solution as follows.
We first consider the stochastic spatial distribution of particles for a given size. Assuming the particle locations follow a homogeneous Poisson point process, the probability density function (PDF) of the nearest-neighbor distance ρ0 in a 2D homogeneous Poisson point process[56] follows a Rayleigh distribution and is derived as:
where λ is spatial number density of the particles. Applying the probability density transformation rule
Eq.(13) maps the stochastic spatial distribution of the fillers into the observed fluctuations in the local thermal conductivity distribution. This distribution arises from the combined effects of the nearest-neighbor distance distribution and the relative size between the laser spot and the thermally conductive particles. As described by Eq. (12), the nearest-neighbor distance follows a Rayleigh distribution, where the probability density first increases rapidly and then gradually decreases to zero. Since the fillers are not dimensionless points but possess finite physical radii, the effective local thermal conductivity measured by the laser is fundamentally governed by the geometric overlap area between a given particle and the laser spot. Consequently, for a fixed particle radius, the nonlinear mathematical relationship between the nearest-neighbor distance and this overlap area transforms the initial Rayleigh distribution of distances into a power-law distribution for local thermal conductivity, where the probability density gradually increases from the theoretical minimum thermal conductivity, km, to the theoretical maximum
where μr is the mean of lnRp, and
Eq.(15) represents a weighted superposition of the power-law responses associated with each specific filler size, where the contribution of each particle radius is governed by its corresponding log-normal probability. This formulation elucidates that the resulting thermal conductivity distribution is essentially governed by the convolution of the intrinsic size distribution of fillers and the laser-particle distance decay effect. As shown in Figure 5a,b, we fit the distribution data using the proposed model, which reasonably captures the asymmetric nature of the observed thermal conductivity distribution. Further details of the model fitting are provided in Supplementary materials.
Given the experimental parameters (km = 1 W m-1 K-1, kp = 30 W m-1 K-1, w0 = 1.6 μm, μr = 0.1 μm, σr = 0.2 μm, λ = 0.4 μm-2), numerical integration is performed with the upper limit of integration truncated at 10 μm. The final PDF of the measured effective thermal conductivity is highly consistent with the asymmetric probability distribution observed experimentally. Notably, by decoupling the spatial and size-related contributions within this statistical framework, we elucidate that the spatial stochasticity introduces a characteristic non-linear decay effect, whereas the randomness in particle size primarily dictates the log-normal skewness of the profile. The PDFs of the effective thermal conductivity calculated under varied stochastic conditions are compared in Figure 5d. From the comparison of the three models, it is evident that the log-normal-like characteristic of the experimentally measured thermal conductivity originates from the log-normal distribution of particle sizes within the finite measurement volume. Meanwhile, the spatial randomness introduces a non-linear decay effect, ultimately shaping the result into a non-Gaussian distribution with distinct heavy-tail characteristics. Similar long-tailed asymmetrical thermal conductivity distribution is also observed in an elastic thermal pad, see Section S6.4. Our model provides an explicit causal link between the particle size distribution and the asymmetric thermal conductivity histogram.
4. Conclusion
In summary, we demonstrated FDTR thermal-property imaging of TIMs at the microscale, enabling simultaneous mapping of local thermal conductivity and interfacial thermal conductance in a sandwich-configured sample fixture. The thermal-property images reveal pronounced spatial heterogeneity in a commercial Al2O3/ZnO-loaded thermal grease. Co-located micro-CT imaging associates these features with the underlying filler architecture: high-conductivity regions correspond to filler aggregation, whereas low-conductivity regions correlate with pores or filler-deficient structures. Pressure-dependent measurements further demonstrate that while the averaged thermal properties remain relatively stable over a moderate pressure range, the thermal-property maps capture local redistribution of conductive features during loading and unloading. We develop a statistical model showing the link between the particle size distribution and the statistical behavior of local thermal conductivity. The combined FDTR–micro-CT approach presented in this work provides a visualization tool for characterizing the structure-property correspondence at the microscale, which can facilitate future development of advanced thermal management materials.
Supplementary materials
The supplementary materials for this article is available at: Supplementary materials.
Authors contribution
Yao Y: Writing-original draft, visualization, validation, software, methodology, investigation, formal analysis, data curation.
Yang H: Writing-review & editing, validation, methodology, investigation.
Yang R: Conceptualization, writing-review & editing, project administration, funding acquisition.
Qian X: Conceptualization, writing-review & editing, methodology, formal analysis, supervision.
Conflicts of interest
Ronggui Yang is an Editorial Board Member of Thermo-X. The other authors declare no conflicts of interest.
Ethical approval
Not applicable.
Consent to participate
Not applicable.
Consent for publication
Not applicable.
Availability of data and materials
Data supporting the findings of this study are available from the corresponding author upon reasonable request.
Funding
This work was supported in part by the National Key R & D Project from the Ministry of Science and Technology of China (Grant No. 2022YFA1203100).
Copyright
© The Author(s) 2026.
References
-
1. He Z, Yan Y, Zhang Z. Thermal management and temperature uniformity enhancement of electronic devices by micro heat sinks: A review. Energy. 2021;216:119223.[DOI]
-
2. Li X, Xuan Y. Bidirectional interlayer cooling of 3D chip stack for temperature uniformity enhancement and hotspot mitigation. Appl Therm Eng. 2024;248:123254.[DOI]
-
3. Cheng T, Luo X, Huang S, Liu S. Thermal analysis and optimization of multiple LED packaging based on a general analytical solution. Int J Therm Sci. 2010;49(1):196-201.[DOI]
-
4. Lei Y, Du X, Wei Y, Zhu H, Kong Y, Zhao H, et al. Hotspot thermal management using thermoelectric and microchannel hybrid cooling at transient and steady states. Appl Therm Eng. 2025;265:125556.[DOI]
-
5. Xu XQ, Cheng XB, Jiang FN, Yang SJ, Ren D, Shi P, et al. Dendrite-accelerated thermal runaway mechanisms of lithium metal pouch batteries. SusMat. 2022;2(4):435-444.[DOI]
-
6. Wei B, Luo W, Du J, Ding Y, Guo Y, Zhu G, et al. Thermal interface materials: From fundamental research to applications. SusMat. 2024;4(6):e239.[DOI]
-
7. Xu X, Zhou J, Chen J. Thermal transport in conductive polymer–based materials. Adv Funct Mater. 2020;30(8):1904704.[DOI]
-
9. Li J, Tao Y, Rao S, Li M, Zhang Z, Jiang Q, et al. Oriented structural design of thermal interface materials: Methods, properties, and challenges. Renewables. 2025;3(4):222-243.[DOI]
-
10. Yang J, Shen X, Yang W, Kim J. Templating strategies for 3D-structured thermally conductive composites: Recent advances and thermal energy applications. Prog Mater Sci. 2023;133:101054.[DOI]
-
11. Liu H, Huang Z, Chen T, Su X, Liu Y, Fu R. Construction of 3D MXene/Silver nanowires aerogels reinforced polymer composites for extraordinary electromagnetic interference shielding and thermal conductivity. Chem Eng J. 2022;427:131540.[DOI]
-
12. Liu P, Li X, Min P, Chang X, Shu C, Ding Y, et al. 3D lamellar-structured graphene aerogels for thermal interface composites with high through-plane thermal conductivity and fracture toughness. Nano Micro Lett. 2021;13(1):22.[DOI]
-
13. Quiles-Díaz S, Martínez-Rubí Y, Guan J, Kim KS, Couillard M, Salavagione HJ, et al. Enhanced thermal conductivity in polymer nanocomposites via covalent functionalization of boron nitride nanotubes with short polyethylene chains for heat-transfer applications. ACS Appl Nano Mater. 2019;2(1):440-451.[DOI]
-
14. Tang S, Ma M, Zhang X, Zhao X, Fan J, Zhu P, et al. Covalent cross-links enable the formation of ambient-dried biomass aerogels through the activation of a triazine derivative for energy storage and generation. Adv Funct Mater. 2022;32(36):2205417.[DOI]
-
15. Luo T, Lloyd JR. Enhancement of thermal energy transport across graphene/graphite and polymer interfaces: A molecular dynamics study. Adv Funct Mater. 2012;22(12):2495-2502.[DOI]
-
16. Yao T, Zhang C, Chen K, Niu T, Wang J, Yang Y. Hydroxyl-group decreased dielectric loss coupled with 3D-BN network enhanced high thermal conductivity epoxy composite for high voltage-high frequency conditions. Compos Sci Technol. 2023;234:109934.[DOI]
-
17. Song N, Zhang F, Cao D, Wang P, Ding P. Bicontinuous laminated structure design of polypropylene/reduced graphene oxide hybrid films for thermal management. Adv Compos Hybrid Mater. 2022;5(4):2873-2883.[DOI]
-
18. Zhang J, Wang H, Zhang T, Sun X, Meng Y, Ma C, et al. Vertically-oriented graphene-boron nitride skeletons using graphene oxide as inorganic adhesives for high-efficiency thermal conduction of polymeric composites with electrical insulation and compressibility. Compos Sci Technol. 2023;233:109915.[DOI]
-
20. Li J, Ye Z, Mo P, Pang Y, Gao E, Zhang C, et al. Compliance-tunable thermal interface materials based on vertically oriented carbon fiber arrays for high-performance thermal management. Compos Sci Technol. 2023;234:109948.[DOI]
-
21. Xie Z, Dou Z, Wu D, Zeng X, Feng Y, Tian Y, et al. Joint-inspired liquid and thermal conductive interface for designing thermal interface materials with high solid filling yet excellent thixotropy. Adv Funct Mater. 2023;33(14):2214071.[DOI]
-
22. Lin W, Wong CP. Vertically aligned carbon nanotubes for thermal interface materials: Quality control, alignment improvement and laser flash measurement. In: 2010 Proceedings 60th Electronic Components and Technology Conference (ECTC); 2010 Jun 01-04; Las Vegas, USA. Piscataway: IEEE; 2010. p. 967-972.[DOI]
-
25. Liu W, Xu Y, Su Y, Liu Y, Lei Z, Tao P, et al. Multi-functional highly oriented expanded graphite nanoplatelet composites enabling advanced thermal management. Carbon. 2025;243:120588.[DOI]
-
27. Cahill DG. Analysis of heat flow in layered structures for time-domain thermoreflectance. Rev Sci Instrum. 2004;75(12):5119-5122.[DOI]
-
28. Jiang P, Qian X, Yang R. Tutorial: Time-domain thermoreflectance (TDTR) for thermal property characterization of bulk and thin film materials. J Appl Phys. 2018;124(16):161103.[DOI]
-
29. Schmidt AJ, Cheaito R, Chiesa M. A frequency-domain thermoreflectance method for the characterization of thermal properties. Rev Sci Instrum. 2009;80(9):094901.[DOI]
-
31. Qian X, Jiang P, Yang R. Anisotropic thermal conductivity of 4H and 6H silicon carbide measured using time-domain thermoreflectance. Mater Today Phys. 2017;3:70-75.[DOI]
-
33. Liu J, Zhu J, Tian M, Gu X, Schmidt A, Yang R. Simultaneous measurement of thermal conductivity and heat capacity of bulk and thin film materials using frequency-dependent transient thermoreflectance method. Rev Sci Instrum. 2013;84(3):034902.[DOI]
-
37. Li X, Li A, Shi H, Yao Y, Ye Z, Wen Z, et al. Semi-in-situ thermal transport characterization of thermal interface materials through a low-frequency thermoreflectance technique. Measurement. 2025;240:115648.[DOI]
-
40. Yang J, Ziade E, Maragliano C, Crowder R, Wang X, Stefancich M, et al. Thermal conductance imaging of graphene contacts. J Appl Phys. 2014;116(2):023515.[DOI]
-
41. Yang H, Zhu Z, Xie Z, Du J, Bai S, Guo H, et al. Thermal-property microscopy with compressive-sensing frequency-domain thermoreflectance. Phys Rev Appl. 2025;24:014033.[DOI]
-
42. Schmidt A, Chiesa M, Chen X, Chen G. An optical pump-probe technique for measuring the thermal conductivity of liquids. Rev Sci Instrum. 2008;79(6):064902.[DOI]
-
44. Jiang P, Qian X, Yang R. A new elliptical-beam method based on time-domain thermoreflectance (TDTR) to measure the in-plane anisotropic thermal conductivity and its comparison with the beam-offset method. Rev Sci Instrum. 2018;89(9):094902.[DOI]
-
45. Hamby DM. A review of techniques for parameter sensitivity analysis of environmental models. Environ Monit Assess. 1994;32(2):135-154.[DOI]
-
46. Braun JL, Hopkins PE. Upper limit to the thermal penetration depth during modulated heating of multilayer thin films with pulsed and continuous wave lasers: A numerical study. J Appl Phys. 2017;121(17):175107.[DOI]
-
47. Hodges W, Jarzembski A, McDonald A, Ziade E, Pickrell GW. Sensing depths in frequency domain thermoreflectance. J Appl Phys. 2022;131(24):245103.[DOI]
-
48. Yang J, Ziade E, Schmidt AJ. Uncertainty analysis of thermoreflectance measurements. Rev Sci Instrum. 2016;87:014901.[DOI]
-
49. Wu K, Dou Z, Deng S, Wu D, Zhang B, Yang H, et al. Mechanochemistry-mediated colloidal liquid metals for electronic device cooling at kilowatt levels. Nat Nanotechnol. 2025;20(1):104-111.[DOI]
-
52. Liu Y, Li J. A protocol to further improve the thermal conductivity of silicone-matrix thermal interface material with nano-fillers. Thermochim Acta. 2022;708:179136.[DOI]
-
53. Pandey K, Gupta AK. kth distance distributions for generalized Gauss-Poisson process in Rn. Stat Probab Lett. 2021;172:109048.[DOI]
-
56. Torquato S. Random heterogeneous materials: Microstructure and macroscopic properties. New York: Springer; 2002.[DOI]
-
57. Huang CL, Qian X, Yang RG. Influence of nanoparticle size distribution on the thermal conductivity of particulate nanocomposites. Europhys Lett. 2017;117(2):24001.[DOI]
Copyright
© The Author(s) 2026. This is an Open Access article licensed under a Creative Commons Attribution 4.0 International License (https://creativecommons.org/licenses/by/4.0/), which permits unrestricted use, sharing, adaptation, distribution and reproduction in any medium or format, for any purpose, even commercially, as long as you give appropriate credit to the original author(s) and the source, provide a link to the Creative Commons license, and indicate if changes were made.
Publisher’s Note
Science Exploration remains a neutral stance on jurisdictional claims in published
maps
and institutional affiliations. The views expressed in this article are solely those
of
the author(s) and do not reflect the opinions of the Editors or the publisher.
Share And Cite


Science Exploration Style
Yao Y, Yang H, Yang R, Qian X. Imaging thermal properties of thermal interface materials using frequency-domain thermoreflectance microscopy. Thermo-X. 2026;2:202612. https://doi.org/10.70401/tx.2026.0020
Tips
Copy completed.
Submit a Manuscript
Author Instructions
Cite this Article
Article Metrics
0
View
0
Download
Cited
Article Updates

Science Exploration Style
Yao Y, Yang H, Yang R, Qian X. Imaging thermal properties of thermal interface materials using frequency-domain thermoreflectance microscopy. Thermo-X. 2026;2:202612. https://doi.org/10.70401/tx.2026.0020
copy
Share Link
copy