A cumulative model for thermoelectric cooling with temperature dependent material properties

Kang Zhu
1

,
Xuechun Li
1
,
Alex Brown
2
,
Rujie Shi
1
,
Hee Seok Kim
2,*
,
Weishu Liu
3,*
*Correspondence to:
Hee Seok Kim, Mechanical Engineering, School of Engineering and Technology, University of Washington Tacoma, Tacoma, WA 98402, USA.
E-mail: heeskim@uw.edu
Weishu Liu, Department of Materials Science and Engineering, Southern University of Science and Technology, Shenzhen 518055, Guangdong, China. E-mail: liuws@sustech.edu.cn
Weishu Liu, Department of Materials Science and Engineering, Southern University of Science and Technology, Shenzhen 518055, Guangdong, China. E-mail: liuws@sustech.edu.cn
Thermo-X. 2026;2:202624. 10.70401/tx.2026.0027
Received: May 21, 2026Accepted: July 31, 2026Published: July 31, 2026
Abstract
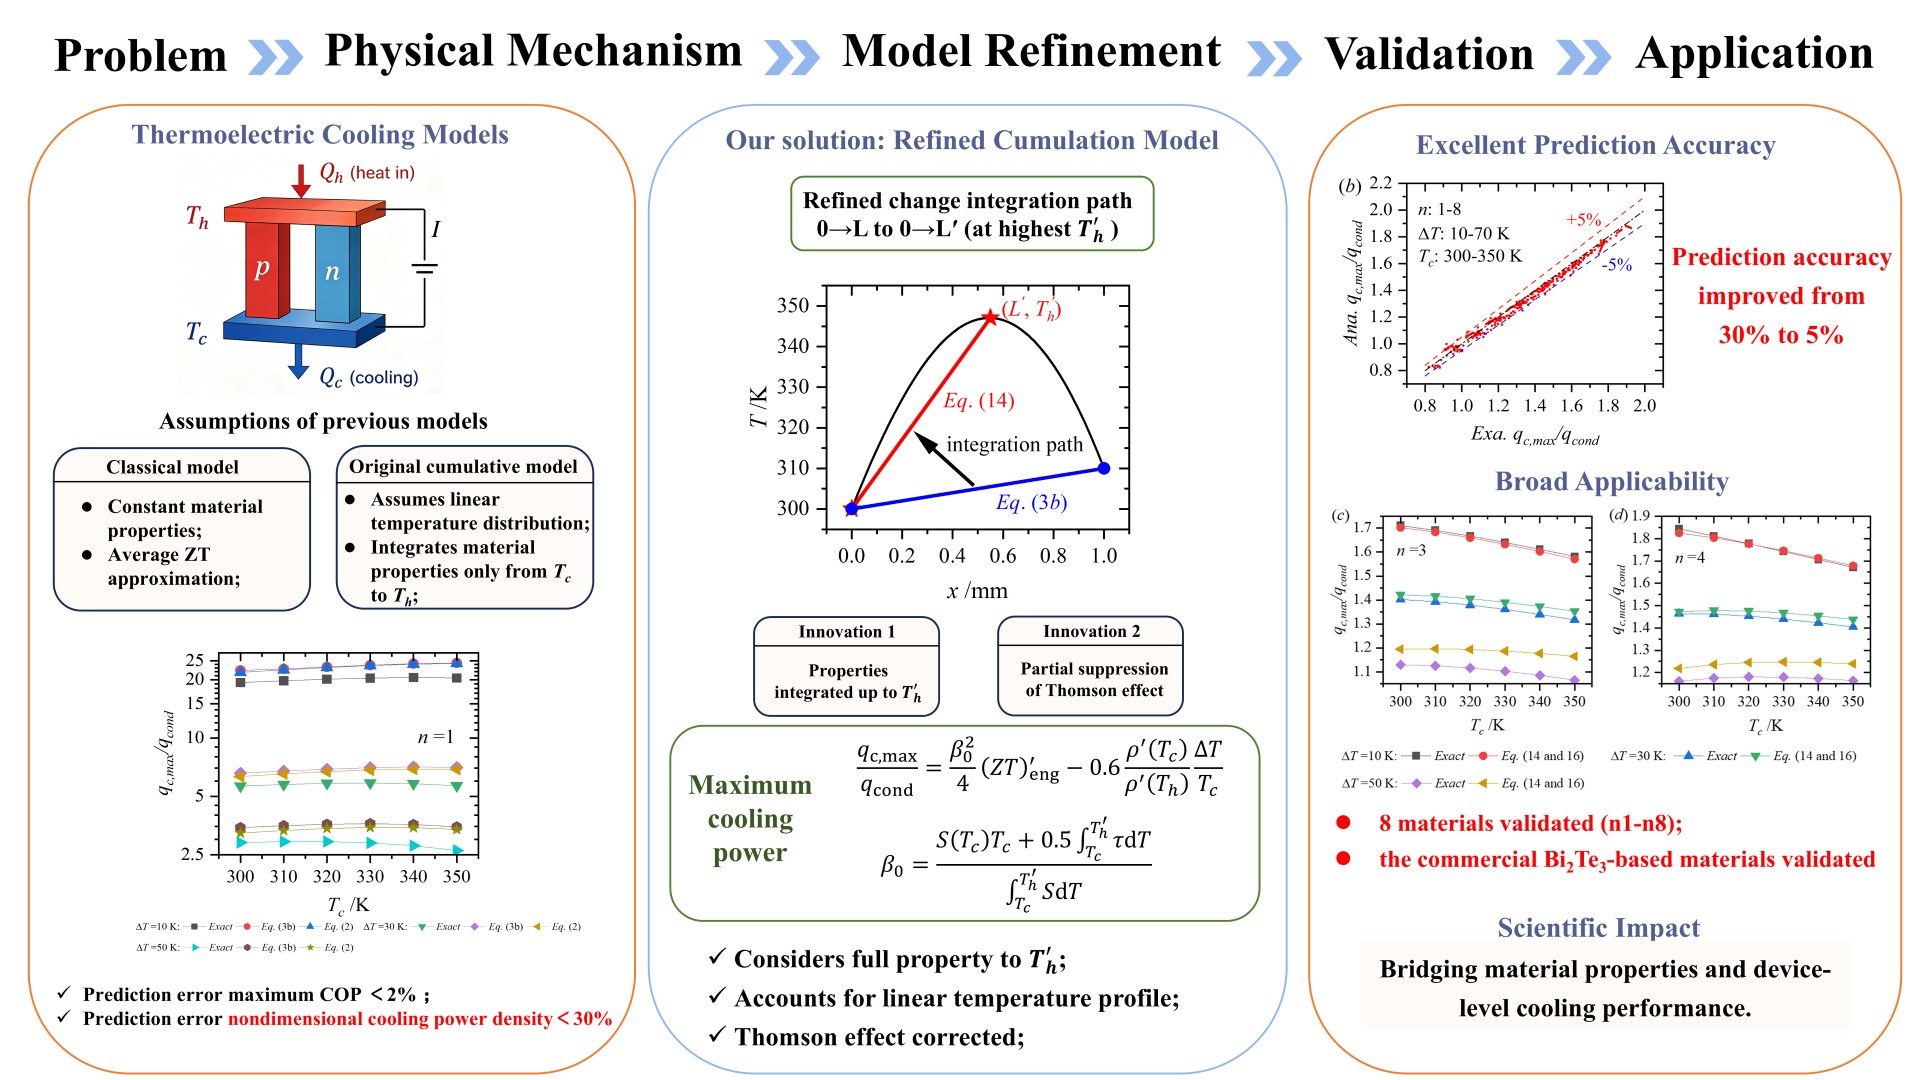
The precise evaluation of real-world thermoelectric cooling (TEC) performance is vital for both the development of TEC devices and the rational design of TEC materials. Due to the relatively limited temperature difference (ΔT) that a single-stage TEC can achieve, the classical analytical formulae for thermoelectric cooling are commonly used with averaged material properties in the cooling performance evaluation. Nevertheless, this could cause remarkable errors in evaluations of the cooling power, even under a ΔT as low as 10 K. In this work, a cumulative model for thermoelectric cooling is proposed to evaluate the maximum coefficient of performance (COP) as well as the maximum cooling power of a TEC device under finite temperature differences, with the temperature dependence of material properties being fully considered. The inherent deficiencies in predicting the maximum cooling power by both the classical formulae and the original cumulative model are identified, and effective refinements are implemented to reduce the prediction error. Eight thermoelectric materials with state-of-the-art ZT values near room temperature are assessed for electronics cooling scenarios within a cold side temperature (Tc) range of 300-350 K. In comparison to the classical formulae, the proposed model predicts the maximum COP with comparably satisfying accuracies (±2%), while significantly improves the prediction accuracy of the maximum cooling power from approximately ±30% to within ±5% over a ΔT range of 10-70 K. This work fills the gap between thermoelectric material properties and device-level cooling performance, and is beneficial to the development and application of thermoelectric conversion technology for cooling purposes.
Graphical Abstract
Keywords
Thermoelectric cooling, performance evaluation, cumulative model, temperature dependence, material properties
1. Introduction
A thermoelectric module can directly convert heat into electric power (the power generation mode) under a temperature gradient and enable heat flow from lower temperature to higher temperature (the cooling or heat pump mode) at the cost of electric power input. The power generation mode is promising for solar energy utilization[1], waste heat recovery[2] and human body energy harvesting[3], while the cooling mode is of great use for the active thermal management of high-power density electronics[4] and precise temperature control of critical components in optoelectronic devices[5] as well as spacecraft systems[6]. To make full use of this technology, the precise evaluation of its real-world performance is essential.
In 1957, a set of analytical formulae for performance evaluation both in the power generation mode and in the cooling mode were given by Ioffe[7], which is denoted as the classical formulae in this study. The classical formulae for the maximum coefficient of performance (COP) and cooling power in the cooling mode are given by
where ∆T and
where qc, max and qcond are the cooling power density and the thermal conducting heat flux, respectively. It should be noted that the classical formulae were derived based on the constant property assumption, i.e., the material properties are independent of temperature. However, the physical properties of practical thermoelectric materials generally show strong temperature dependence, causing some problems when directly using the classical formulae.
This issue was first noticed in the power generation mode, since the temperature difference across the module could be as large as hundreds of degrees, allowing for remarkable variations of the thermoelectric properties. Even though the averaged properties are used, non-negligible errors still occur in certain cases. Many researchers have made efforts to solve this issue[8-12]. In 2015, the authors[13] proposed a cumulative model and defined the engineering ZT (ZTeng) for thermoelectric power generation, to fully take into account the temperature dependence of material properties. Much better predictions of the maximum efficiency were achieved compared to the averaged property-adopted classical formula. Linker et al.[14] also demonstrated that the accuracy of the cumulated model is comparable to that of the reduced variables approach developed by Snyder and Ursell[15].
In the cooling mode, since the maximum temperature difference that a single-stage thermoelectric cooling (TEC) can achieve is only tens of degrees, the varying spaces for material properties are more limited than those in the power generation mode. Consequently, the classical formulae are expected to work with greater reliability. However, according to Wang et al.’s numerical modeling[16], the variable material properties were observed to have significant effects on the cooling capacity and COP of TECs under high electric currents, with the maximum COP being overestimated by 17.6% by the constant property model. This indicates a need for a comprehensive analysis of the thermoelectric cooling performance with temperature dependent properties. Analytical studies by Yamashita[17] and Ju et al.[18] have already paid attention to this issue. Nevertheless, their models can only account for material properties with relatively simple temperature dependences, i.e., linear and quadratic relationships between the properties and temperature can be treated, resulting in a loss of generality to some extent.
In this work, to account for the most practical variations of material properties with temperature, we firstly extend the original cumulative model for thermoelectric power generation to the cooling mode, and derive explicit relationships between the maximum COP/cooling power and ZTeng. Secondly, an estimation of the original cumulative model is performed by comparisons of the maximum COP and cooling power predicted by both the classical formulae and the original cumulative model to numerically obtained results. Eight thermoelectric materials (labeled as n = 1-8) with state-of-the-art ZT values near room temperature are used in the estimation, and their properties are presented in Figure 1 and Figure 2 (just to avoid busy graphs). To cover as many cases as possible, the former seven Bi2Te3 based materials are chosen in such a way that they show the peak ZT at different temperatures from 300 K to 450 K[19-25], while the last one is the SnSe crystalline material reported by Liu et al.[26], whose ZT is ~1.5 at 300 K and rises all the way to ~2.6 at 625 K. Since the properties of the above materials were mostly reported above 300 K, the estimated range of Tc is set to 300-350 K, which fits well with the electronics cooling applications. Following an analysis of the prediction errors, a refined cumulative model is presented to give more accurate predictions of the maximum cooling power. Finally, our model is able to predict the maximum COP within ±2% and the maximum cooling power within ±5% in a practically meaningful ∆T range of 10-70 K. The model is also applied to the commercial P and N type Bi2Te3-based materials with available property data[27] for sub-ambient cooling, and gives reasonable predictions of the maximum cooling power in a Tc range of 230-280 K and a ∆T range of 10-50 K. This work fills the gap between the classical formulae and the real-world thermoelectric cooling performance under finite temperature differences, which could be beneficial to the development and application of thermoelectric conversion technology for cooling purposes.
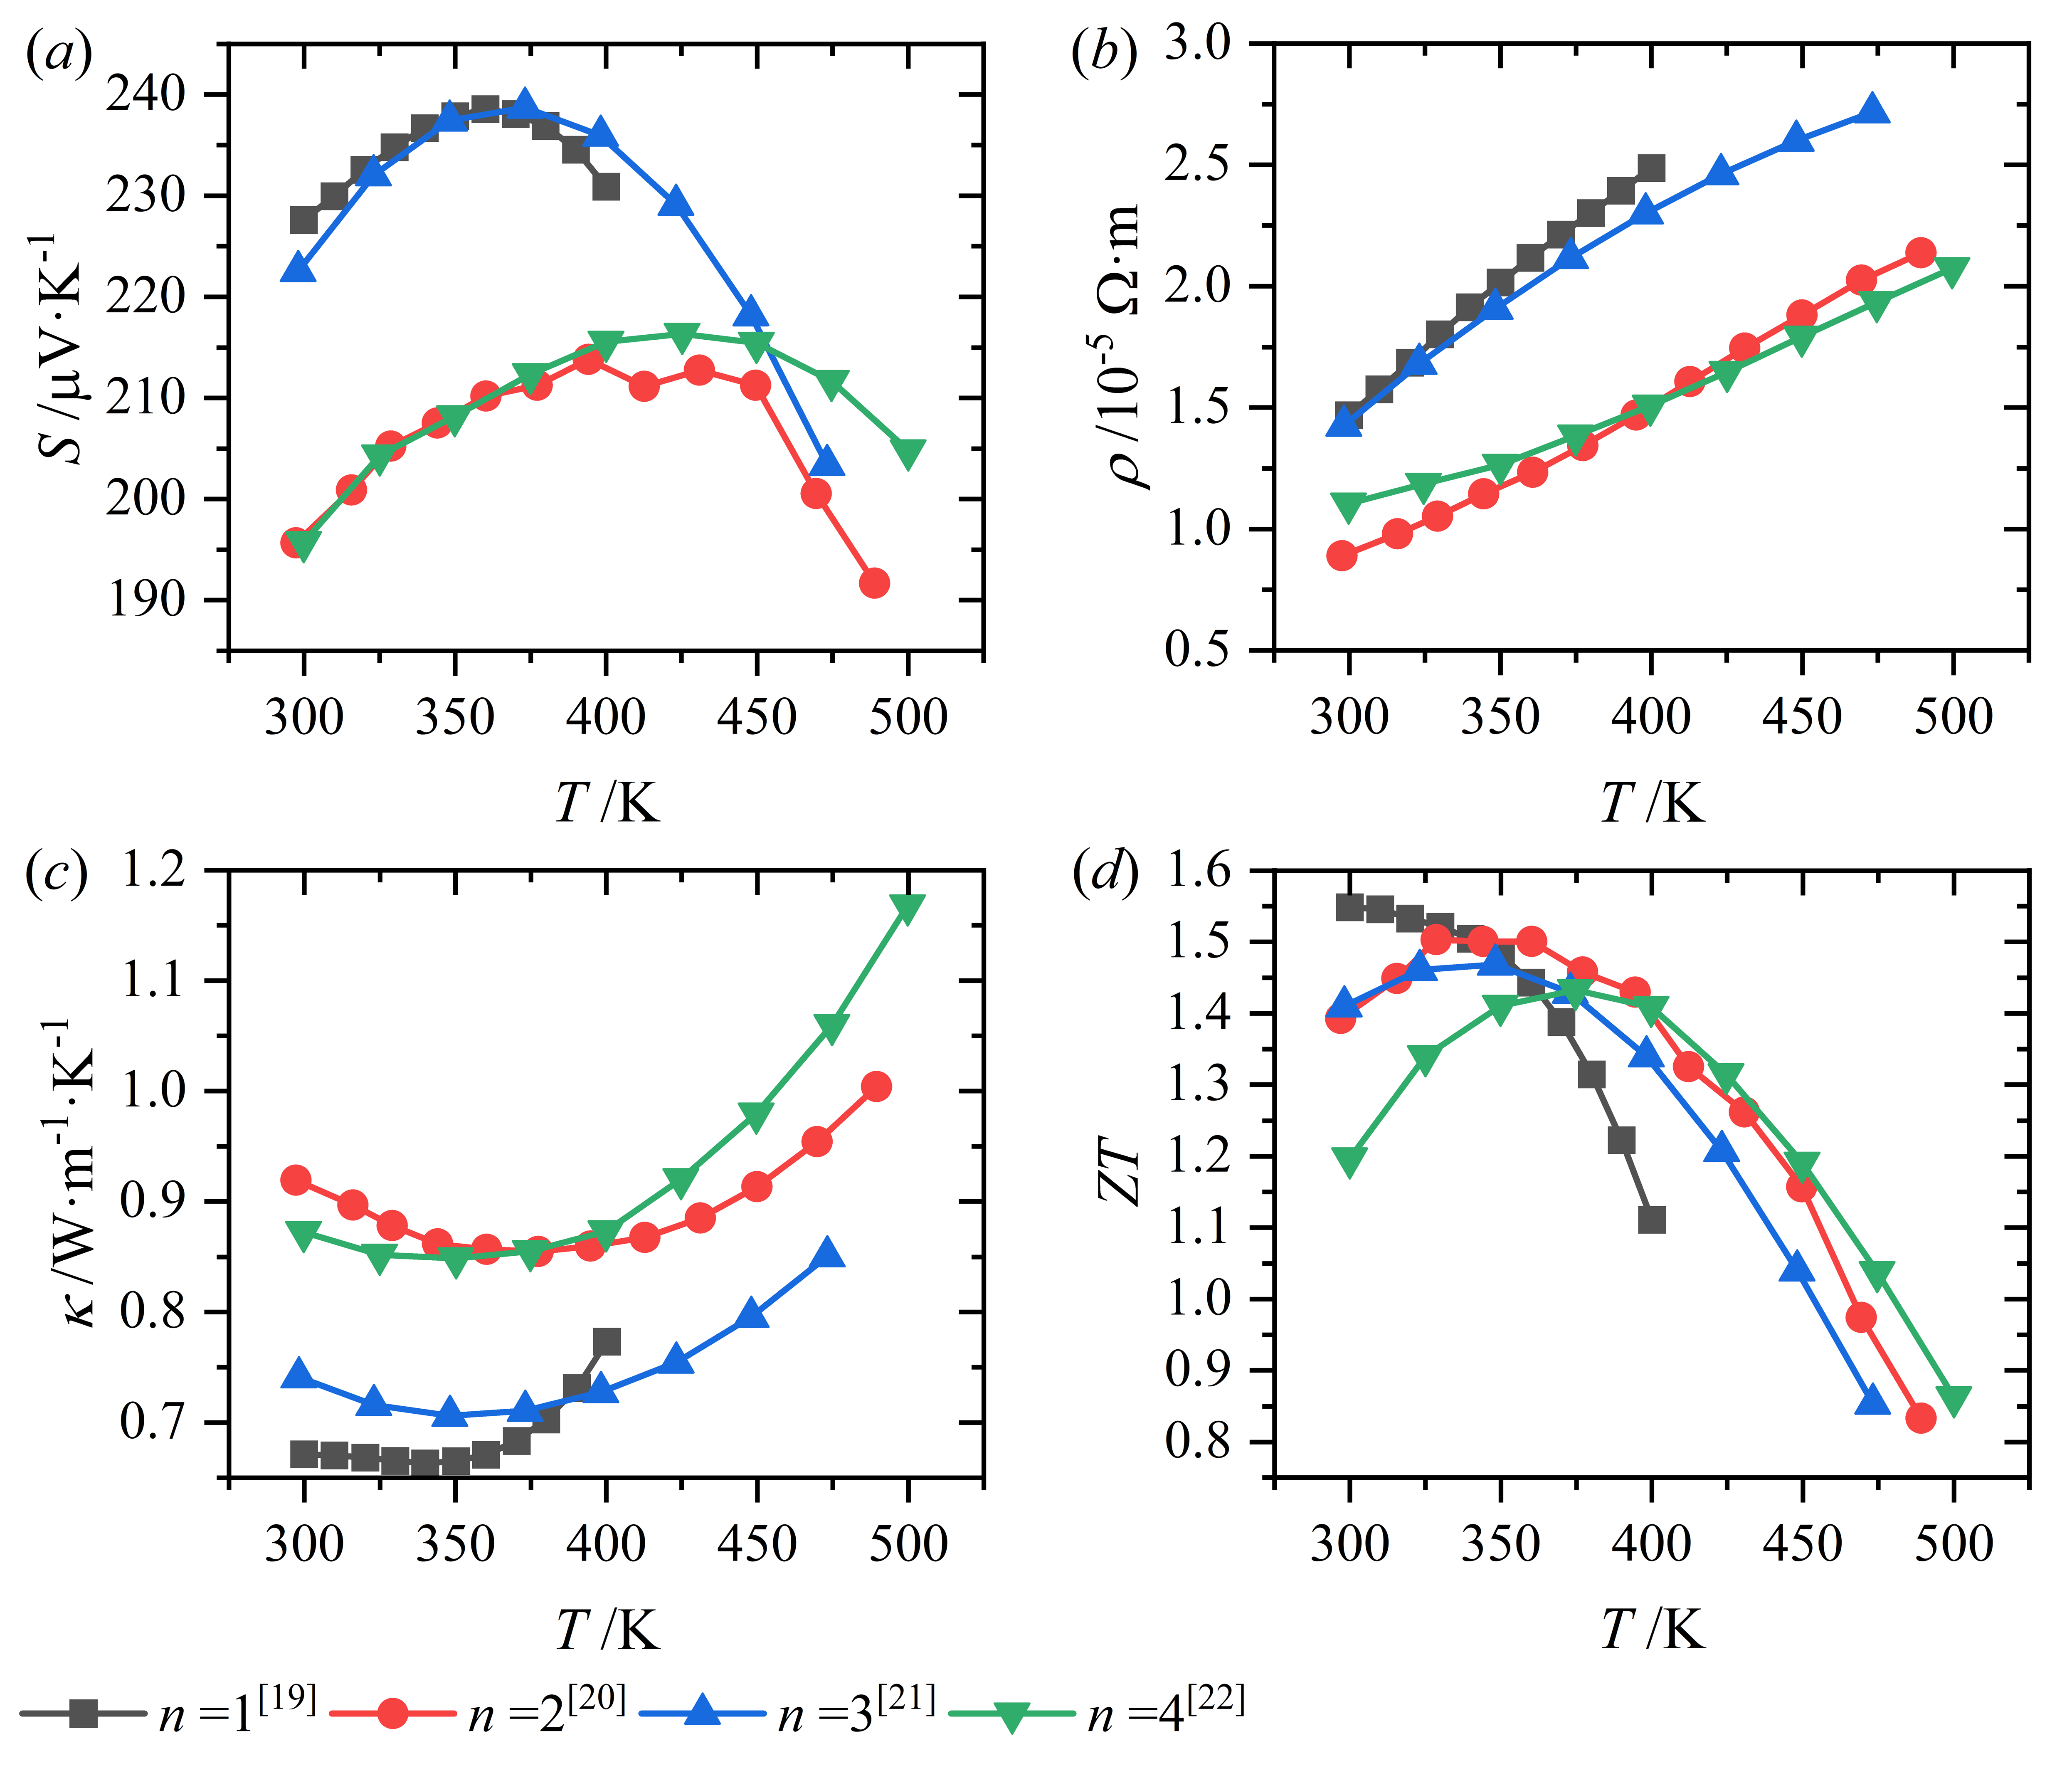
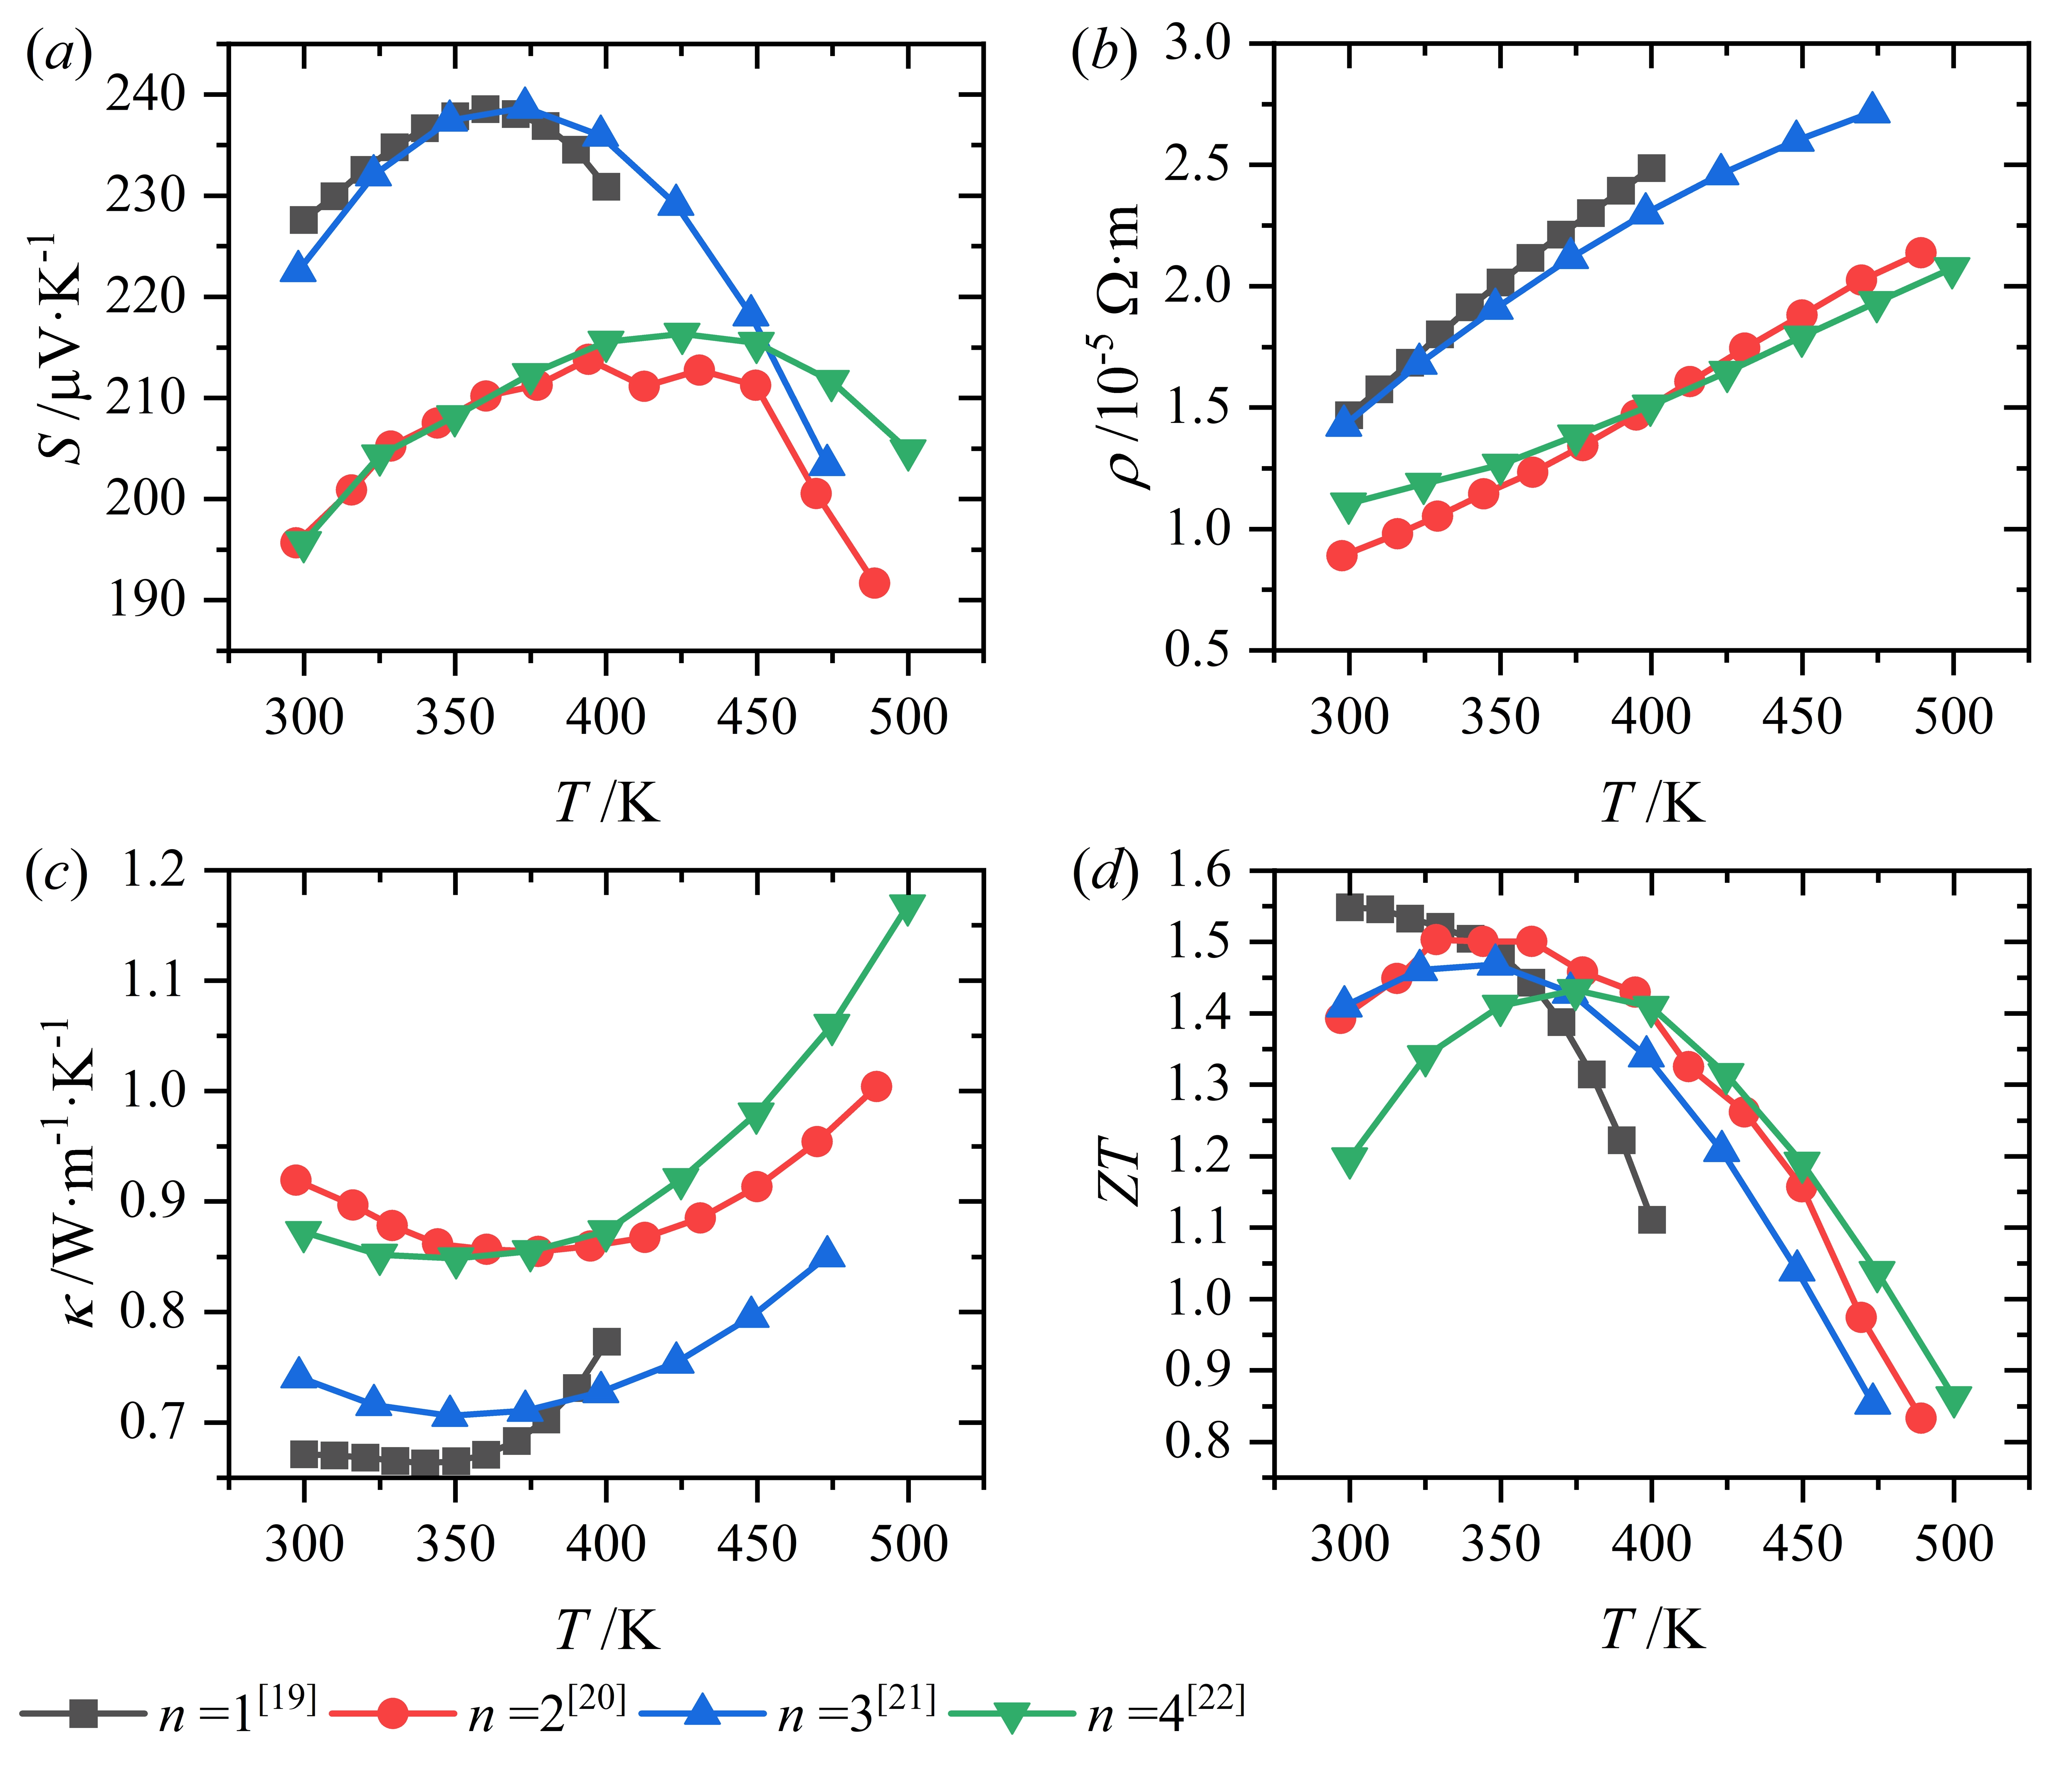
Figure 1. Physical properties of the studied thermoelectric materials (n = 1-4). (a) Seebeck coefficient; (b) Electrical resistivity; (c) Thermal conductivity; (d) ZT value.
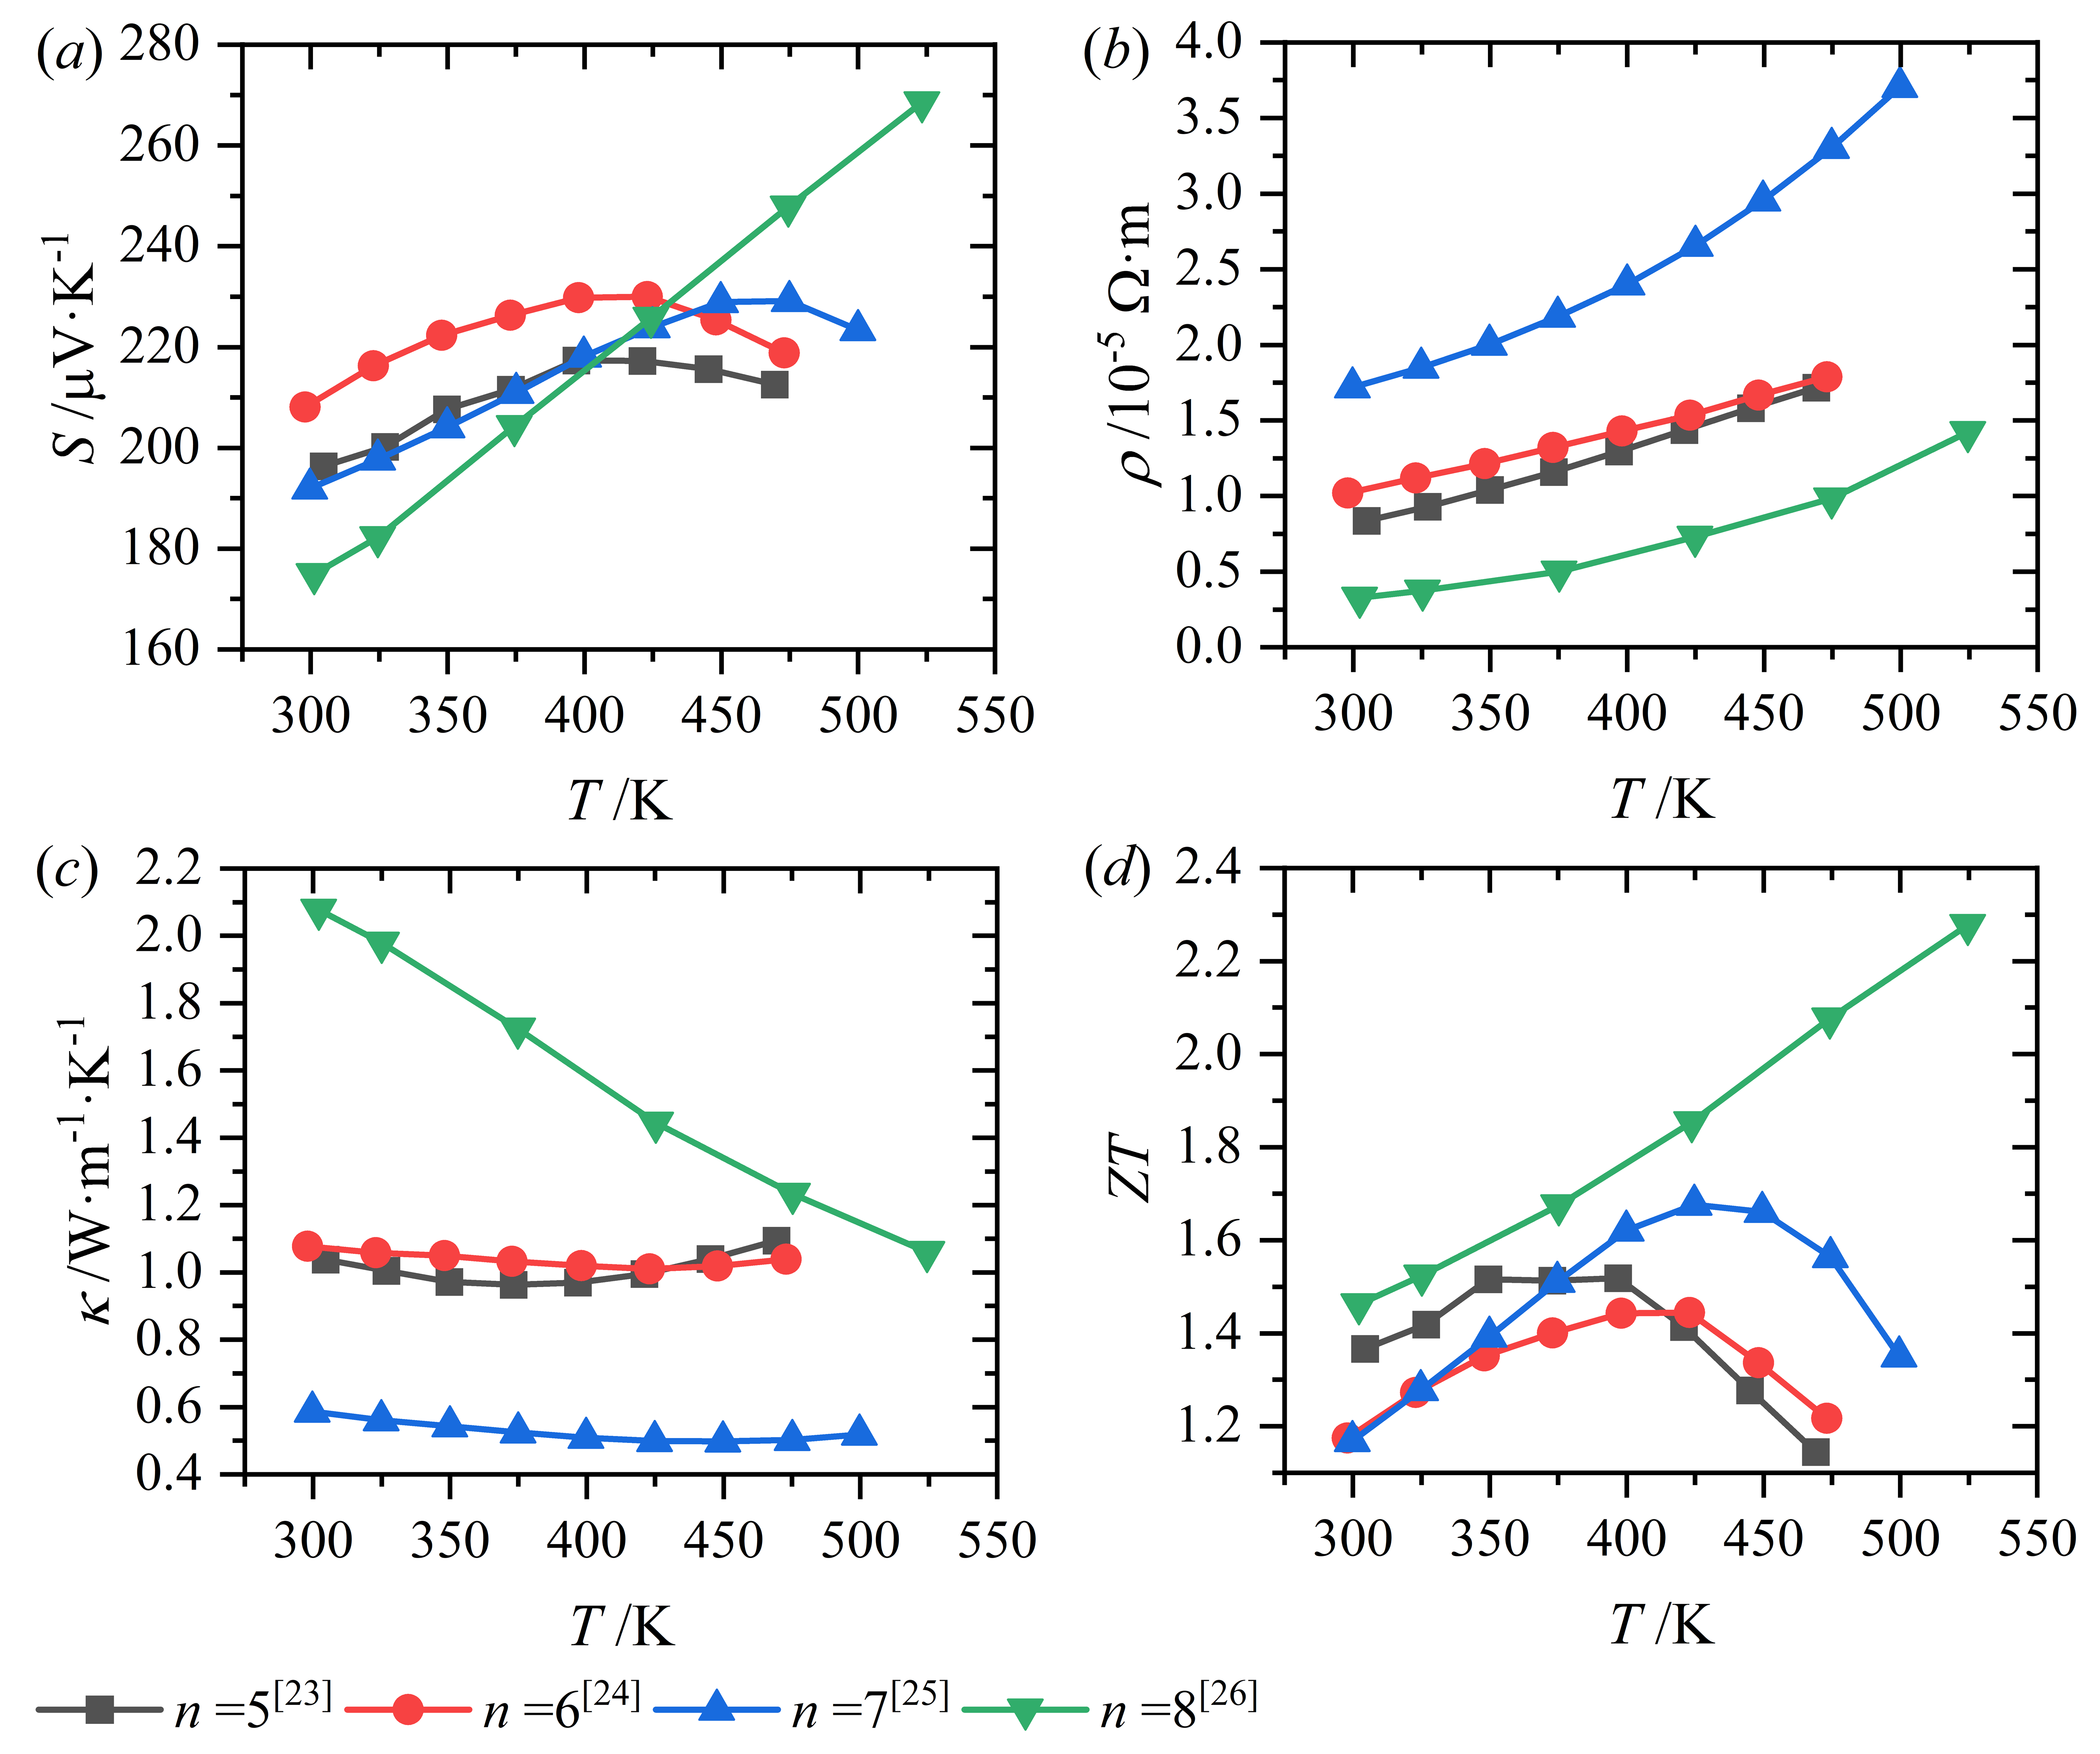
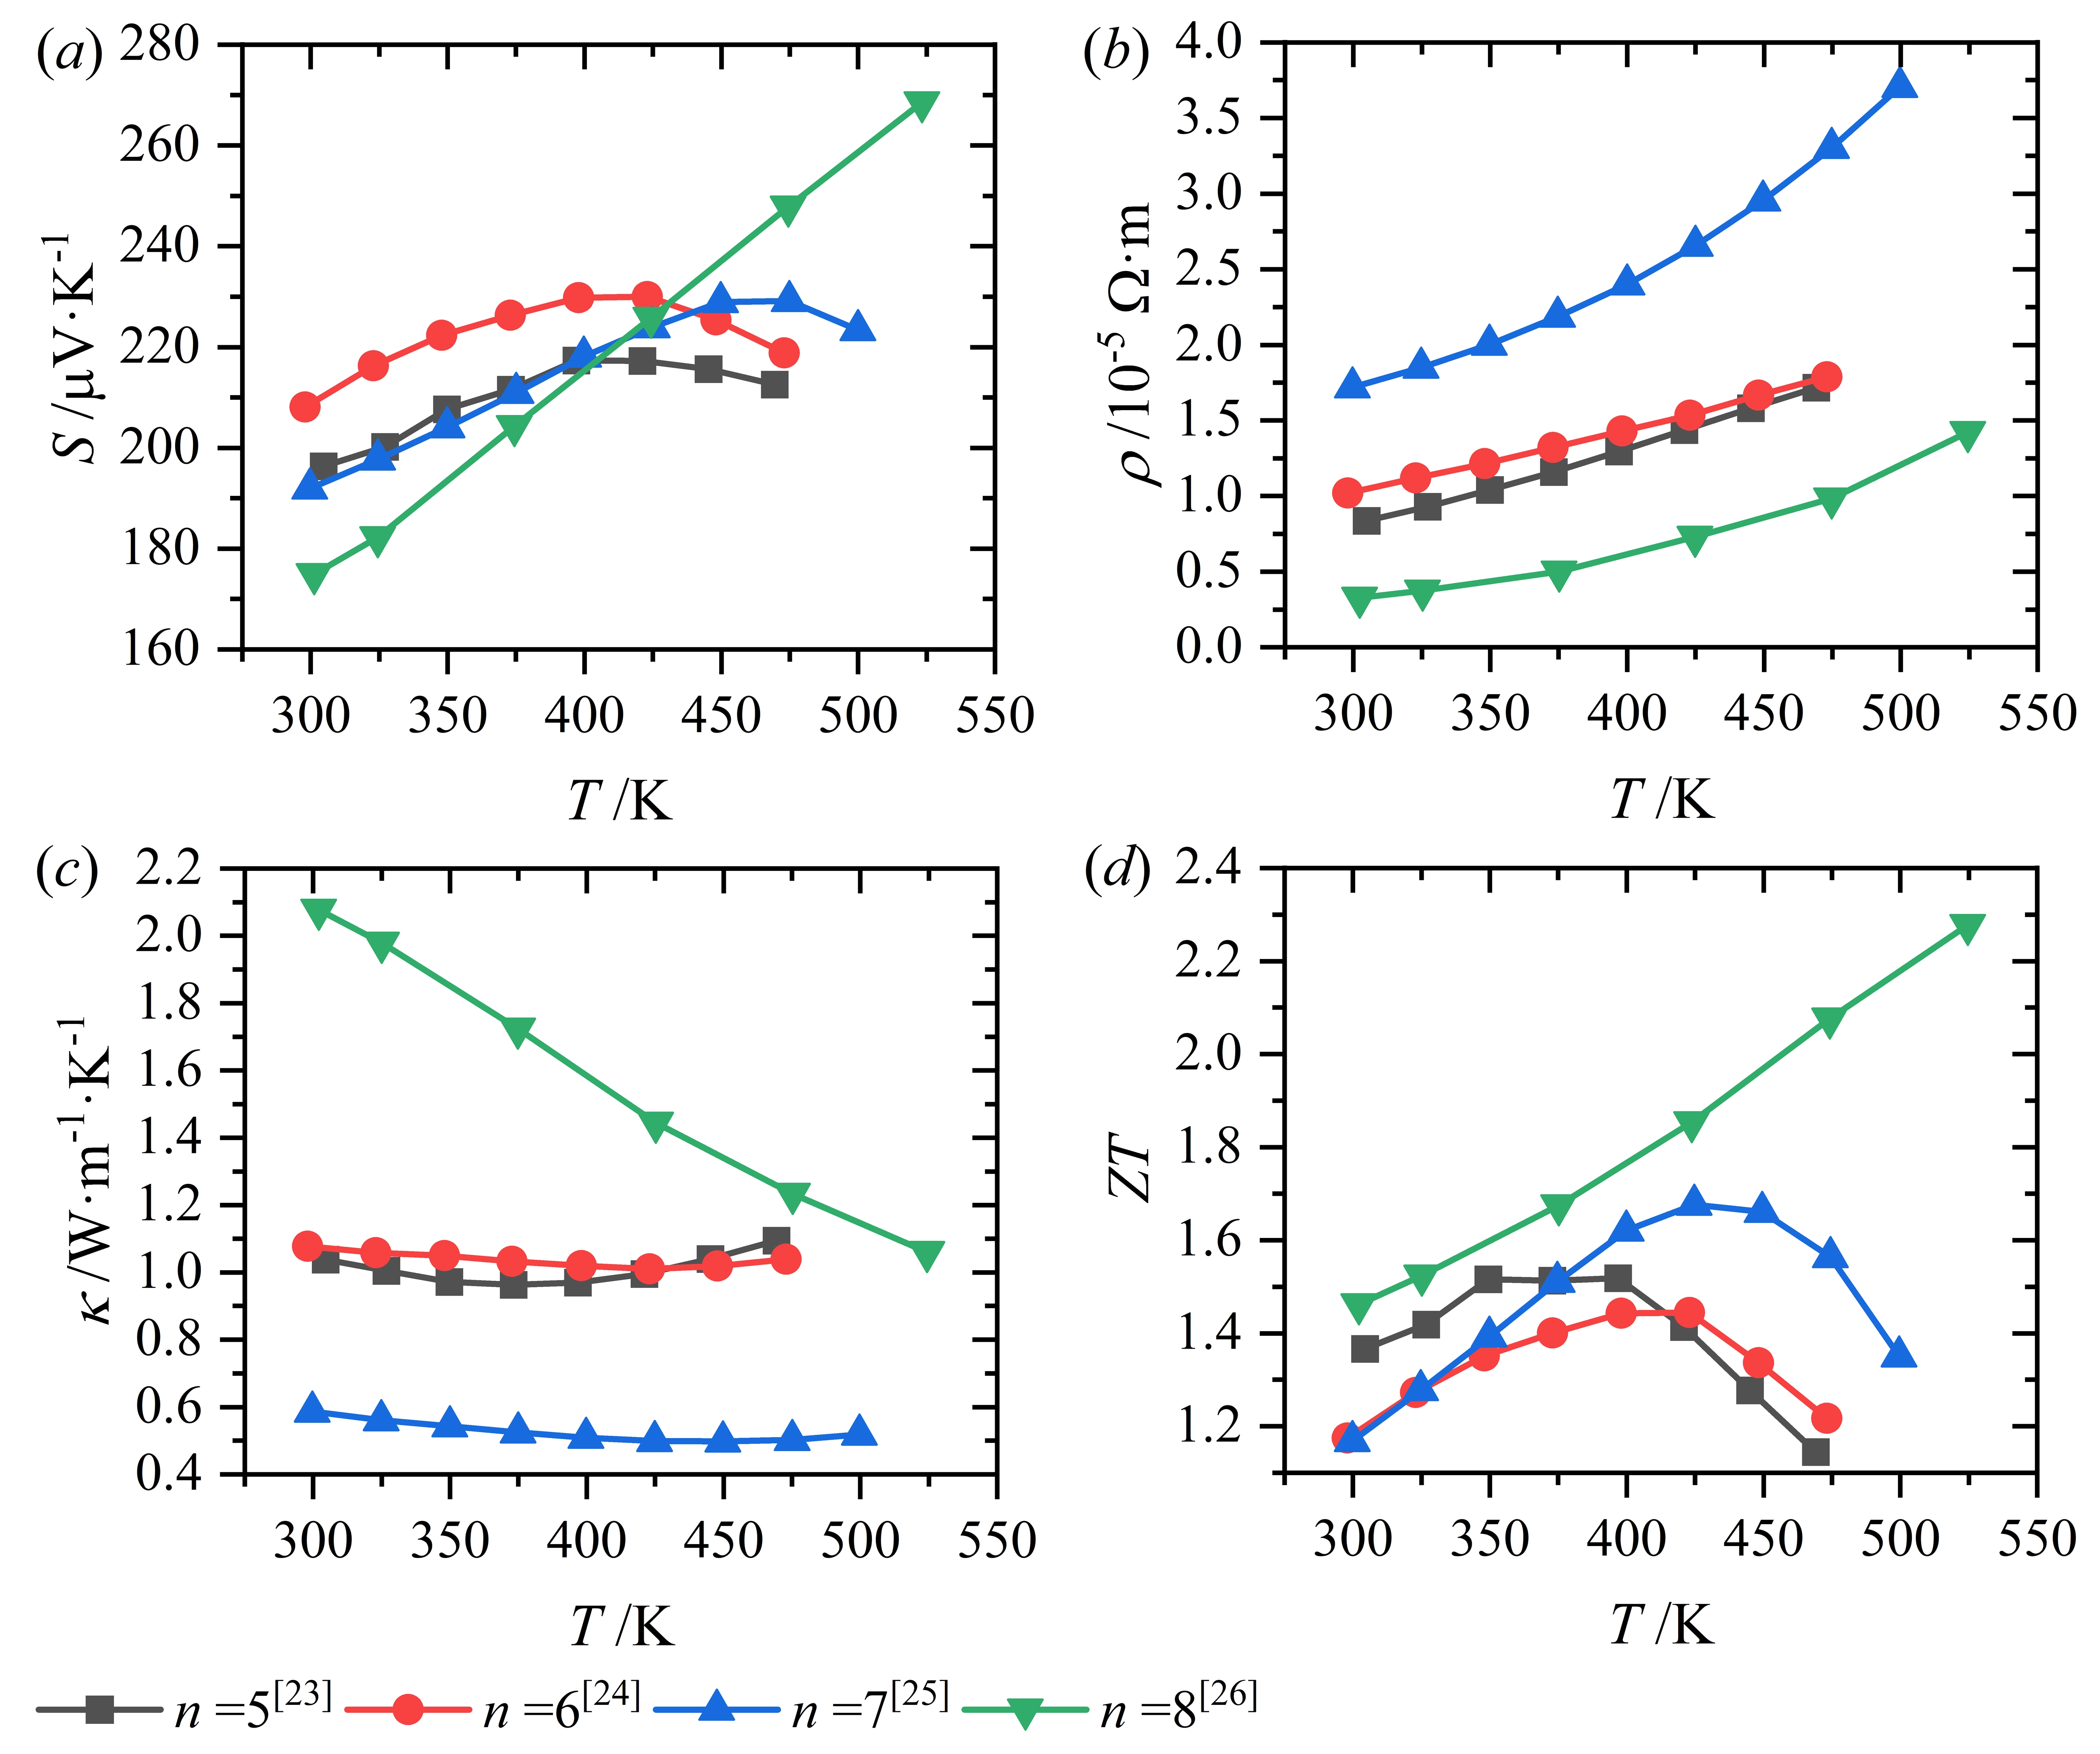
Figure 2. Physical properties of the studied thermoelectric materials (n = 5-8). (a) Seebeck coefficient; (b) Electrical resistivity; (c) Thermal conductivity; (d) ZT value.
2. Methods
2.1 The original cumulative model
To establish a baseline for comparison, the original cumulative model must first be adapted for cooling applications. The derivation of the analytical expressions for the maximum COP and nondimensional cooling power is similar to that in our previous study for thermoelectric power generation, so they are directly written here and the detailed information can be found in SI.
where
and
The expressions in Eq. (3) are in similar forms with those in Eq. (1a) and Eq. (2), and the (ZT)eng as well as the involved coefficients defined by Eqs. (4-5) can be obtained by integrations of the material properties within the operating temperature range.
2.2 Validation of the model
To obtain the numerical reference solutions, the complete governing equations of the thermoelectric element were solved iteratively with temperature-dependent material properties. Starting from an initial temperature distribution, the local thermoelectric properties were updated according to the calculated temperature field, and the governing equations were repeatedly solved until convergence was achieved. The converged numerical results for the temperature distribution, maximum COP, and cooling power were then used as benchmark solutions for validating the proposed analytical models. The predicted maximum COP and cooling power by both the classical formulae (in which the integral average value of Z,
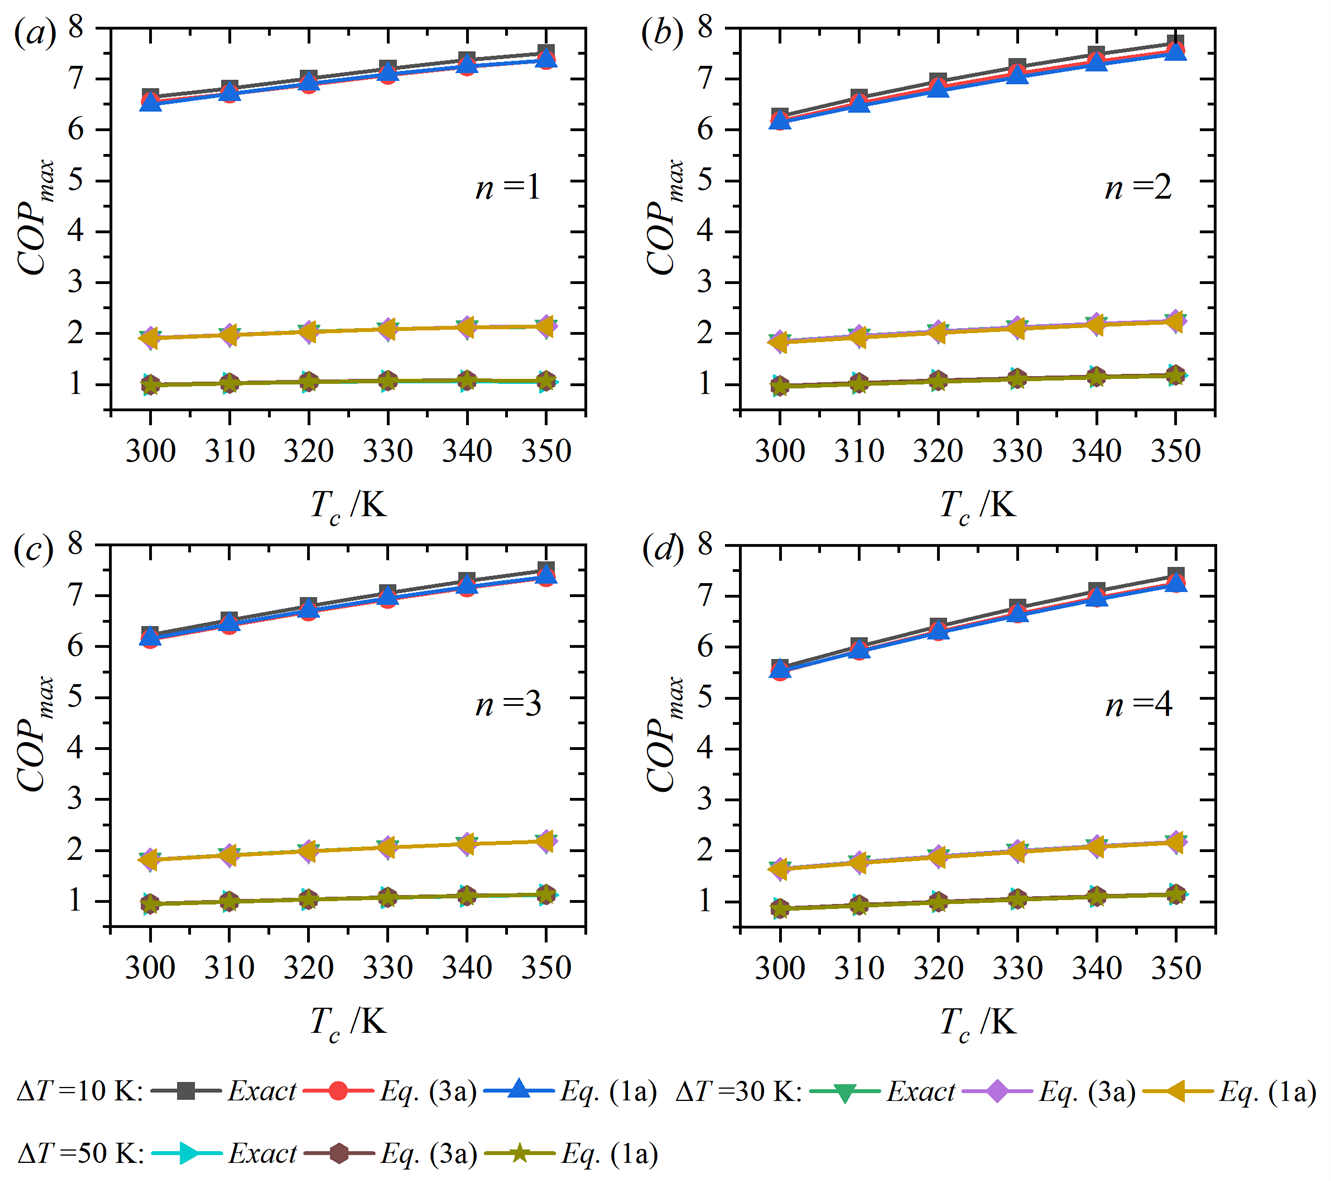
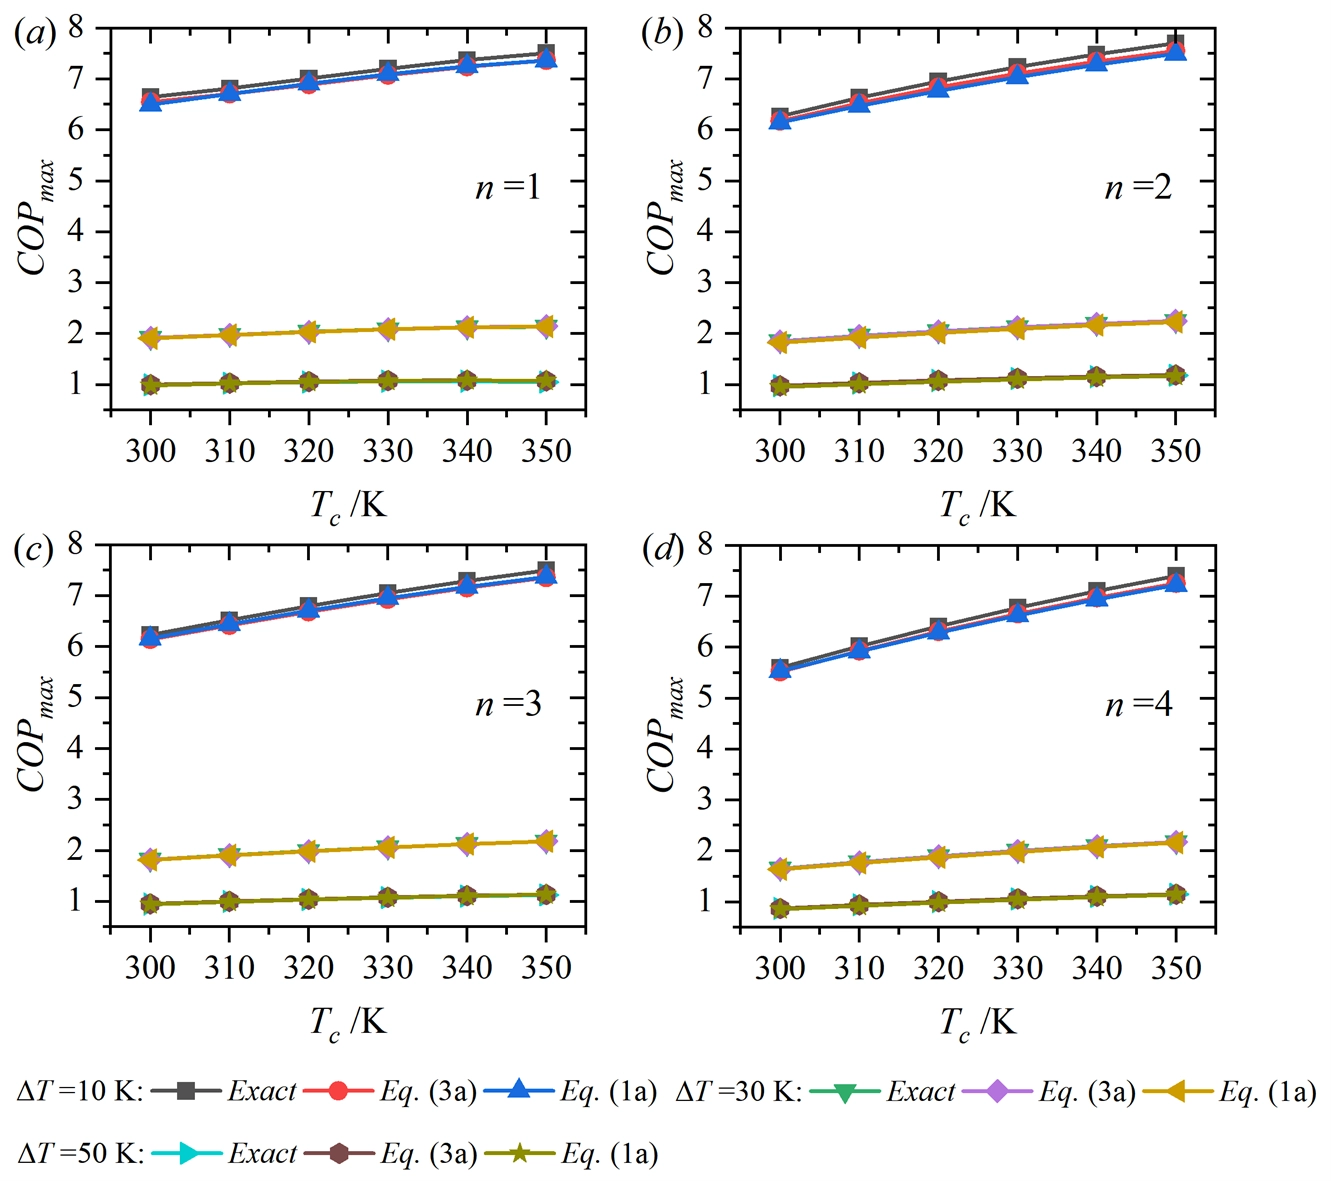
Figure 3. Comparisons of predicted maximum COP by Eqs. (3a) and (1a) to numerical results (n = 1-4). COP: coefficient of performance.
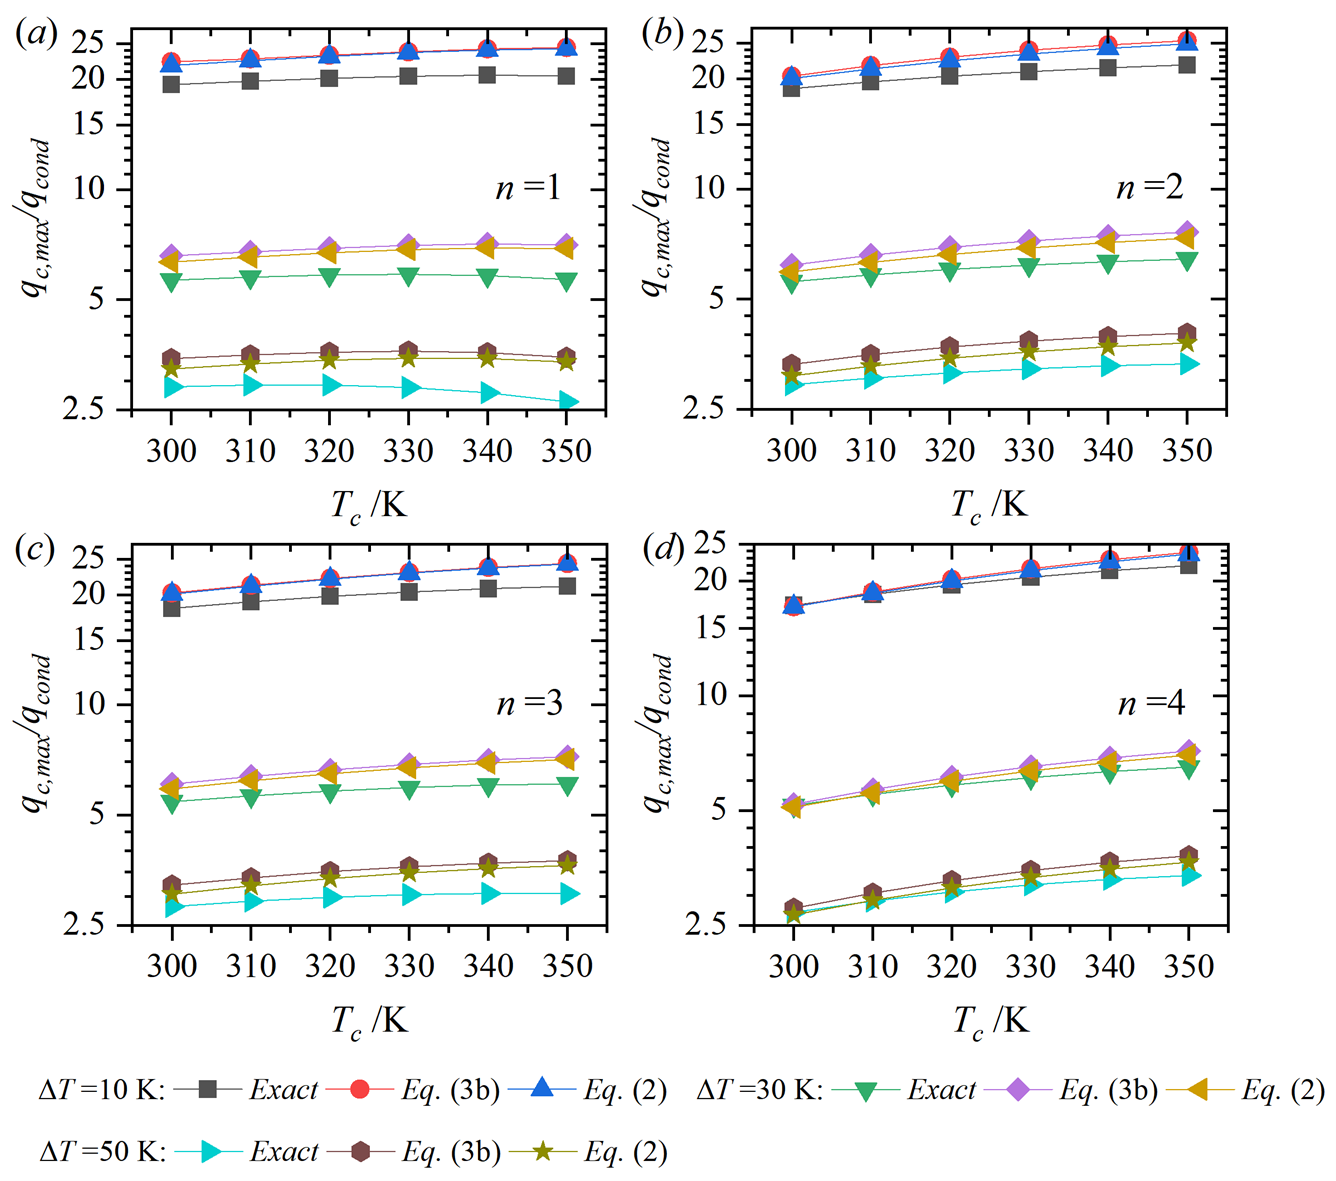
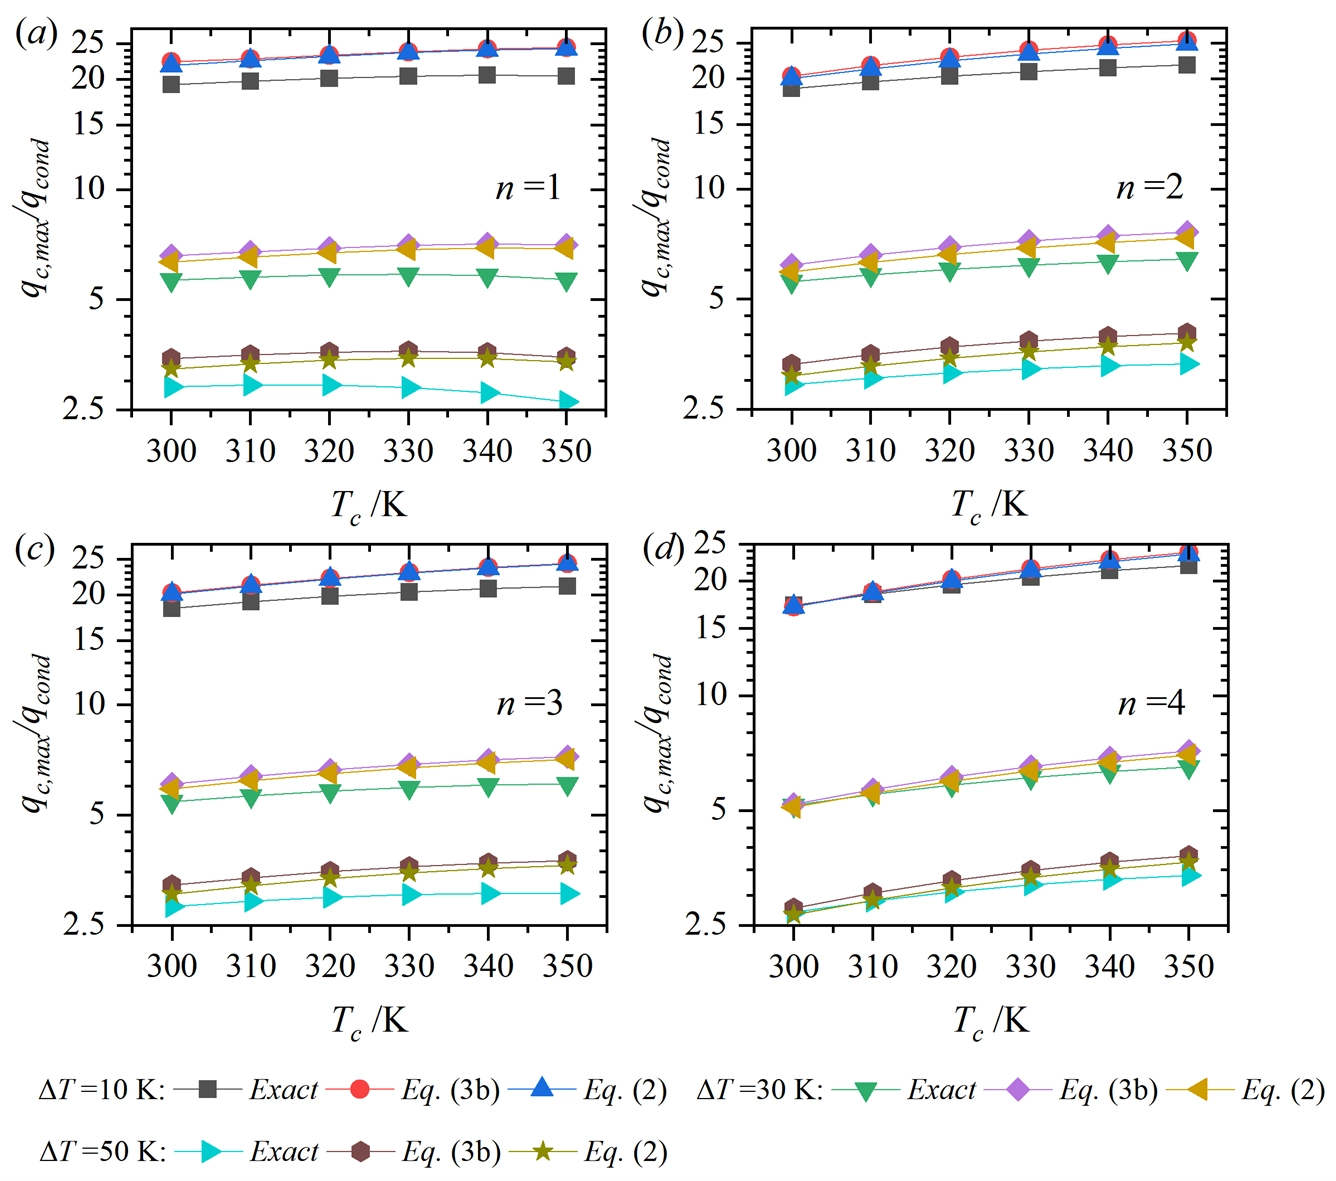
Figure 4. Comparisons of predicted maximum nondimensional cooling power density by Eqs. (3b) and (2) to numerical results (n = 1-4).
The results demonstrate that the maximum COP is closely predicted by both the classical formula given by Eq. (1a) and the original cumulative model given by Eq. (3a) for all of the eight materials in the current ∆T and Tc ranges. However, the predictions of the maximum nondimensional cooling power density by both Eq. (2) and Eq. (3b) exhibit discrepancies as shown in Figure 4 and Figure S2. Even if ∆T is as low as 10 K, the average error of Eq. (3b) reaches ~17% for the first material (n = 1). The error bands of the maximum COP by Eq. (3a) and cooling power by Eq. (3b) are further shown in Figure 5. While the cumulative model provides reliable prediction for the maximum COP, it exhibits significant discrepancies in estimating the cooling power density with errors exceeding 30%. Consequently, the cumulative model offers no significant advantage over classical formulae for evaluating thermoelectric cooling performance. Therefore, to enhance the reliability of cooling power analysis, a refined model is essential, following a thorough investigation into the sources of error in the original cumulative framework.
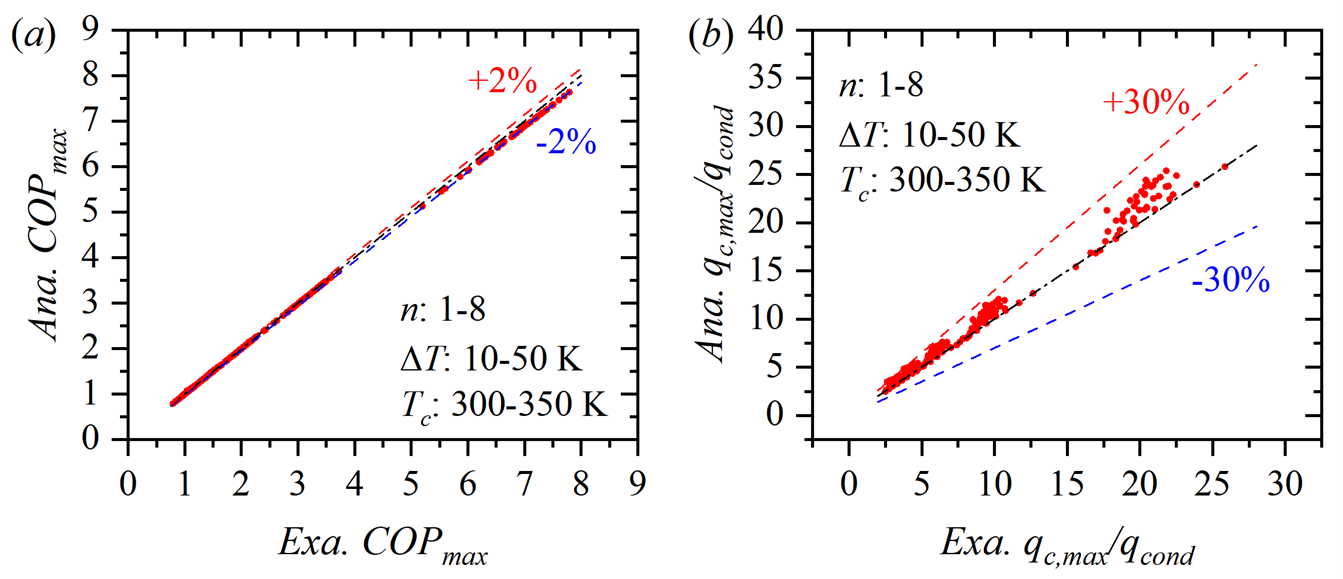
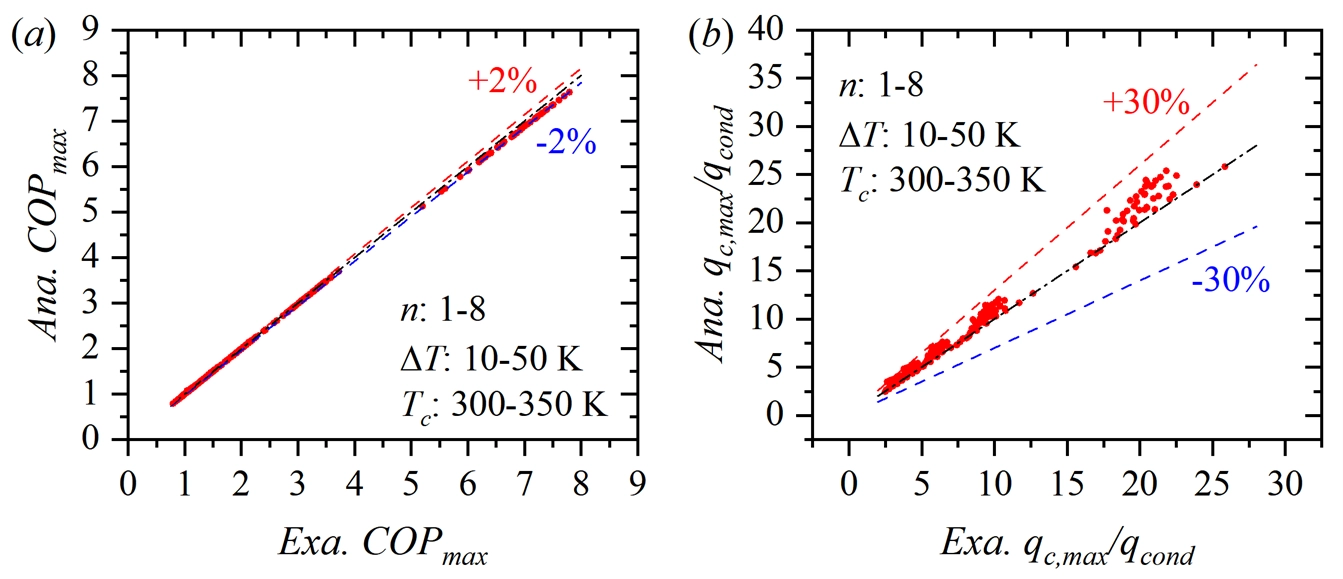
Figure 5. Error bands for predictions of (a) maximum COP by Eq. (3a); (b) Nondimensional cooling power density by Eq. (3b). COP: coefficient of performance.
3. Results and Discussion
3.1 Analysis of the prediction error
To investigate the large prediction errors of the maximum cooling power by Eq. (3b), it is necessary to revisit the derivation process (SI). The primary assumption made is the linear temperature distribution when converting the variables of the single and double integrals from x to T, as shown in Eqs. (S9,S10,S11). To check the rationality of the above assumption, the temperature distribution within the thermoelectric element is extracted from the numerical results for both the maximum COP case and the maximum cooling power case, as illustrated in Figure 6a. It is obviously seen that the temperature distributions in the maximum COP cases under various ∆T well support the linear assumption, explaining the good predictions of the maximum COP by Eq. (3a).
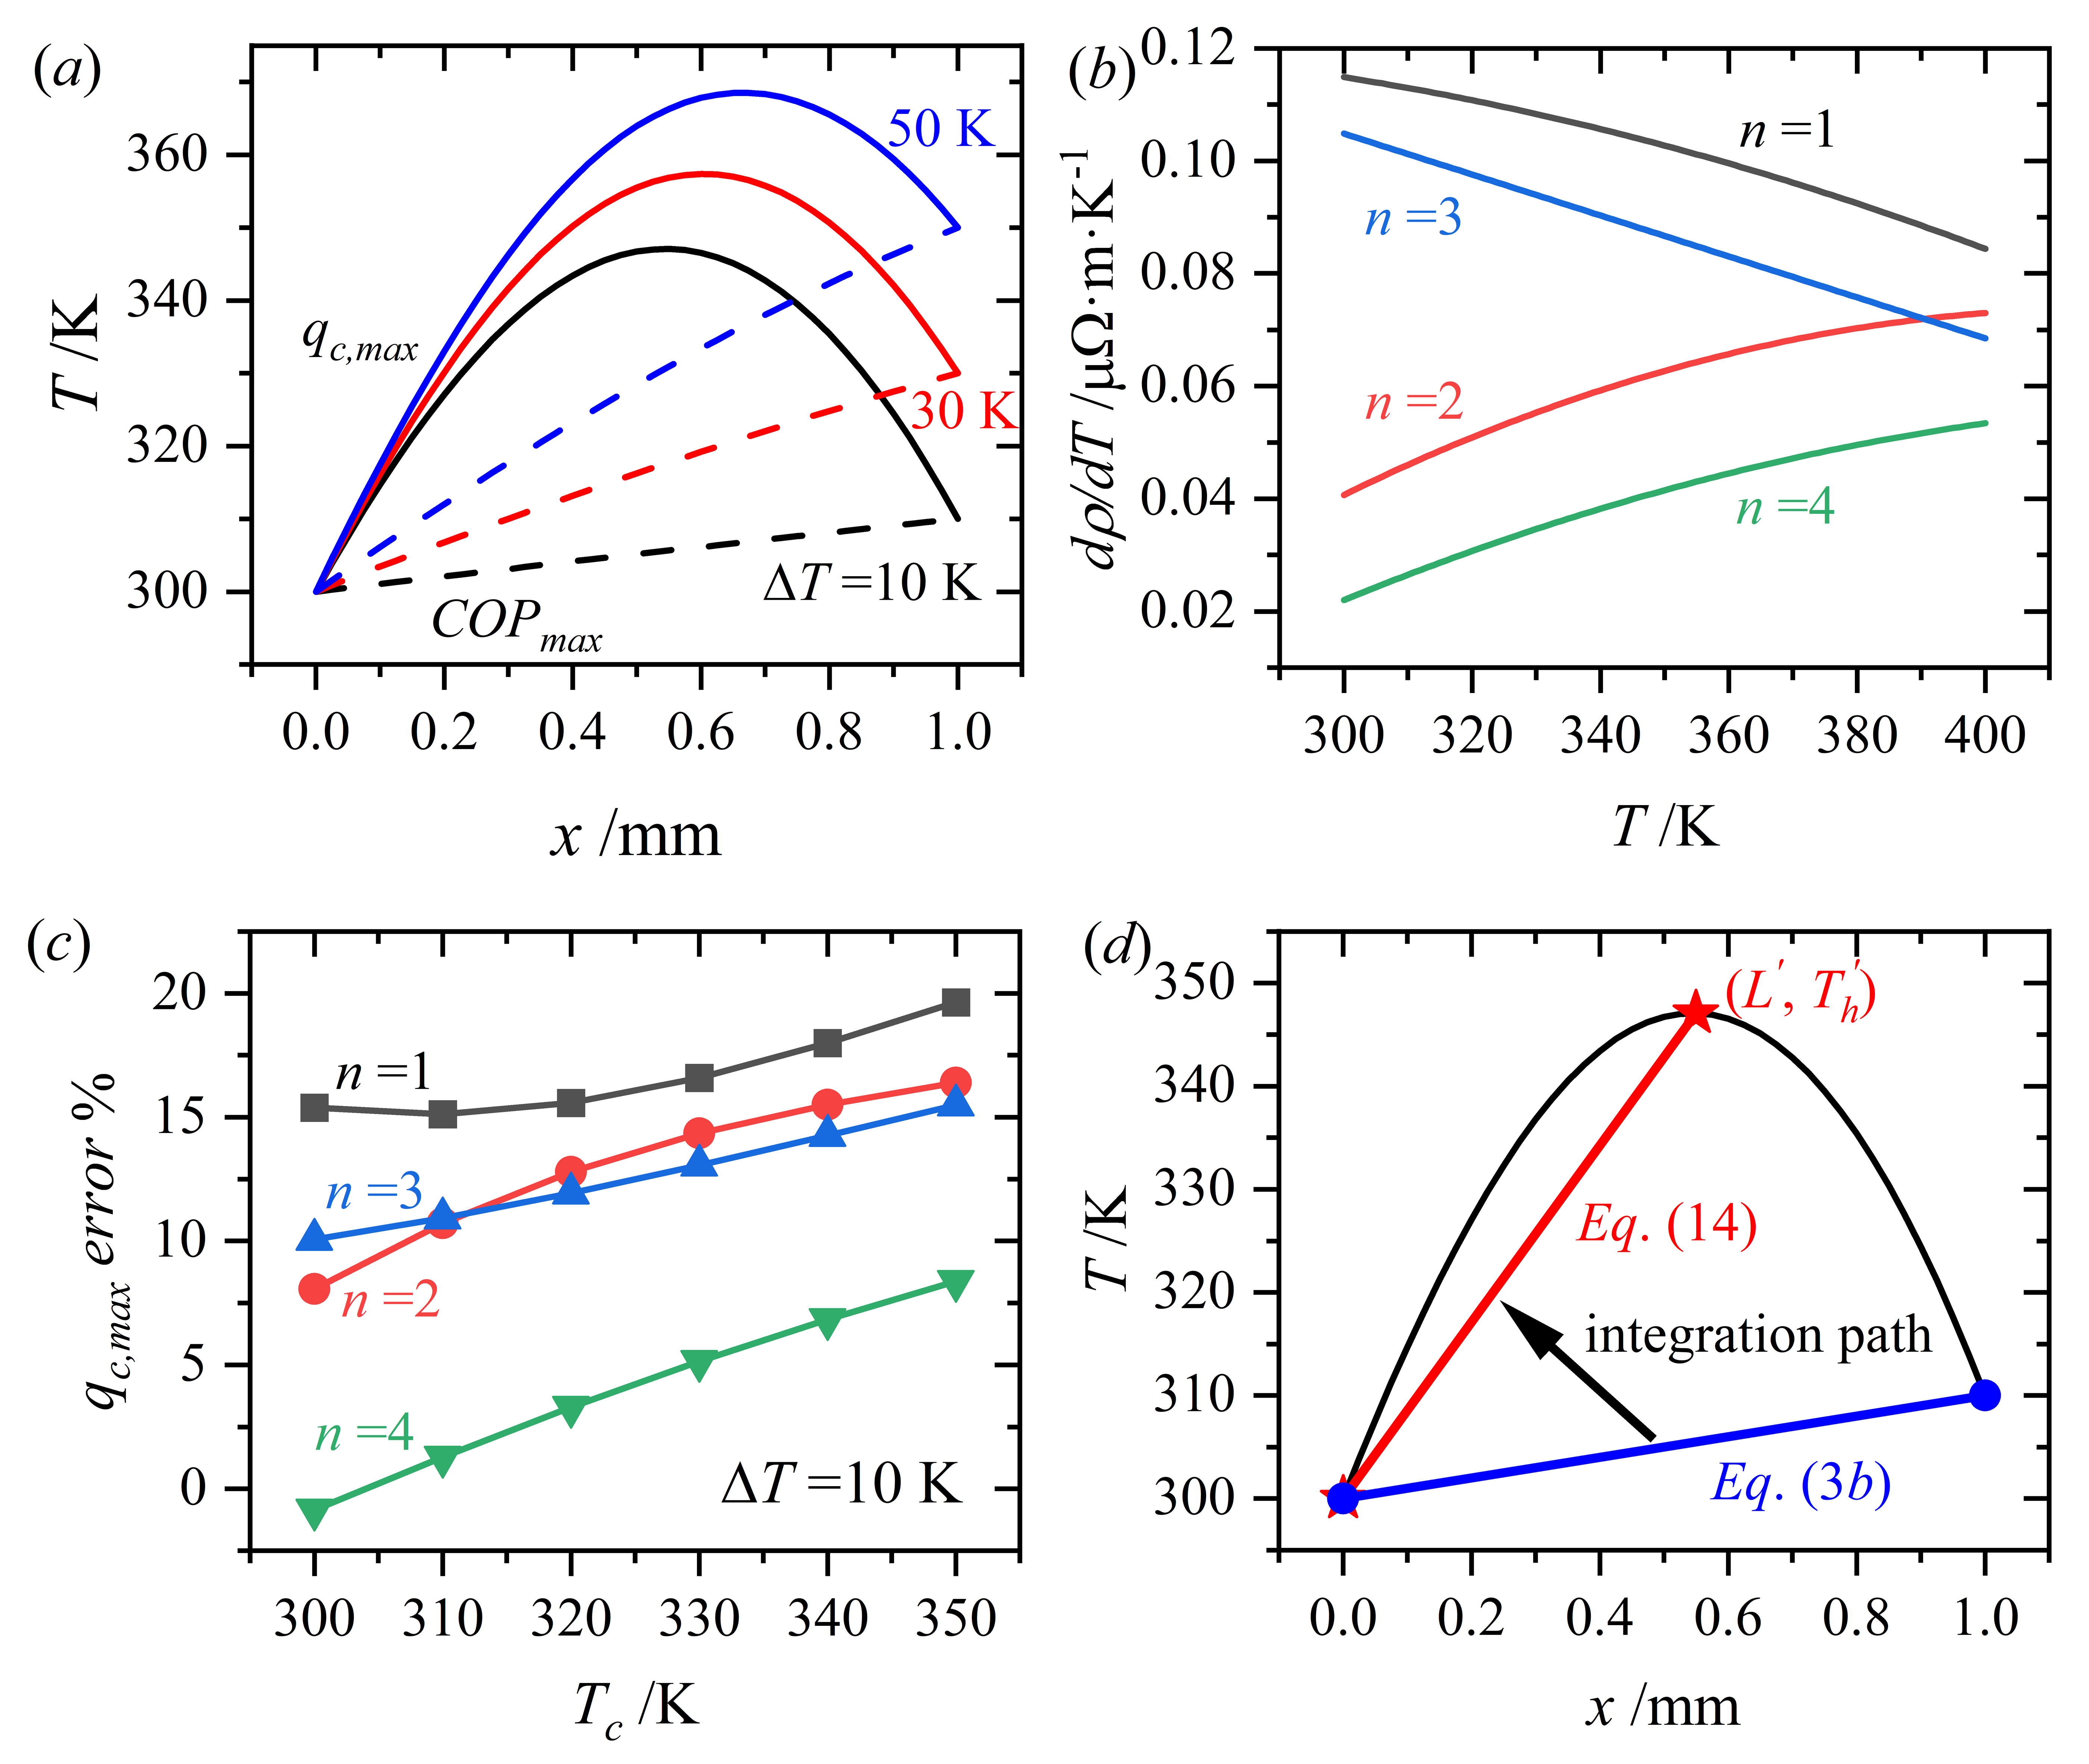
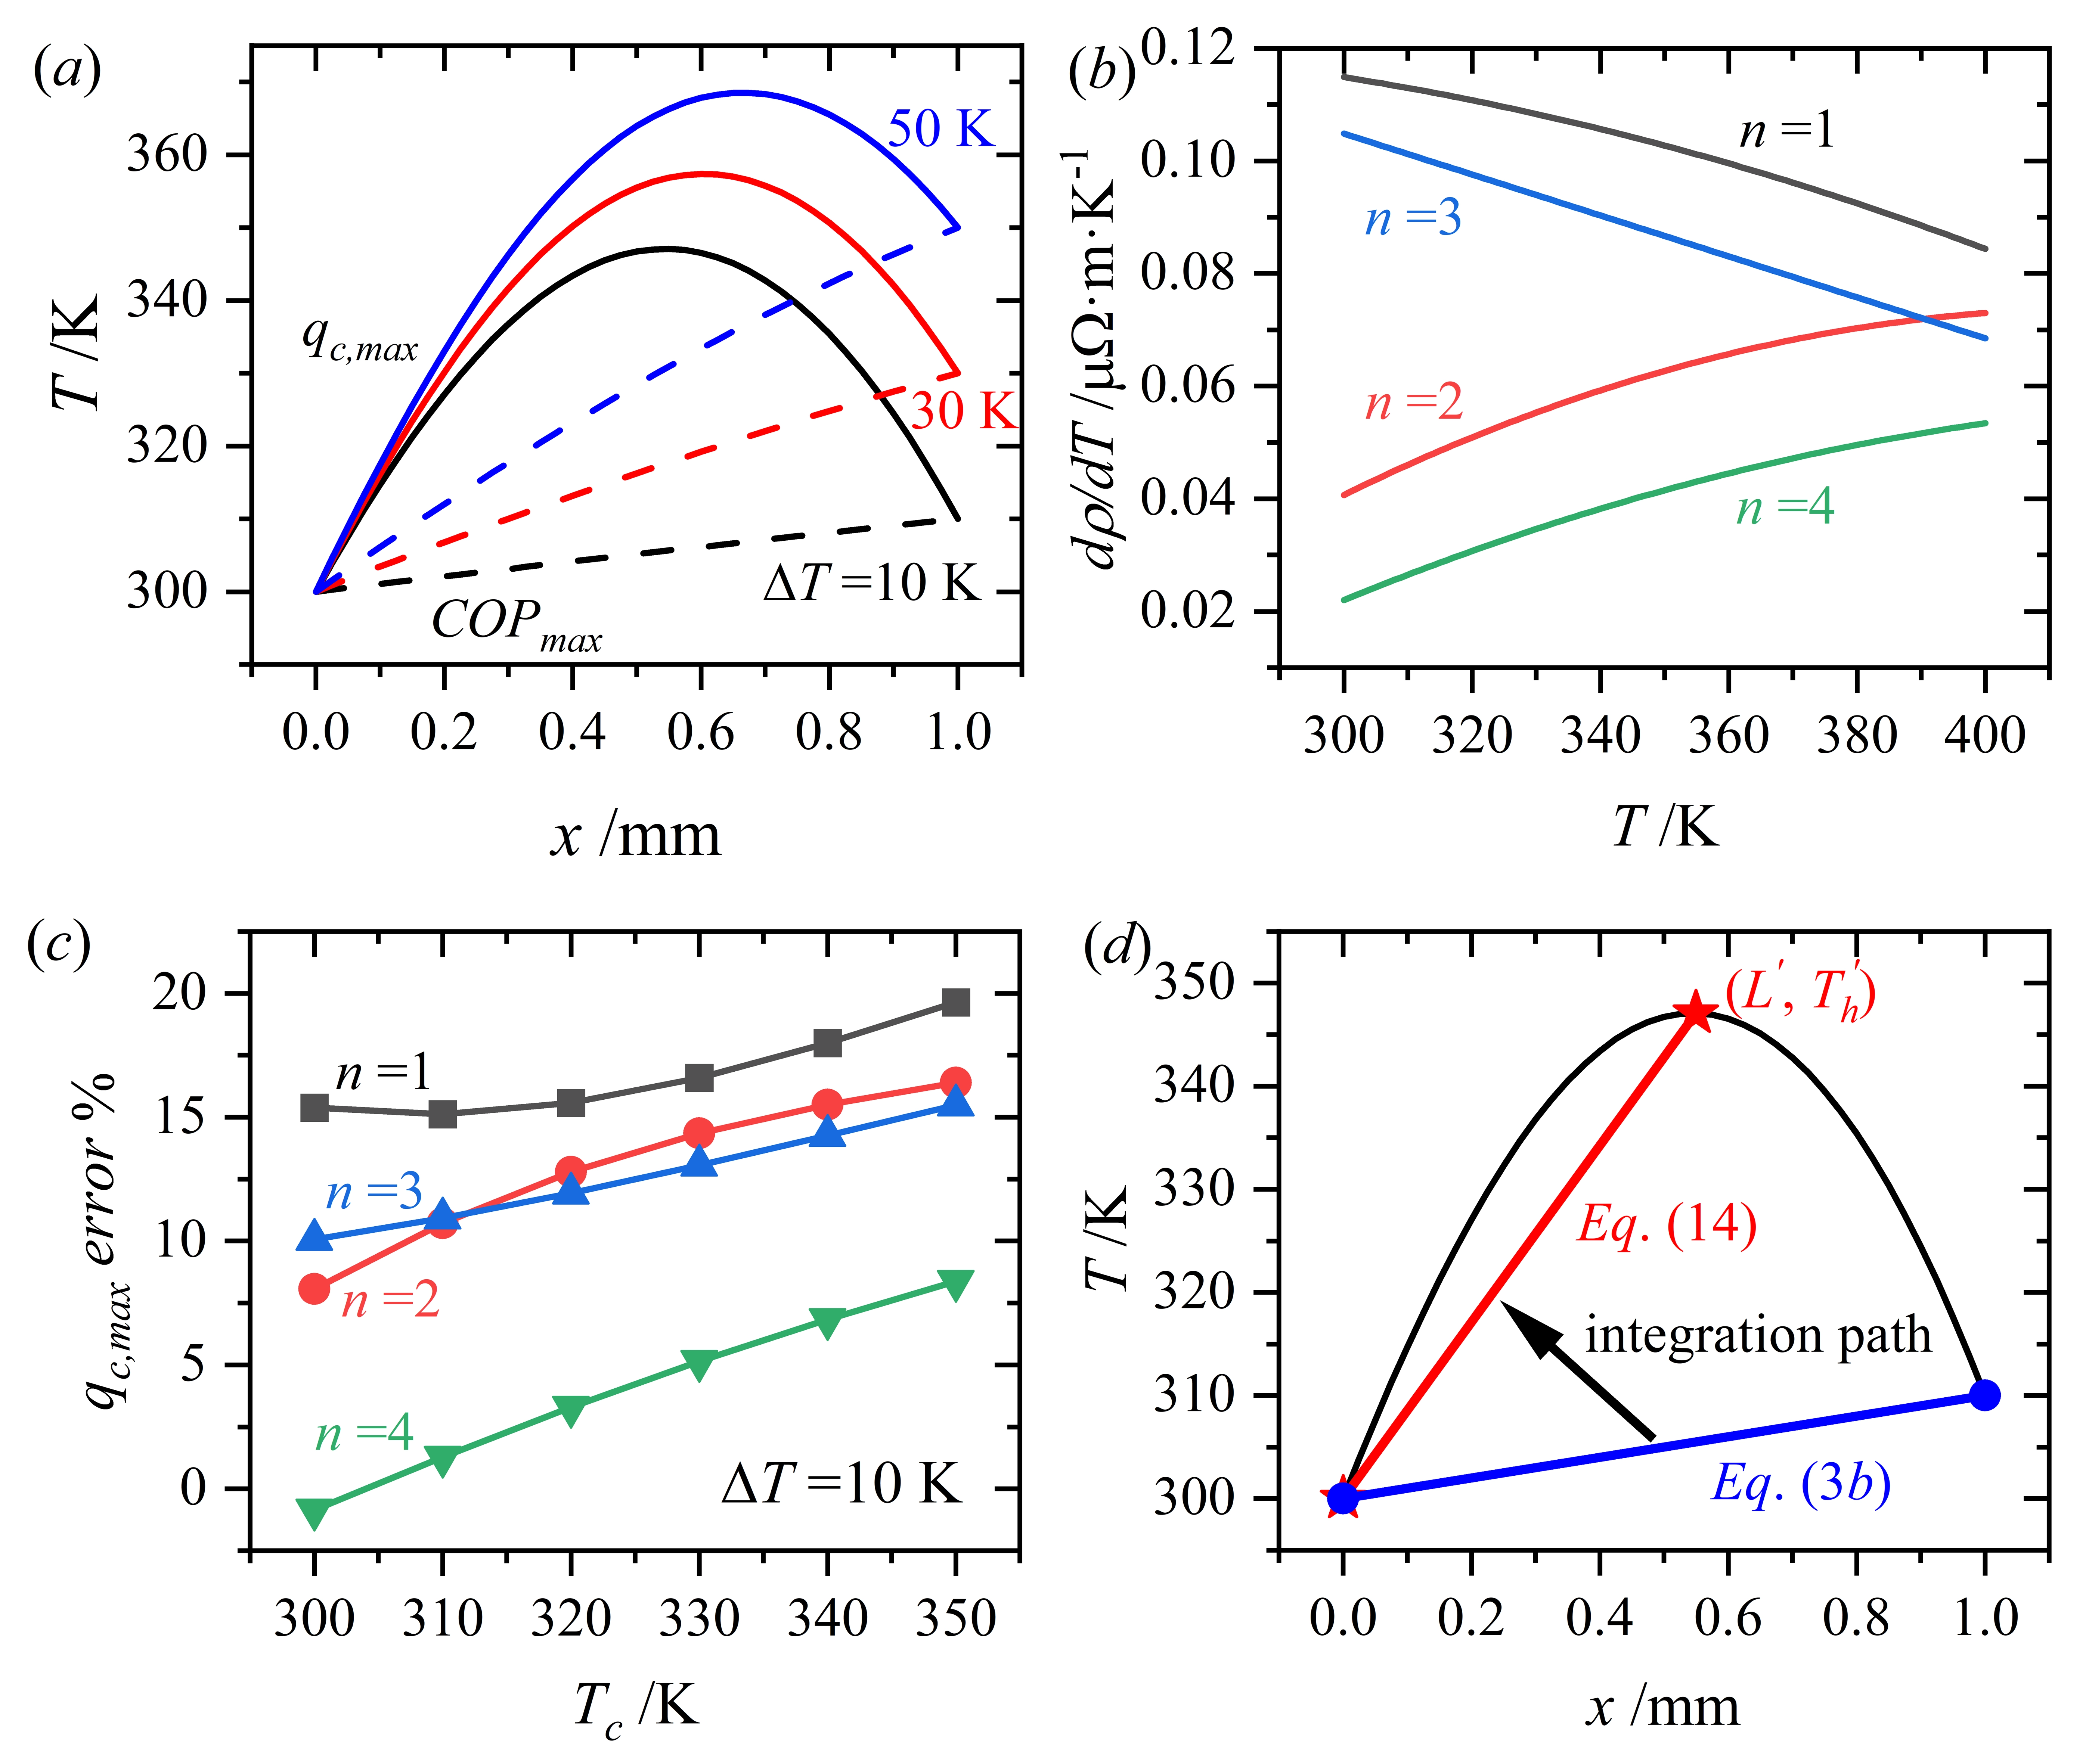
Figure 6. (a) Temperature profiles in maximum COP and cooling power modes under different ∆T; (b) Varying rates of electric resistivities with respect to temperature for materials n = 1-4; (c) Prediction errors of maximum cooling power for materials n = 1-4 (∆T = 10 K); (d) Change of integration path in the refined model. COP: coefficient of performance.
Nevertheless, the temperature distributions severely deviate from the linear assumption in all of the maximum cooling power cases. Taking ∆T = 10 K as an example, although the terminal temperatures are 300 K and 310 K, respectively, the highest temperature within the element approaches 350 K at the central part of the element. This kind of convex temperature distribution was also noticed by Wang et al.[16] under relatively large electric currents, which is supposed to be the primary reason for the inaccurate predictions of the maximum cooling power. In the case of ∆T = 10 K, the electric resistivity data between 300 K and 350 K should be considered for an accurate evaluation of the element’s electric resistance. However, only those between 300 K and 310 K are included in Eq. (S9) under the assumption of linear temperature distribution. Similarly, the double integrals in Eqs. (S10) and (S11) must also incorporate the property data between 310 K and 350 K. Consequently, some of the constituent terms in the cooling power density analysis are significantly miscalculated due to the assumption. Based on this, one can expect a direct correlation between the prediction errors of the maximum cooling power and the material’s temperature dependence of electric resistivity, i.e., a material with larger varying rates of the electric resistivity with temperature generally yields larger errors. Figure 6b presents the varying rates of the electric resistivities of the former four materials from 300 K to 400 K, and Figure 6c shows the prediction errors of the maximum nondimensional cooling power density for these materials in case of ∆T = 10 K. A positive correlation is clearly seen between the level of electric resistivity’s varying rate and that of the prediction error among the four materials, which convincingly supports the previous explanation. Therefore, to accurately evaluate the maximum cooling power between Tc and Th, it is necessary to account for comprehensive material property data, rather than limited property data just between Tc and Th.
3.2 Refined cumulative model
Based on the above discussion, a possible way to refine the original cumulative model is proposed. As illustrated in Figure 6d, by changing the integration path of the governing equation (Eq. (S1)) from 0→L to 0→L', with L' denoting the location of the highest temperature T'h, the deviation of the local temperature curve from a linear one is reduced, and all of the property data between Tc and T'h are involved in the integration. By doing so, the prediction capability of the maximum cooling power is expected to be enhanced. Figure 7 provides a schematic illustration of the heat-flow partition of Joule and Thomson heat under a convex temperature profile, which offers a physical interpretation for the modified integration path adopted in the revised cumulative model.
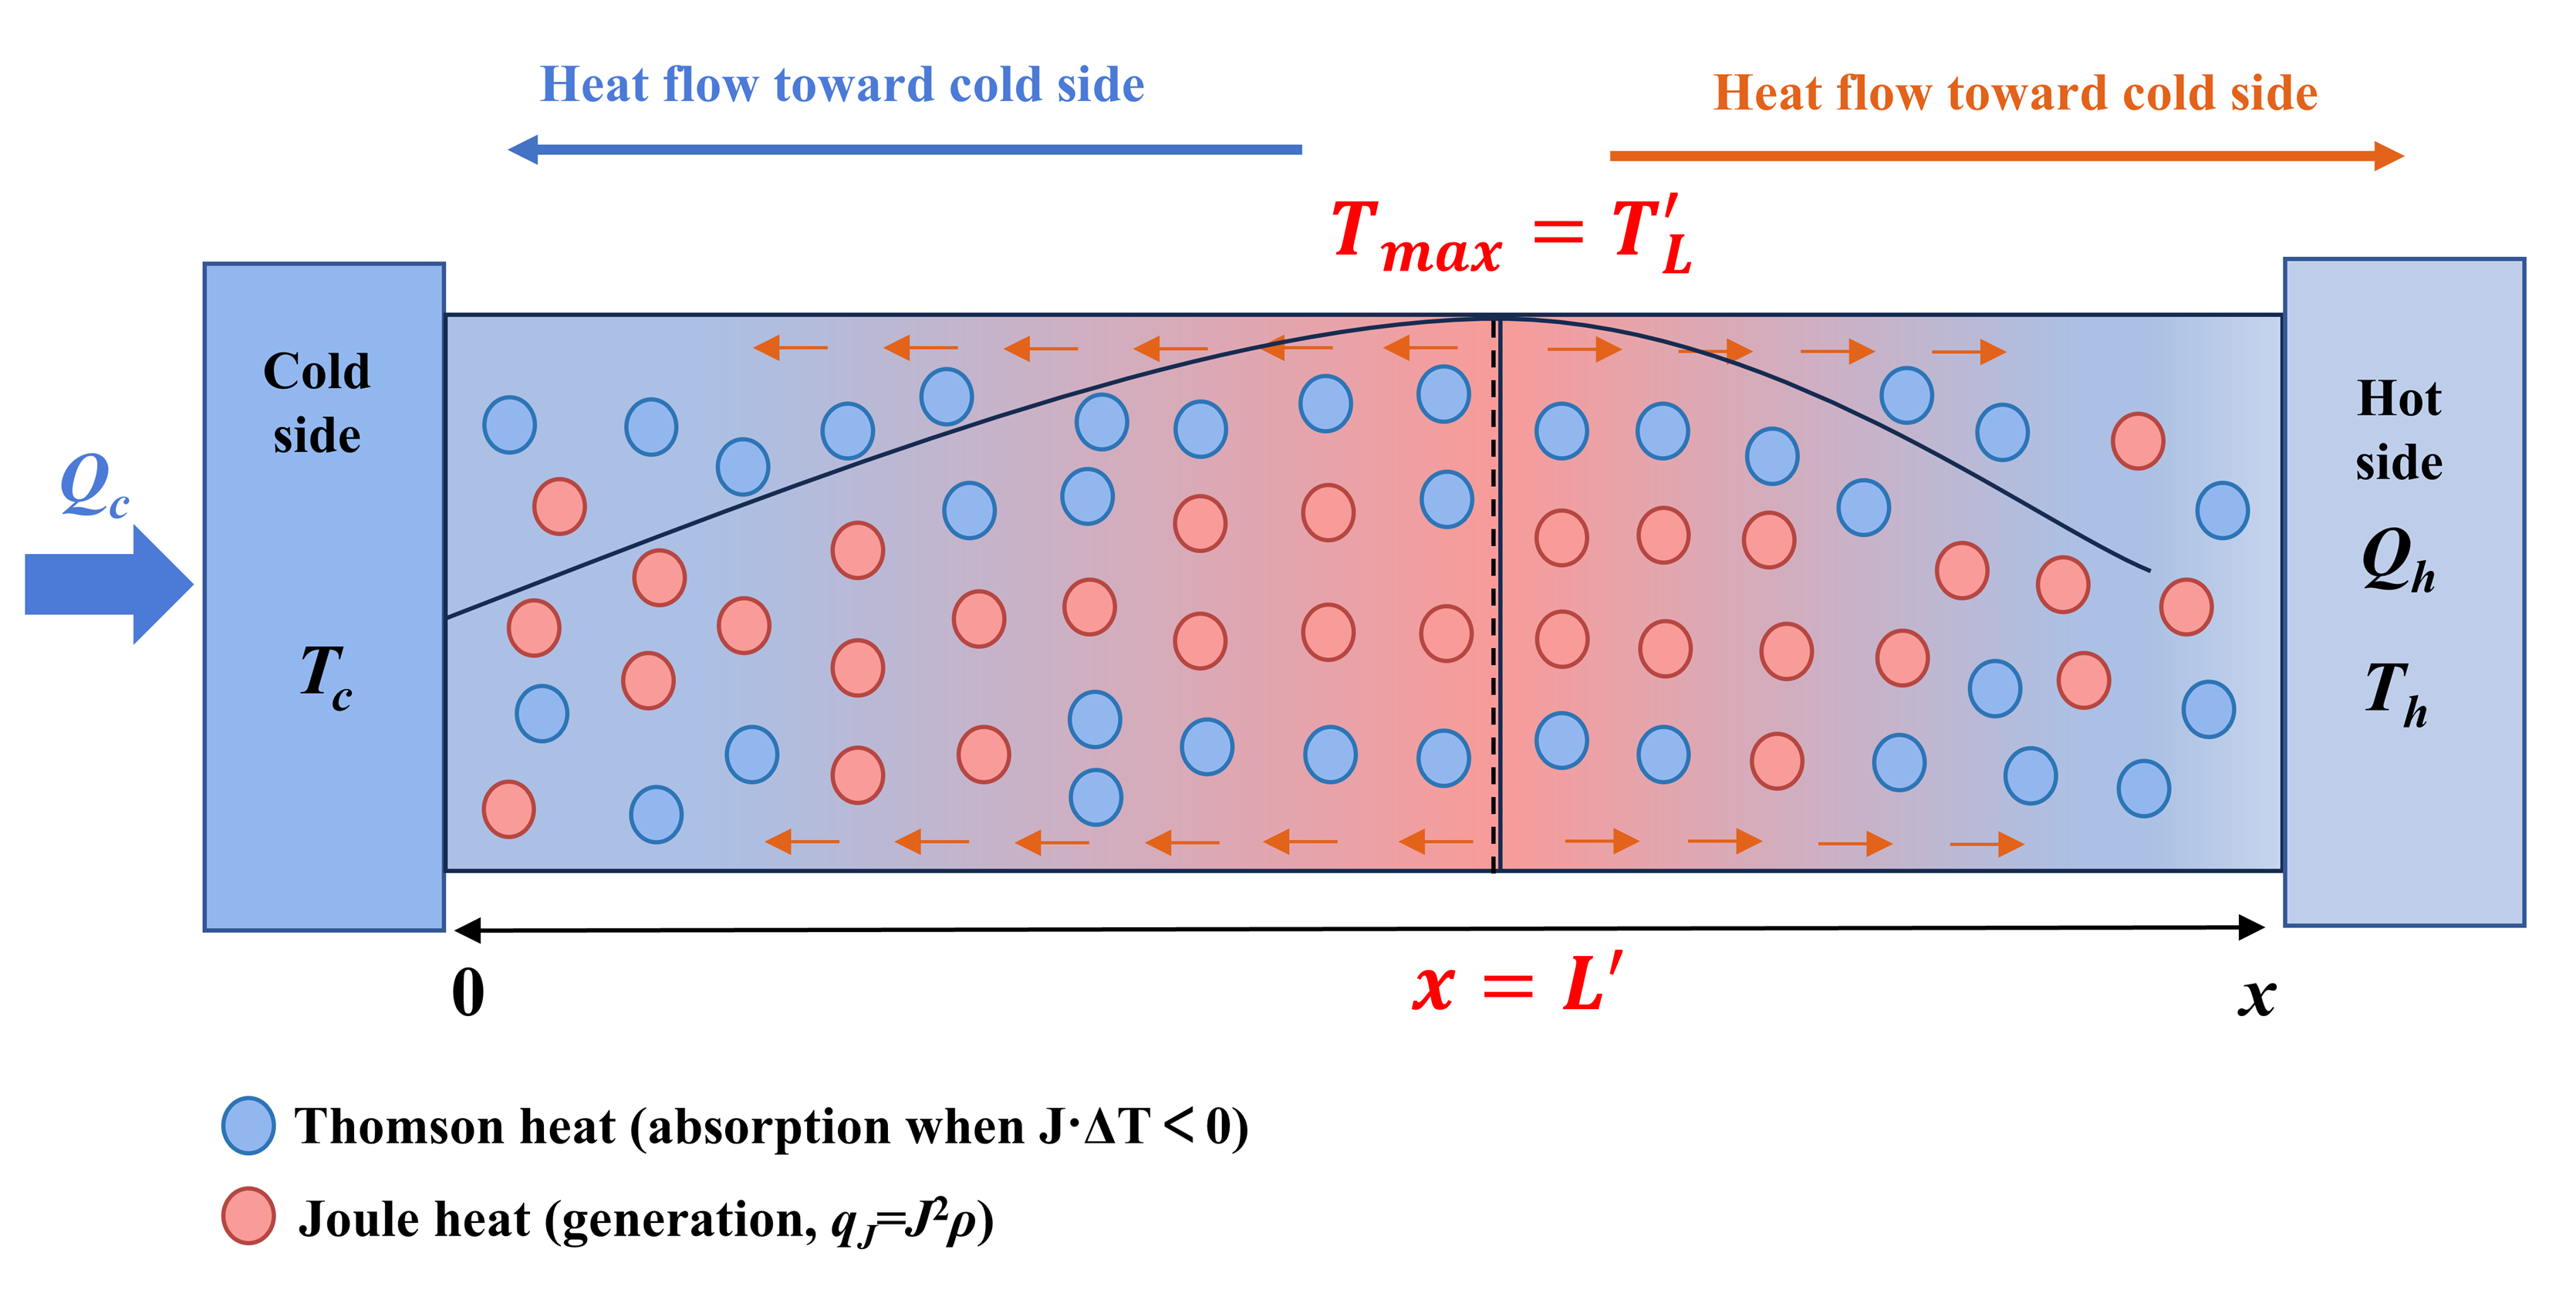
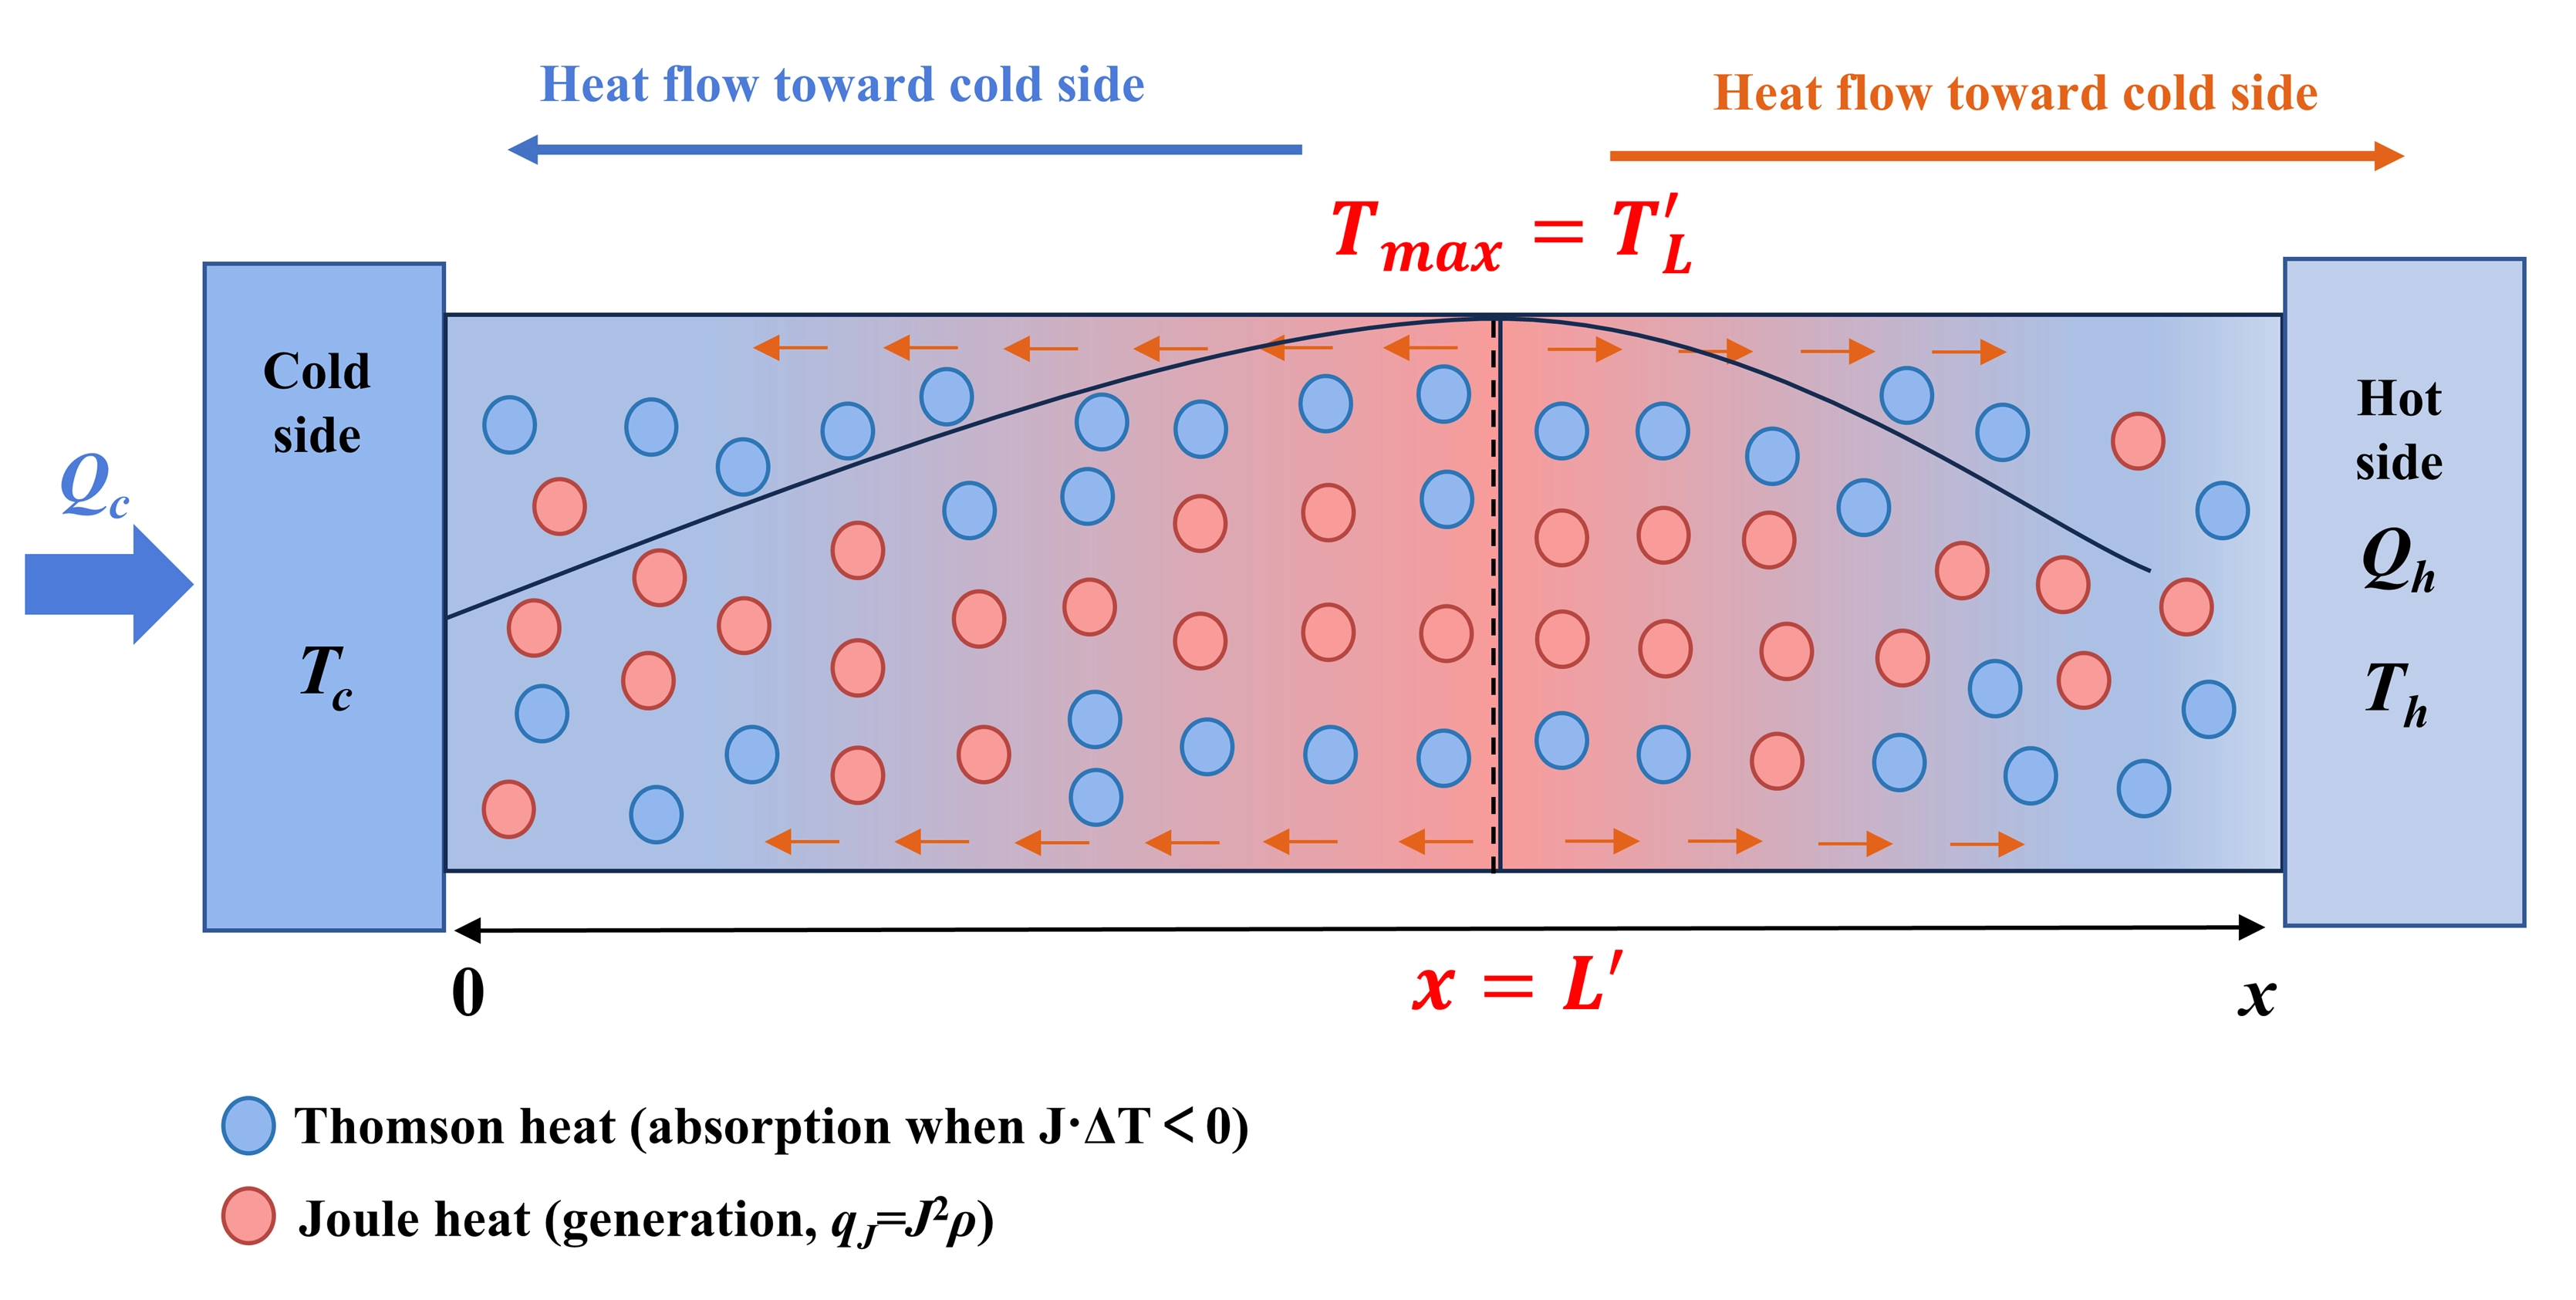
Figure 7. Schematic illustration of heat-flow partition of Joule and Thomson heat under a convex temperature profile.
Before implementing the refinement, the specific information of the highest temperature point needs to be addressed to serve as the upper integration boundary. However, since the location coordinate and the value of the highest temperature are implicit solutions to the governing equation, they are not explicitly available. As an approximation, values obtained from the constant-property governing equation are utilized,
and the cumulative
Consistent with the original cumulative model, the governing equation is integrated once, resulting in Eq. (S2), which is given here for the convenience of reading,
The refined model will depart from the original one hereafter. Note that the temperature gradient at the highest temperature point is zero, i.e.,
The cooling power density at the cold side is re-obtained as
And the maximum cooling power density is reached as
when
Applying the linearized assumption to the integral term, i.e.,
Eq. (10) is rewritten as
The term
And the corresponding electric current density is
Figure 8 and Figure S3 present comparisons of the maximum nondimensional cooling power densities obtained by Eqs. (12) and (14) to exact data by numerical iterations. Meanwhile, the error band for all of the eight materials is shown in Figure 9a with an upper limit of 20%. While the refined cumulative model demonstrates more reliable prediction, there is still substantial room for additional refinement. To further improve its accuracy, it is essential to inspect the potential error sources.
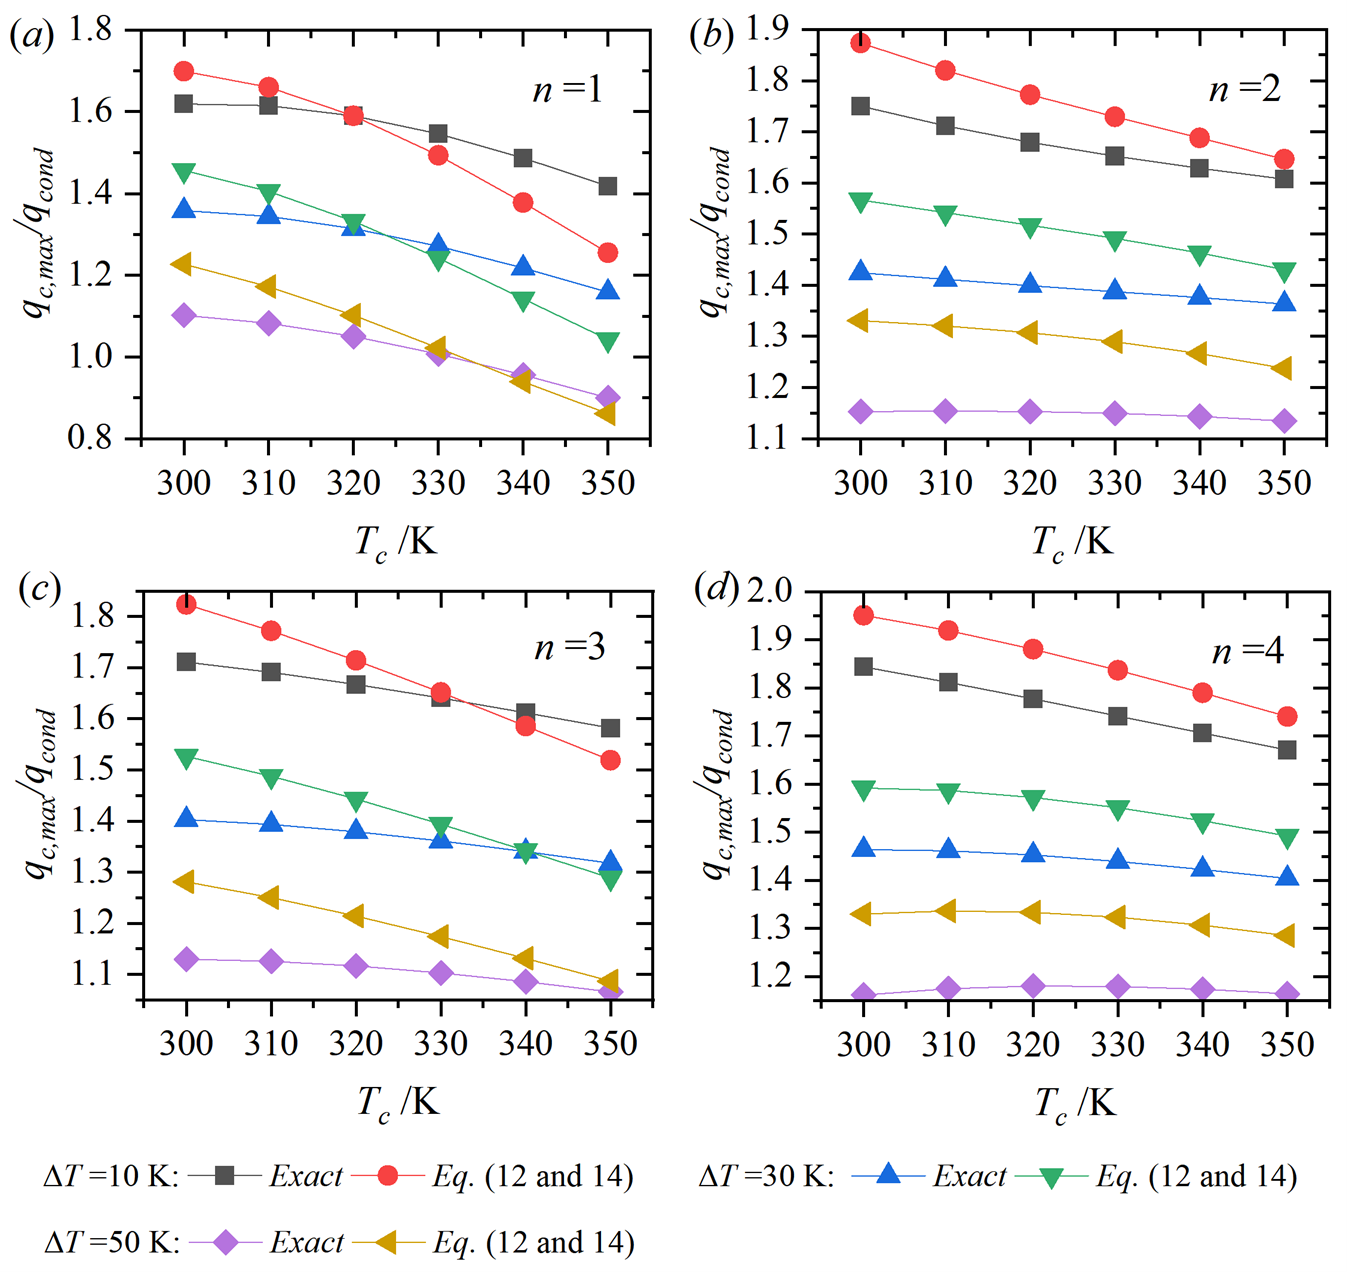
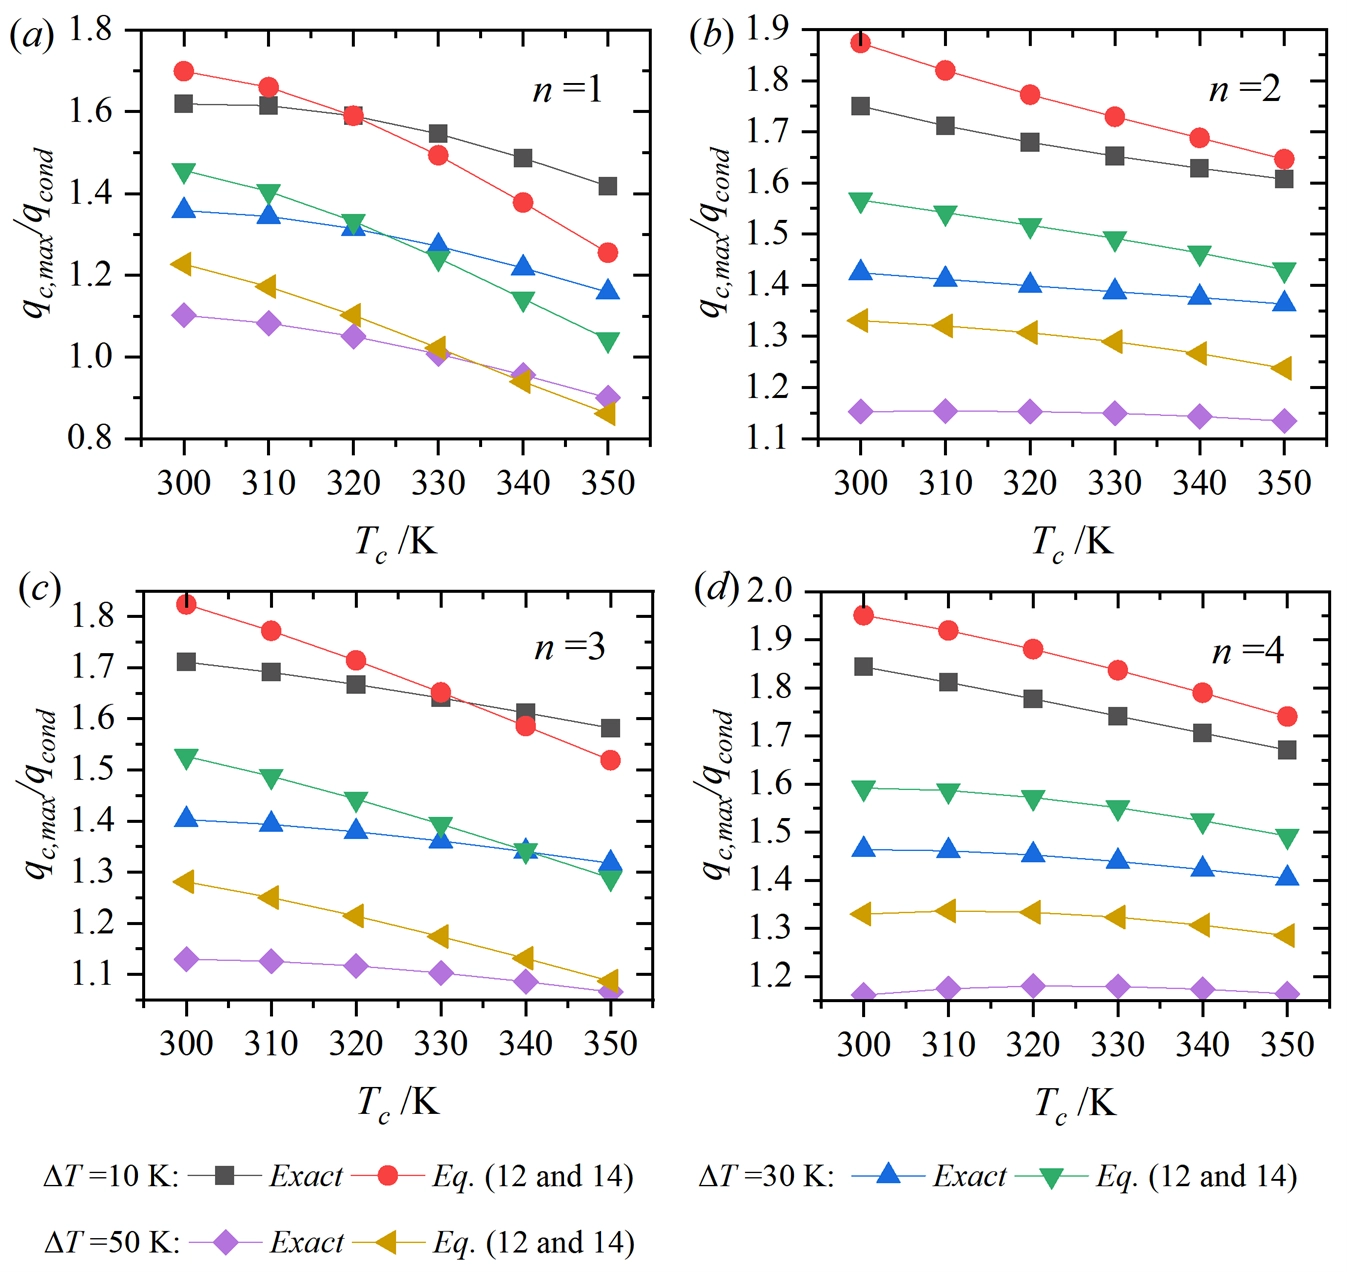
Figure 8. Comparisons of predicted maximum nondimensional cooling power density by Eqs. (12) and (14) to numerical results (n = 1-4).
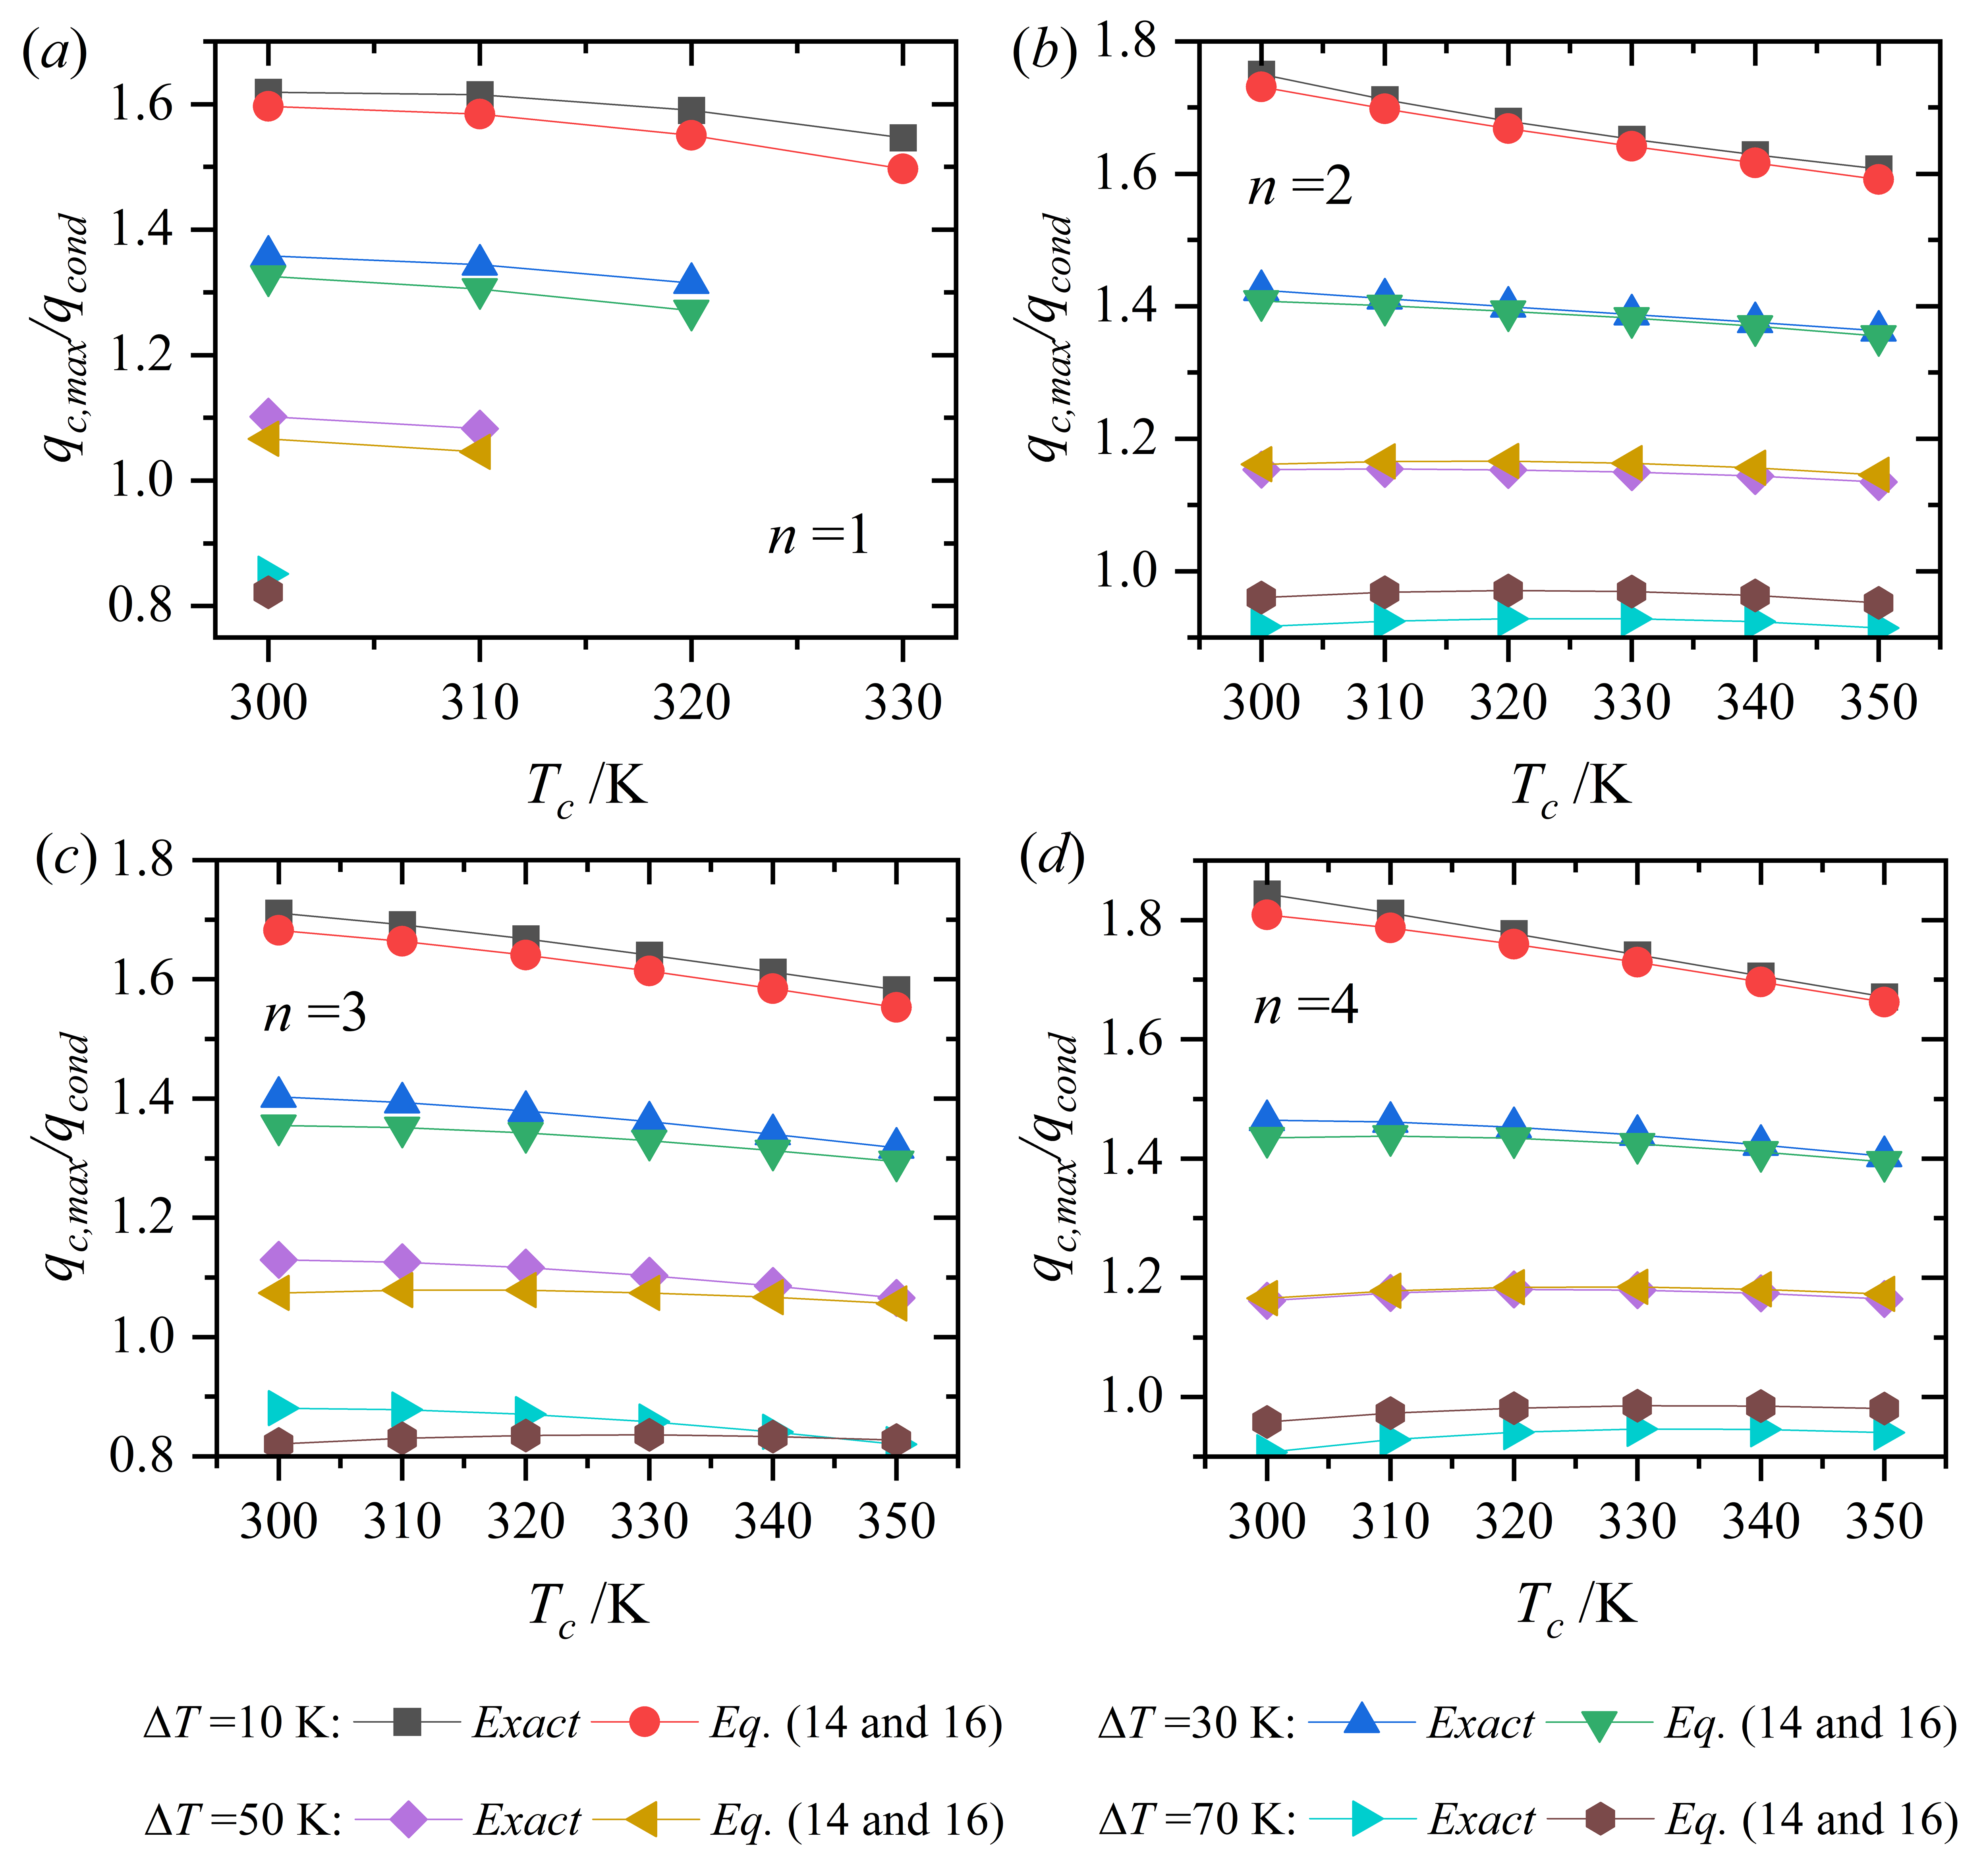
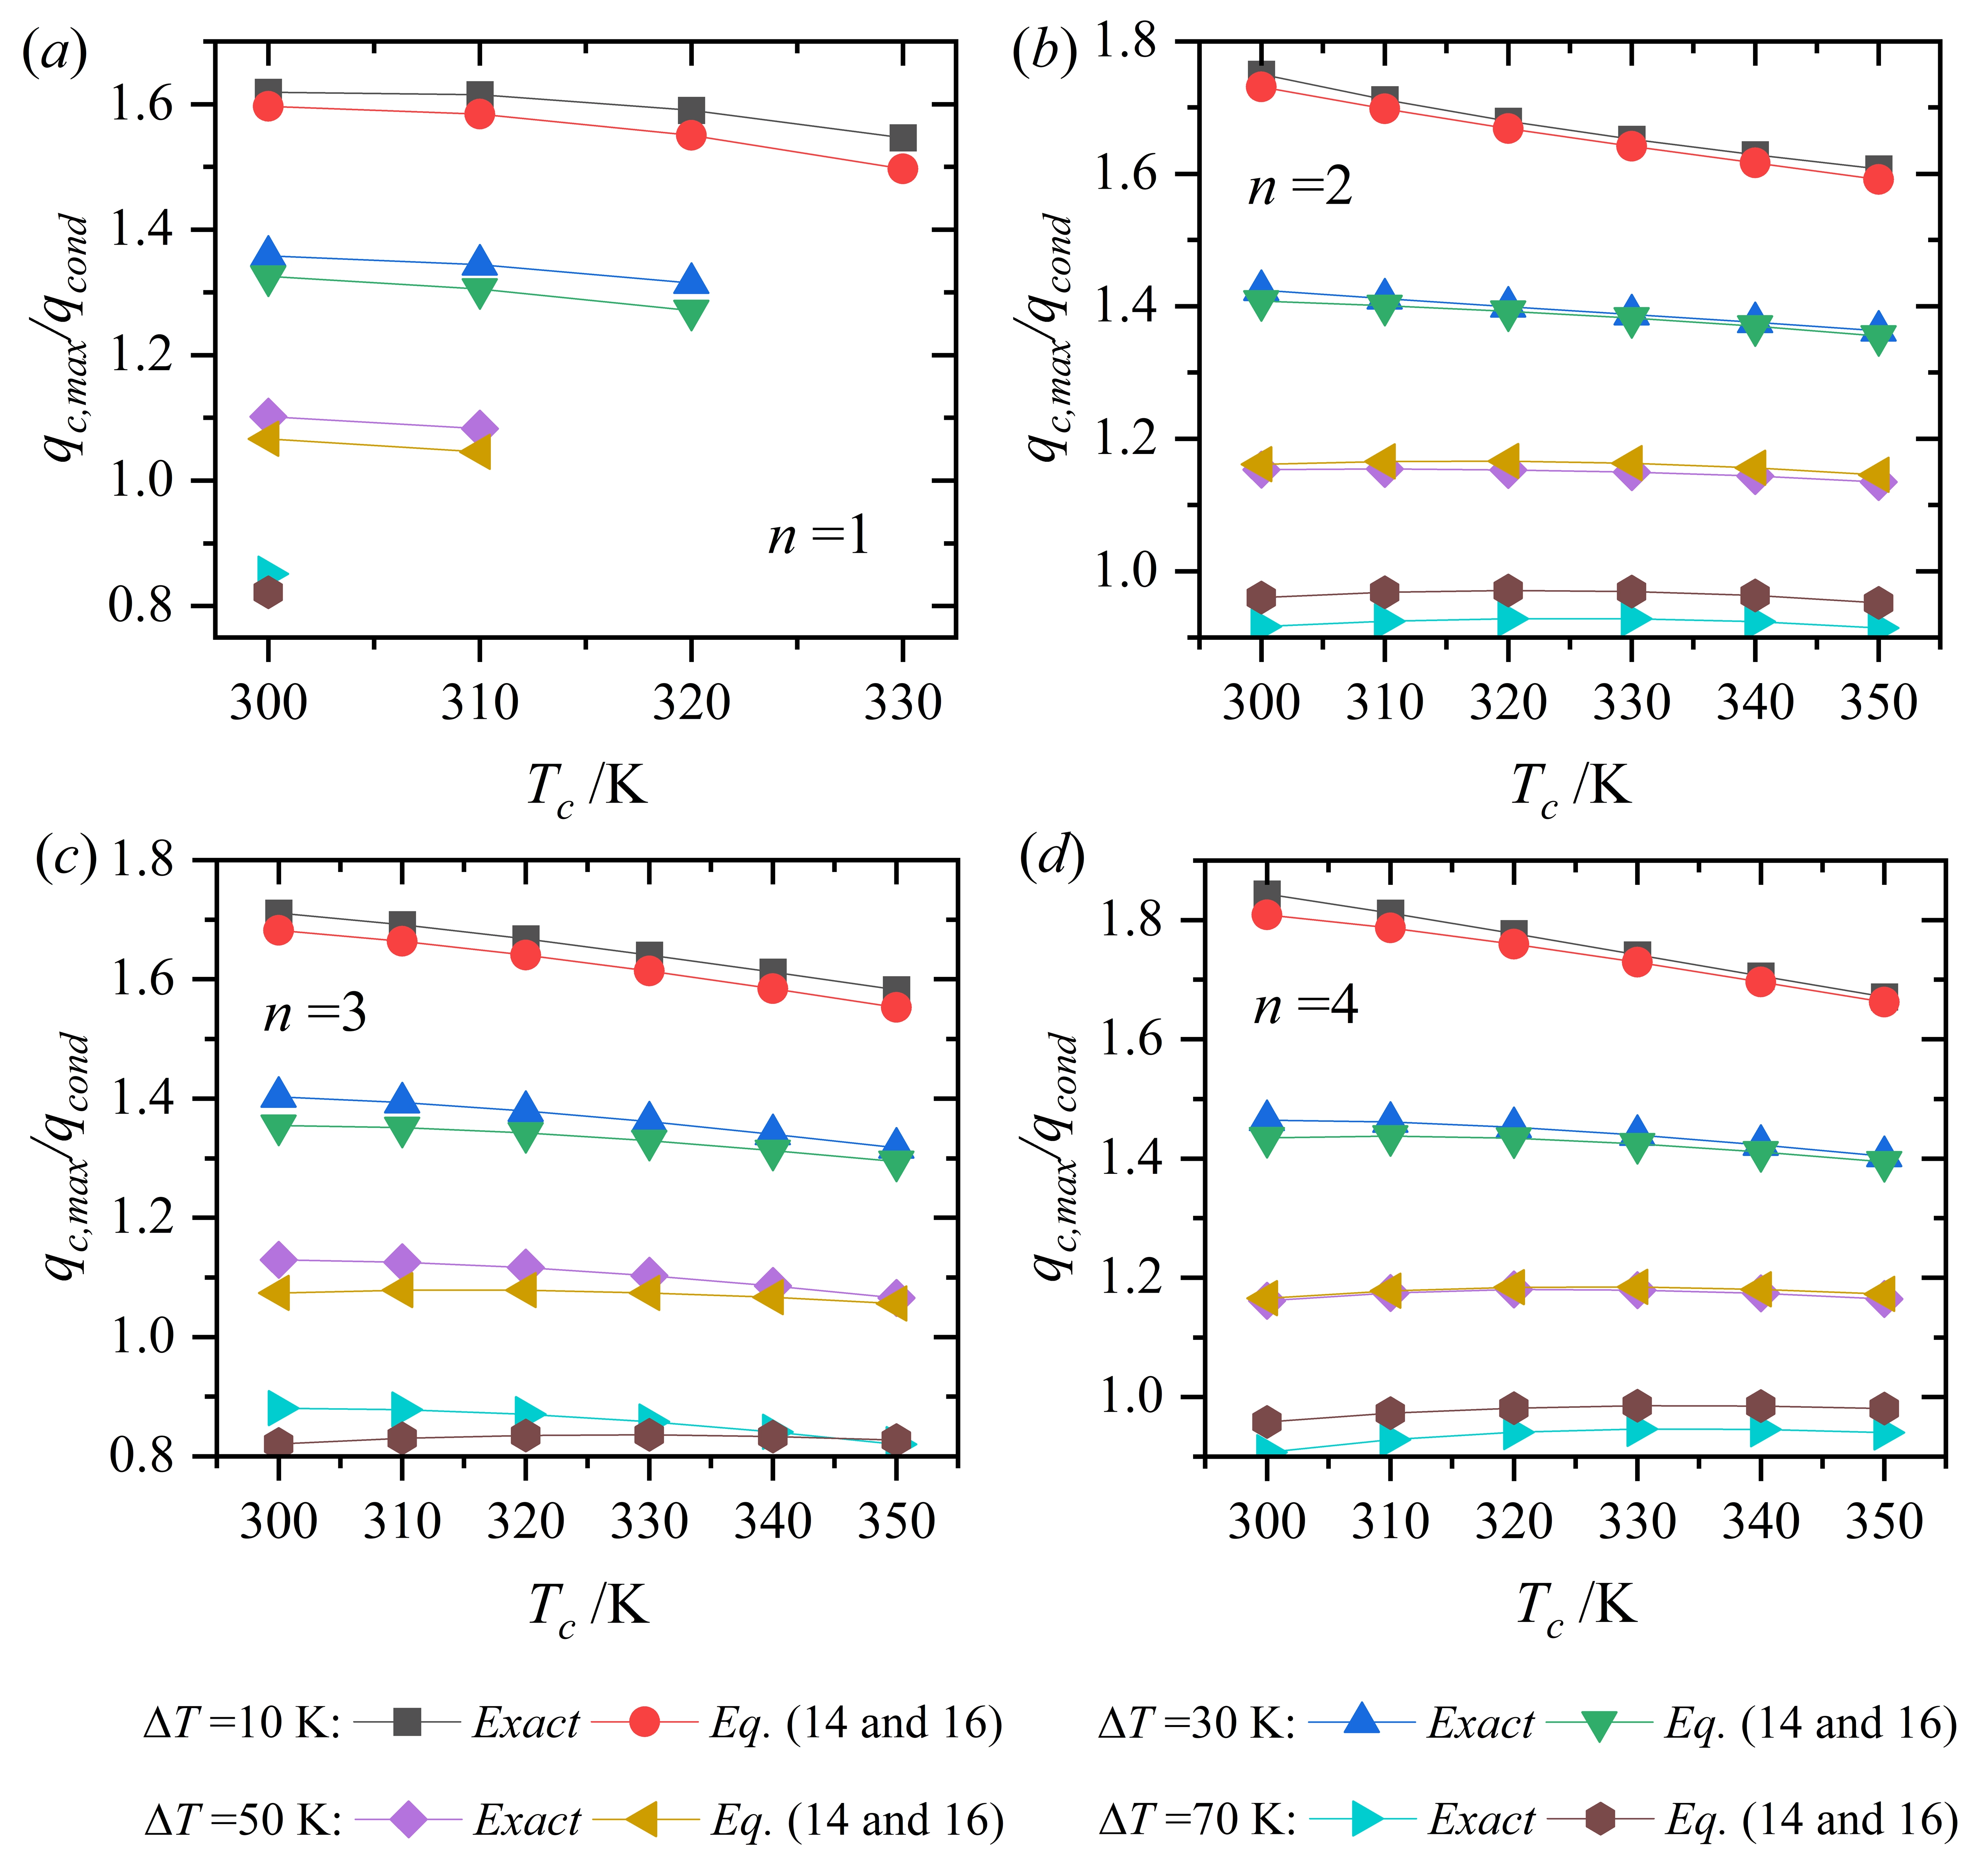
Figure 9. Error bands for predictions of maximum nondimensional cooling power density by (a) Eqs. (12) and (14); (b) Eqs. (16) and (17) in the modified model.
There are two major error sources in the refined model. The first one is the highest temperature point (L', T'h) given by Eq. (7) based on the constant-property governing equation. In the context of the constant-property model, it was reported by Fraisse et al. that the Thomson effect should not be taken into account when the Seebeck coefficient is assumed to be constant, or it will cause additional errors[11]. Considering the constant-property based (L', T'h), a partial suppression of the Thomson effect could be beneficial, which is reflected in β0 by Eq. (12). Guided by this thought, a constant coefficient smaller than 1 is introduced to the second term in the numerator of β0. Through an empirical optimization to minimize residual errors, a suppression coefficient of 0.5 was determined to yield the highest predictive accuracy, and
is used instead of Eq. (12) hereafter. The second one is the approximation of
where
Figure 10 and Figure S4 present comparisons of the maximum nondimensional cooling power density predicted by Eqs. (16) and (17) to numerical data. The further refined cumulative model demonstrates significantly higher accuracy relative to the previous models. Figure 9b confirms that all data points for eight materials fall within a ±5% margin of error over an extended ∆T range of 10-70 K. It should be noted that this error margin refers to the relative deviation with respect to the corresponding numerical reference solutions obtained using the same temperature-dependent material properties reported in the literature, rather than the absolute prediction accuracy for practical thermoelectric devices.
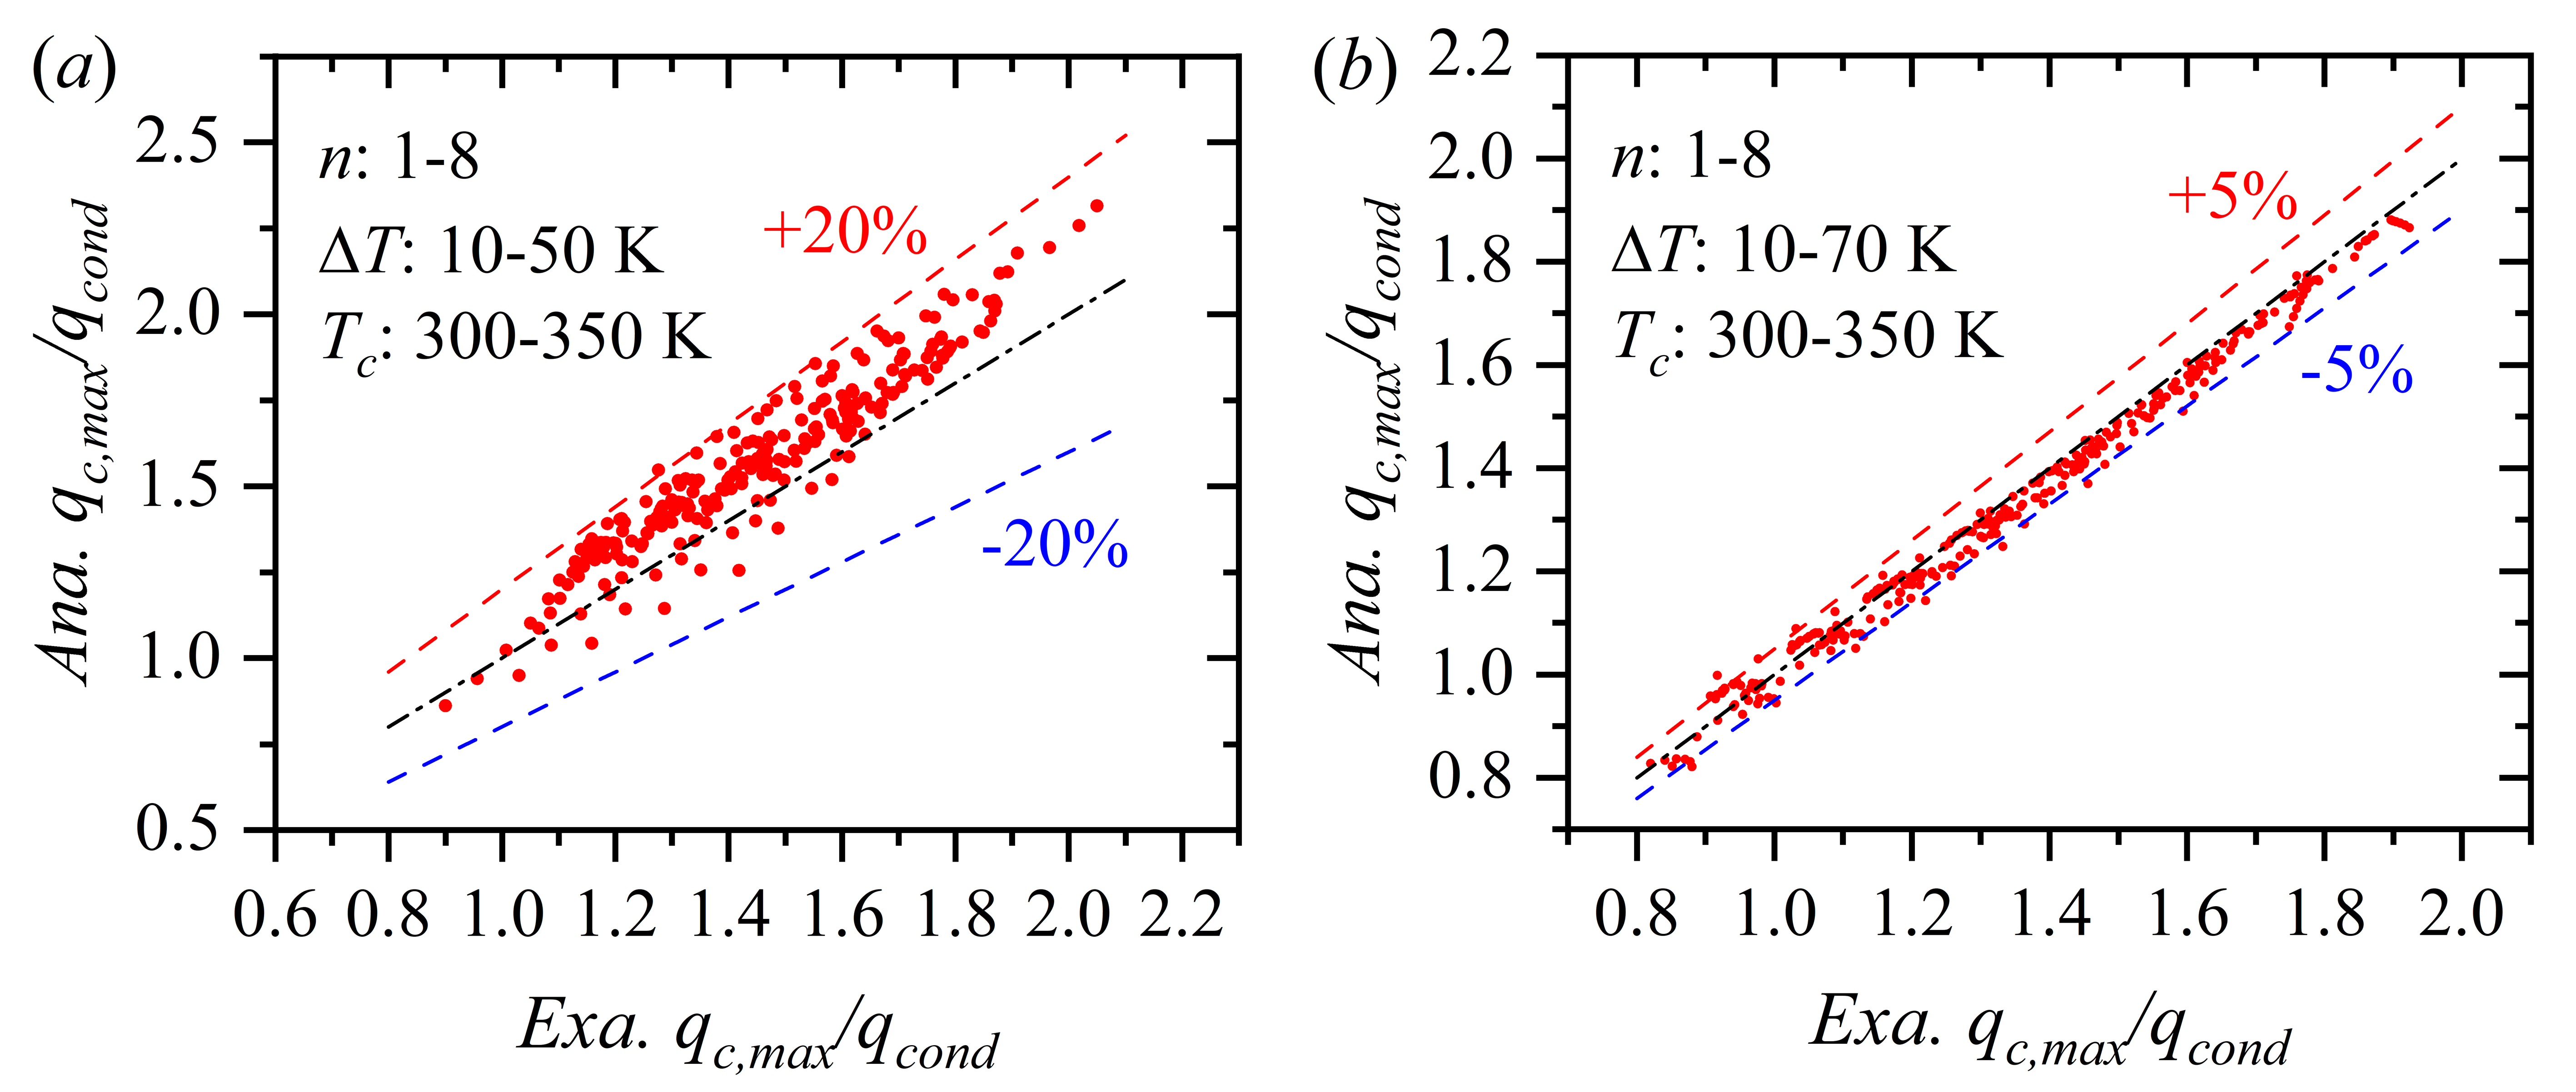
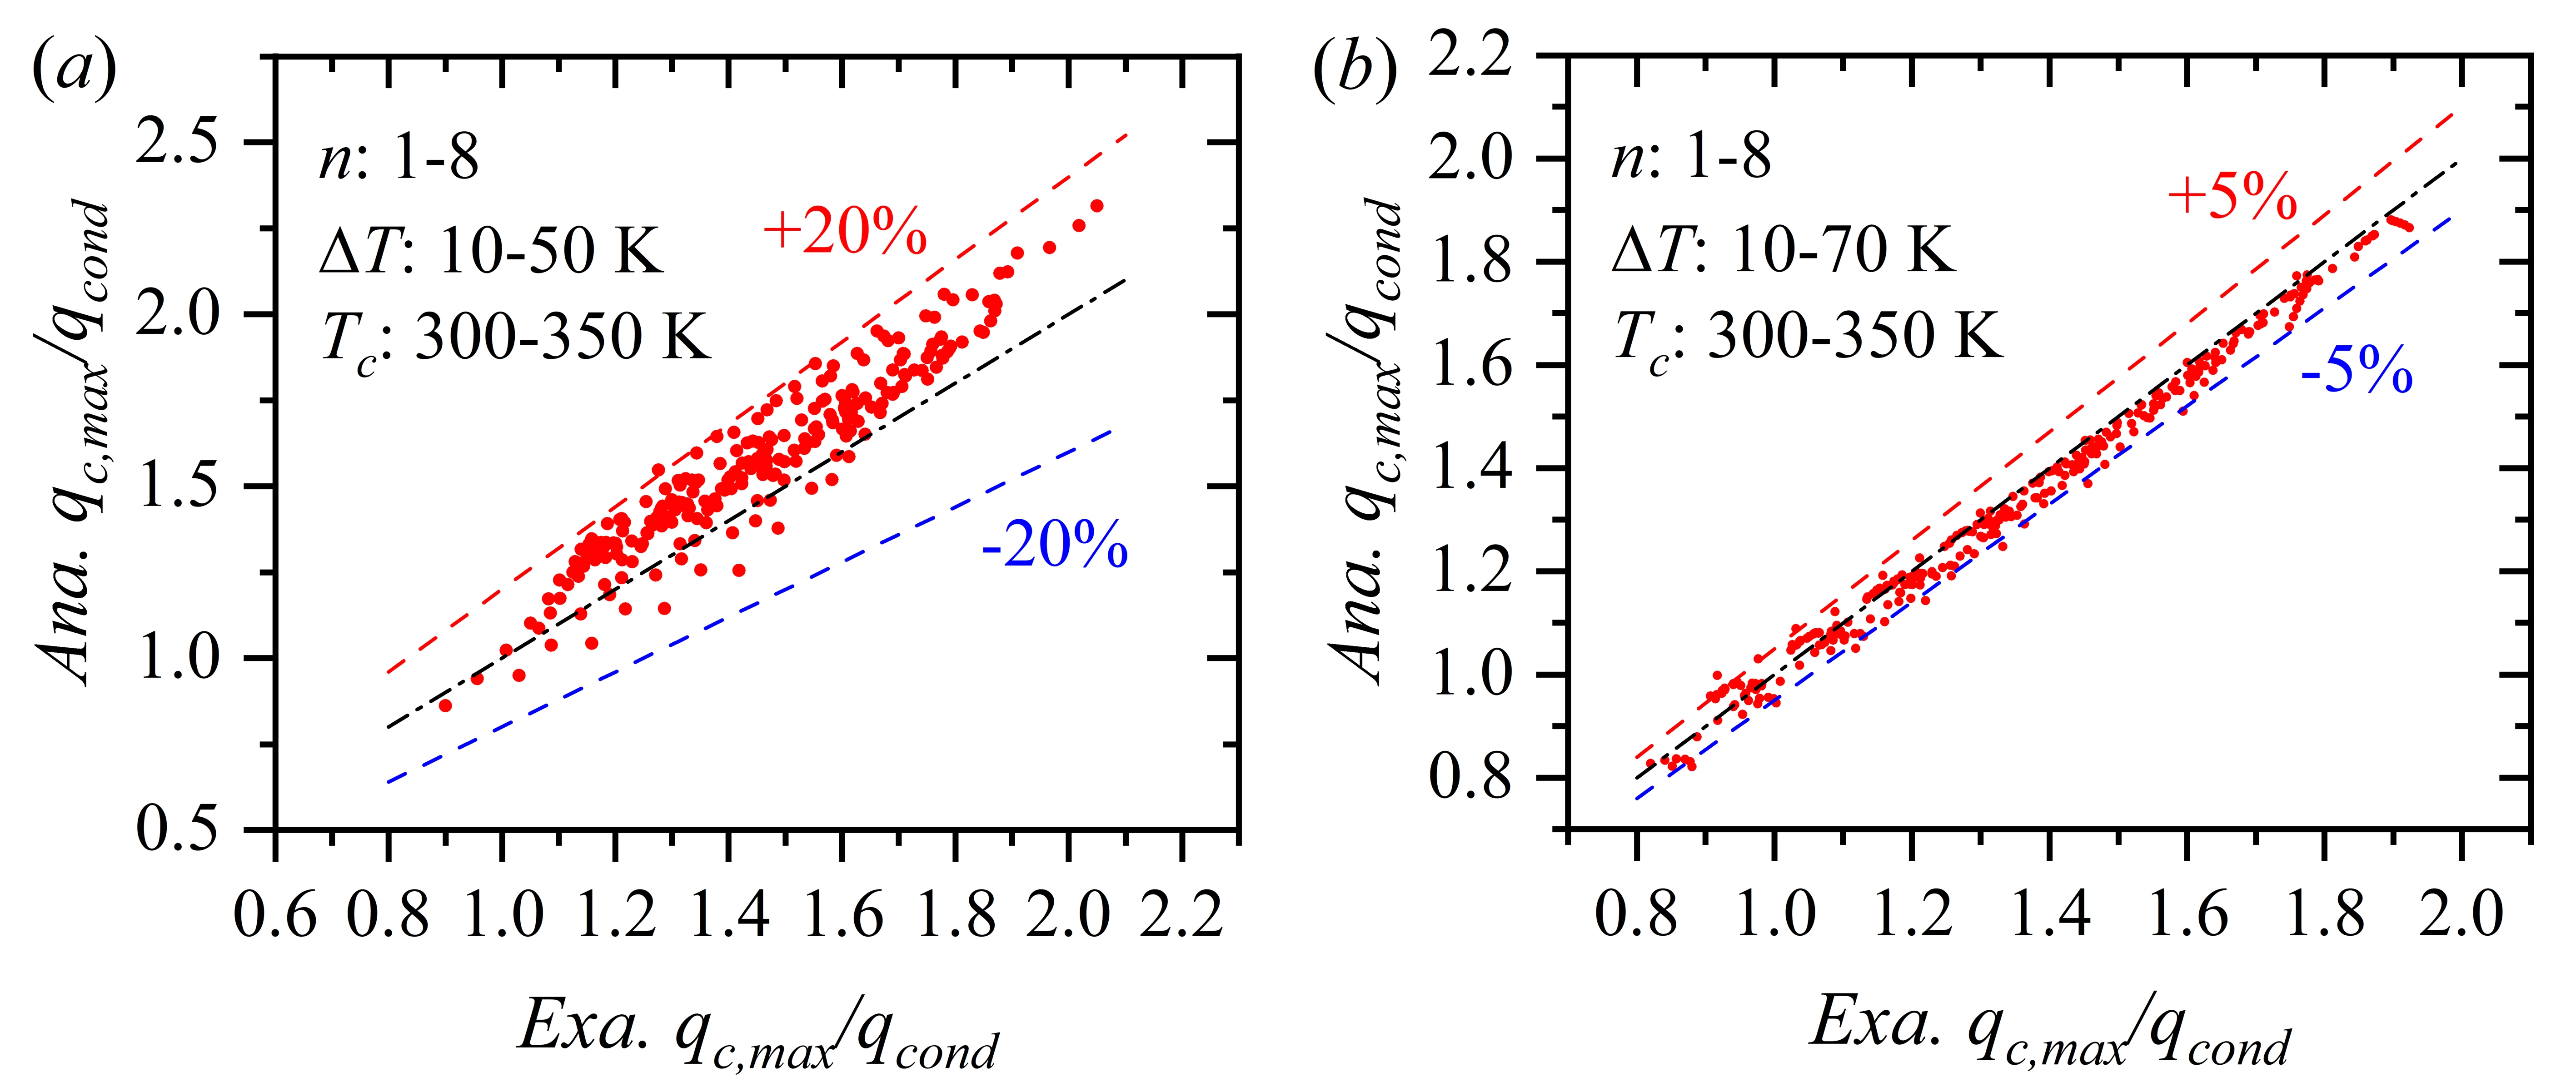
Figure 10. Comparisons of predicted maximum nondimensional cooling power density by Eqs. (16) and (17) to numerical results (n = 1-4).
In addition to the numerical validation, the proposed analytical model was further evaluated using the performance specifications of a commercial thermoelectric module (Thermonamic Electronics (Jiangxi) Corp.)[28], as shown in Figure 11. Under the representative operating condition of ∆T = 30 K and Th = 323 K, the predicted optimal operating current is 4.8 A, identical to the manufacturer’s test specified value. The predicted maximum cooling capacity is 45.3 W, in excellent agreement with the specified value of 45.5 W, with a relative deviation of only 0.4%. These results demonstrate the capability of the proposed analytical model to accurately predict the performance of practical p-n thermoelectric cooling modules.
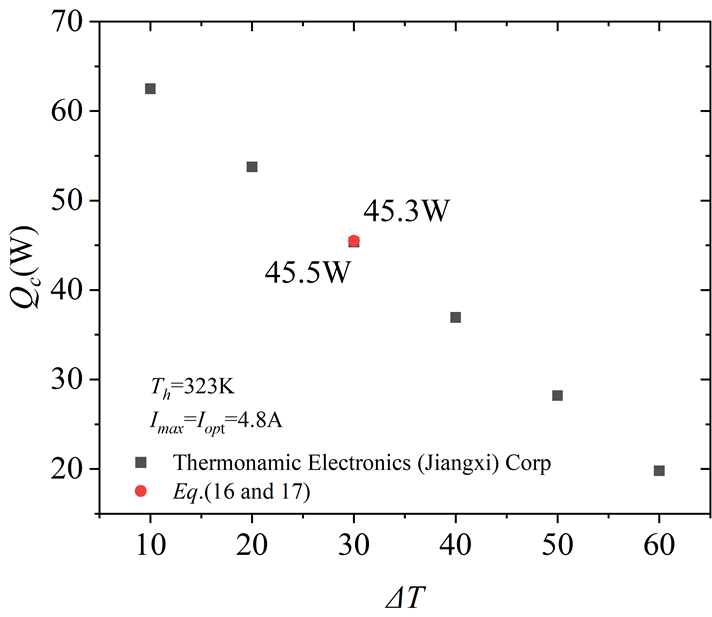
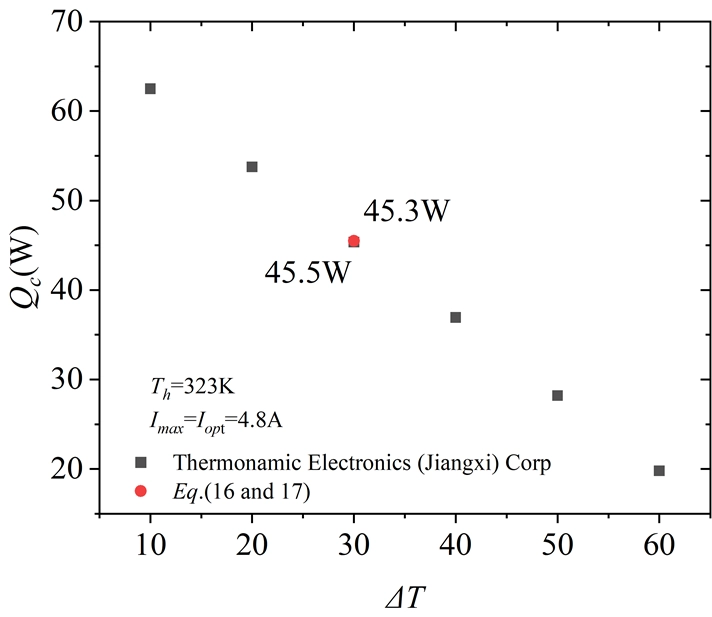
Figure 11. Comparison between the predicted maximum cooling capacity and the commercial TEC performance at Th = 323 K. TEC: thermoelectric cooling.
Eqs. (16) and (17) are further applied to commercial P and N type Bi2Te3 based thermoelectric (TE) materials for sub-ambient cooling power evaluations, and the analytically predicted results as well as numerical results are compared in Figure 12, covering a Tc range of 230-280 K and a ∆T range of 10-50 K. The thermoelectric properties of these two materials between 200 K and 350 K are illustrated in Figure S5. The analytical model shows a strong correlation with numerical results, especially for cases with nondimensional cooling power densities above 0.8. It is concluded that the analytical model proposed in this work is universal across various TE materials and application scenarios.
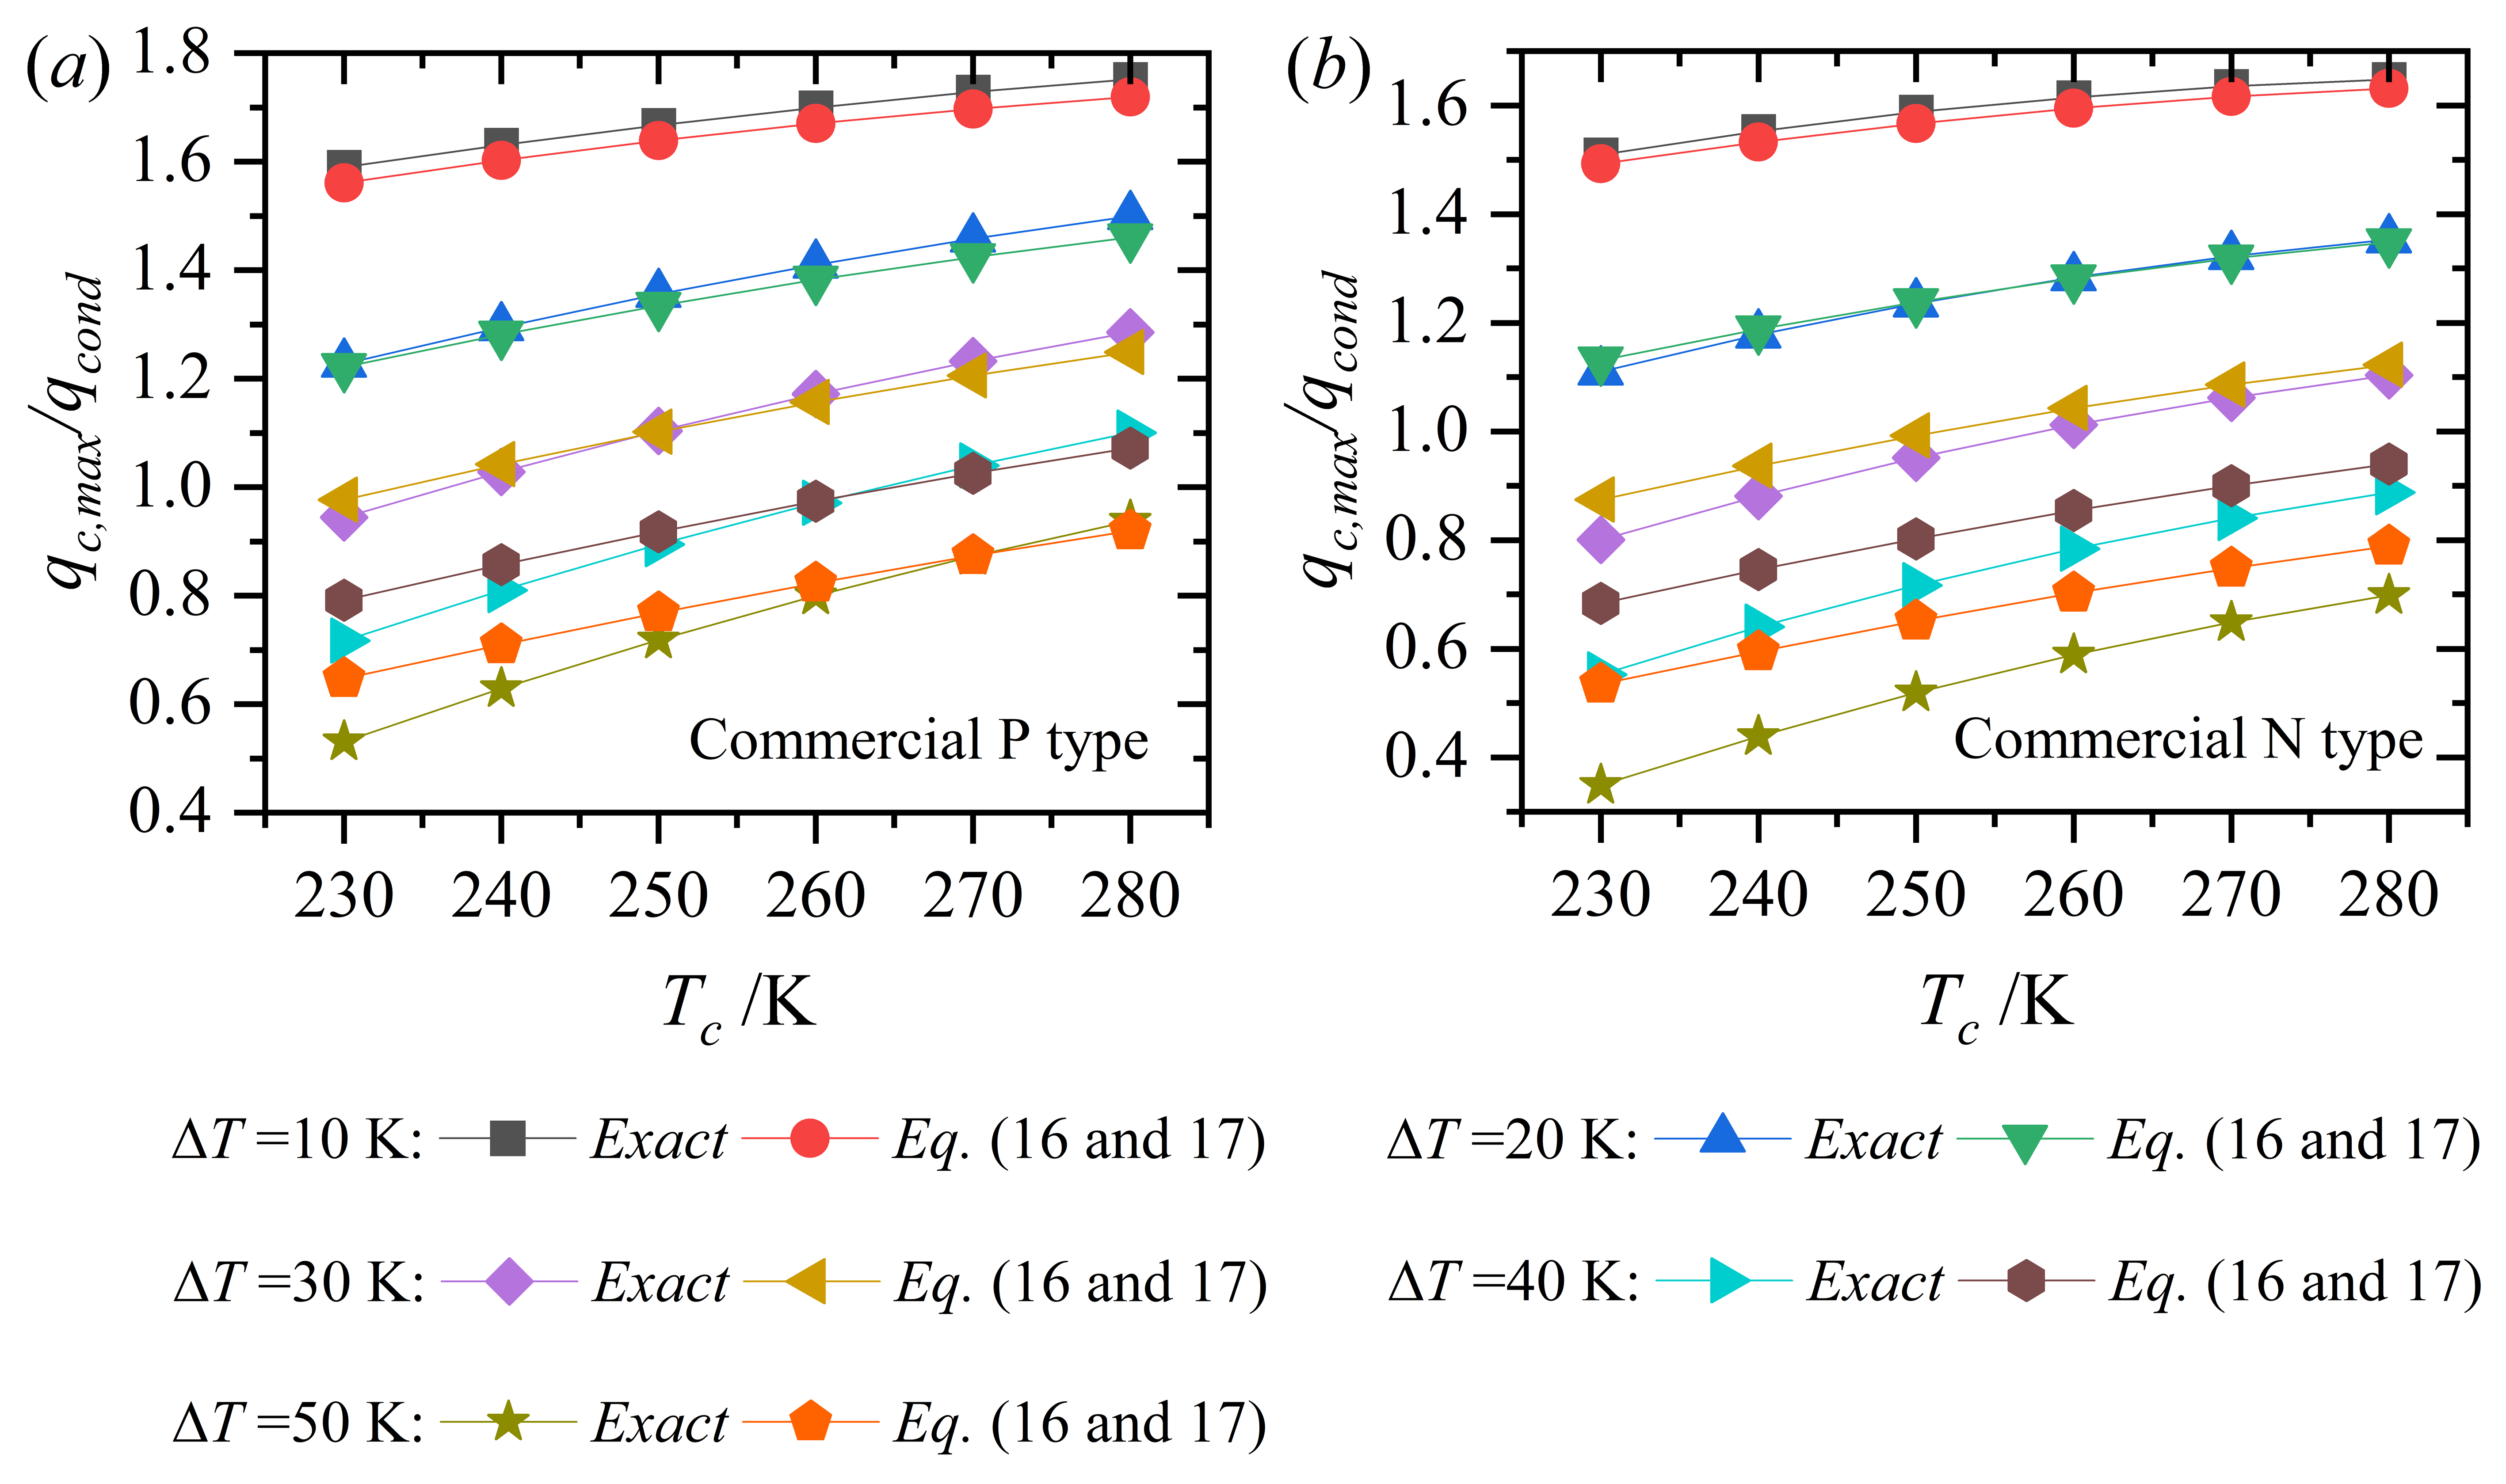
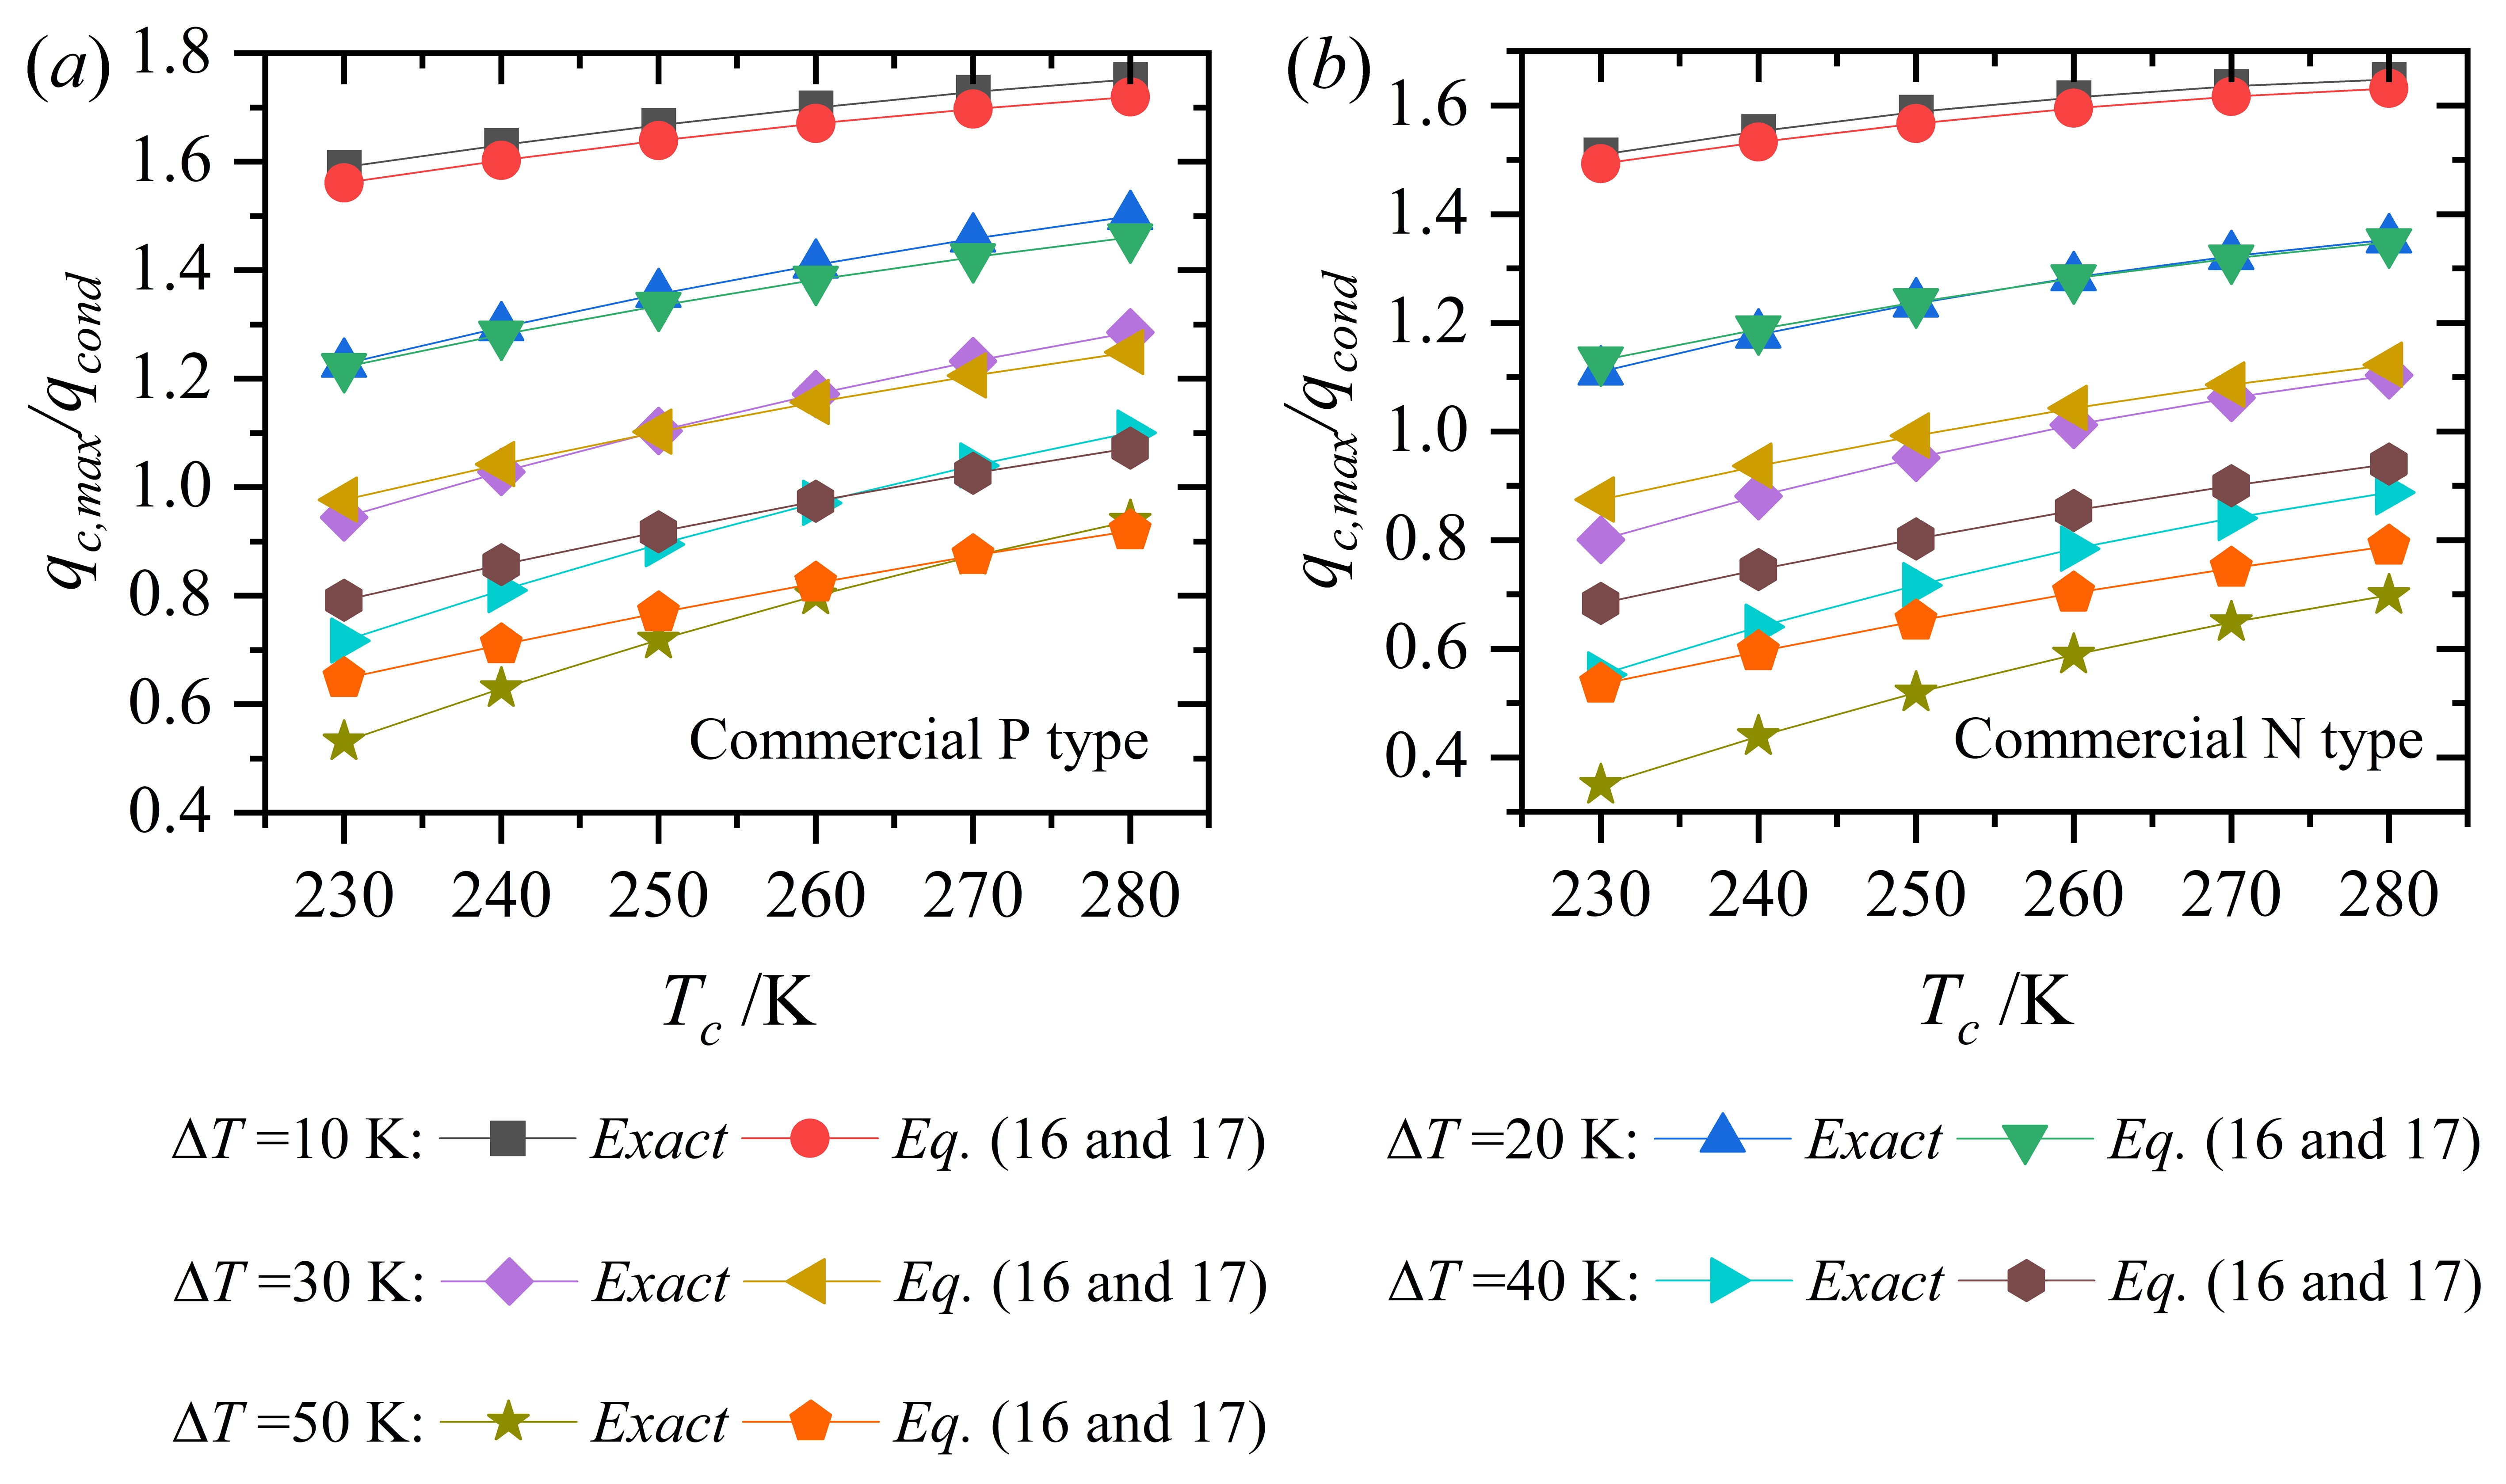
Figure 12. Comparisons of predicted maximum nondimensional cooling power density by Eqs. (16) and (17) to numerical results for sub-ambient cooling with commercial P and N type materials.
4. Conclusions
This study presents a refined cumulative model that provides a robust and accurate framework for evaluating real-world thermoelectric cooling performance under finite temperature differences. By utilizing a one-step integration method with the upper boundary scheme, the proposed model successfully addresses the challenges posed by temperature-dependent material properties and inaccuracy from non-linear temperature profiles within the thermoelectric element. The advantage of this model is evidenced by its significant performance in assessing maximum cooling performance within ±5% across a temperature difference range of 10-70 K for various materials. This represents a substantial improvement over previous approaches including the classical and the original cumulative models, which failed to yield reliable cooling power estimations due to the assumption of constant material properties or a linear inner temperature distribution. Consequently, this work offers an elegant and widely applicable solution for evaluating real-world thermoelectric cooling performance, and is expected to facilitate the design, development, and application of thermoelectric cooling technologies.
Supplementary materials
The supplementary material for this article is available at: Supplementary materials.
Authors contribution
Zhu K, Kim H: Conceptualization, formal analysis, investigation, writing-original draft, funding acquisition.
Li X, Brown A, Shi R: Formal analysis, writing-review & editing.
Liu W: Supervision, conceptualization, methodology, writing-review & editing, funding acquisition.
Conflicts of interest
Weishu Liu is an Editorial Board Member of Thermo-X. The other authors declare no conflicts of interest.
Ethical approval
Not applicable.
Consent to participate
Not applicable.
Consent for publication
Not applicable.
Availability of data and materials
The data that support the findings of this study are available from the corresponding author upon reasonable request.
Funding
This work was supported by Key-Area Research and Development Program of Guangdong Province (No. 2024B0101040002), National Natural Science Foundation of China (Nos. 52202250 and T2425012), and the Faculty Development Fund of the University of Washington Tacoma.
Copyright
© The Author(s) 2026.
References
-
1. Li H, Wang Y, Wu X, Zhu K, Wang S, Yu M, et al. A general route to design solar thermoelectric generators under the constant heat flux thermal boundary. Energy Environ Sci. 2025;18(6):2861-2872.[DOI]
-
2. Hei J, Lin H, Nian X, Li K, Li W, Ma J, et al. High-power radiatively cooled thermoelectric generator for diurnal waste heat harvesting. Mater Rep Energy. 2026;6(1):100398.[DOI]
-
3. Zhu K, Deng B, Zhang P, Kim HS, Jiang P, Liu W. System efficiency and power: The bridge between the device and system of a thermoelectric power generator. Energy Environ Sci. 2020;13(10):3514-3526.[DOI]
-
4. Ling Y, Min E, Dong G, Zhao L, Feng J, Li J, et al. Precise temperature control of electronic devices under ultra-high thermal shock via thermoelectric transient pulse cooling. Appl Energy. 2023;351:121870.[DOI]
-
5. Liu Y, Yang D, Tang K, Lyu J, Zhang Z, Li C, et al. Enhanced design optimization of micro-thermoelectric cooler in optical module. Solid State Sci. 2025;160:107829.[DOI]
-
6. Singh VK, Sisodia SS, Patel A, Shah T, Das P, Patel RN, et al. Thermoelectric cooler (TEC) based thermal control system for space applications: Numerical study. Appl Therm Eng. 2023;224:120101.[DOI]
-
7. Ioffe AF, Stil’Bans LS, Iordanishvili EK, Stavitskaya TS, Gelbtuch A, Vineyard G. Semiconductor thermoelements and thermoelectric cooling. London: Infosearch Ltd.; 1957.
-
8. Yin T, Li WT, Li K, He ZZ. Multi-parameter optimization and uncertainty analysis of multi-stage thermoelectric generator with temperature-dependent materials. Energy Rep. 2021;7:7212-7223.[DOI]
-
9. Tan Z, Sun H. Thermoelectric performance and stress analysis of FGM thermoelectric generators with temperature-dependent properties by differential transformation method. Int J Therm Sci. 2026;222:110561.[DOI]
-
10. Sui X, Zhang Z, Zhang Y, Xu D, Li W. Simplified calculation model for the effect of nonlinear temperature dependence of thermoelectric properties on the conversion efficiency. Energy. 2021;220:119745.[DOI]
-
11. Fraisse G, Ramousse J, Sgorlon D, Goupil C. Comparison of different modeling approaches for thermoelectric elements. Energy Convers Manag. 2013;65:351-356.[DOI]
-
12. Song K, Yin D, Song H, Schiavone P, Wu X, Yuan L. Seeking high energy conversion efficiency in a fully temperature-dependent thermoelectric medium. Energy. 2022;239:122440.[DOI]
-
14. Linker TM, Lee GS, Beekman M. Comparison of predicted thermoelectric energy conversion efficiency by cumulative properties and reduced variables approaches. J Electron Mater. 2018;47(6):3085-3090.[DOI]
-
16. Wang XD, Huang YX, Cheng CH, Lin DTW, Kang CH. A three-dimensional numerical modeling of thermoelectric device with consideration of coupling of temperature field and electric potential field. Energy. 2012;47(1):488-497.[DOI]
-
17. Yamashita O. Effect of linear and non-linear components in the temperature dependences of thermoelectric properties on the cooling performance. Appl Energy. 2009;86(9):1746-1756.[DOI]
-
18. Ju C, Wang X, Dui G, Uhl CG, Xin L. Theoretical analysis of the cooling performance of a thermoelectric element with temperature-dependent material properties. J Electron Mater. 2019;48(7):4627-4636.[DOI]
-
19. Xie W, Tang X, Yan Y, Zhang Q, Tritt TM. Unique nanostructures and enhanced thermoelectric performance of melt-spun BiSbTe alloys. Appl Phys Lett. 2009;94(10):102111.[DOI]
-
20. Kim KC, Lim SS, Lee SH, Hong J, Cho DY, Mohamed AY, et al. Precision interface engineering of an atomic layer in bulk Bi2Te3 alloys for high thermoelectric performance. ACS Nano. 2019;13(6):7146-7154.[DOI]
-
21. Yeo YH, Oh TS. Thermoelectric properties of p-type (Bi, Sb)2Te3 nanocomposites dispersed with multiwall carbon nanotubes. Mater Res Bull. 2014;58:54-58.[DOI]
-
22. Cao B, Jian J, Ge B, Li S, Wang H, Liu J, et al. Improved thermoelectric performance in p-type Bi0.48Sb1.52Te3 bulk material by adding MnSb2Se4. Chin Phys B. 2017;26(1):017202.[DOI]
-
24. Xiao Y, Yang JY, Jiang QH, Fu LW, Luo YB, Liu M, et al. A simultaneous increase in the ZT and the corresponding critical temperature of p-type Bi0.4Sb1.6Te3 by a combined strategy of dual nanoinclusions and carrier engineering. J Mater Chem A. 2014;2(47):20288-20294.[DOI]
-
25. Ahmad A, Zhu B, Wang Z, Gui Z, Wang W, Wang T, et al. Largely enhanced thermoelectric performance in p-type Bi2Te3-based materials through entropy engineering. Energy Environ Sci. 2024;17(2):695-703.[DOI]
-
27. Mao J, Zhu H, Ding Z, Liu Z, Gamage GA, Chen G, et al. High thermoelectric cooling performance of n-type Mg3Bi2-based materials. Science. 2019;365(6452):495-498.[DOI]
-
28. Thermonamic Electronics (Jiangxi) Corp Ltd. Specification of thermoelectric module. Nanchang: Thermonamic Electronics (Jiangxi) Corp Ltd. 2026. Available from: https://www.thermonamic.com.cn/TEHC1-12403CH4.7-English%2020230106.pdf
Copyright
© The Author(s) 2026. This is an Open Access article licensed under a Creative Commons Attribution 4.0 International License (https://creativecommons.org/licenses/by/4.0/), which permits unrestricted use, sharing, adaptation, distribution and reproduction in any medium or format, for any purpose, even commercially, as long as you give appropriate credit to the original author(s) and the source, provide a link to the Creative Commons license, and indicate if changes were made.
Publisher’s Note
Science Exploration remains a neutral stance on jurisdictional claims in published
maps
and institutional affiliations. The views expressed in this article are solely those
of
the author(s) and do not reflect the opinions of the Editors or the publisher.
Share And Cite


Science Exploration Style
Zhu K, Li X, Brown A, Shi R, Kim HS, Liu W. A cumulative model for thermoelectric cooling with temperature dependent material properties. Thermo-X. 2026;2:202624. https://doi.org/10.70401/tx.2026.0027
Tips
Copy completed.
Submit a Manuscript
Author Instructions
Cite this Article
Article Metrics
0
View
0
Download
Cited
Article Updates

 Get citation
Science Exploration Style

Zhu K, Li X, Brown A, Shi R, Kim HS, Liu W. A cumulative model for thermoelectric cooling with temperature dependent material properties. Thermo-X. 2026;2:202624. https://doi.org/10.70401/tx.2026.0027
copy
Share Link
copy