Insights into lattice thermal transport mechanisms in layered chalcogenides X2PdY6 (X = Nb, Ta; Y = S, Se) via machine learning molecular dynamics simulations

Xiguang Wu
1,2
,
Jianlian Huang
2
,
Weikuan Li
2
,
Yuxuan Guo
2
,
Wei Zhang
2
,
Yajuan Cheng
1,*
,
Gang Zhang
3,*
,
Shiyun Xiong
2,*

*Correspondence to:
Yajuan Cheng, School of Physics and Materials Science, Guangzhou University, Guangzhou 510006, Guangdong, China.
E-mail: yajuancheng@gzhu.edu.cn
Gang Zhang, Yangtze Delta Region Academy, Beijing Institute of Technology, Jiaxing 314000, Zhejiang, China. E-mail: zhangg@ihpc.a-star.edu.sg
Shiyun Xiong, School of Materials and Energy, Guangdong University of Technology, Guangzhou 510006, Guangdong, China. E-mail: syxiong@gdut.edu.cn
Gang Zhang, Yangtze Delta Region Academy, Beijing Institute of Technology, Jiaxing 314000, Zhejiang, China. E-mail: zhangg@ihpc.a-star.edu.sg
Shiyun Xiong, School of Materials and Energy, Guangdong University of Technology, Guangzhou 510006, Guangdong, China. E-mail: syxiong@gdut.edu.cn
Thermo-X. 2026;2:202625. 10.70401/tx.2026.0031
Received: June 01, 2026Accepted: August 24, 2026Published: August 24, 2026
Abstract
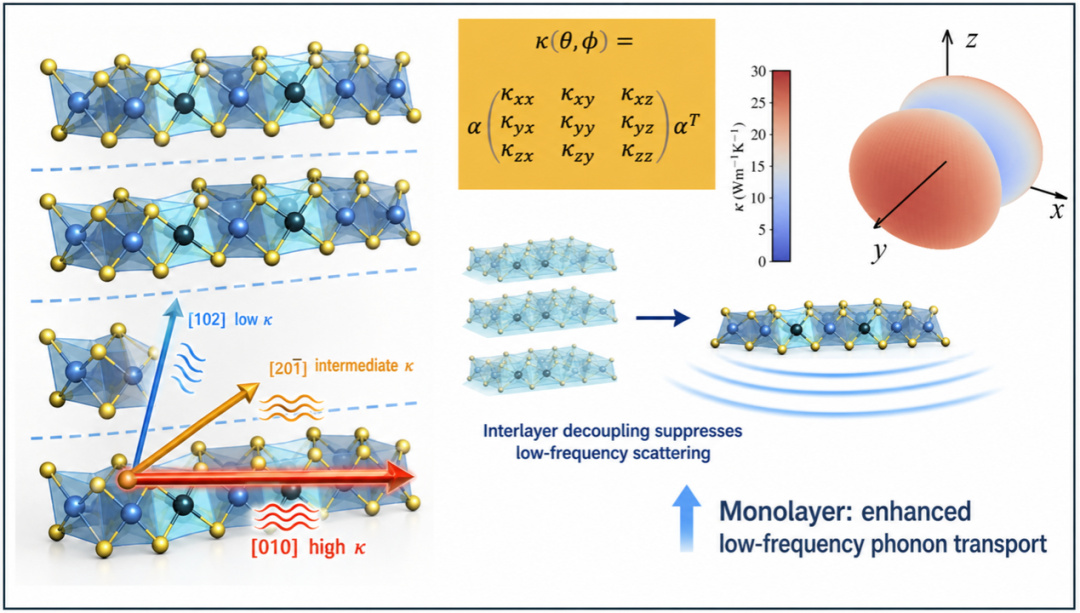
Layered chalcogenides X2PdY6 (X = Nb, Ta; Y = S, Se) offer tunable properties for energy conversion and electronic applications, yet their intrinsic lattice thermal transport remains poorly understood. Here, we develop neuroevolution potentials and use molecular dynamics to investigate phonon-mediated heat transport in ideal bulk and few-layer X2PdY6. At 300 K, the bulk crystals exhibit strong anisotropy, with the highest lattice thermal conductivity (LTC) along the in-plane [010] direction and the lowest along the cross-plane [102] direction. The corresponding anisotropy ratios are 10.4, 8.1, 14.3, and 9.0 for Nb2PdS6, Nb2PdSe6, Ta2PdS6, and Ta2PdSe6, respectively. Within each layer, LTC along [20
Graphical Abstract
Keywords
Lattice thermal conductivity, machine-learning molecular dynamics, spectral decomposition, phonons, transition metal chalcogenides
1. Introduction
Layered transition metal chalcogenides exhibit diverse physical properties[1-3], as well as promising optoelectronic properties[4-6], catalytic activity[7], and thermoelectric performance[8,9]. As a result, they have been extensively explored for applications in devices such as nanoelectronics[10], optoelectronic devices[4], electrochemical energy conversion[11], and energy storage[12,13]. Among all the transition metal chalcogenides, layered transition-metal sulfides have emerged as a particularly promising class of materials due to their tunable physical and chemical properties. By modifying the chemical composition and crystal structure, the electronic mobility and thermal conductivity of these materials can be substantially altered, providing a powerful strategy for designing
The X2PdY6 (X = Nb, Ta; Y = S, Se) family represents a novel class of layered transition metal chalcogenides, characterized by a unique monoclinic crystal structure with the space group C2/m. The monolayer structure consists of PdY4 tetrahedra and XY7 polyhedra, which are stacked together through van der Waals interactions[14]. This layered arrangement not only facilitates excellent exfoliation properties, enabling the preparation of monolayer or few-layer two-dimensional materials, but also imparts outstanding mechanical flexibility and unique electronic, optoelectronic, and thermal transport properties. For instance, Cho et al. demonstrated that a
As a promising candidate for micro- and nano-electronic devices, efficient heat dissipation in X2PdY6 is critical for reliable device operation. Previous transport measurements have reported the room-temperature total TC and electrical transport properties of single-crystalline Ta2PdS6 and Ta2PdSe6 along the b-axis ([010]) direction[8,23,24]. However, the phonon-mediated heat transport mechanisms, the full anisotropic lattice thermal conductivity (LTC), and the dimensional crossover from bulk to few-layer and monolayer X2PdY6 remain insufficiently understood. Therefore, a systematic investigation of the intrinsic lattice thermal transport behavior of ideal X2PdY6 and their layered nanostructures is still needed for evaluating their potential in thermal management and related applications.
In this study, we address this gap by training a machine learning potential (MLP) using the neuroevolution potential (NEP) model based on the dataset obtained by density functional theory (DFT) calculations. This NEP model accurately describes the interatomic interactions in bulk and layered X2PdY6. Using this model, we performed molecular dynamics (MD) simulations to investigate the thermal transport properties of bulk and layered X2PdY6. Our results demonstrate that the bulk X2PdY6 family exhibits anisotropic thermal transport properties, with the maximum and minimum LTCs along the in-plane [010] and the cross-plane [102] crystal directions, respectively. The LTC anisotropy ratios at 300 K for Nb2PdS6, Nb2PdSe6, Ta2PdS6, and Ta2PdSe6 reach 10.4, 8.1, 14.3, and 9.0, respectively. In layered structures, the LTC of X2PdY6 decreases with increasing layer thickness and approaches the corresponding bulk values when the number of layers reaches 5. These findings provide valuable insight into the tunability of thermal transport in the X2PdY6 family, paving the way for their potential application in thermal management.
2. Methodology
The bulk crystal of X2PdY6 belongs to the monoclinic crystal system and adopts a layered structure with the C2/m space group. As shown in Figure 1a, the unique layered crystal structure consists of PdY4 tetrahedra and XY7 polyhedra prisms. These structural units are alternately arranged, forming a stable layered lattice. The Y atoms can be categorized into four types: Y1 and Y2 are bonded to both Pd and X atoms, while Y3 and Y4 are bonded only to X atoms. In a unit cell, there are two atoms of types Y1, Y2, and Y3, and one atom of Y4. Figure 1b presents the projection of a single X2PdY6 layer, where the layers in the three-dimensional structure correspond to the (20
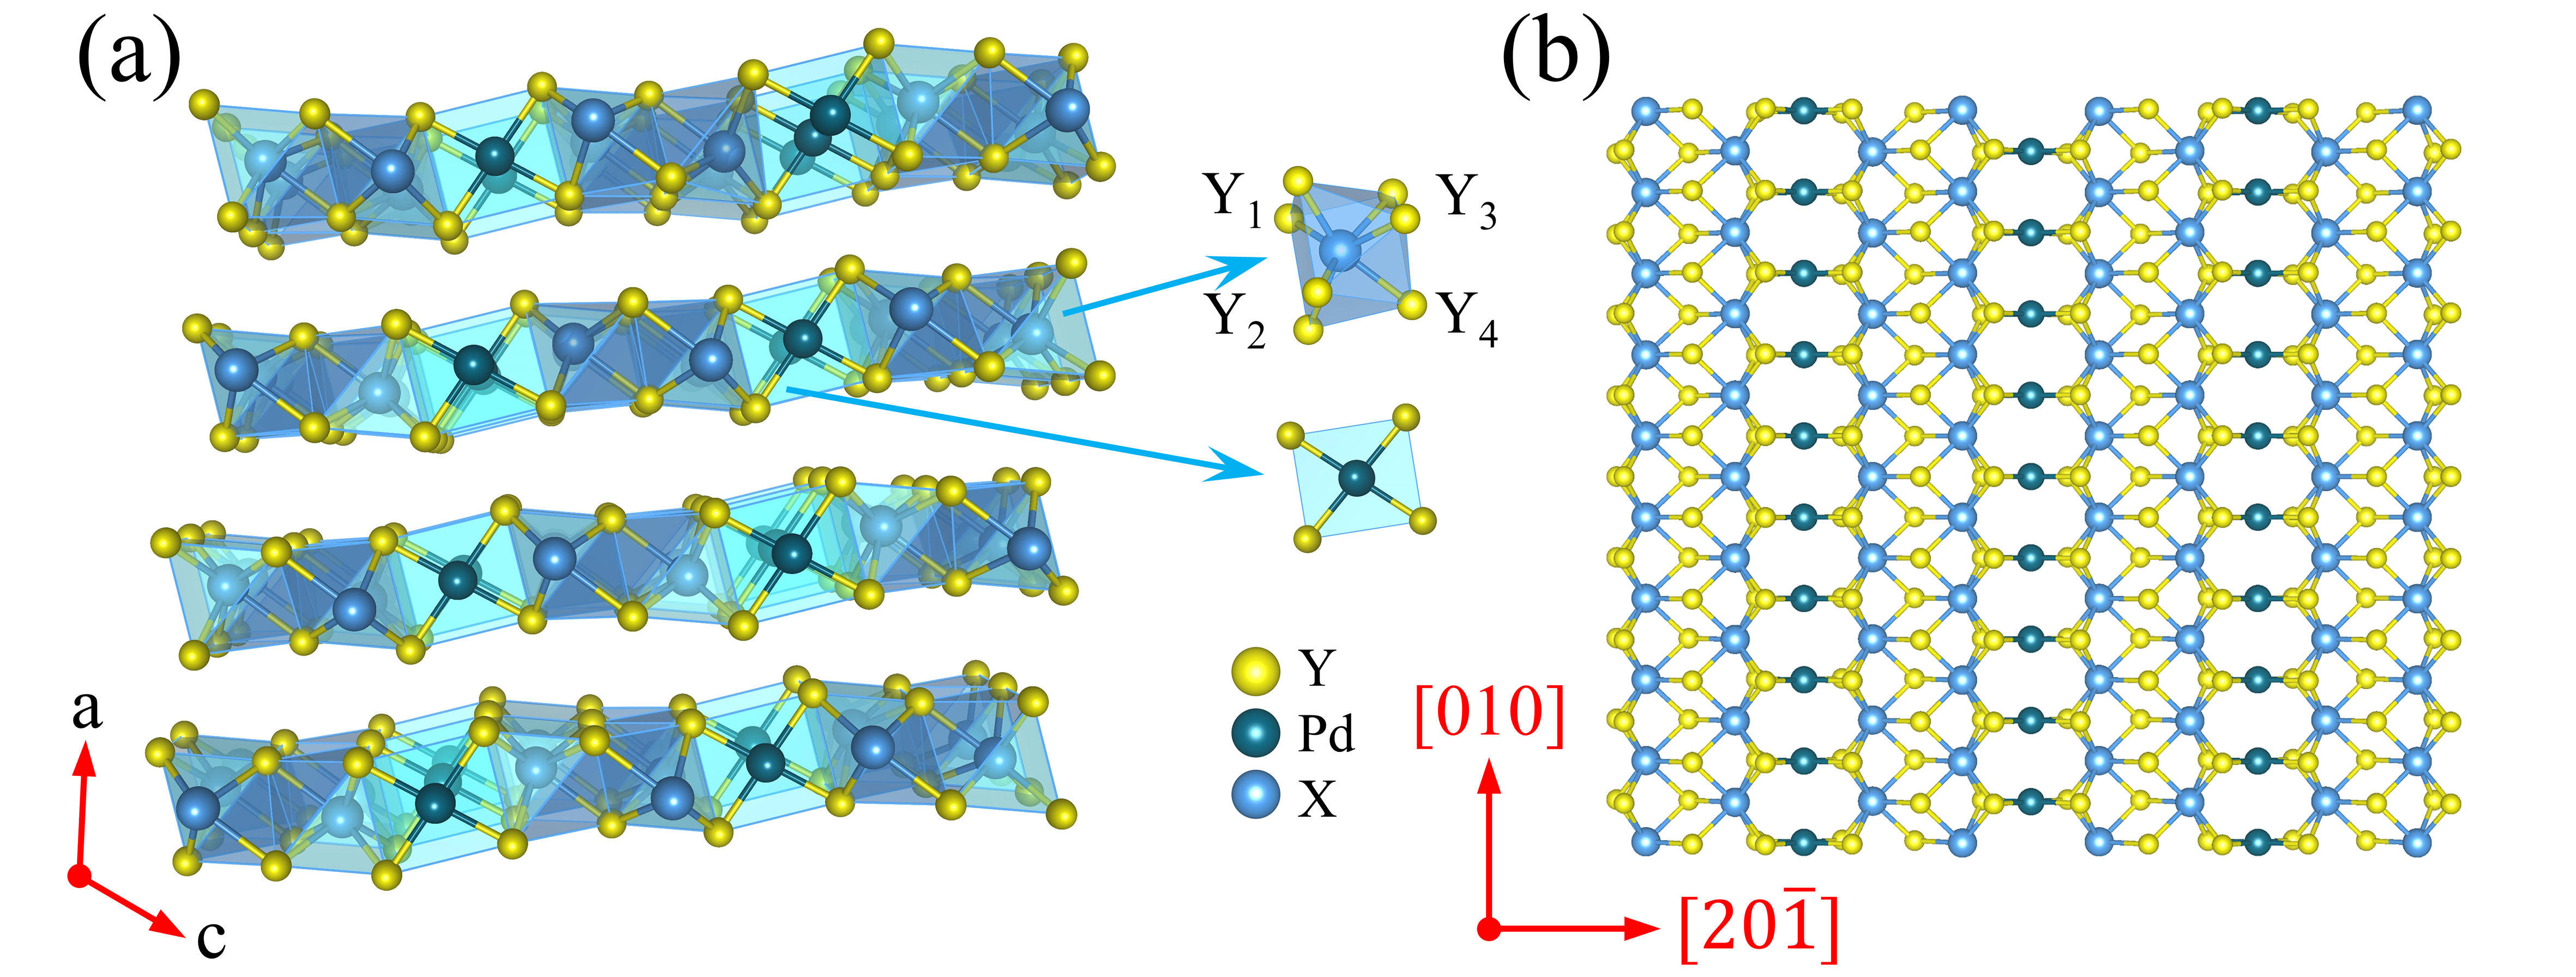
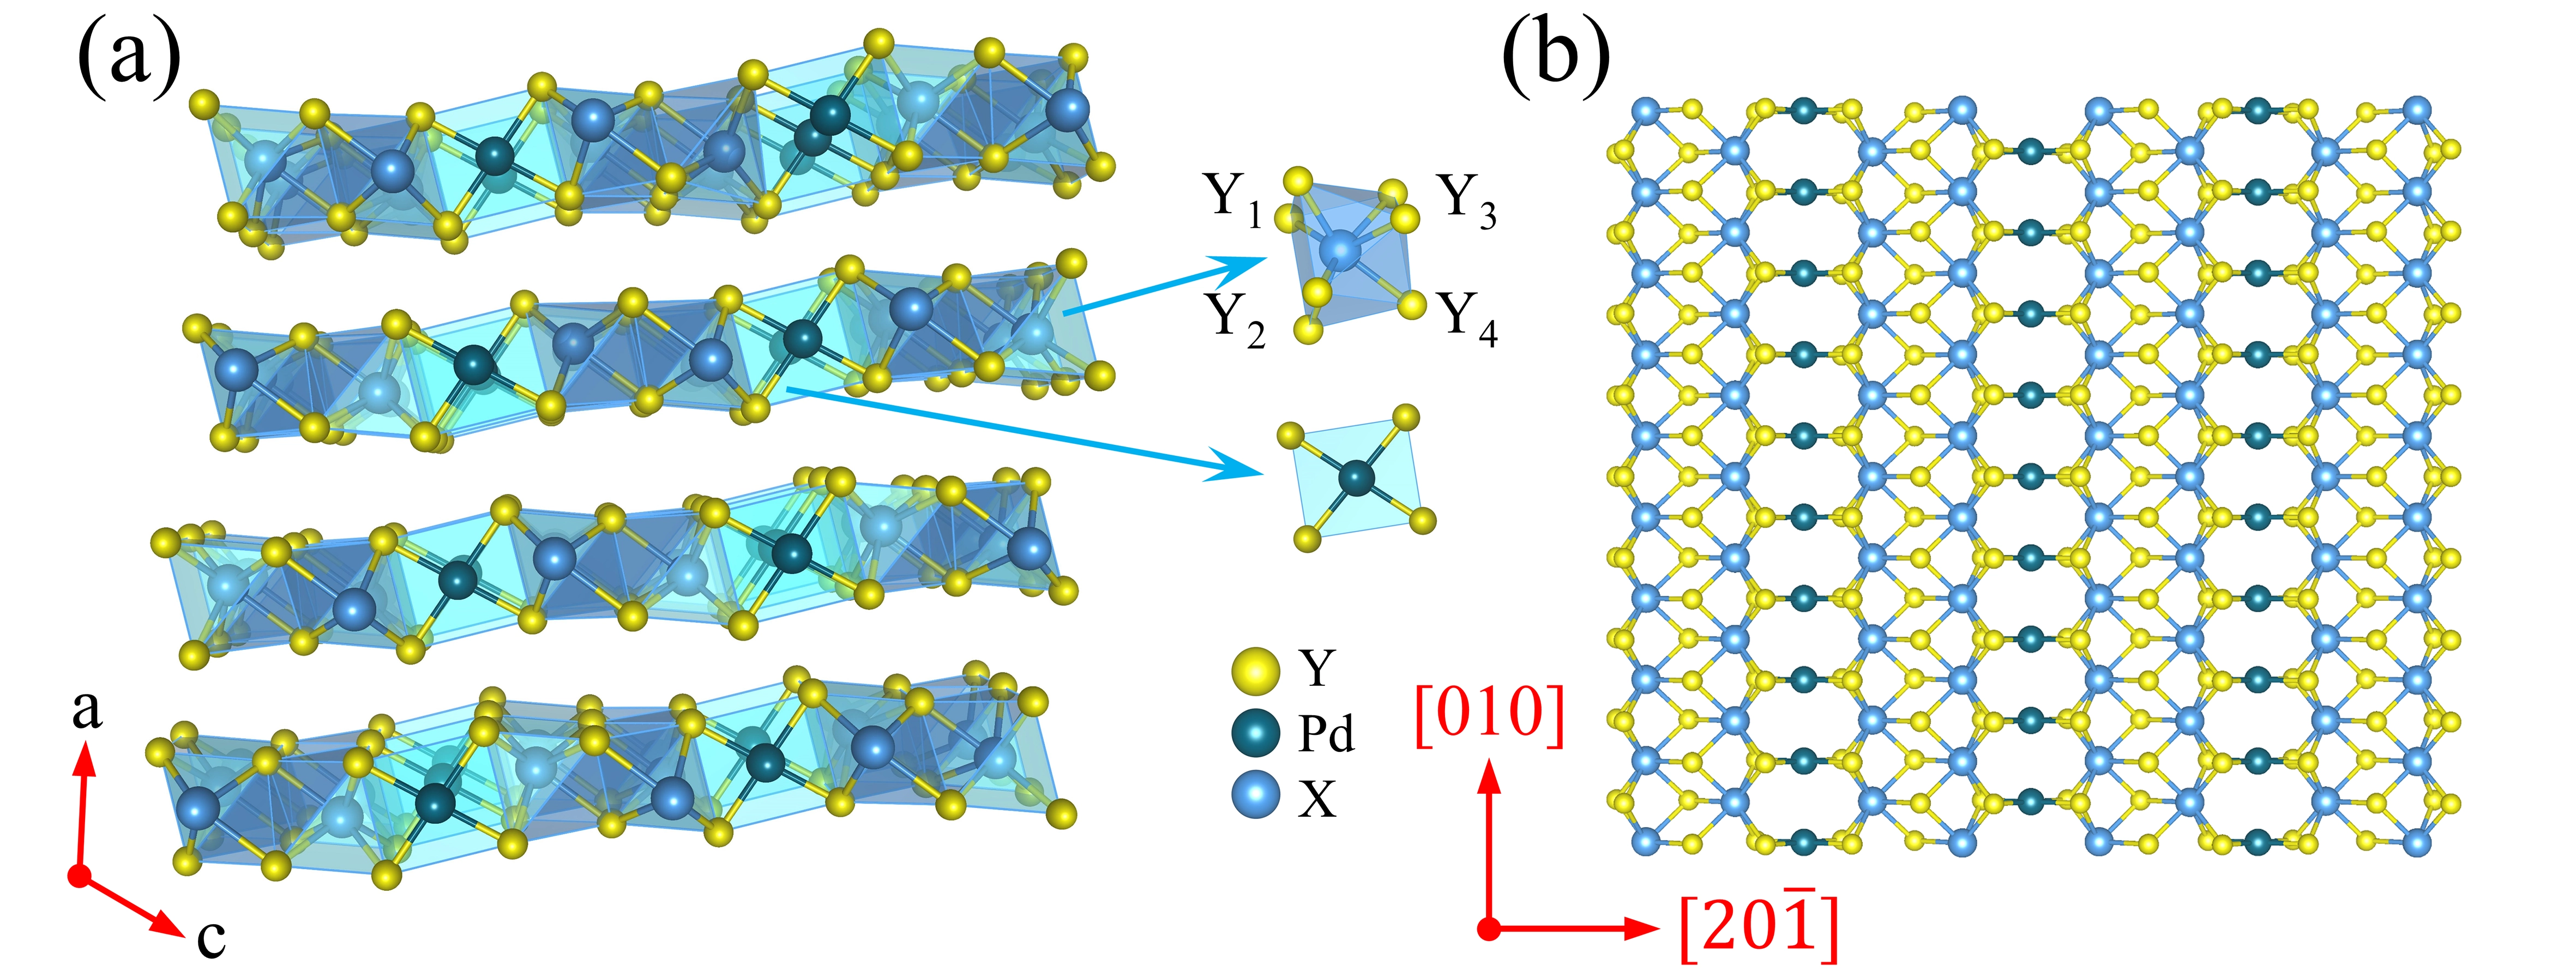
Figure 1. (a) Crystal structure of bulk X2PdY6 (X = Nb, Ta ; Y = S, Se); (b) Projected structure of monolayer X2PdY6 (X = Nb, Ta; Y = S, Se).
To accurately describe the interatomic interactions in X2PdY6, we trained a MLP based on the NEP framework. MLPs are widely adopted for atomistic simulations[25]. The training datasets were constructed through a combination of ab initio molecular dynamics (AIMD) simulations, random atom displacement, lattice deformation, and active learning Figure 2. The detailed composition of training datasets is listed in Table S1. We included a small number of high temperature AIMD configurations above the experimentally accessible thermal stability range of some materials (1,200 K and 1,600 K)[15]. These structures are helpful for sampling larger displaced local environments and short-range repulsive regions of the potential energy surface, thereby reducing extrapolation during MD simulations at the target temperatures.
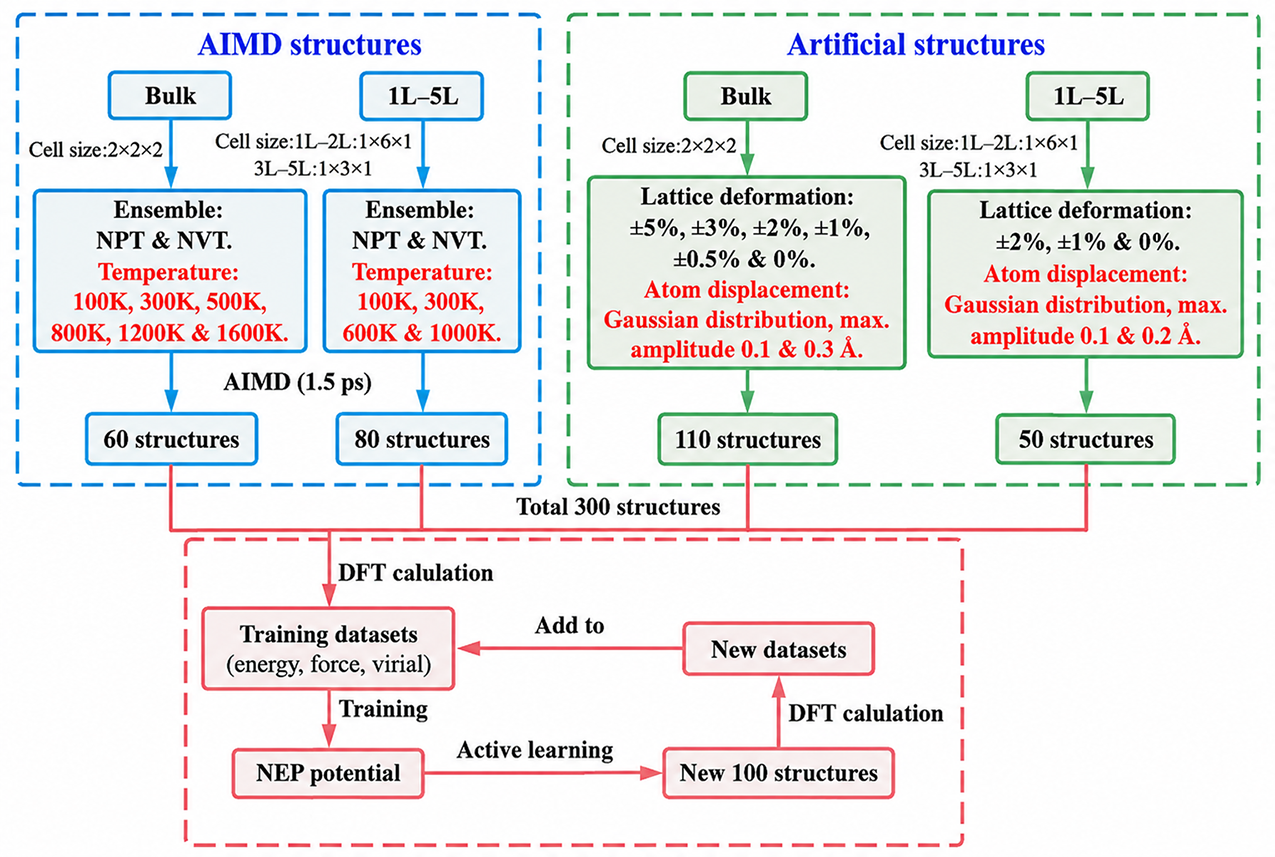
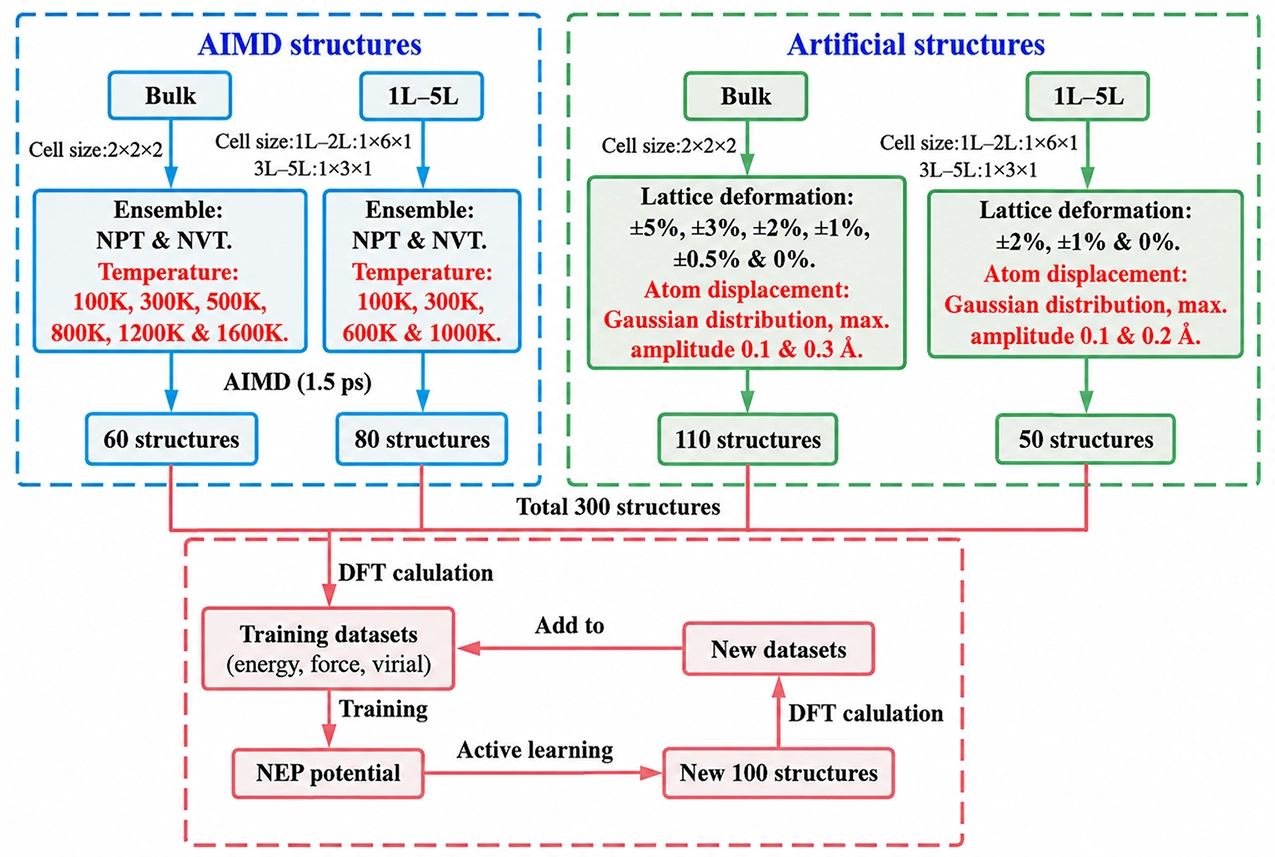
Figure 2. Training set workflow chart. DFT: density functional theory; AIMD: ab initio molecular dynamics; NEP: neuroevolution potential; NPT: number of particles, pressure, and temperature; NVT: number of particles, volume, and temperature.
All DFT calculations for the training datasets were performed using the vienna ab initio simulation package (VASP)[26] with the projector augmented wave (PAW) method[27]. The generalized gradient approximation (GGA) in the form of the
After constructing the training datasets, we trained the MLP for X2PdY6 using the fourth-generation NEP framework within the graphics processing units molecular dynamics (GPUMD) package[33]. The precision of the model was evaluated using the root mean square error (RMSE), which quantifies the deviation between the predicted values of the model and the reference data. The hyperparameters used for training the NEP model are provided in Table 1.
Table 1. Training hyperparameters of X2PdY6 (X = Nb, Ta; Y = S, Se) NEP model.
| Parameter | Value | Parameter | Value |
| rRC | 8 | rAC | 5 |
| nRmax | 4 | nAmax | 4 |
| nRbas | 12 | nAbas | 12 |
| l3bmax | 4 | l4bmax | 2 |
| Nneu | 40 | λe | 1 |
| λf | 1 | λv | 0.1 |
| Nbat | 2,000 | Npop | 50 |
| Ngen | 5 × 10⁵ |
NEP: neuroevolution potential.
To simulate the LTCs of X2PdY6, we employed the GPUMD package in conjunction with the homogeneous nonequilibrium molecular dynamics (HNEMD) method. The LTC is calculated as[34,35]:
where, κμv is the LTC tensor, T and V are the temperature and volume of the system, respectively, and
where
where G(ω) is the spectral thermal conductance in the ballistic limit, obtained from nonequilibrium molecular dynamics (NEMD) simulations[37-39]. The setup for NEMD simulations is illustrated in Figure S1 and the corresponding descriptions.
Based on the relationship between the MFP and the diffusive transport LTC, the variation of the LTC with length can be obtained for each frequency:
The total LTC κ(L) as a function of system length was then obtained by integrating over all frequencies:
For MD simulations, we employed the velocity-Verlet algorithm with a time step of 1 fs to update the positions and velocities of the particles. For bulk X2PdY6, we constructed a 5 × 25 × 6 supercell (approximately 5.9 nm × 8.2 nm × 5.9 nm) by expanding the monoclinic unit cell along the a, b, and c lattice directions. For the two-dimensional structures, we built a 5 × 30 supercell (approximately
The present NEP based HNEMD simulations describe only phonon mediated lattice thermal transport in ideal stoichiometric crystals. Electronic thermal conductivity (TC), electron-phonon scattering, and extrinsic scattering by defects or sample boundaries are not included. Therefore, the calculated LTC should not be equated with the experimentally measured total TC, particularly for the semimetallic compounds for which the electronic contribution may be appreciable.
3. Results and Discussion
Figure 3a presents the evolution of RMSE for energy, forces, and virial during the training of the Ta2PdS6 NEP model as a function of training generation. The RMSE values for all three metrics decrease significantly in the initial stages of training and stabilize after reaching 105 generation, indicating that the model's fitting accuracy improves progressively and converges effectively. The precision of the NEP model is further illustrated by the parity plots for energy, forces, and virial stress, shown in Figure 3b,c,d. These plots show excellent diagonal alignment, confirming the model’s high fitting accuracy for these physical quantities. The corresponding RMSE values are 1.95 meV/atom for energy, 114.95 meV/Å for forces, and 18.73 meV/atom for virial stress. Similar results are observed for Nb2PdS6, Nb2PdSe6, and Ta2PdSe6, as shown in Figures S3,S4,S5. For these materials, the RMSE values for energy, forces, and virial stress are all below 2.1 meV/atom, 120.0 meV/Å, and 18.8 meV/atom, respectively. These results collectively demonstrate the high accuracy of the trained NEP models in describing the interatomic interactions in X2PdY6.
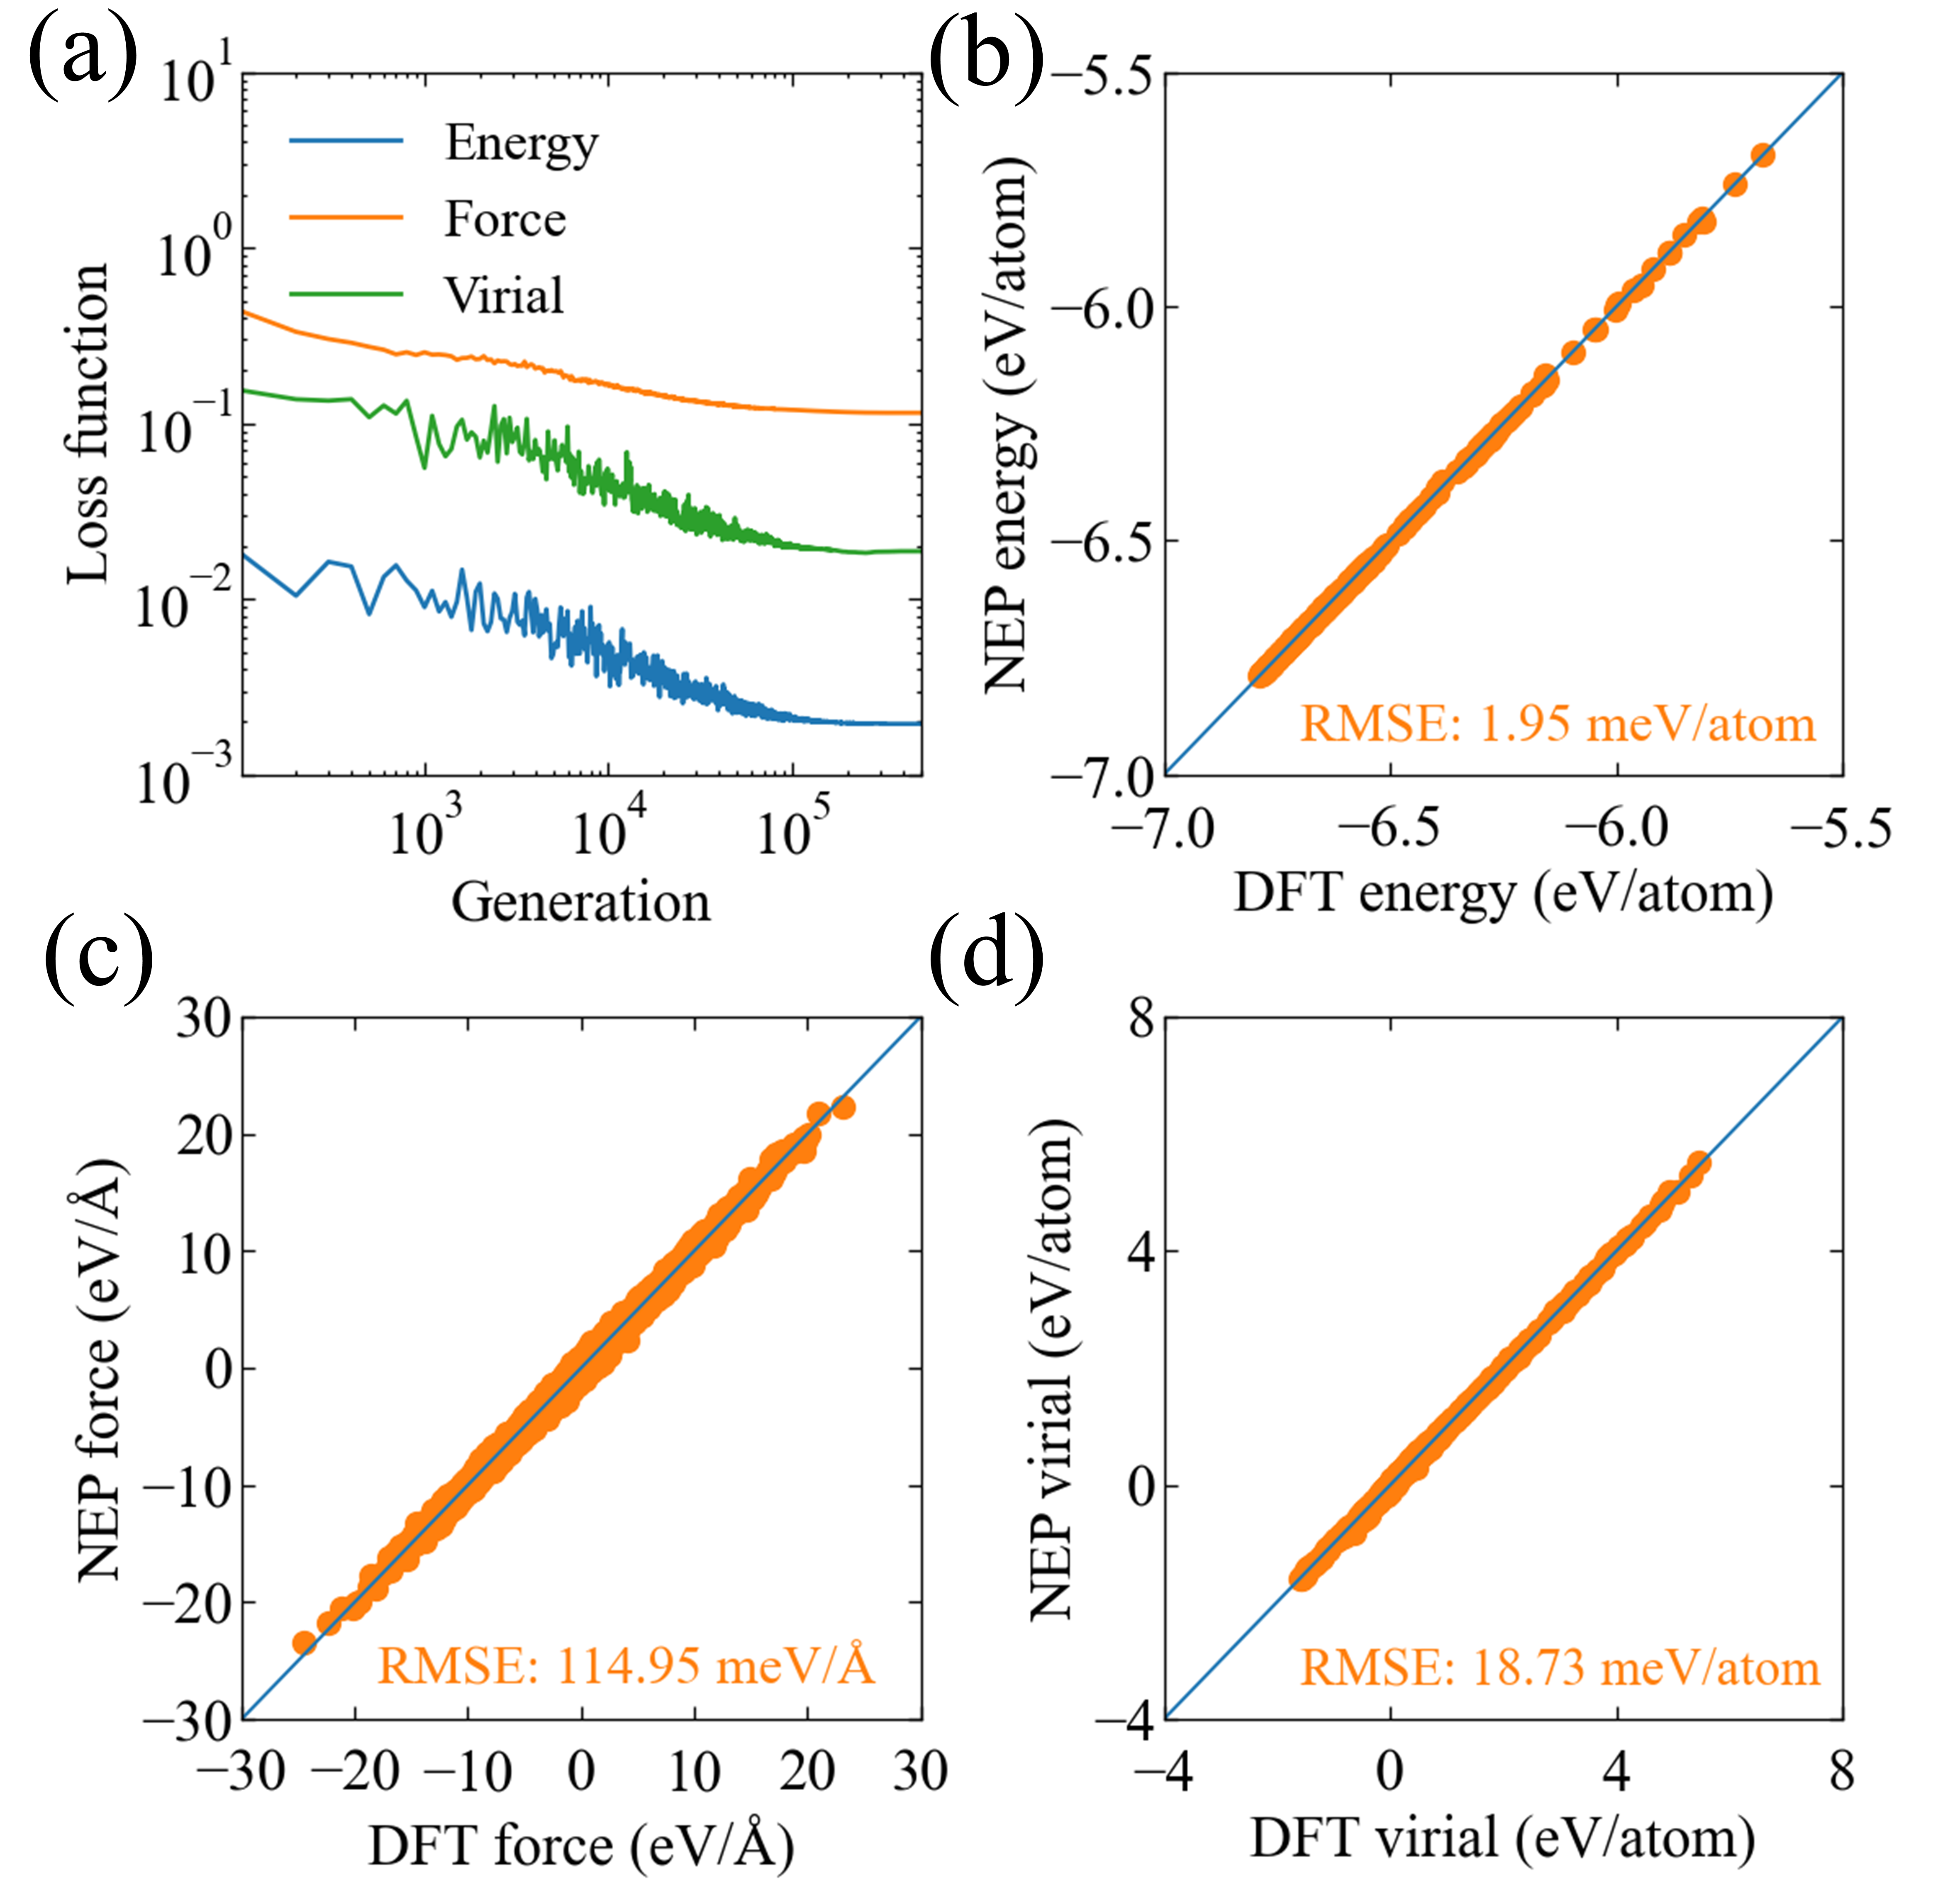
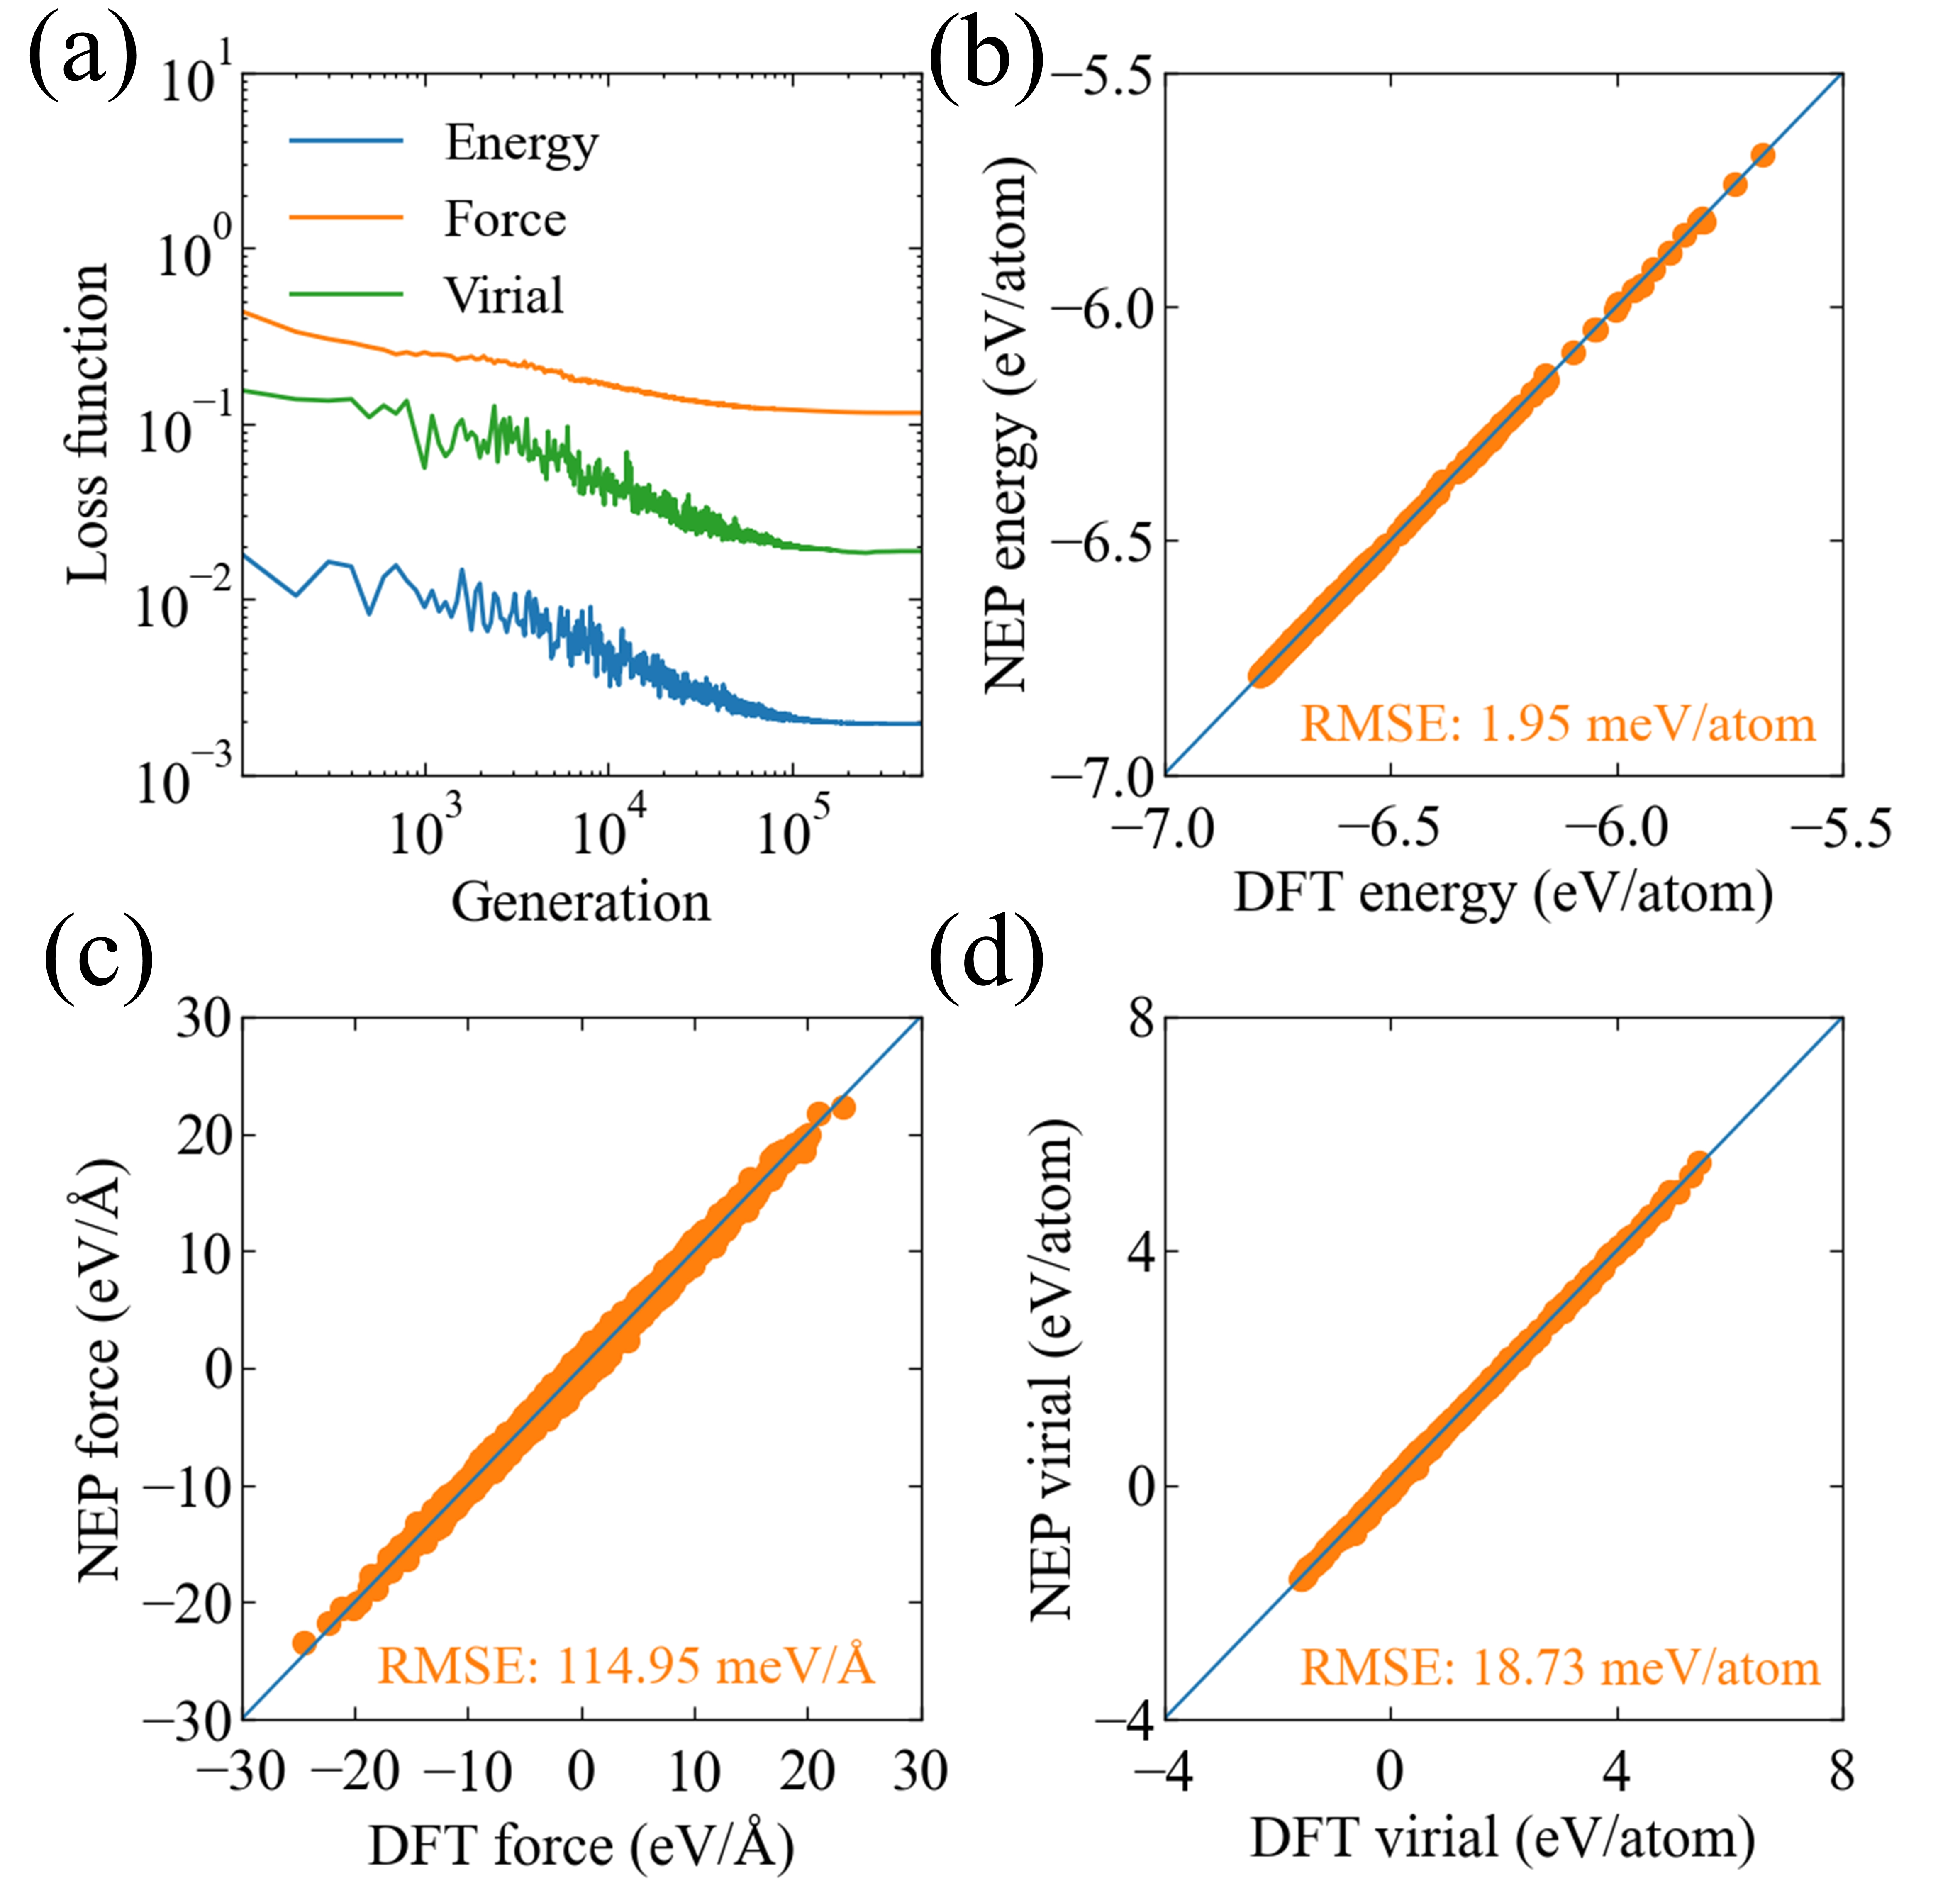
Figure 3. (a) Ta2PdS6 NEP model training iterative process of energy, force and virial; (b-d) Parity plot of energy, force and virial. NEP: neuroevolution potential; DFT: density functional theory; RMSE: root mean square error.
To further validate the reliability of the NEP model, we compared the lattice constants of X2PdY6 predicted by the NEP model with those obtained from DFT calculations and experimental values (Table 2). The lattice constants predicted by the NEP model for the four materials show excellent agreement with both the DFT and experimental results, with only minor deviations, confirming the accuracy of the NEP model training. This also underscores the reliability of the DFT method in describing the structural properties of X2PdY6. Figure S6 compares the energy-volume relationship predicted by the NEP model with the results from DFT calculations. The close agreement between the two further validates the accuracy of the trained NEP model.
Table 2. Comparison of experimental measurements with DFT and NEP calculations of X2PdY6 (X = Nb, Ta; Y = S, Se) lattice constants.
| Material | Experiment[14] | DFT | NEP | ||||||
| a (Å) | b (Å) | c (Å) | a (Å) | b (Å) | c (Å) | a (Å) | b (Å) | c (Å) | |
| Nb2PdS6 | 11.69 | 3.30 | 9.99 | 11.58 | 3.23 | 9.81 | 11.58 | 3.24 | 9.80 |
| Nb2PdSe6 | 12.13 | 3.36 | 10.37 | 12.24 | 3.34 | 10.30 | 12.30 | 3.34 | 10.32 |
| Ta2PdS6 | 11.69 | 3.27 | 9.97 | 11.57 | 3.25 | 9.84 | 11.60 | 3.25 | 9.85 |
| Ta2PdSe6 | 12.20 | 3.38 | 10.42 | 12.28 | 3.35 | 10.34 | 12.33 | 3.36 | 10.38 |
NEP: neuroevolution potential; DFT: density functional theory.
Additionally, we predicted the phonon spectra of bulk X2PdY6 based on the NEP model and compared them with the results of DFT calculations. Figure 4 presents the phonon dispersion relations for the four systems in their bulk state. The phonon spectra predicted by the NEP model agree well with those obtained from DFT calculations, with no significant discrepancies. Although minor differences are observed in certain optical phonon branches, these local variations have a negligible impact on the LTC, as confirmed by our subsequent spectral decomposition of the LTC, where the high-frequency optical phonons contribute minimally to the LTC. These results demonstrate that the NEP model reliably predicts the phonon properties and LTC of X2PdY6 materials.
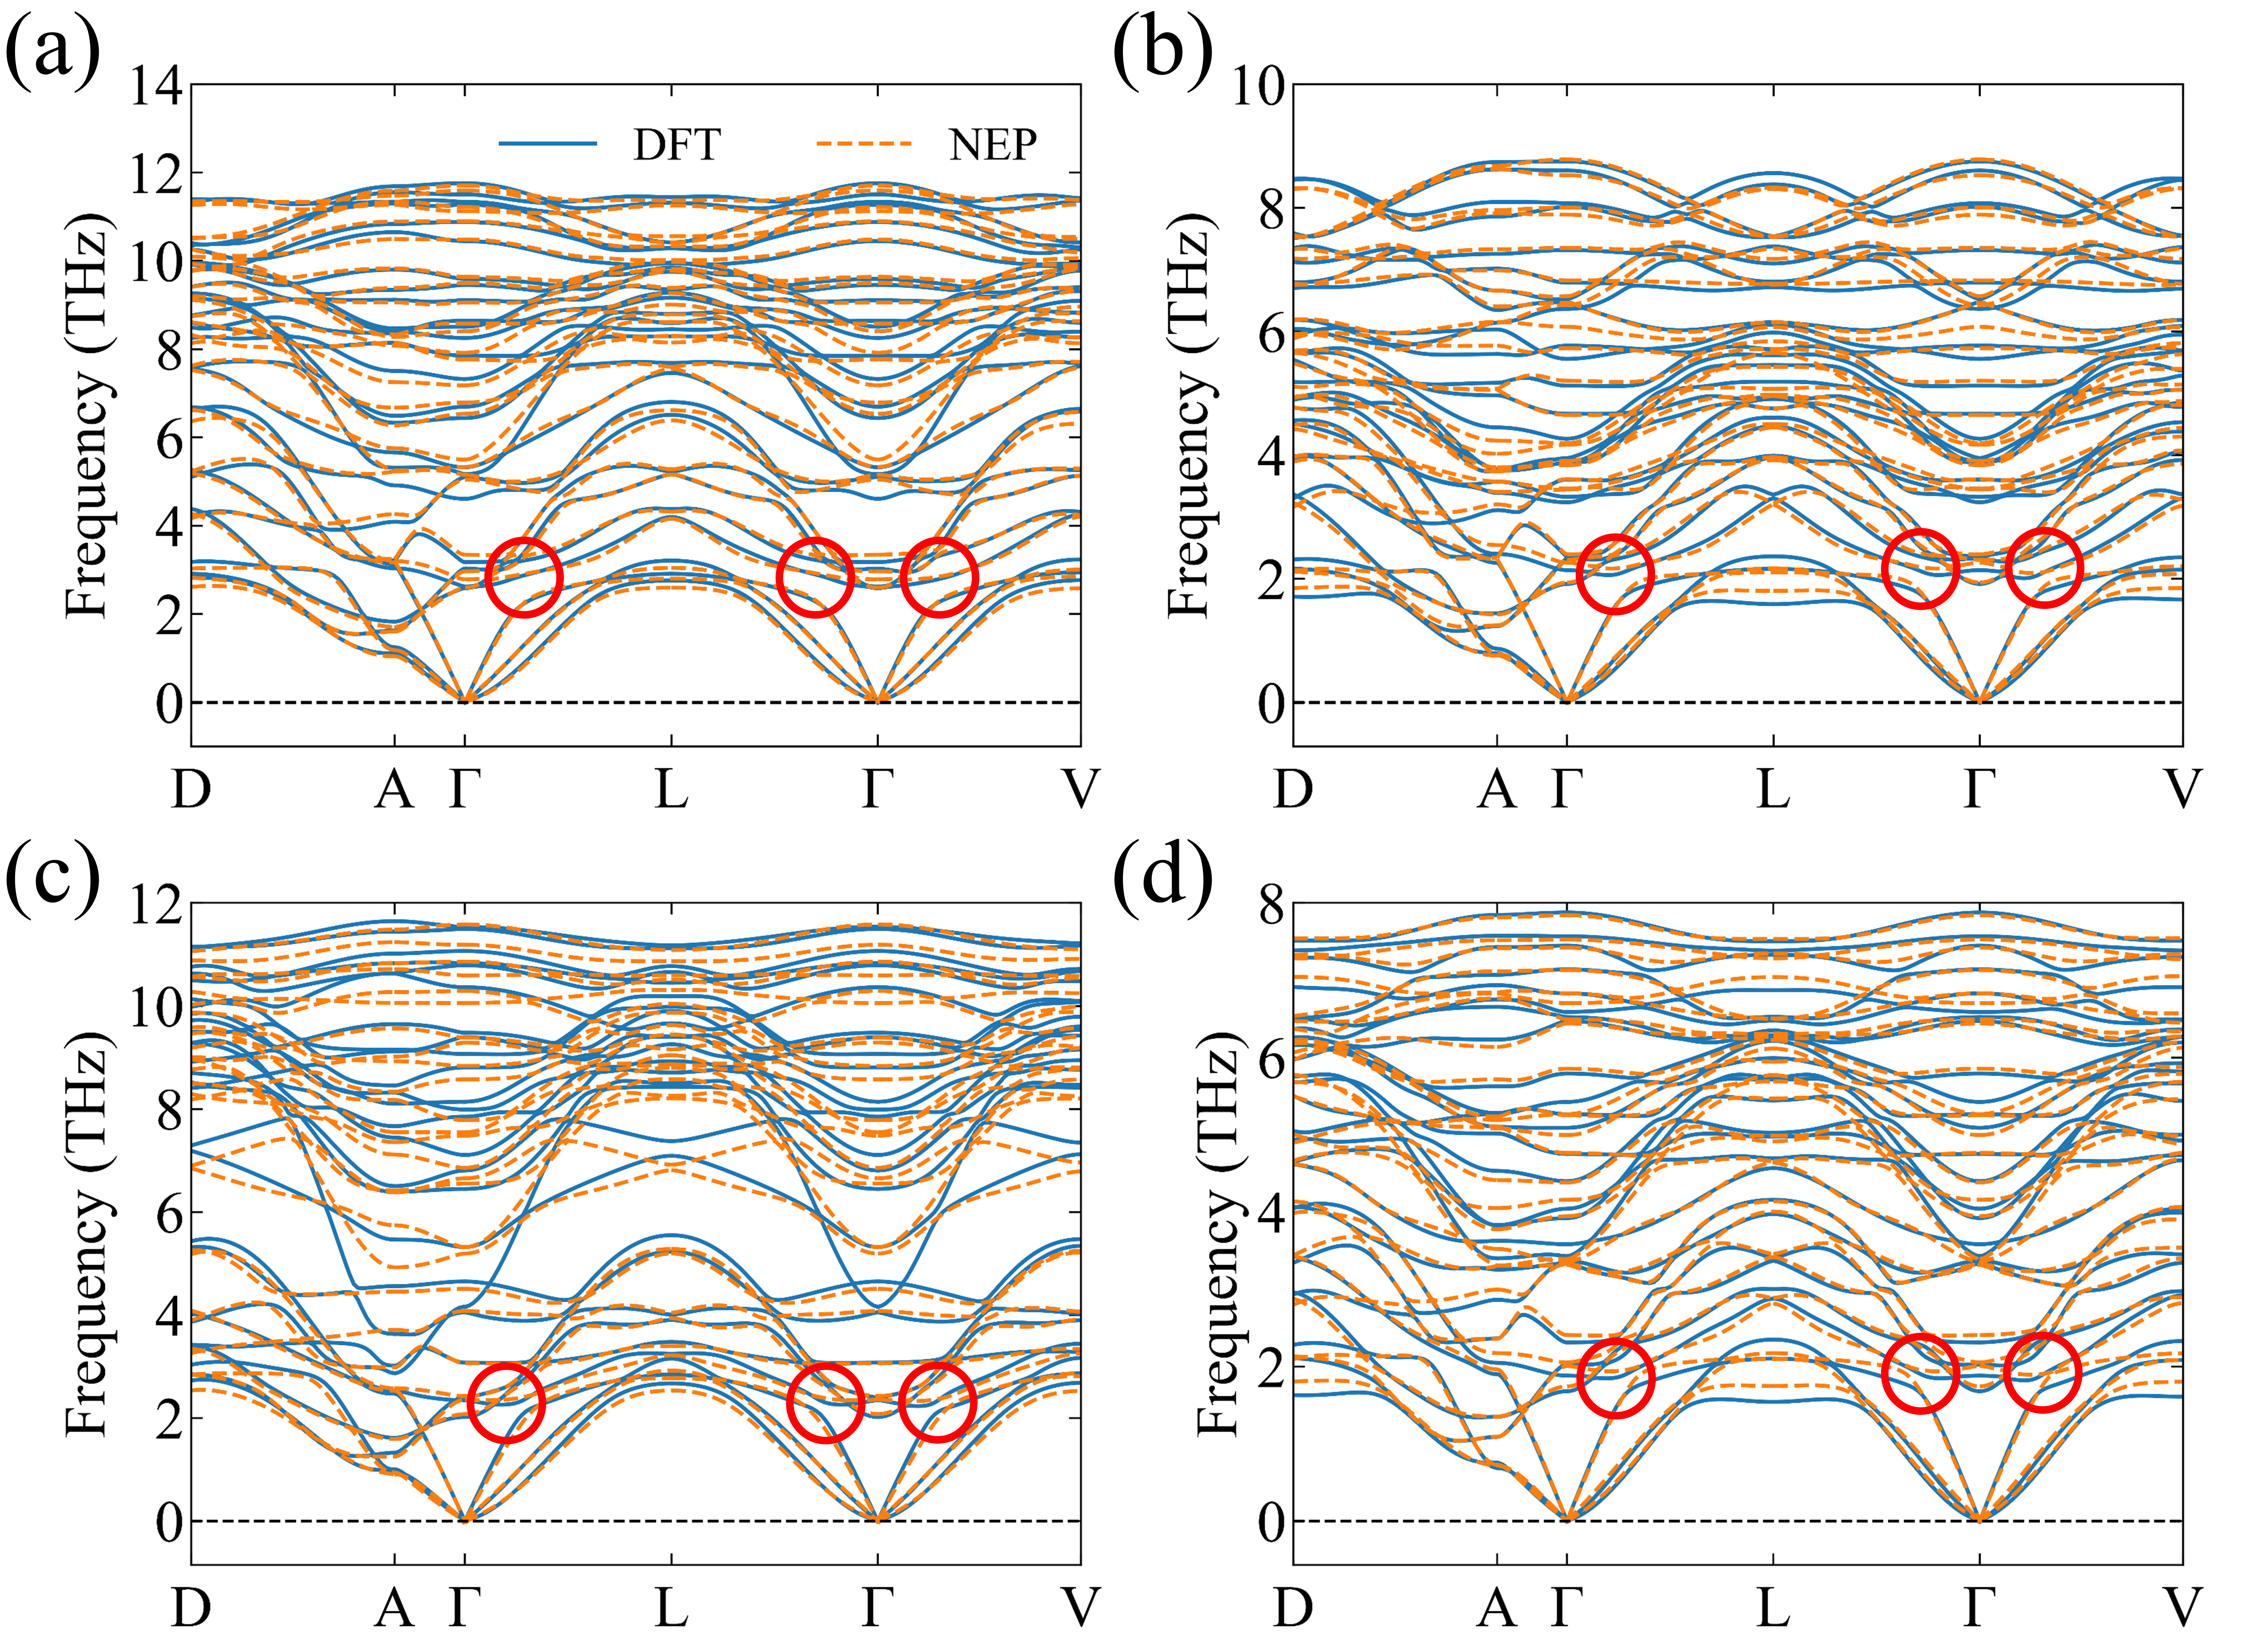
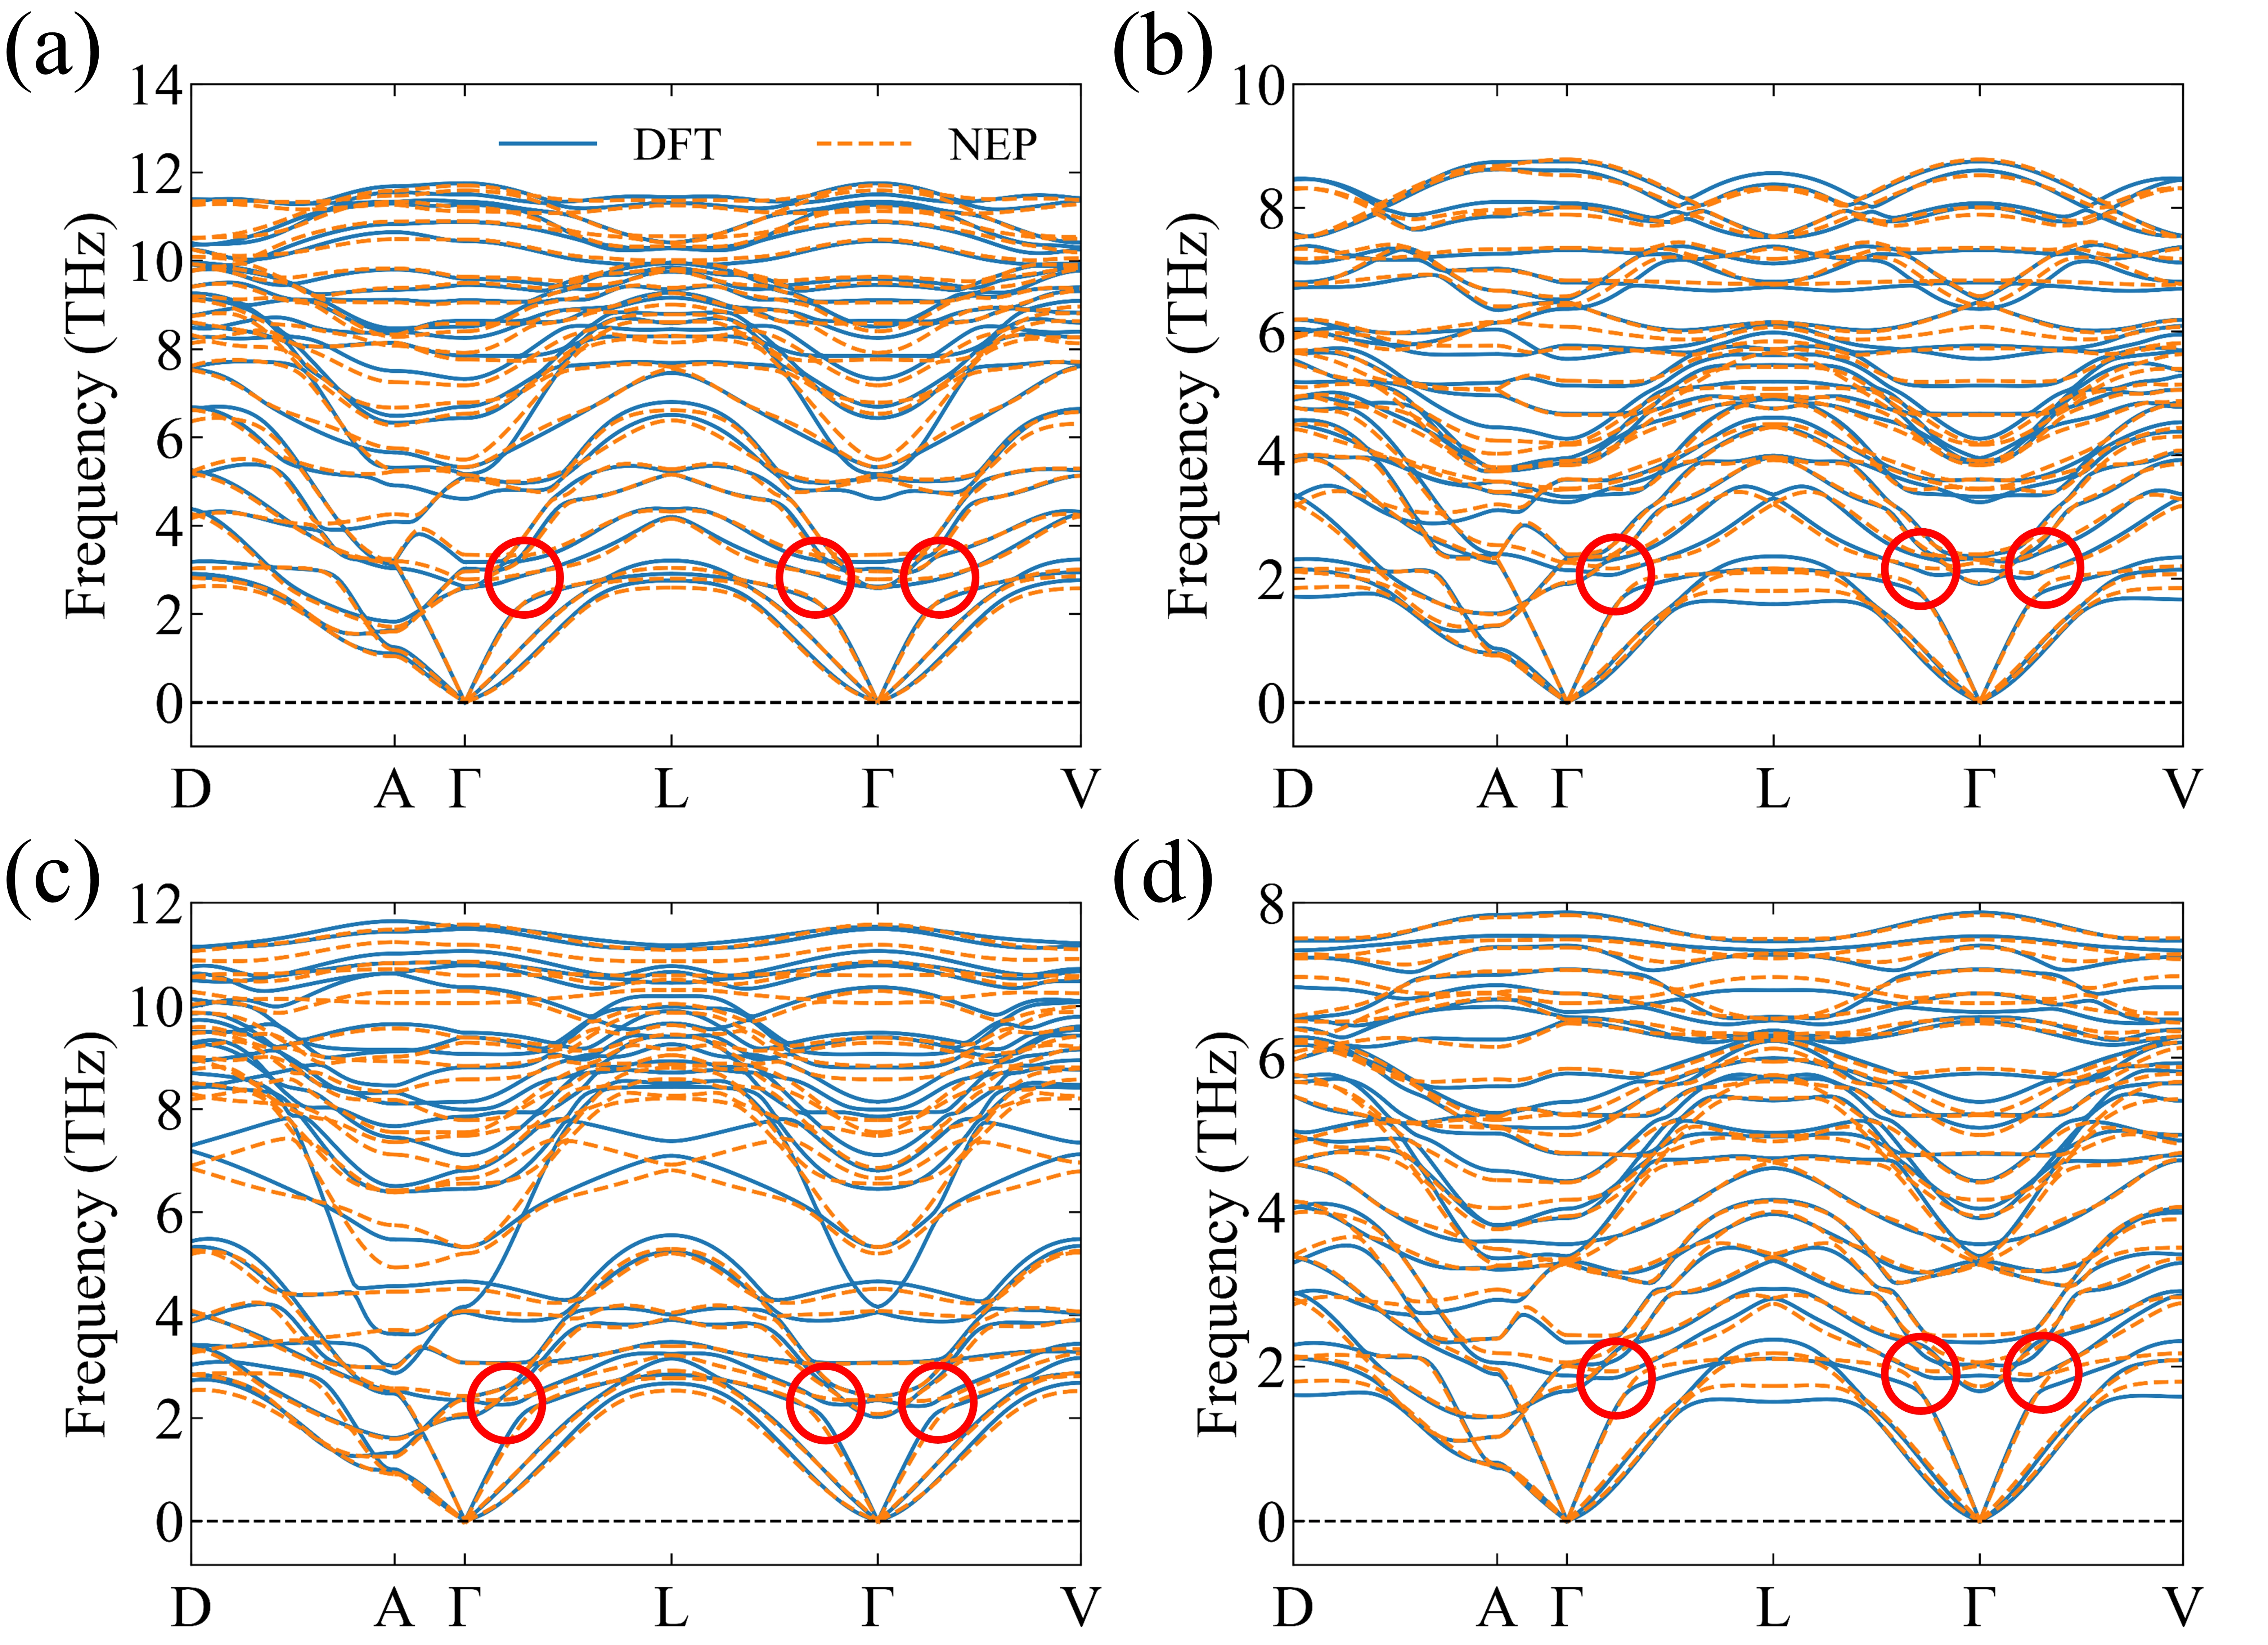
Figure 4. Comparison of phonon dispersion curves calculated by DFT and predicted by NEP. (a) Nb2PdS6; (b) Nb2PdSe6; (c) Ta2PdS6; (d) Ta2PdSe6. The red circle indicates phonon hybridization. DFT: density functional theory; NEP: neuroevolution potential.
The unit cell of X2PdY6 contains 9 atoms, resulting in 27 dispersion branches. Due to the similar crystal structures of the four materials, their dispersion curves exhibit similar shapes and characteristics. However, the phonon cutoff frequencies vary due to differences in atomic masses. Nb2PdS6 has the highest cutoff frequency of 12 THz. The replacement of Nb atoms with heavier Ta atoms slightly reduces the cutoff frequency, while substituting S atoms with Se atoms leads to a more pronounced decrease. Specifically,
After validating the precision of the NEP model, we used the HNEMD method (Equation 1) to calculate the LTCs of bulk X2PdY6. X2PdY6 belongs to the monoclinic crystal system with the C2/m space group, where the b axis is perpendicular to the a and c axes, but the a and c axes form an angle of approximately 115°. In our model, the a and b axes are aligned with the x and y axes, respectively, while the c axis is oriented at an angle to the z direction. Due to the lower symmetry of the monoclinic crystal system, the LTC tensor contains non-zero off-diagonal elements, reflecting anisotropic thermal transport characteristics and coupling between different crystallographic directions. Using the HNEMD method, we calculated the full LTC tensor by applying the driving forces sequentially along three orthogonal axes. This approach allows us to determine all components of the LTC tensor, significantly improving the precision of the calculations and enabling the determination of the LTC in any direction. As illustrated in Figure 5a, LTC in any direction (θ, ϕ) can be derived from the LTC tensor using the following transformation[41,42]:
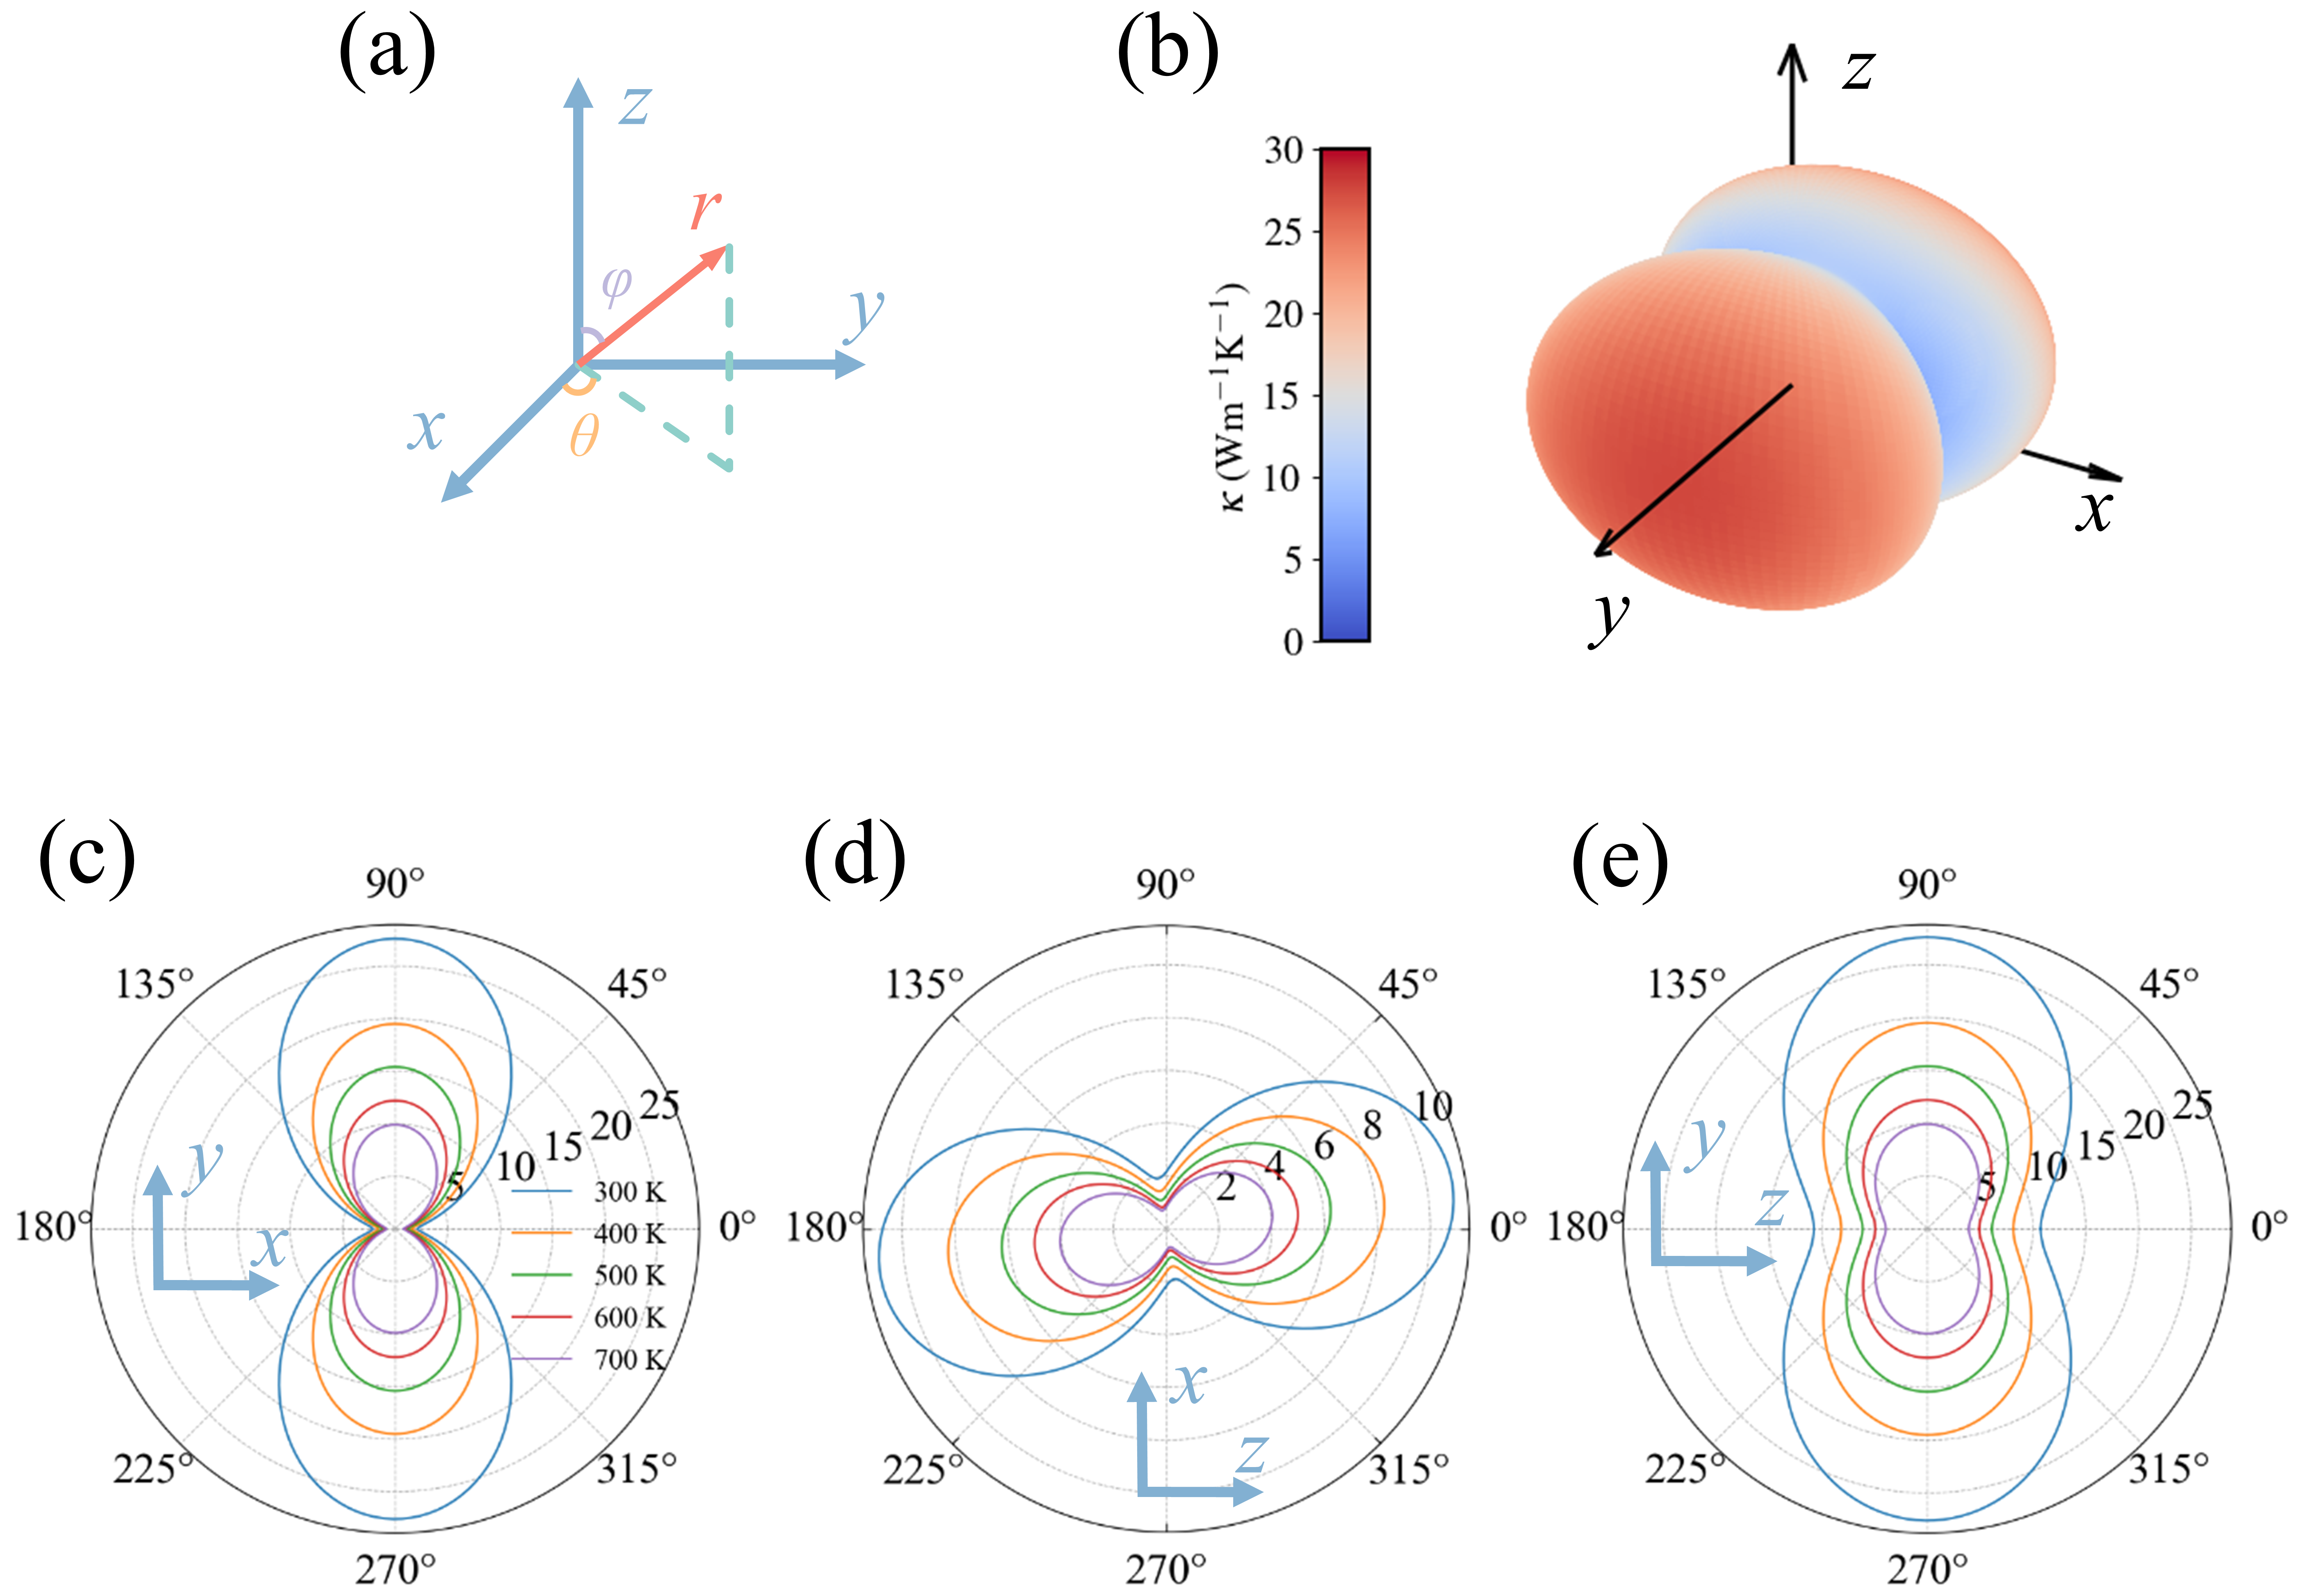
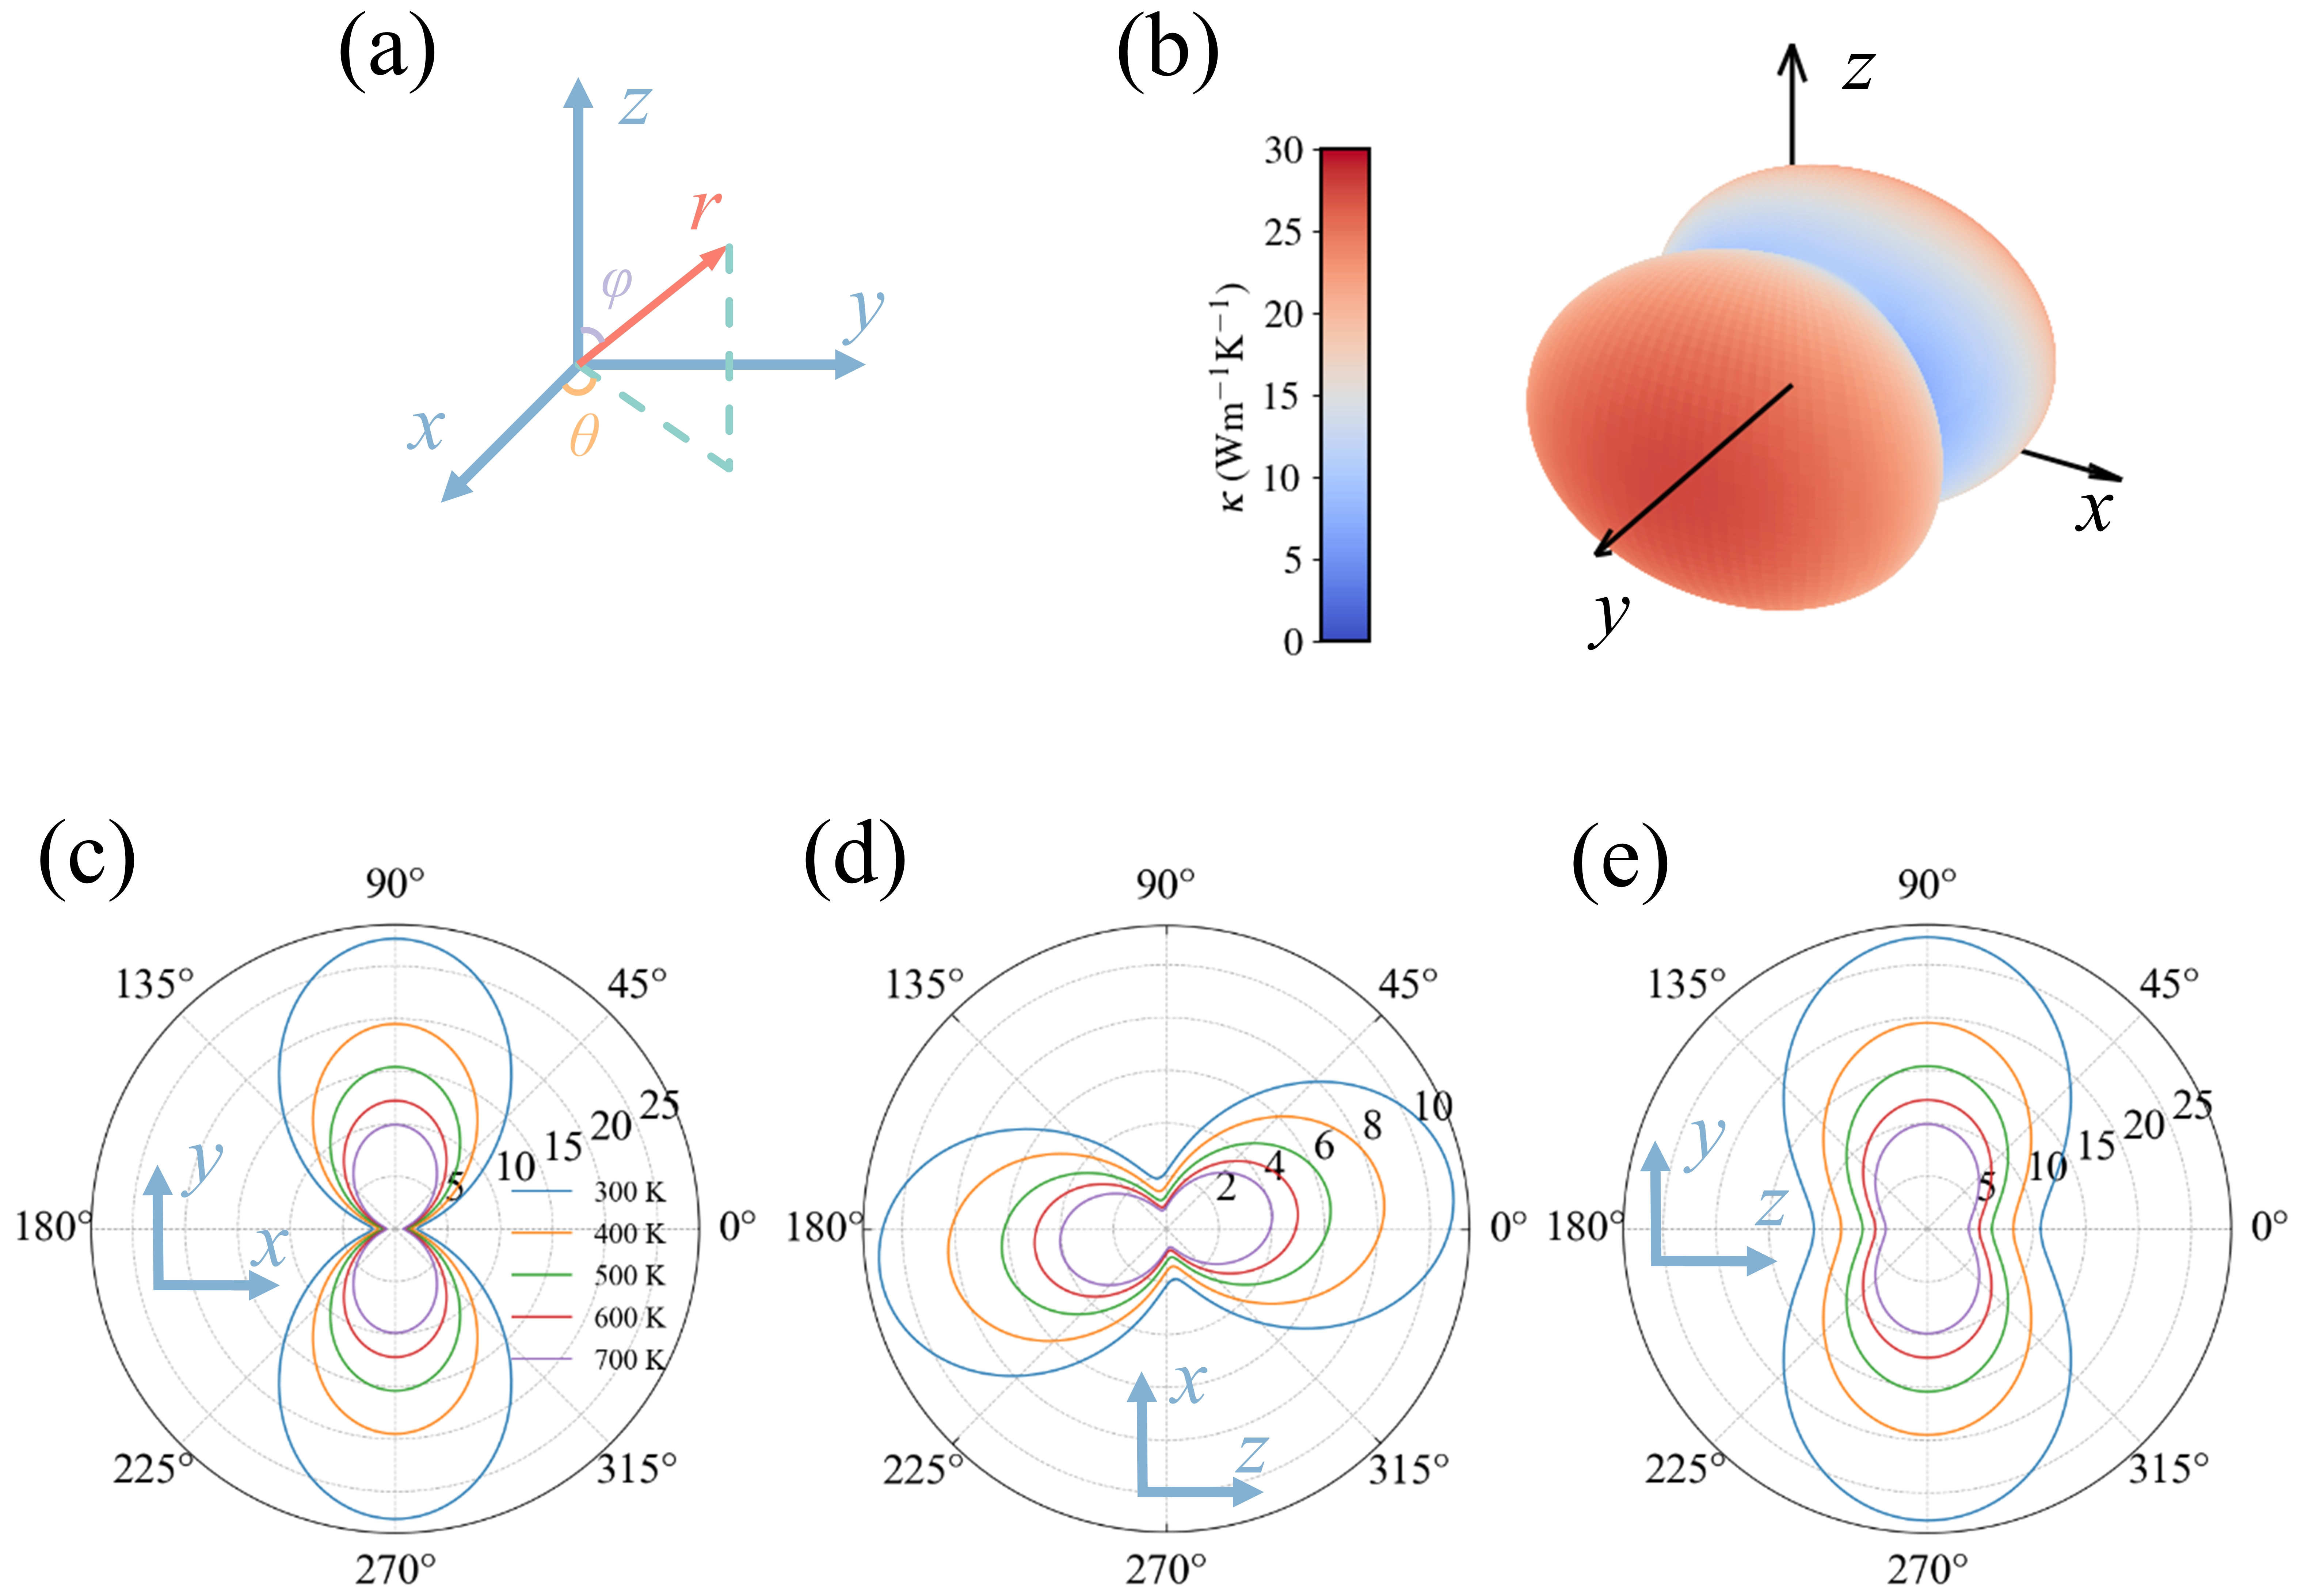
Figure 5. (a) Calculation of the polar coordinates of LTC; (b) Polar plot of LTC for Ta2PdS6 at 300 K; (c-e) Two-dimensional projection maps of LTC on the crystal planes {001} (c), {010} (d), and {100} (e). The units for LTC are all (Wm-1 K-1). LTC: lattice thermal conductivity.
where α = (sinϕcosθ, sinϕsinθ, cosϕ). All crystallographic LTCs reported below were obtained from the above full tensor transformation without approximating a crystallographic direction by a Cartesian axis.
Figure S2 shows the variation of the average LTC of Ta2PdS6 at 300 K as a function of production time. Among the off-diagonal elements of the LTC tensor, κxy, κyx, κzy, and κyz are nearly zero, indicating that the heat flow in the y direction is largely decoupled from the x and z directions. In contrast, κxz and κzx exhibit significant non-zero values, implying strong coupling between heat flows along the x and z directions. This behavior is consistent with the symmetry characteristics of the monoclinic crystal system. The LTC tensor at 300 K for the four compounds is shown in Table S2. Based on the LTC tensor, we calculate the spatial variation of LTC for
Table 3. The LTC of bulk X2PdY6 (X = Nb, Ta; Y = S, Se) along the [102], [010], and [20
| Material | LTC (Wm-1 K-1) | κmax/κmin | ||
| [102] | [010] | |||
| Nb2PdS6 | 2.70 ± 0.73 | 27.99 ± 1.66 | 14.27 ± 0.76 | 10.4 |
| Nb2PdSe6 | 1.94 ± 0.34 | 15.75 ± 0.81 | 8.34 ± 0.37 | 8.1 |
| Ta2PdS6 | 1.93 ± 0.29 | 27.59 ± 2.86 | 10.97 ± 1.02 | 14.3 |
| Ta2PdSe6 | 1.73 ± 0.22 | 15.58 ± 0.78 | 5.80 ± 1.20 | 9.0 |
LTC: lattice thermal conductivity; HNEMD: homogeneous nonequilibrium molecular dynamics.
Experimentally, the room-temperature total TC values measured along the b-axis ([010]) are approximately 14.0 W m-1 K-1 for Ta2PdS6 and 17.0 W m-1 K-1 for Ta2PdSe6[8]. For Ta2PdS6, the calculated [010] LTC (27.59 ± 2.86 W m-1 K-1) is higher than the measured total TC. In contrast, the calculated [010] LTC of Ta2PdSe6 (15.58 ± 0.78 W m-1 K-1) is numerically close to, but lower than, the measured total TC. Since Ta2PdSe6 is semimetallic, its measured total TC contains a non-negligible electronic contribution[23], and thus does not provide a direct experimental benchmark for the calculated LTC. The difference between the calculated and measured values may arise from both experimental and theoretical factors. Our simulations describe ideal stoichiometric and defect-free crystals and include only phonon-mediated heat transport. In contrast, residual point defects, nonstoichiometry, dislocations, and stacking imperfections in experimentally grown single crystals may introduce additional phonon scattering. In addition, the calculated absolute LTC is subject to the approximations in the DFT reference data, the machine-learning potential, and the classical MD treatment of anharmonic phonon transport. Nevertheless, the focus of this work is the intrinsic directional and thickness-dependent trends, including the pronounced thermal anisotropy and its phonon-level origin. The possible electronic contribution also depends strongly on the electronic structure, carrier concentration, transport direction, and sample quality. For semiconducting Ta2PdS6, the electronic contribution is expected to be negligible at room temperature[24]. By contrast, semimetallic Ta2PdSe6 and Nb2PdSe6 can exhibit an electronic thermal conductivity of the order of several W m-1 K-1, potentially approaching 10 W m-1 K-1 in highly conducting
From the perspective of the atomic arrangement, the direction [010] exhibits the most regular periodicity, with a period ranging between 3.2 and 3.4 Å for the four materials. In contrast, the atomic arrangement along the [20
The four materials share identical crystal structures, and the differences in their LTC are mainly attributed to variations in atomic masses and bond strengths. Both factors affect phonon dispersion curves, subsequently, changing phonon group velocities and scattering rates. Within the layers, X2PdY6 is bonded through the X-Y and Pd-Y bonds, and the bond strengths of these bonds vary depending on the choice of X and Y elements. To quantify the relative bond strengths in the four materials, we calculated the bond lengths and integrated crystal orbital Hamiltonian population (ICOHP) values for the X-Y and Pd-Y bonds. Based on bonding environments, the Y atoms were categorized into four types: Y1, Y2, Y3, and Y4. Y1 and Y2 are bonded to both X and Pd, while Y3 and Y4 are bonded only to X atoms (Figure 1). The ICOHP values were calculated using the Local Orbital Basis Suite Towards
Table 4. Bond lengths, ICOHP, and bader effective charges for bulk X2PdY6 (X = Nb, Ta; Y = S, Se).
| Materials | Bond length (Å) | ICOHP | Bader effective charges (e) | ||||||||||
| X-Y1 | X-Y2 | X-Y3 | X-Y4 | Pd-Y | X-Y1 | X-Y2 | X-Y3 | X-Y4 | Pd-Y | X | Y | Pd | |
| Nb2PdS6 | 2.468 | 2.486 | 2.488 | 2.595 | 2.335 | -3.700 | -3.5581 | -3.0091 | -2.397 | -0.955 | +1.791 | -0.632 | +0.212 |
| Nb2PdSe6 | 2.596 | 2.609 | 2.637 | 2.731 | 2.464 | -3.366 | -3.304 | -2.715 | -2.203 | -0.799 | +1.501 | -0.503 | +0.013 |
| Ta2PdS6 | 2.476 | 2.488 | 2.484 | 2.596 | 2.335 | -3.452 | -3.393 | -2.955 | -2.332 | -0.955 | +1.930 | -0.680 | +0.222 |
| Ta2PdSe6 | 2.599 | 2.611 | 2.634 | 2.734 | 2.466 | -3.140 | -3.109 | -2.595 | -2.120 | -0.780 | +1.627 | -0.548 | +0.034 |
Y1, Y2, Y3, and Y4 represent S or Se atoms in different environments, and X represents Nb or Ta atoms, as shown in Figure 1. ICOHP: integrated crystal orbital Hamiltonian population.
Among the different materials, the Pd-S bonds have shorter bond lengths and more negative ICOHP values than the Pd-Se bonds, indicating stronger Pd-S bonding. This difference arises because Se has more electron shells than S, resulting in lower electronegativity and weaker bonding with Pd. This trend is further supported by the Bader charges of Pd. In Nb2PdS6 and Ta2PdS6, Pd atoms lose 0.212 and 0.222 electrons, respectively, while in Nb2PdSe6 and Ta2PdSe6, Pd atoms lose only 0.013e and 0.034e electrons, respectively. The reduced electron transfer in selenides reflects weaker bonding between Pd and Se compared to Pd and S. The inferred X-Y bond strengths follow the order: Nb-S > Ta-S > Nb-Se > Ta-Se. This trend indicates that, for a given atom, the bond strength decreases as the atomic number of the other atom in the same group increases. This is because within the same group, larger atomic numbers correspond to weaker nuclear attraction for the outermost electrons. Electron localization analysis further confirms that the S and Se atoms, which have stronger electron-attracting abilities, exhibit stronger electron localization compared to other atoms, while Pd atoms show the strongest electron delocalization (Figure S11).
Differences in chemical bond strengths and atomic masses among the materials also lead to variations in phonon group velocities, which directly affect the LTC. Stronger chemical bonds result in larger interatomic force constants, leading to larger phonon group velocities. Conversely, larger atomic masses reduce phonon frequencies and, consequently, group velocities. Based on phonon dispersion relations, we calculate the phonon group velocities for the four materials, as shown in Figure 6. Nb2PdS6 exhibits the highest phonon group velocity, with the value of its low-frequency acoustic phonons reaching up to 6 km/s. This is attributed to its strongest Nb-S and Pd-S bonds, as well as its relatively small atomic mass. As chemical bonds weaken and atomic masses increase, the group velocities decrease in the order: Nb2PdS6 > Ta2PdS6 > Nb2PdSe6 > Ta2PdSe6. This trend aligns with the relative strengths of the chemical bonds and the observed LTC values. In materials with identical crystal structures, a decrease in group velocity corresponds to flatter phonon bands, which increases the phonon scattering rates. Flatter phonon bands provide more channels for phonon-phonon scattering, as it becomes easier to satisfy the energy and momentum conservation condition for scattering events. This increased scattering probability further reduces the LTC.
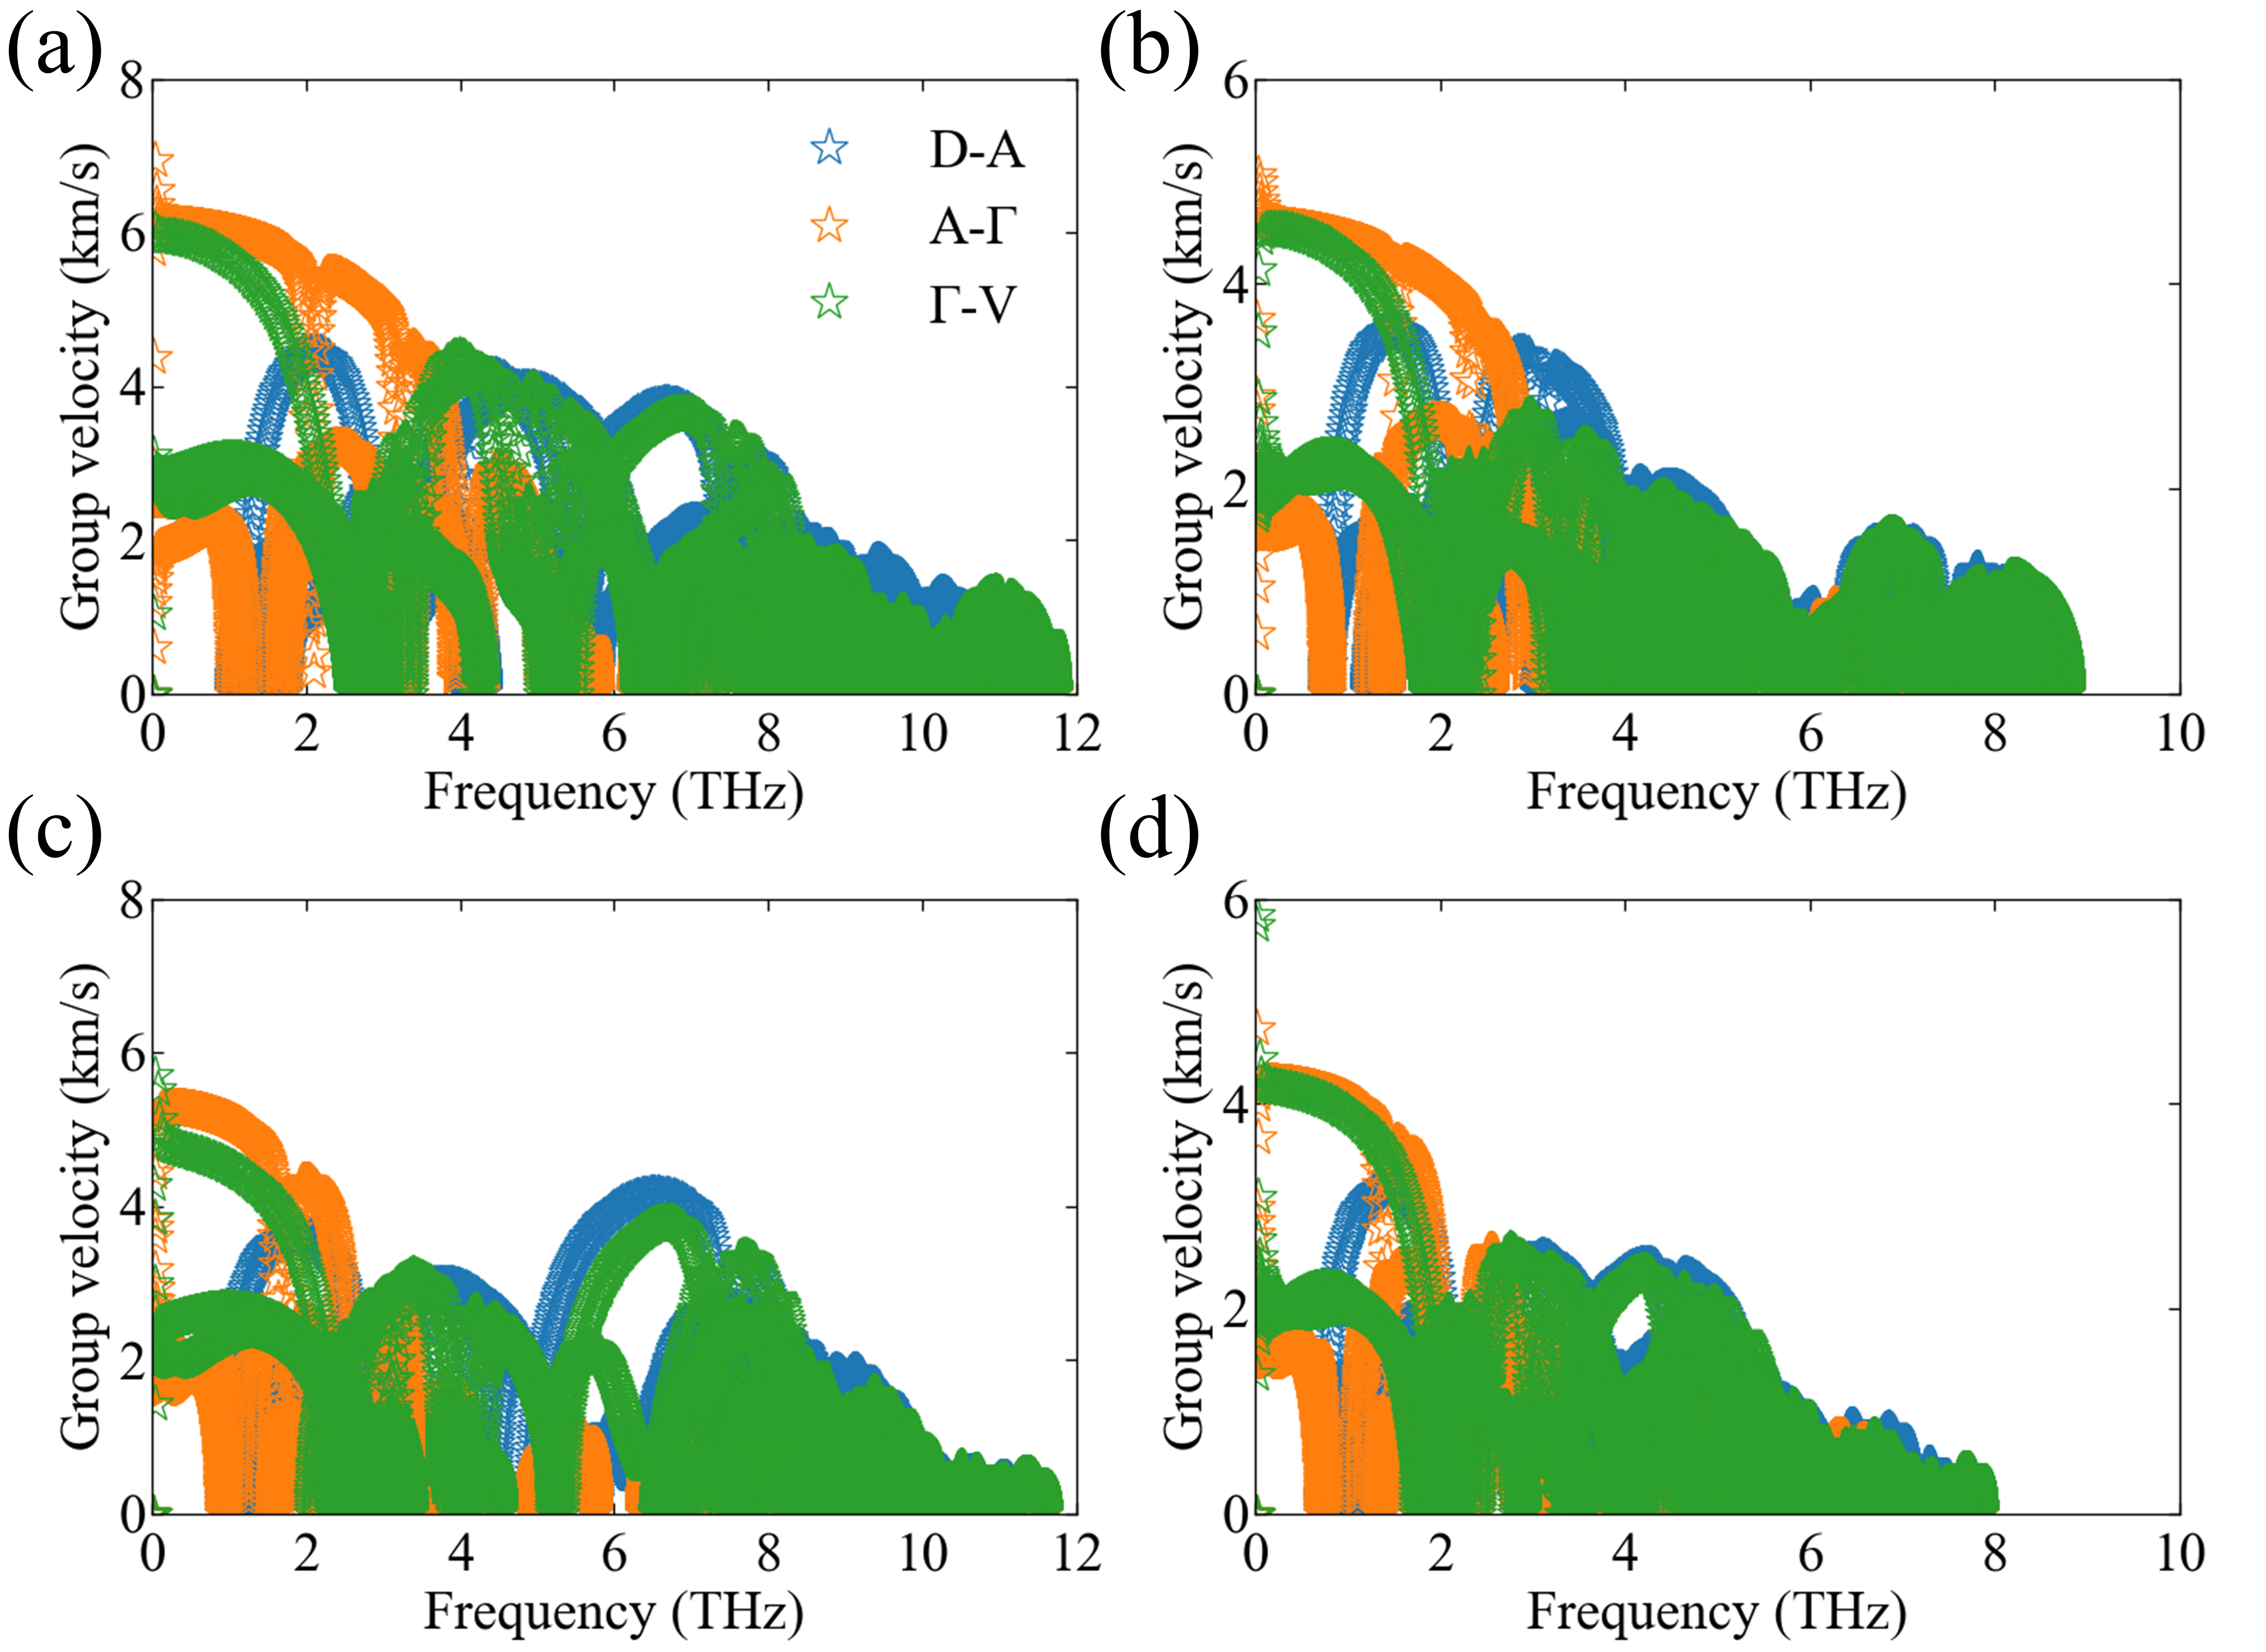
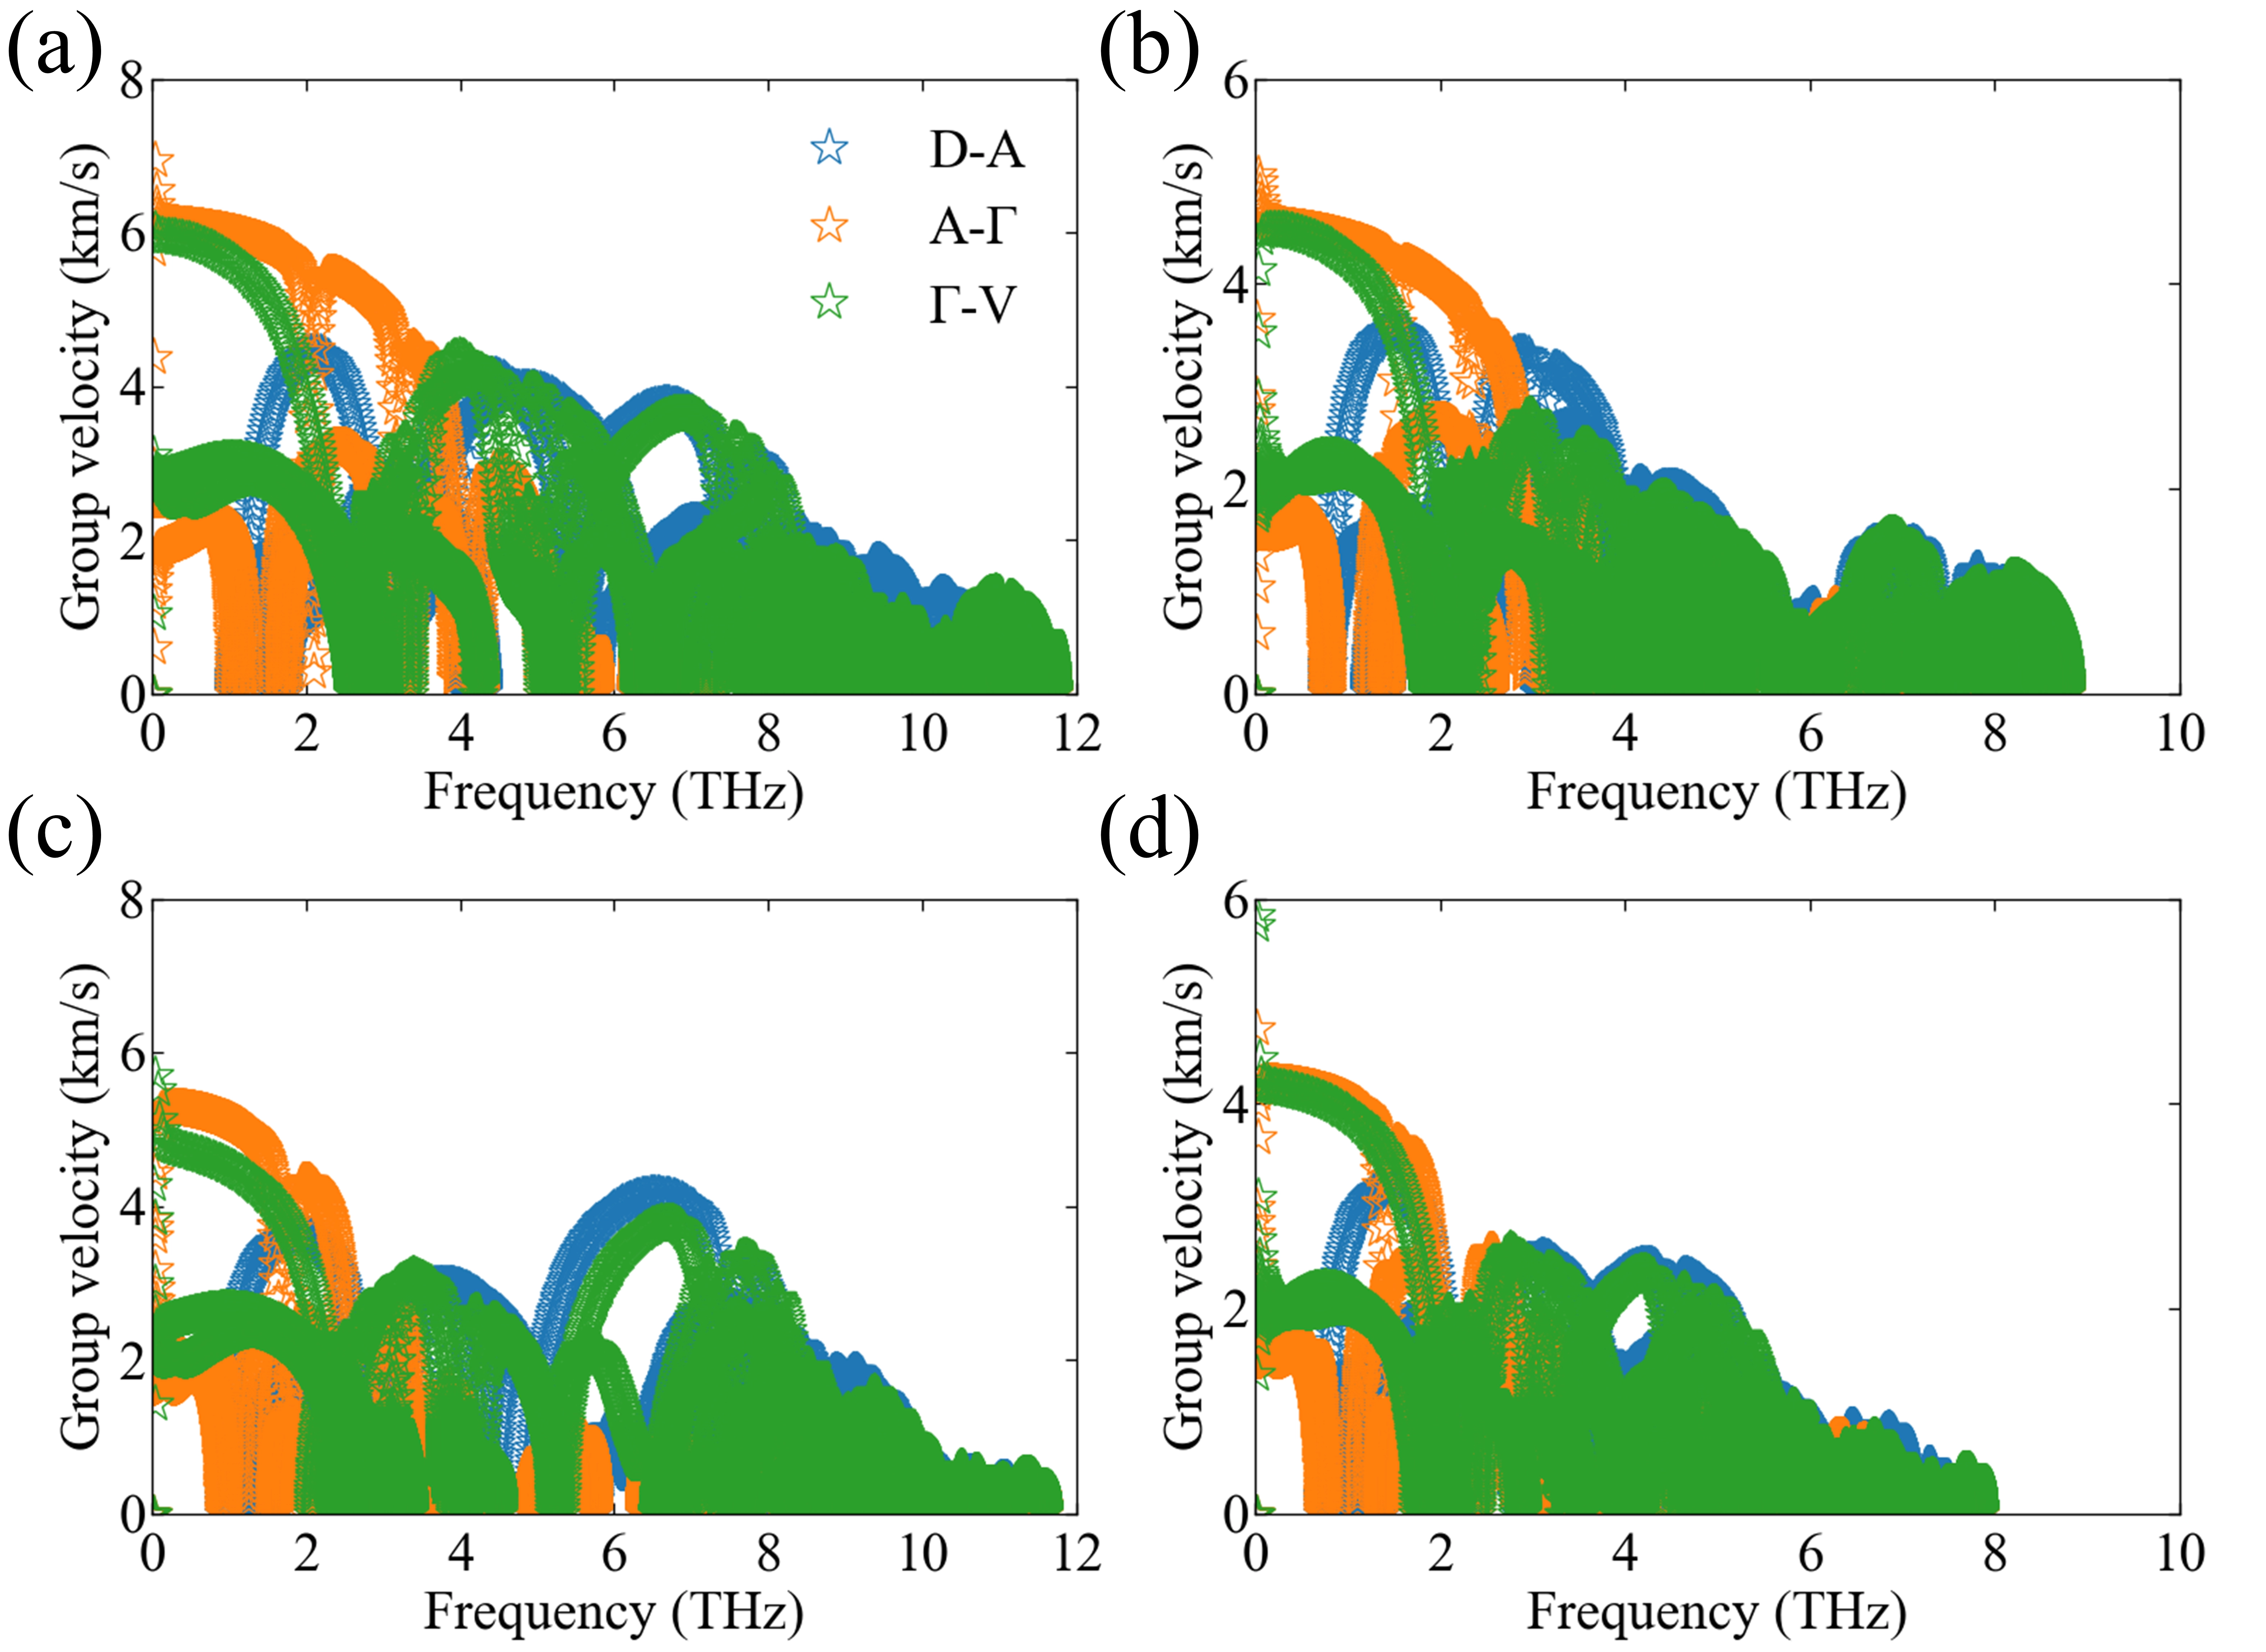
Figure 6. Phonon group velocities for (a) Nb2PdS6; (b) Nb2PdSe6; (c) Ta2PdS6; (d) Ta2PdSe6.
Figure 7 presents the normalized in-plane and cross-plane LTC as a function of temperature for all the four materials, with values normalized to the corresponding LTCs at 300 K. Interestingly, although the absolute values of LTC in different materials and crystal orientations differ significantly, their normalized LTCs are close to each other. The LTCs of the four materials follow a T-1 relationship with temperature, indicating that three-phonon scattering dominates thermal transport in these systems.
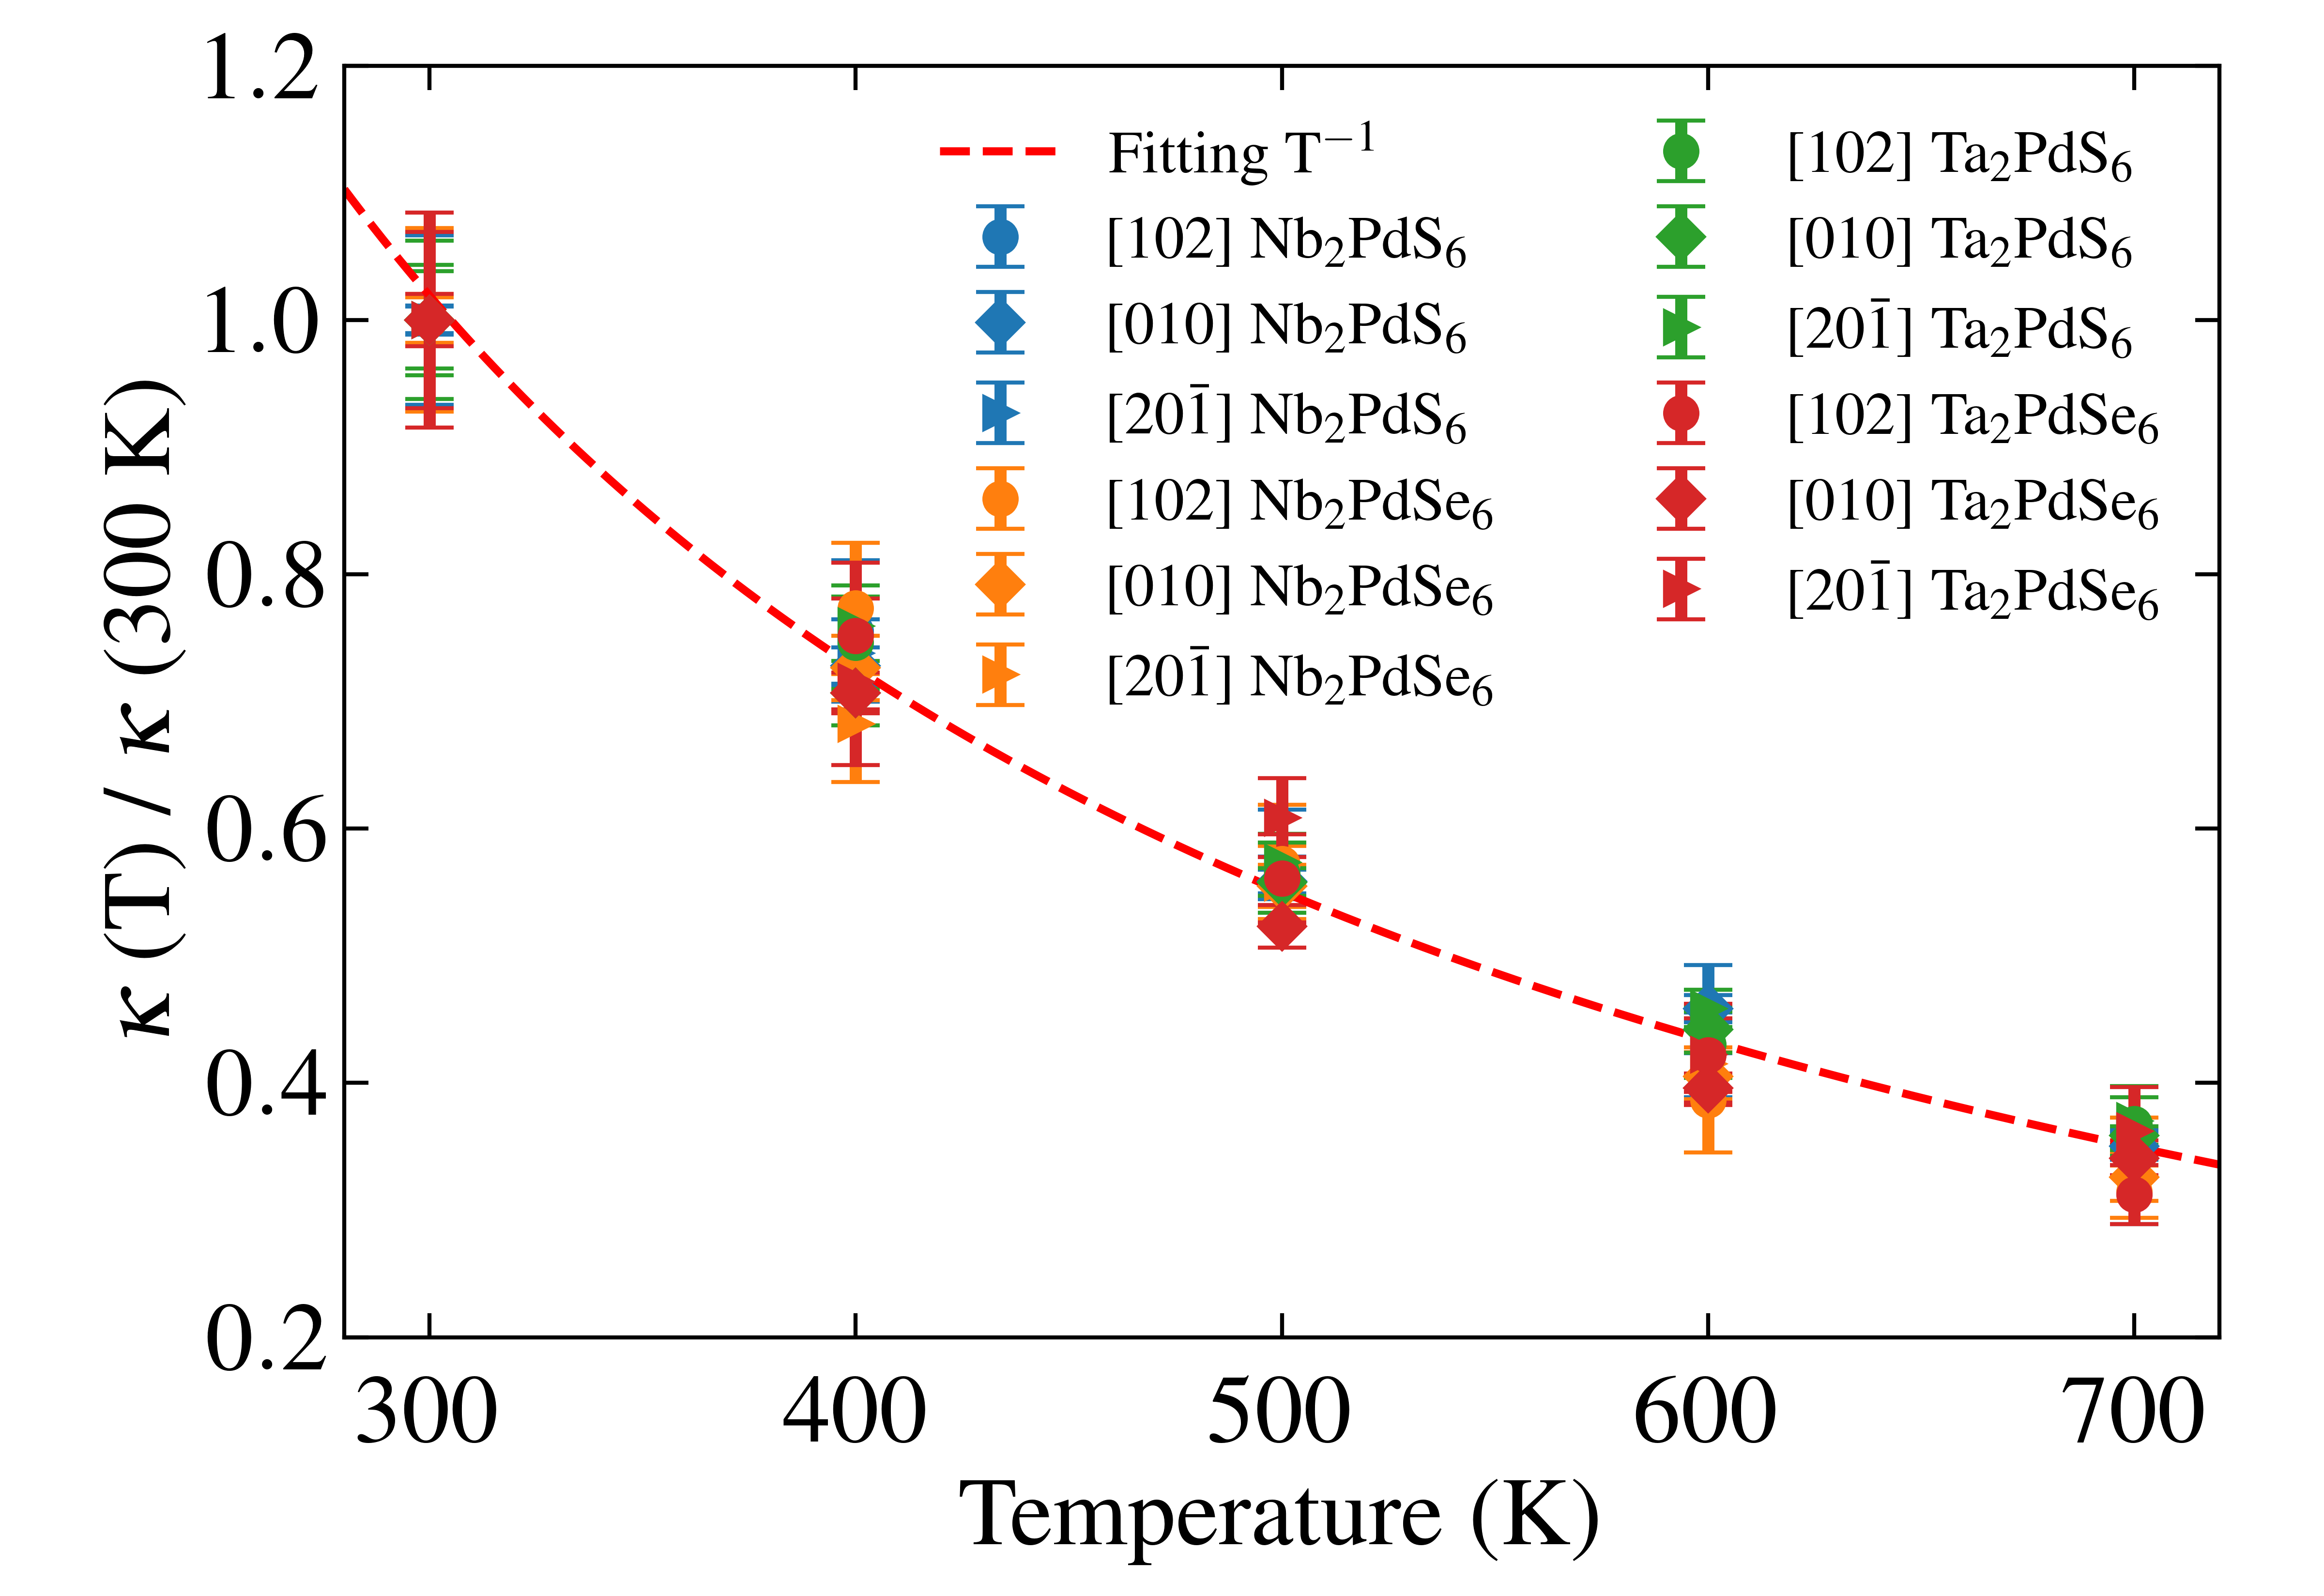
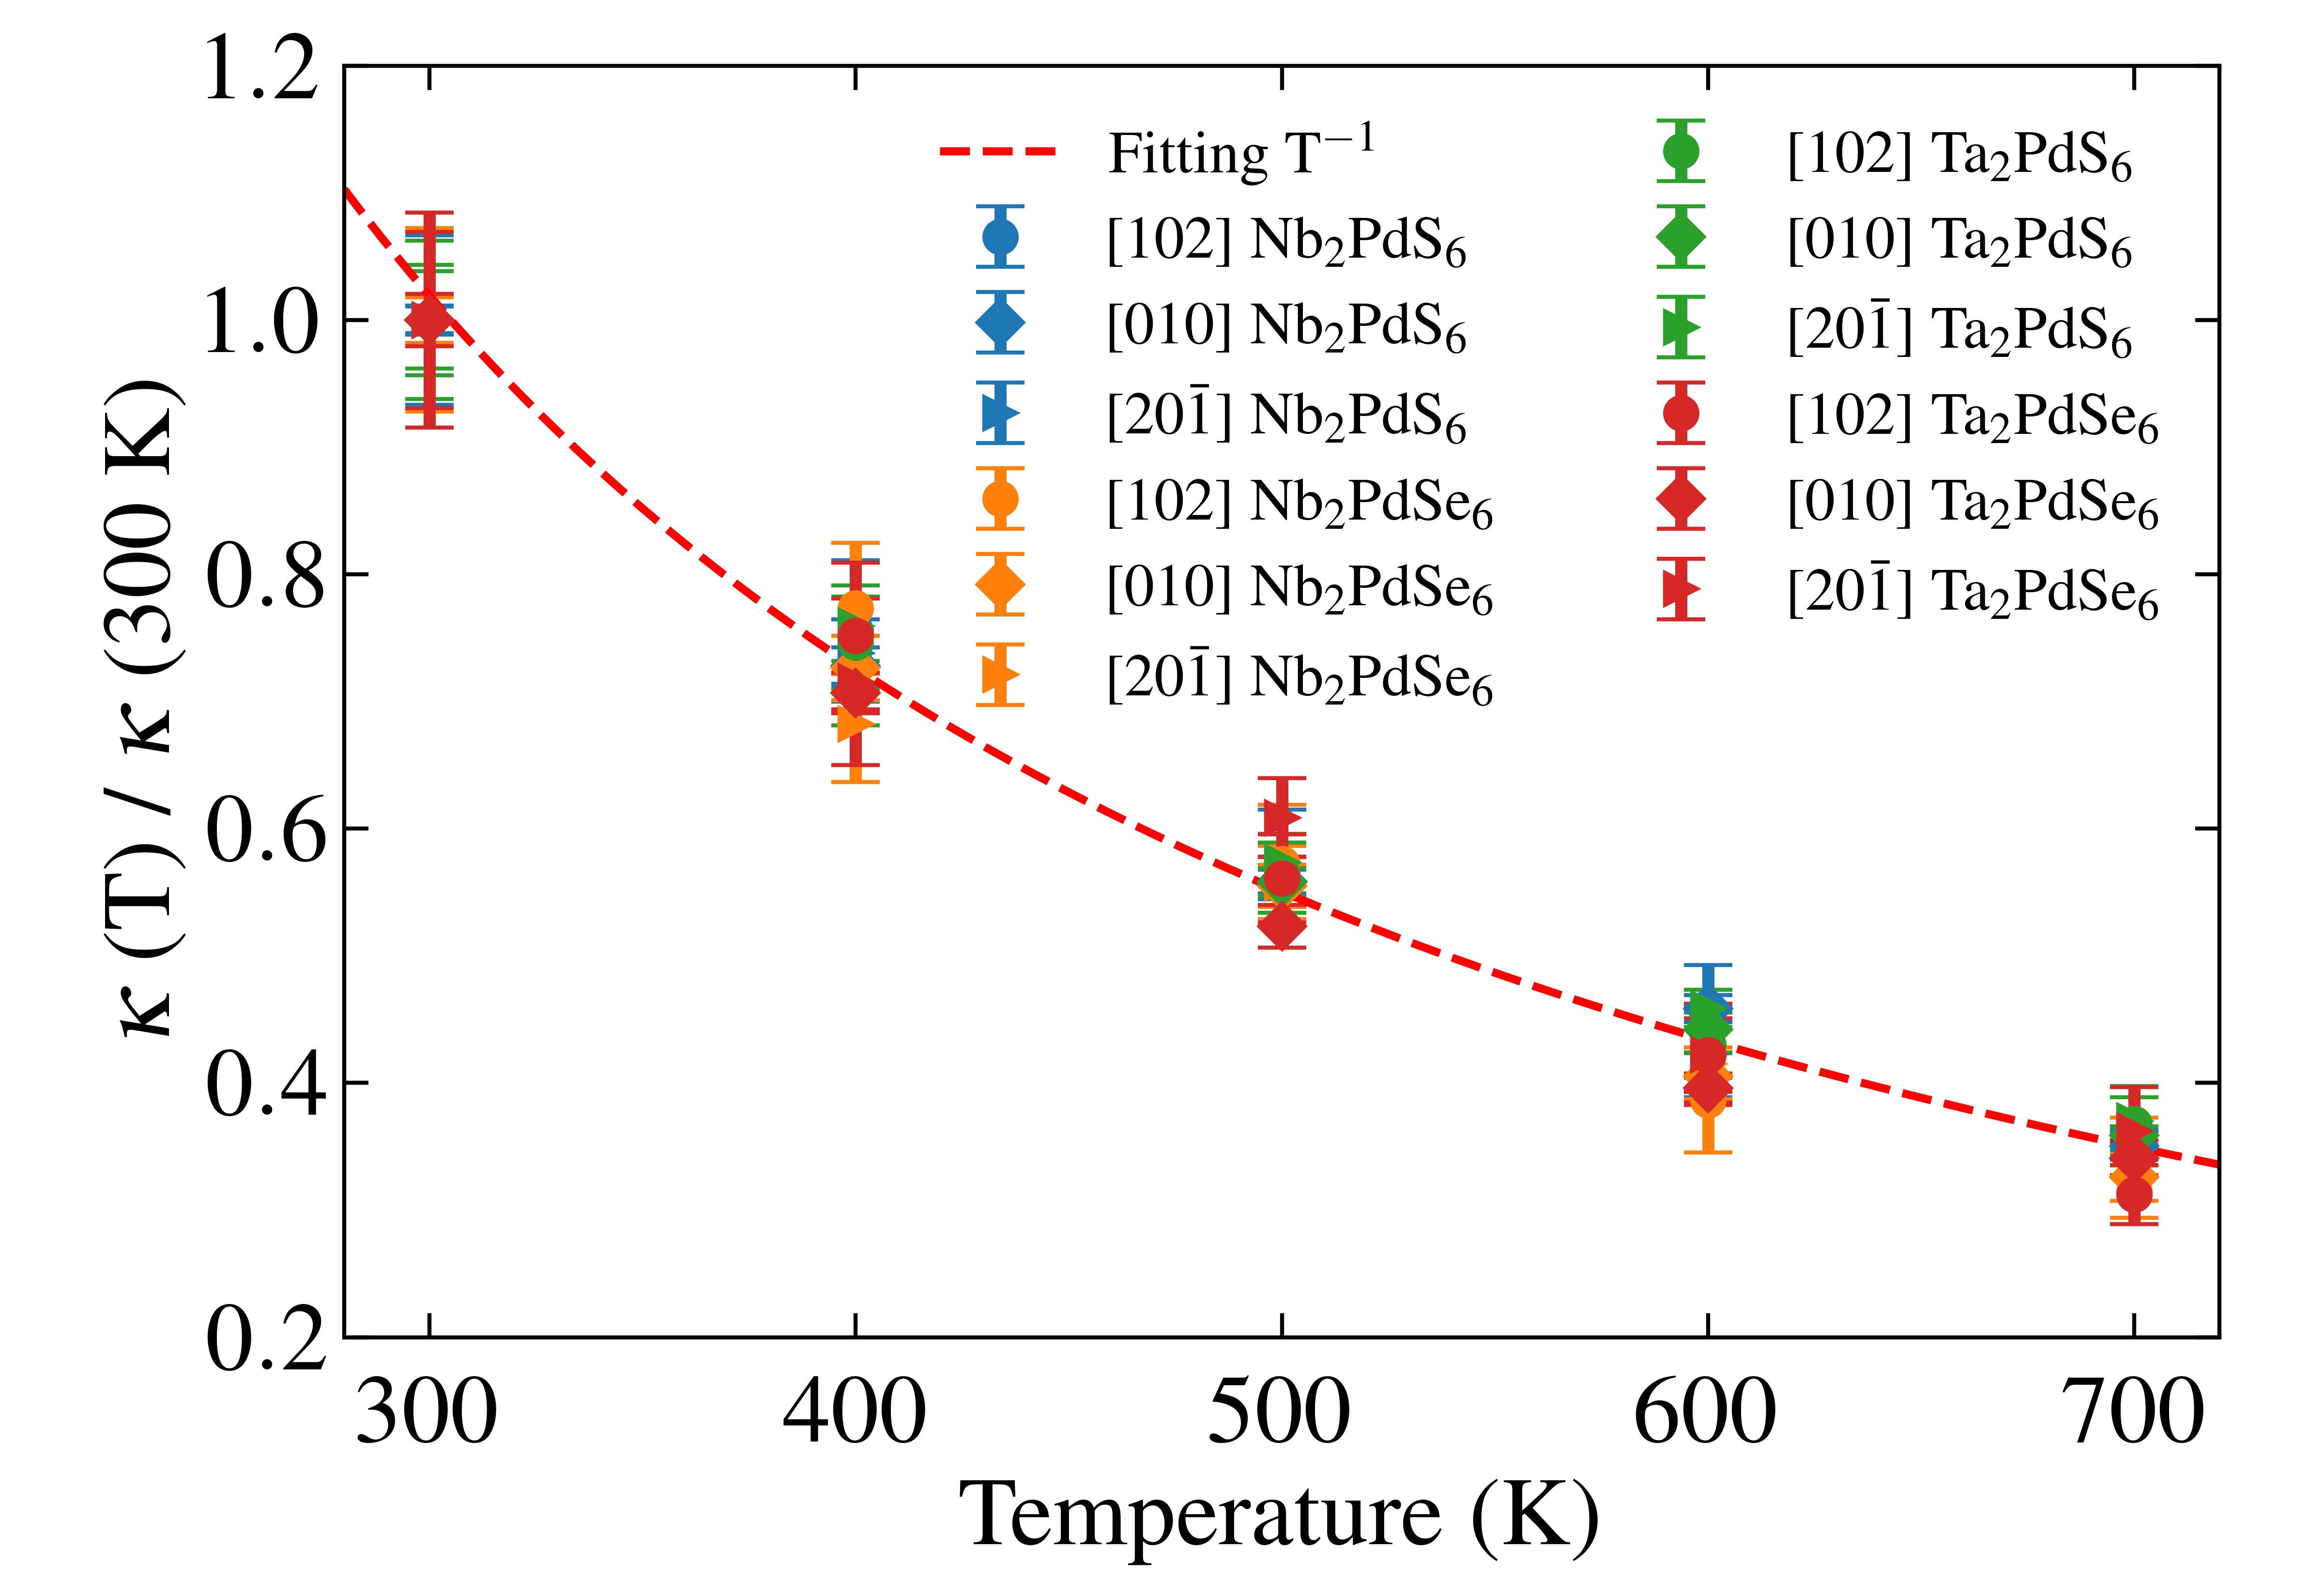
Figure 7. The reduced LTC of bulk Nb2PdS6, Nb2PdSe6, Ta2PdS6, and Ta2PdSe6 along three crystal directions (corresponding to in-plane and out-of-plane directions) as a function of temperature. All LTC values have been normalized by their respective values at 300 K. LTC: lattice thermal conductivity.
To gain deeper insight into the phonon transport mechanisms, we performed spectral decomposition of the LTC and calculated the phonon MFP along the Cartesian axes x, y, and z using Equation 3 (Figure S12)[44]. Due to limitations in the spectral decomposition method for non-diagonal elements, we restricted our analysis to the principal axes. While we can directly determine the MFP along the [010] direction (corresponding to the y axis), the [20
Based on the phonon MFP derived from spectral decomposition, we calculated the length dependence of LTC at 300 K for bulk X2PdY6 through Equations 4 and 5 (Figure 8). The LTC components in the x and z directions, which are mainly contributed from the [102] and [20
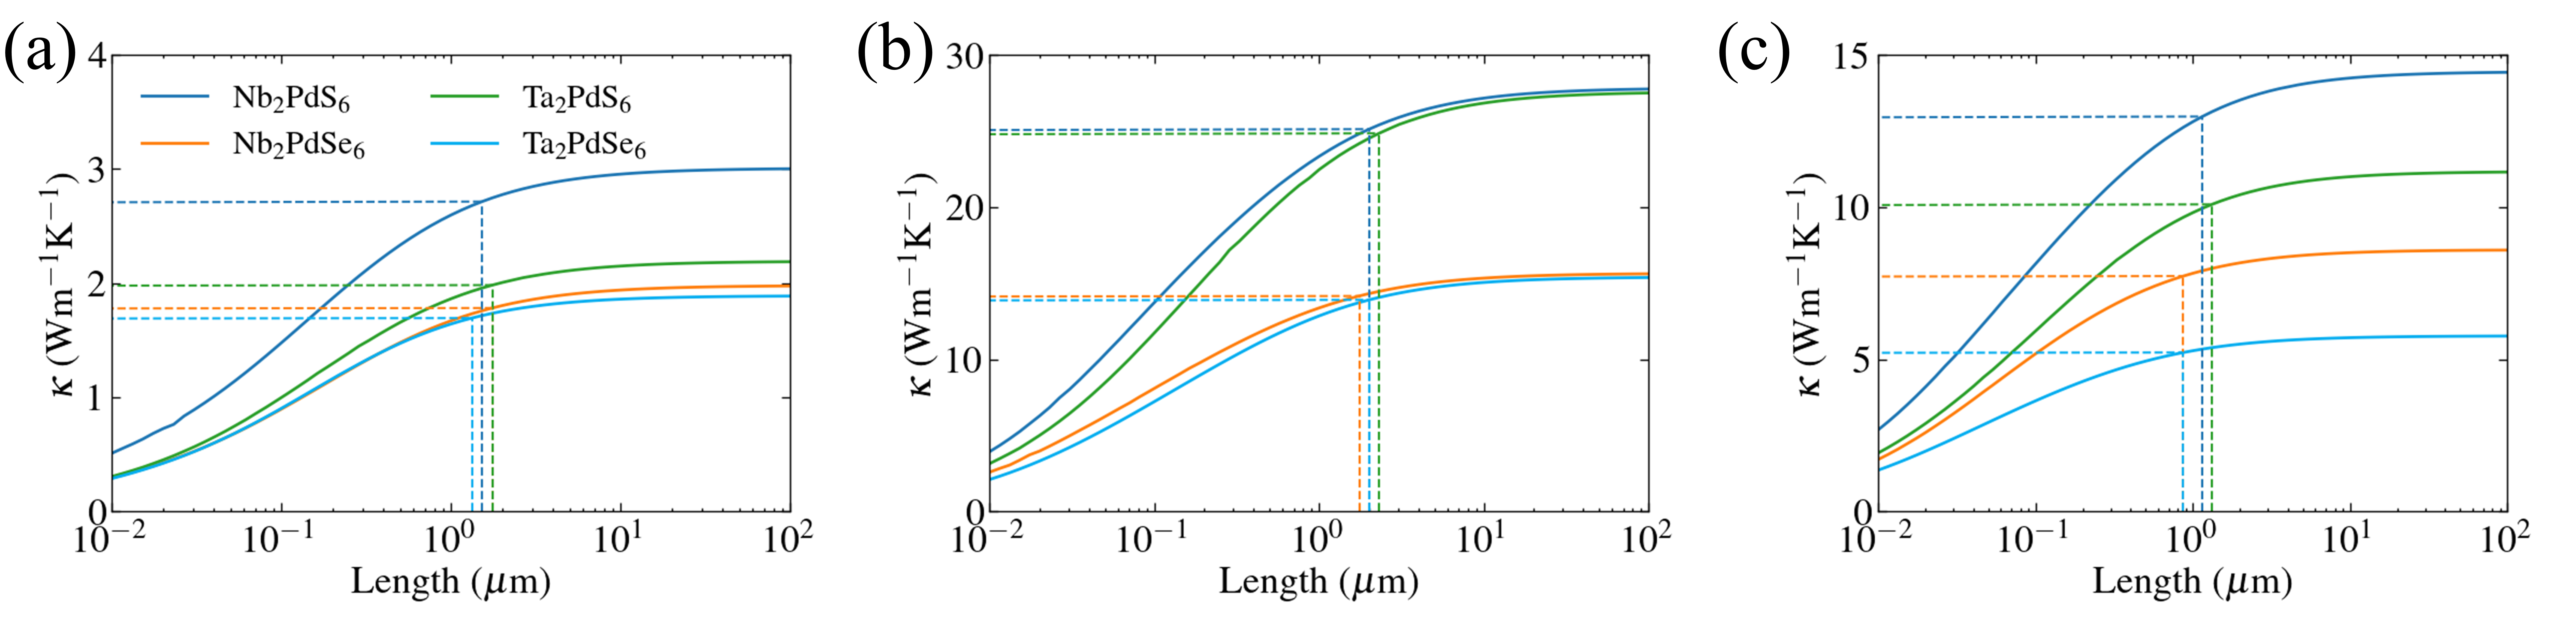
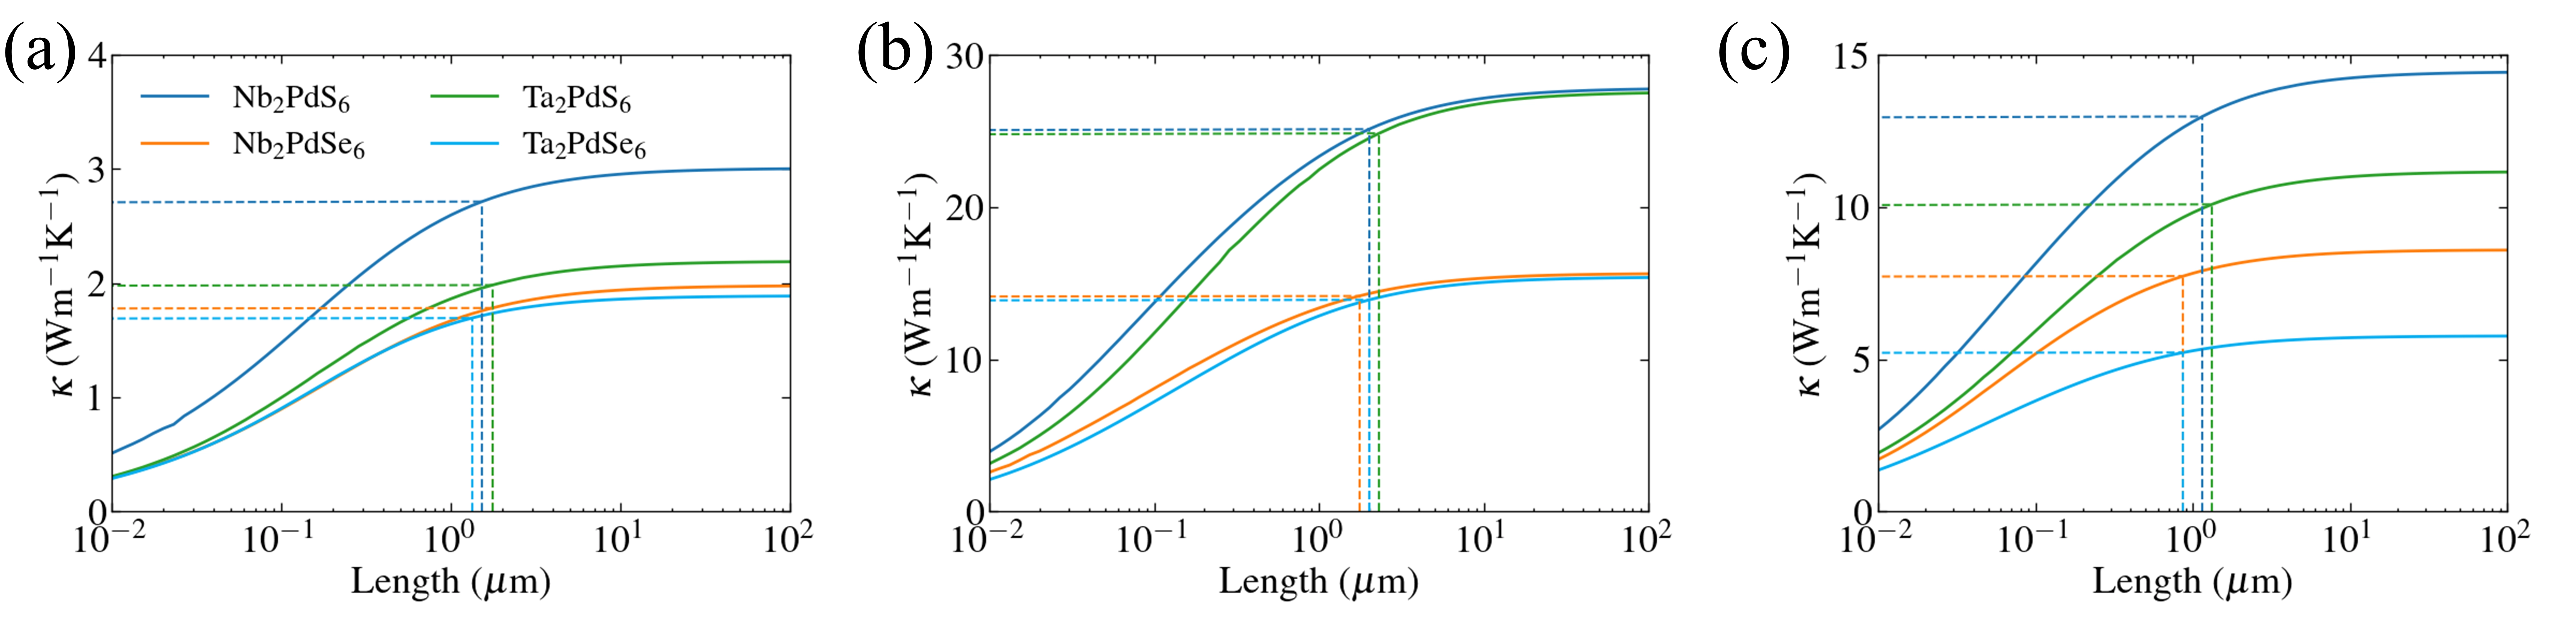
Figure 8. The dependence of the LTC of bulk X2PdY6 (X = Nb, Ta; Y = S, Se) on length at 300 K, with dashed lines indicating the cumulative LTC reaching 90% of the total LTC. (a) Along the x-axis; (b) Along the y-axis; (c) Along the z-axis. LTC: lattice thermal conductivity.
Given that all four materials are layered structures, we investigated how dimensionality affects thermal transport properties by examining the LTC from multilayer to monolayer transitions. In 2D structure simulations, the in-plane [20
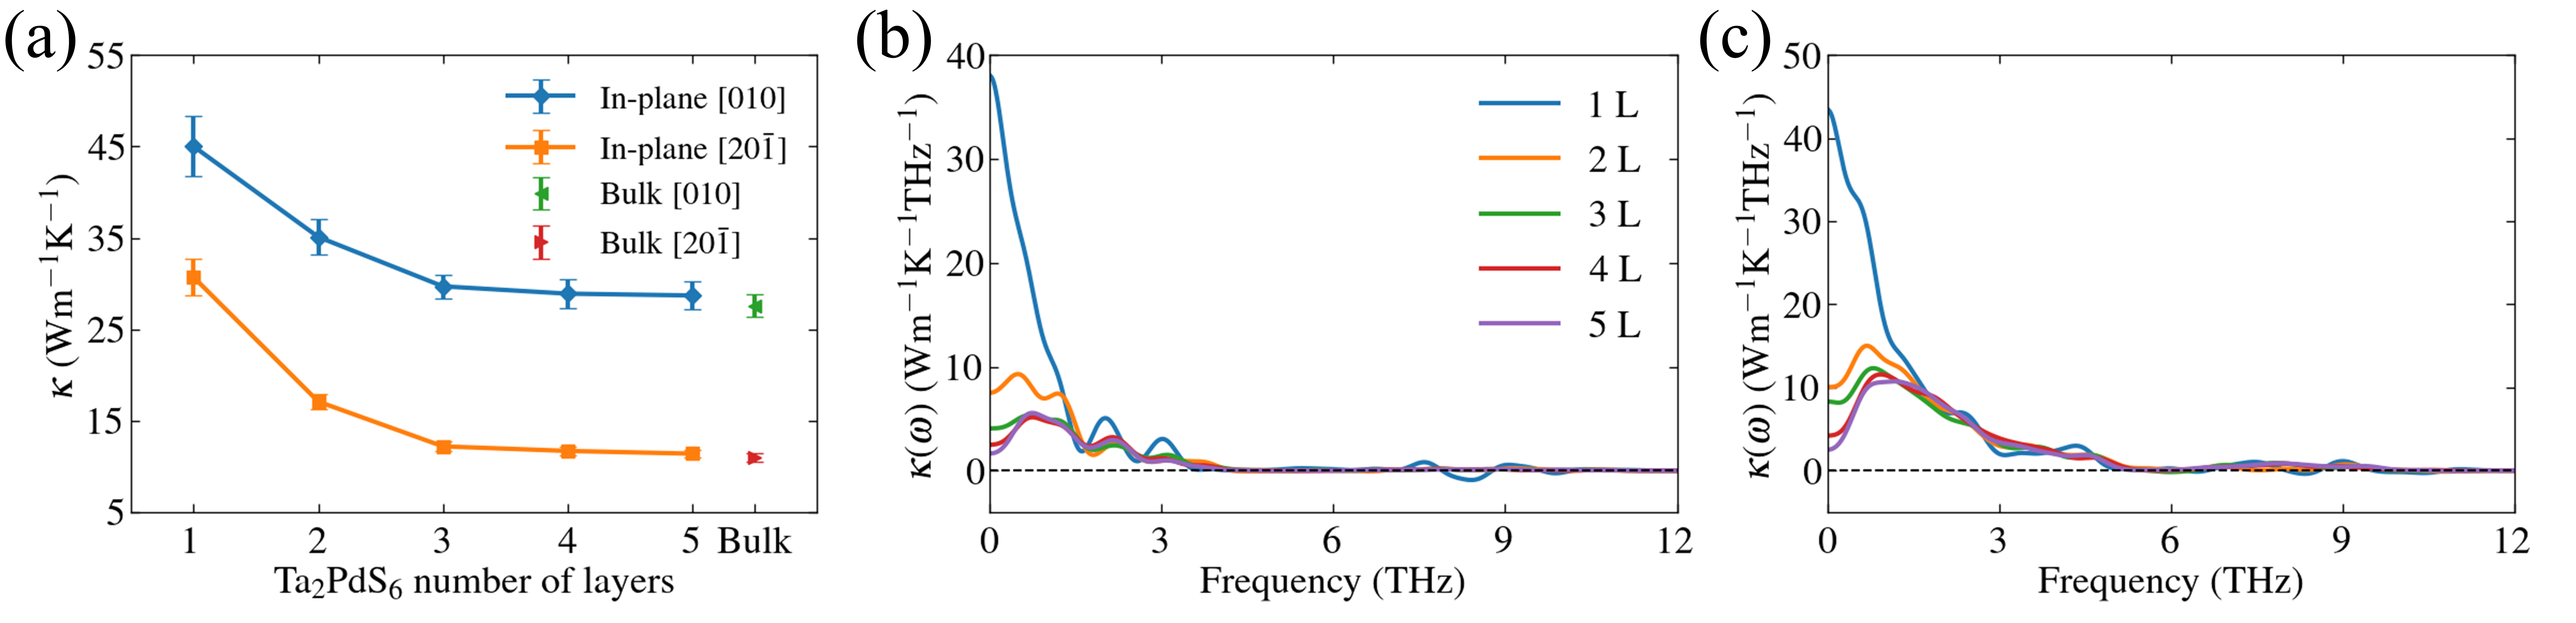
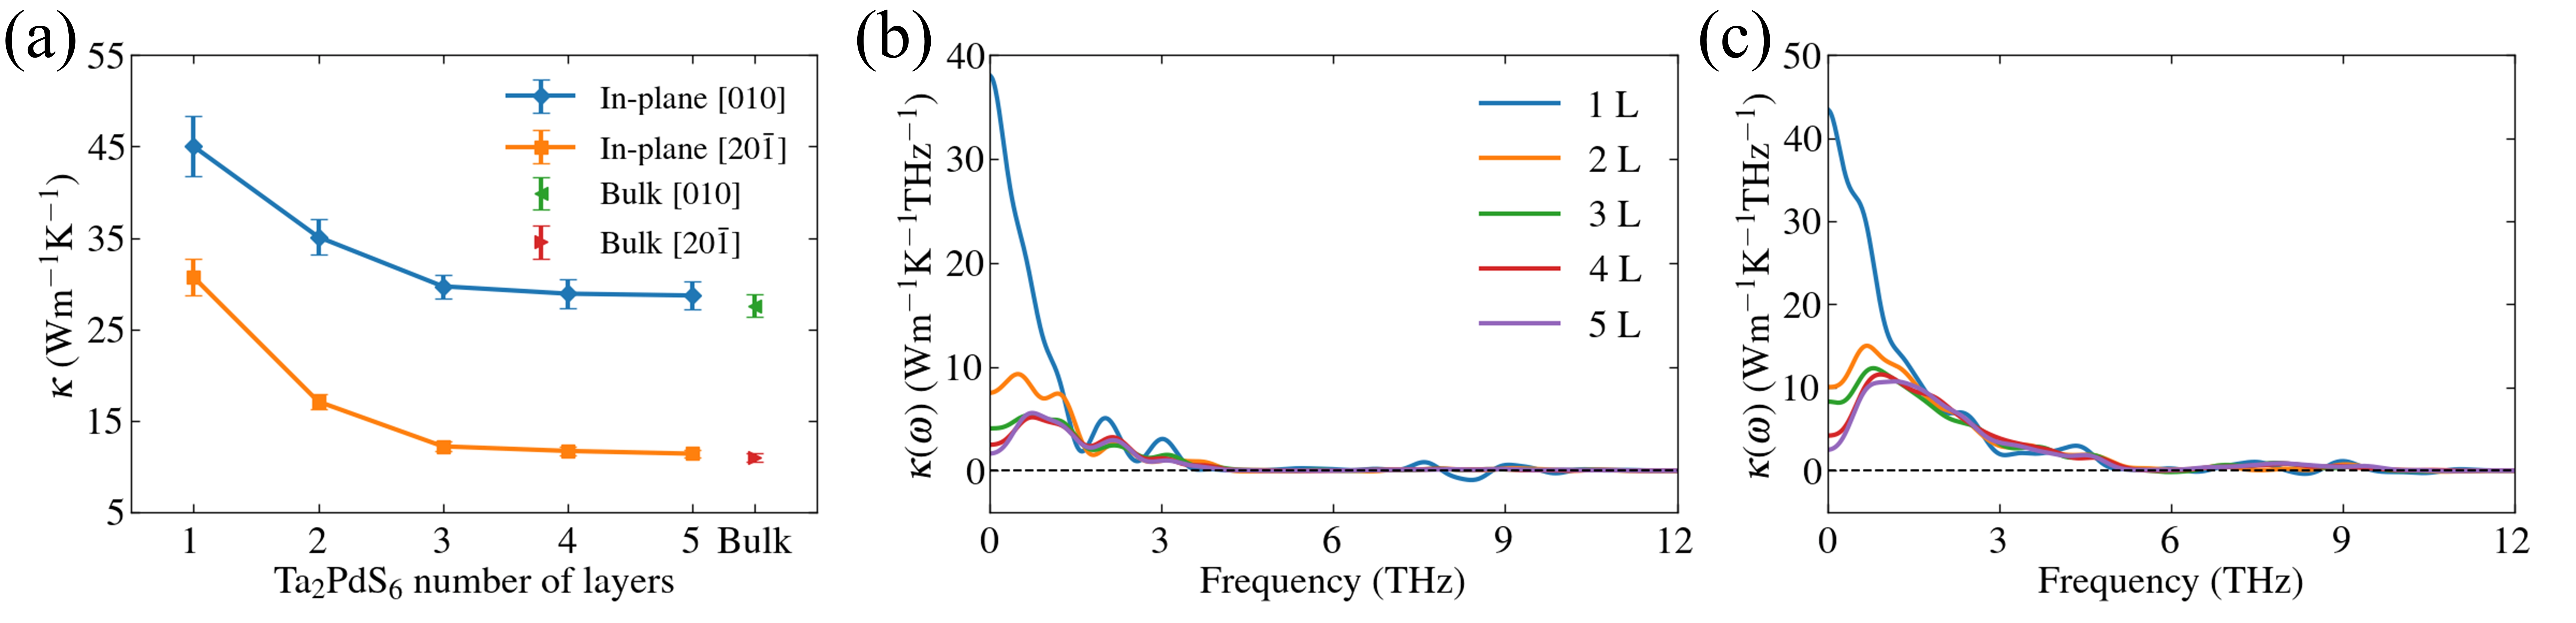
Figure 9. (a) The variation of Ta2PdS6 LTC with different layer numbers, with bulk LTC included for comparison; (b,c) Spectral decomposition of LTC along the in-plane [20
To complement our understanding of thickness-dependent thermal transport, we analyzed the spectral contributions of phonons to LTC in Ta2PdS6 from 1L to 5L (Figure 9b,c). Although the maximum frequency of Ta2PdS6 is as high as 12 THz, phonons above 4 THz
The phonon MFP calculations reveal striking differences between monolayer and bulk structures (Figure S17). In monolayer X2PdY6, the MFP along both in-plane [20
To quantify the origin of the reduced in-plane anisotropy, we evaluated the frequency-resolved LTC enhancement factor upon exfoliation. We defined a frequency-resolved enhancement factor along specific crystallographic α between monolayer and bulk structures,
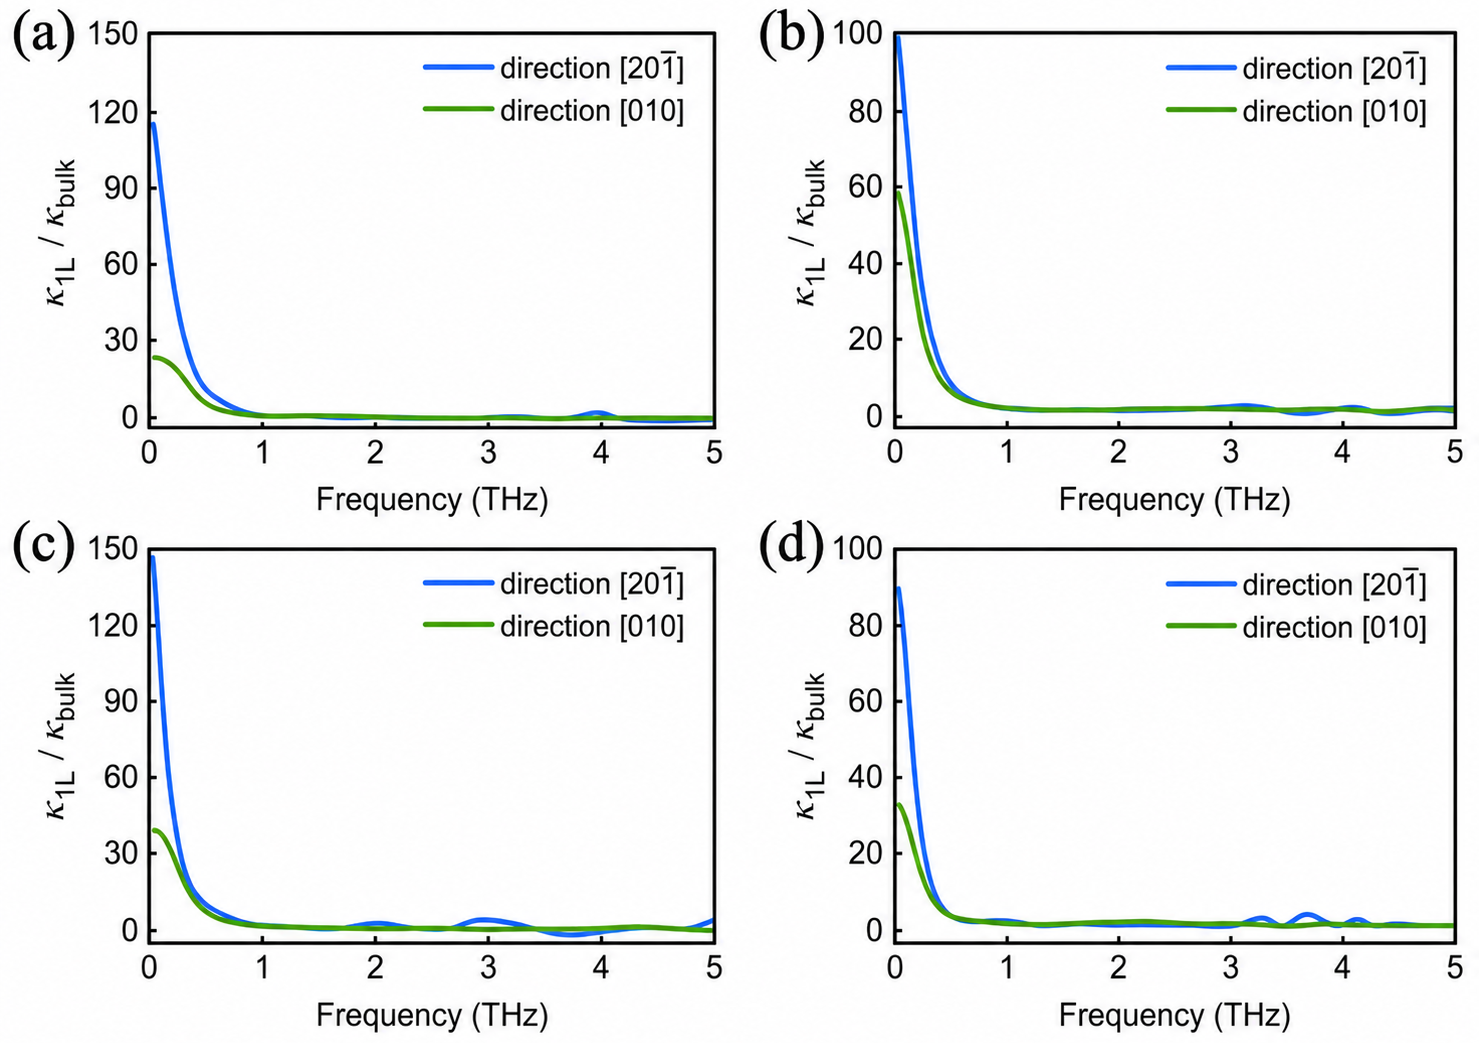
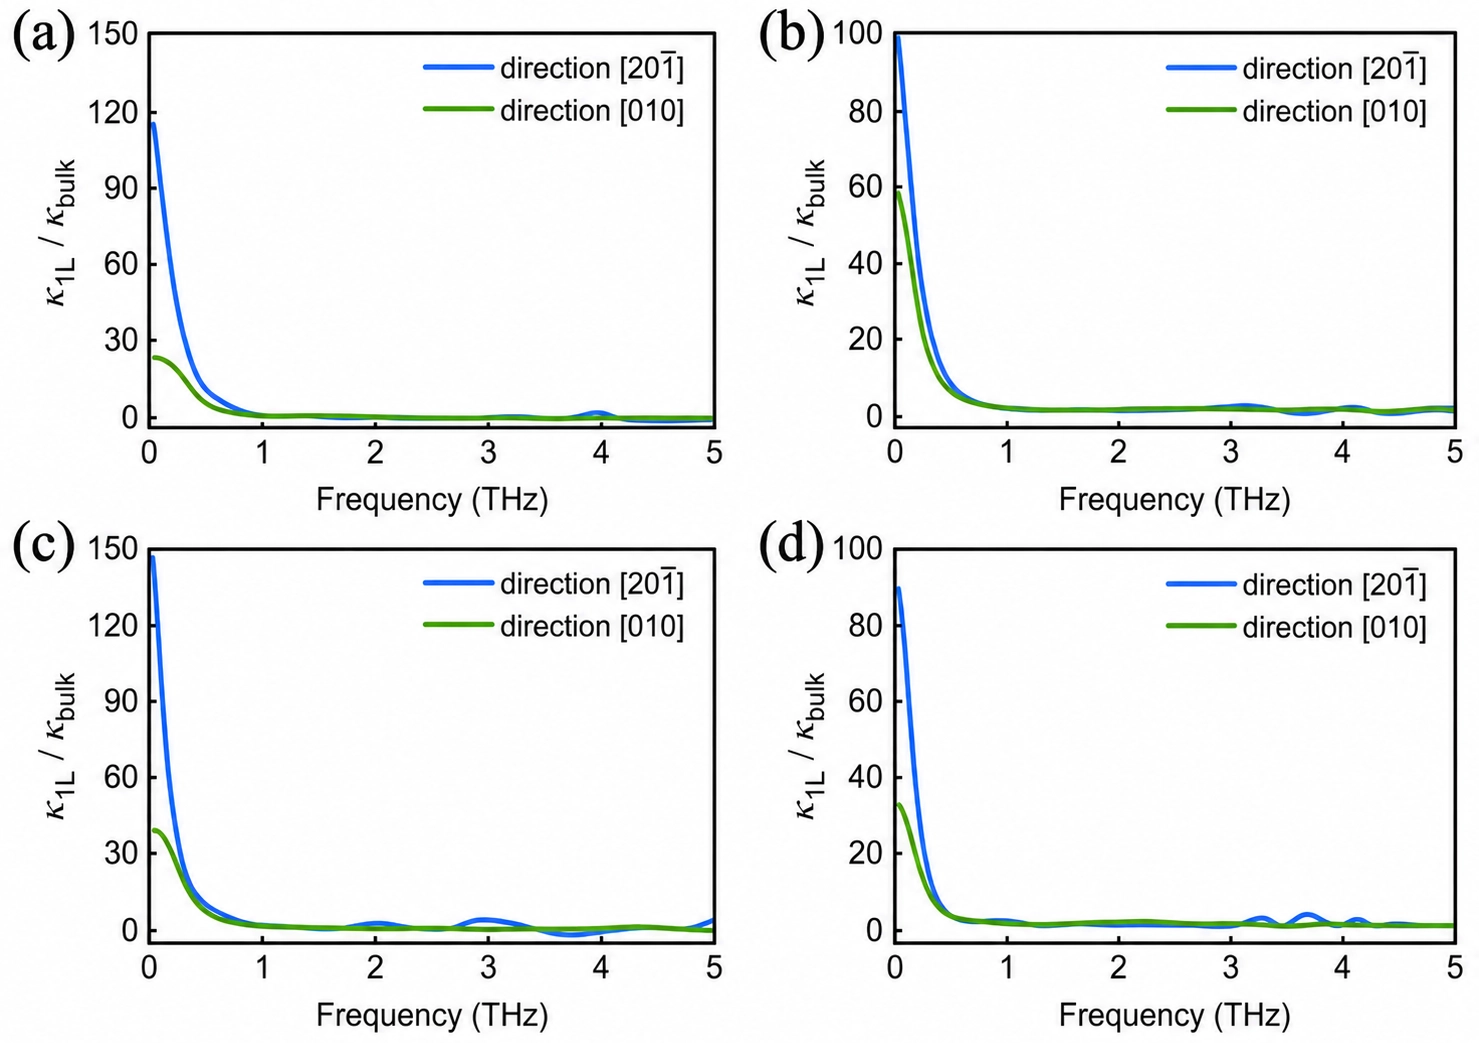
Figure 10. Frequency-resolved spectral LTC enhancement factor,
The spectral energy density (SED) analysis[44,48] for monolayer Ta2PdS6 along [20
The length dependence of LTC in monolayers further demonstrates exceptional phonon transport characteristics (Figure 11). The convergence length for LTC reaches 50-100 μm in both [20
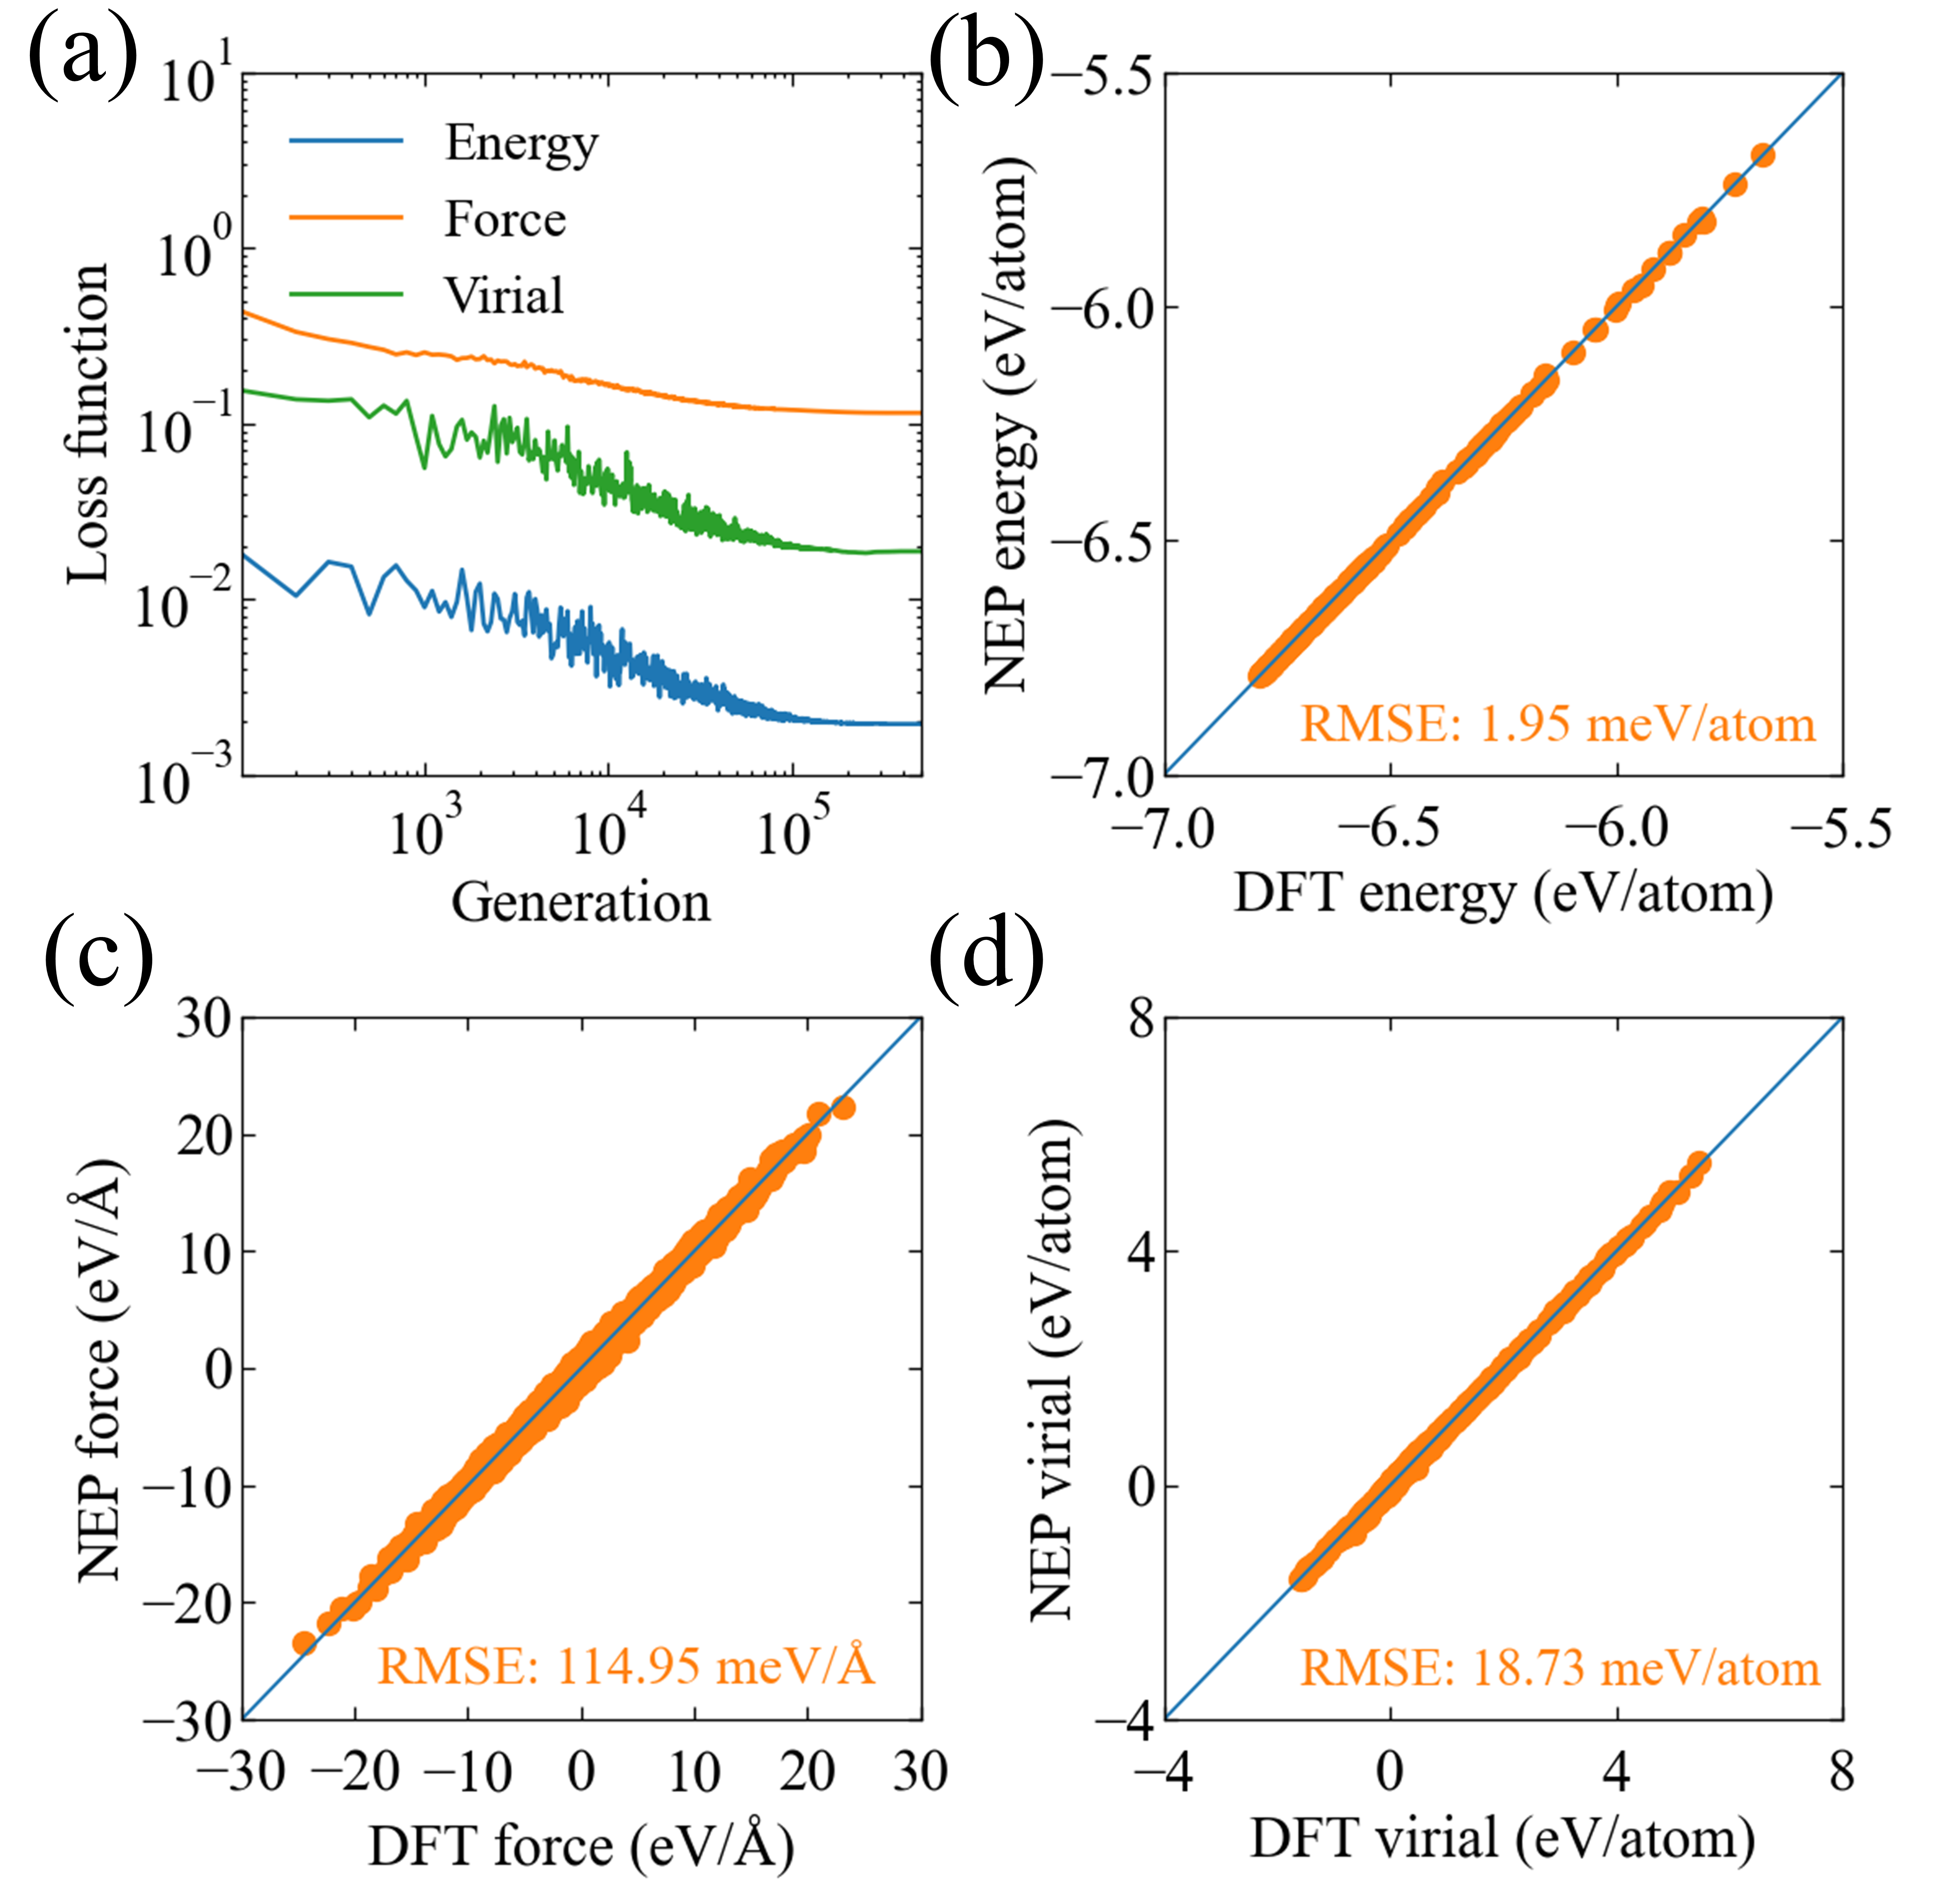
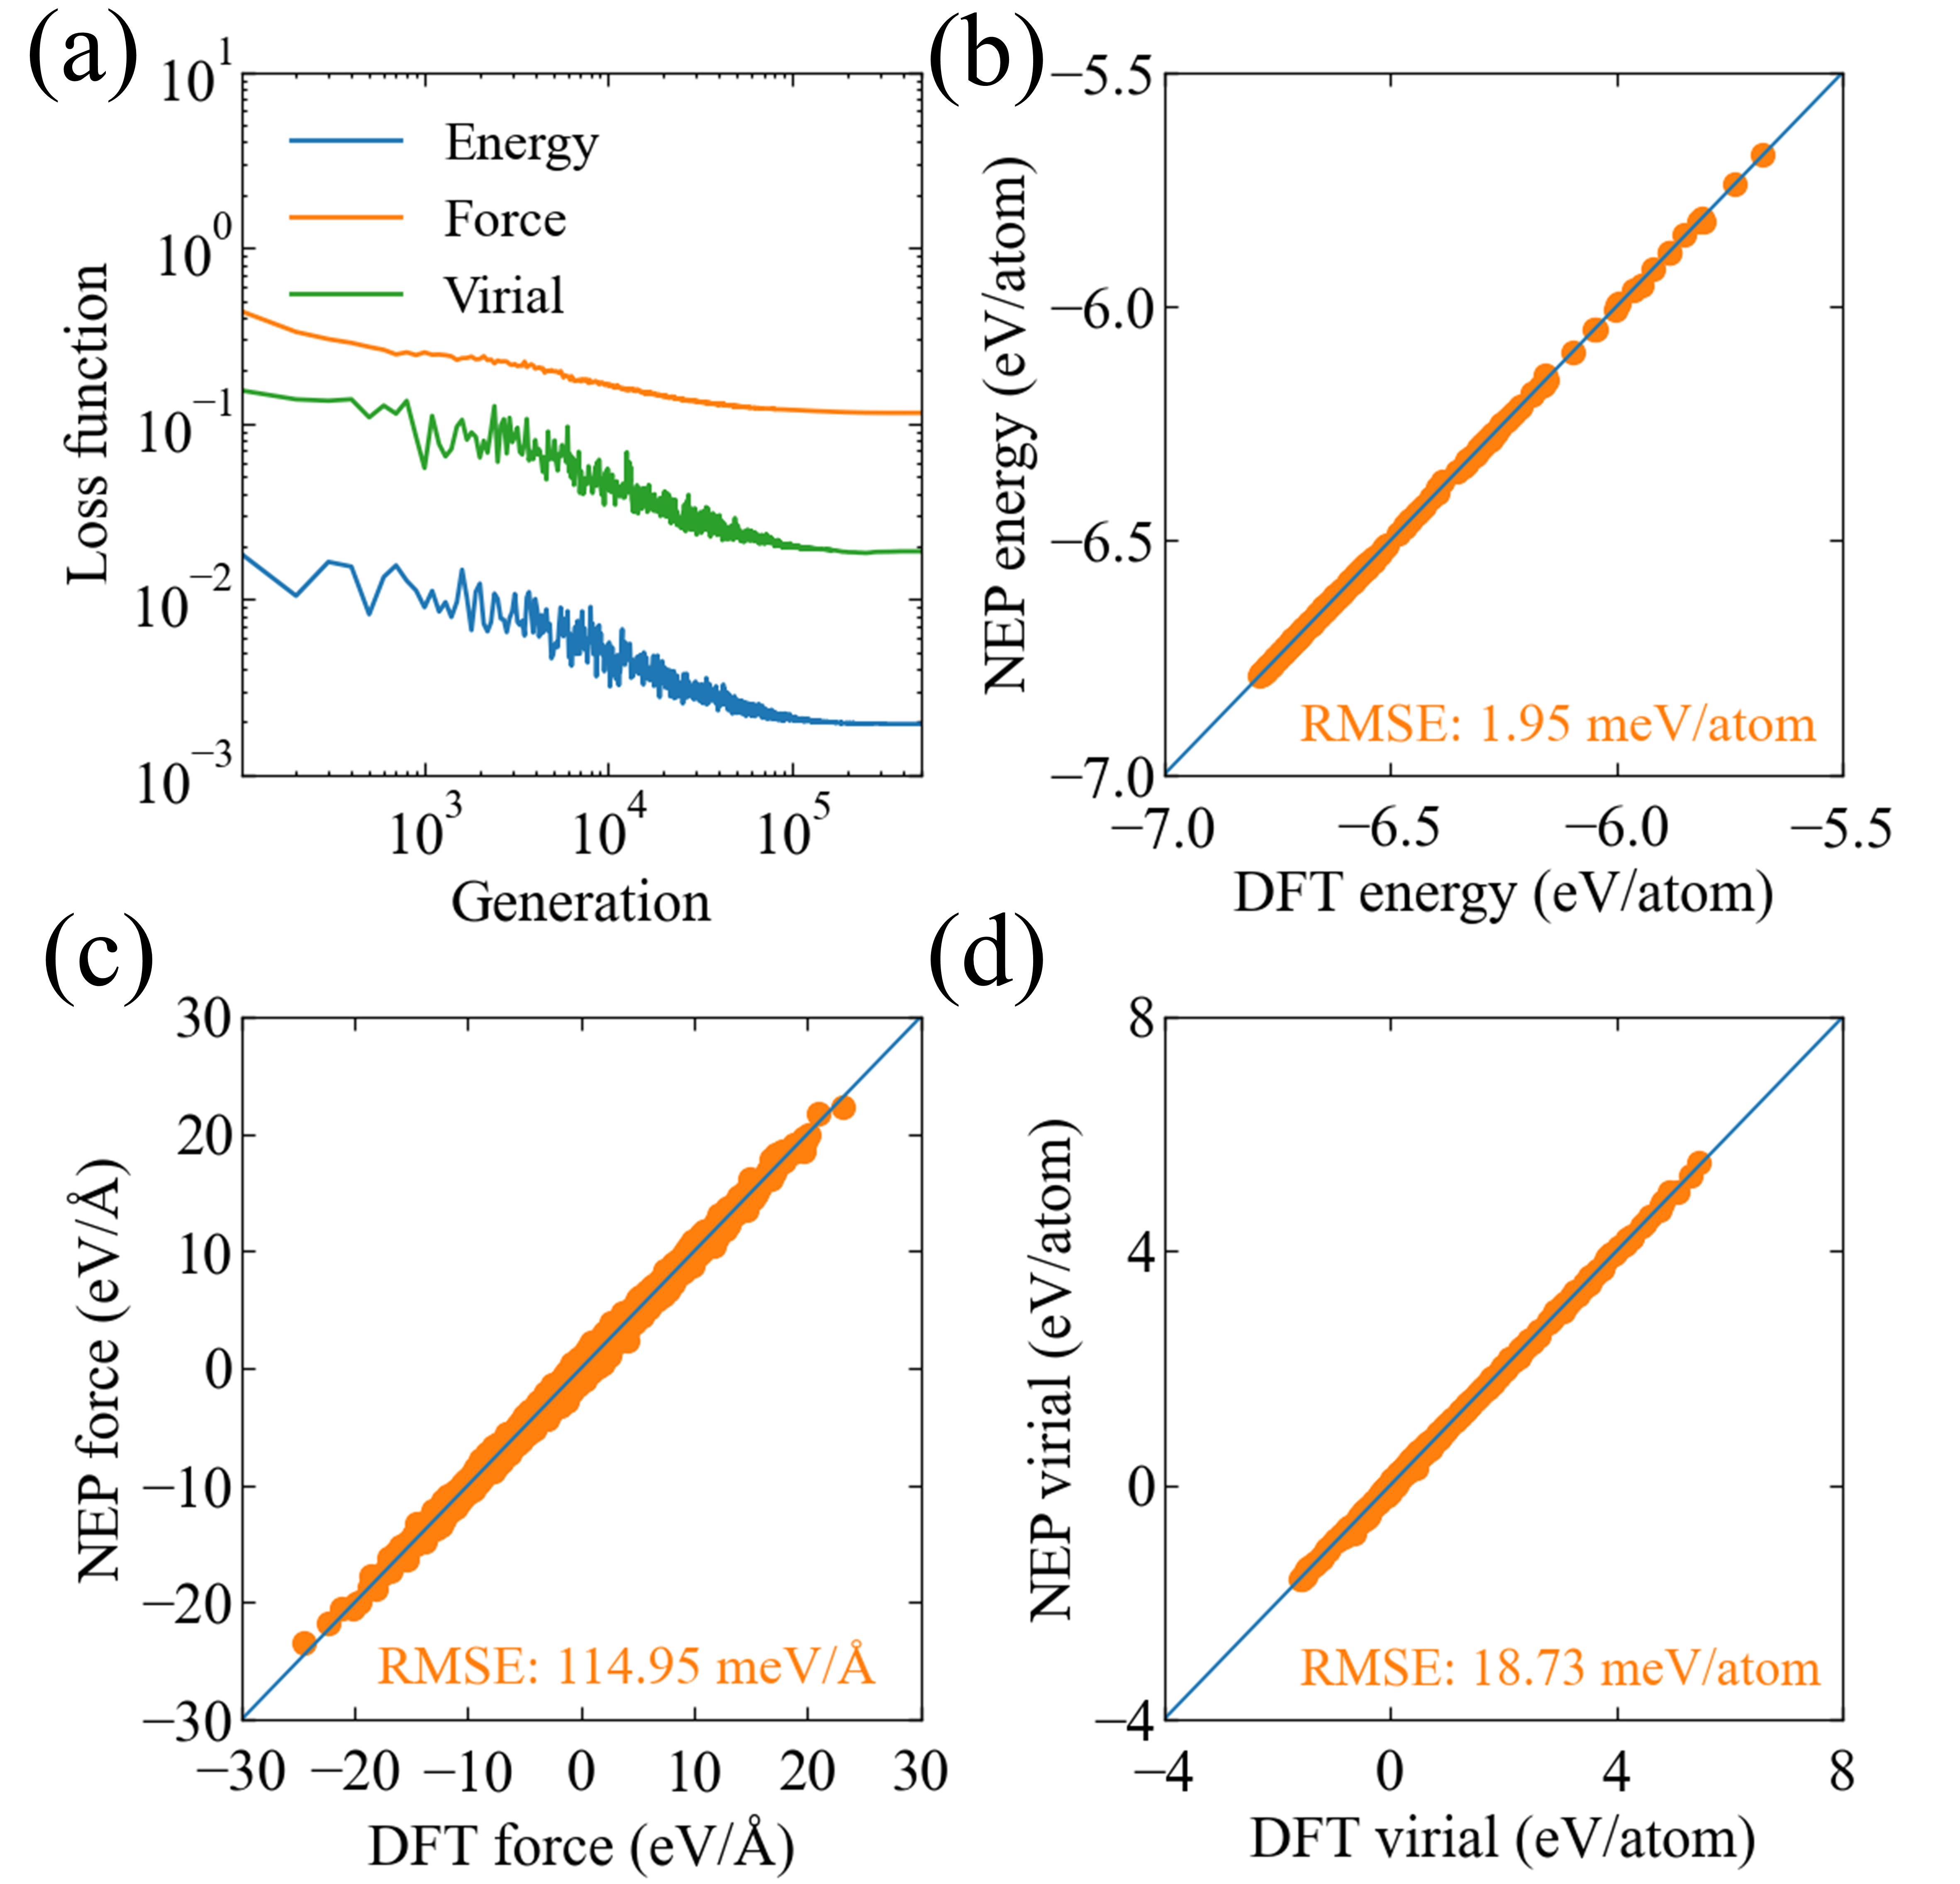
Figure 11. The dependence of the LTC of monolayer X2PdY6 (X = Nb, Ta; Y = S, Se) on length at 300 K, with dashed lines indicating the cumulative LTC reaching 90% of the total LTC. (a) Along the x-axis; (b) Along the y-axis. LTC: lattice thermal conductivity.
4. Conclusions
We developed an accurate NEP model trained on DFT data to investigate thermal transport in layered monoclinic X2PdY6 (X=Nb and Ta, Y=S and Se). Molecular dynamics simulations reveal strong anisotropic LTC in bulk crystals, with the maximum LTC occurring along the in-plane [010] direction (28.0, 15.8, 27.6, and 15.6 Wm-1 K-1 for Nb2PdS6, Nb2PdSe6, Ta2PdS6, and Ta2PdSe6 at 300 K, respectively) and the minimum occurring along the cross-plane [102] crystal direction (1.7-2.7 Wm-1 K-1), yielding anisotropy ratios of 10.4, 8.1, 14.3, and 9.0 for Nb2PdS6, Nb2PdSe6, Ta2PdS6, and Ta2PdSe6, respectively. Along the in-plane directions, the LTC along the [010] direction is much larger than that along the [20
Authors contribution
Wu X: Investigation, methodology, formal analysis, writing-review & editing.
Huang J, Li W, Guo Y, Zhang W: Investigation, formal analysis.
Cheng Y: Conceptualization, supervision.
Zhang G: Project administration, supervision.
Xiong S: Project administration, conceptualization, supervision, writing review & editing.
Conflict of interest
Gang Zhang is an Editorial Board Member and Shiyun Xiong is a Youth Editorial Board Member of Thermo-X. The other authors declare no conflicts of interest.
Ethical approval
Not applicable.
Consent to participate
Not applicable.
Consent for publication
Not applicable.
Availability of data and materials
The data that support the findings of this study are available from the corresponding author upon reasonable request.
Funding
This work is supported by the National Natural Science Foundation of China (Grant No. 12304059), the Basic and Applied Basic Research Foundation of Guangdong Province (Grant Nos. 2024A1515012635, 2024A1515010521 and 2022A1515110572), Guangzhou Municipal Science and Technology Program (Grant No. 2025A04J3566).
Copyright
© The Author(s) 2026.
References
-
1. Panna D, Itzhak R, Kumar A, Bouscher S, Suleymanov N, Minkovich B, et al. Andreev pair injection into a transition metal dichalcogenide monolayer. npj 2D Mater Appl. 2025;9:36.[DOI]
-
2. Manzeli S, Ovchinnikov D, Pasquier D, Yazyev OV, Kis A. 2D transition metal dichalcogenides. Nat Rev Mater. 2017;2(8):17033.[DOI]
-
3. Wang X, Tang Z, Li J, He C, Chen M, Tang C, et al. Phonon thermal transport in MTeX4 (M = Zr, Hf; X = S, Se) monolayers: Role of antibonding states and higher-order phonon anharmonicity. Phys Rev Appl. 2025;24(4):044023.[DOI]
-
4. Yu P, Zeng Q, Zhu C, Zhou L, Zhao W, Tong J, et al. Ternary Ta2PdS6 atomic layers for an ultrahigh broadband photoresponsive phototransistor. Adv Mater. 2021;33(2):2005607.[DOI]
-
5. Liu M, Qi L, Zou Y, Zhang N, Zhang F, Xiang H, et al. Uncooled near- to long-wave-infrared polarization-sensitive photodetectors based on MoSe2/PdSe2 van der Waals heterostructures. Nat Commun. 2025;16:2774.[DOI]
-
6. Elbanna A, Wang Z, Liang X, Liu H, Pan J, Shen ZX, et al. Synergistic cavity-enhanced photoresponse in transition metal dichalcogenide heterostructures. npj Nanophoton. 2026;3:6.[DOI]
-
7. Jia R, Liu Z, Wang Y, Zhao J, Huang Z, Yue W, et al. Frontier-orbital modulation of rhodium single-atom catalysts for enhanced hydrogen evolution. Nat Commun. 2026;17:6523.[DOI]
-
8. Nakano A, Suekuni K, Hattori N, Terasaki I. Spark plasma sintering on the thermoelectric sulfide Ta2PdS6. J Ceram Soc Japan. 2023;131(10):669-674.[DOI]
-
9. Ootsuki D, Nakano A, Maruoka U, Hasegawa T, Arita M, Kitamura M, et al. Band-selective plasmonic polaron in thermoelectric semimetal Ta2PdSe6 with ultra-high power factor. npj Quantum Mater. 2026;11:23.[DOI]
-
10. Aftab S, Hussain S, Al-Kahtani AA. Latest innovations in 2D flexible nanoelectronics. Adv Mater. 2023;35(42):2301280.[DOI]
-
11. Wu X, Zhang H, Zhang J, Lou XWD. Recent advances on transition metal dichalcogenides for electrochemical energy conversion. Adv Mater. 2021;33(38):2008376.[DOI]
-
12. Zhang S, Zuo W, Fu X, Li J, Zhang Q, Yang W, et al. High-entropy sulfoselenide as negative electrodes with fast kinetics and high stability for sodium-ion batteries. Nat Commun. 2025;16(1):4052.[DOI]
-
13. Jing P, Inoishi A, Zhao C, Kobayashi E, Ren P, Abrahams I, et al. In situ electrochemical activation of pseudo-layered NbS3 via interlayer expansion and dual redox for high Mg-ion storage. Adv Sci. 2026;13(27):e74690.[DOI]
-
14. Keszler DA, Squattrito PJ, Brese NE, Ibers JA, Shang M, Lu J, et al. New layered ternary chalcogenides: tantalum palladium sulfide (Ta2PdS6), tantalum palladium selenide (Ta2PdSe6), niobium palladium sulfide (Nb2PdS6), niobium palladium selenide (Nb2PdSe6). Inorg Chem. 1985;24(19):3063-3067.[DOI]
-
15. Cho S, Jeong BJ, Choi KH, Lee B, Jeon J, Lee SH, et al. Novel high current‐carrying quasi‐1D material: Nb2PdS6. Small. 2022;18(51):2205344.[DOI]
-
16. Cho S, Kang J, Lee B, Jeong BJ, Zhang X, Kim D, et al. Self-powered and gate-reconfigurable photodetection and logic operations in the Ta2PdS6/WSe2 van der Waals heterostructure. Nanoscale. 2026;18(30):16292-16299.[DOI]
-
17. Han Y, Zheng T, Luo H, Liu J, Wang M, Ke X, et al. Anisotropy‐driven carrier transport modulation in stacking‐engineered Ta2PdS6/ReSe2 van der Waals heterostructures photodetectors. Adv Optical Mater. 2026;14(7):e02956.[DOI]
-
18. Liu W, Feng J, Hou Q, Li B, Wang K, Chen B, et al. Pressure-induced superconductivity and isosymmetric structural transition in quasi-one-dimensional Ta2PdS6. Phys Rev B. 2024;109(5):054513.[DOI]
-
19. Yang H, Zhou Y, Li L, Chen Z, Zhang Z, Wang S, et al. Pressure-induced superconductivity in quasi-one-dimensional semimetal Ta2PdSe6. Phys Rev Mater. 2022;6(8):084803.[DOI]
-
20. Yang L, Wang D, Hu Z, Dong Z, Zhang Y, Tang K, et al. Quasi-one-dimensional Ta2PdSe6 with strong topological surface states for high-performance and polarization-sensitive terahertz detection. Nano Lett. 2025;25(19):7690-7698.[DOI]
-
21. Matsumoto R, Nakano A, Yamamoto TD, Terashima K, Yamane K, Ohkuma M, et al. Pressure-induced anomalous enhancement in the superconducting critical temperature of the transition metal chalcogenides Ta2PdS6 and Ta2PdSe6. Phys Rev B. 2025;112(9):094502.[DOI]
-
22. Nakano A, Akashi S, Maruoka U, Nagae H, Kimata M, Yamakage A, et al. Scattering engineering for high power factor semimetals proved by Shubnikov‐de Haas oscillation and anisotropic resistivity. Adv Electron Mater. 2025;11(19):e00279.[DOI]
-
23. Kato F, Maruoka U, Nakano A, Manjo T, Ishikawa D, Baron AQR, et al. Enhanced cryogenic thermoelectricity in semimetal Ta2PdSe6 through non-Fermi liquid-like charge and heat transport. Adv Phys Res. 2024;3(11):2400063.[DOI]
-
24. Nakano A, Maruoka U, Kato F, Taniguchi H, Terasaki I. Room temperature thermoelectric properties of isostructural selenides Ta2PdS6 and Ta2PdSe6. J Phys Soc Jpn. 2021;90(3):033702.[DOI]
-
25. Li Y, Zheng W, Pu JH, Wang Q, Jiang JH. Strong lattice anharmonicity and glass-like lattice thermal conductivity in nitrohalide double antiperovskites: A case study based on machine-learning potentials. Thermo-X. 2025;1(1):202501.[DOI]
-
26. Kresse G, Joubert D. From ultrasoft pseudopotentials to the projector augmented-wave method. Phys Rev B. 1999;59(3):1758-1775.[DOI]
-
27. Blöchl PE. Projector augmented-wave method. Phys Rev B. 1994;50(24):17953-17979.[DOI]
-
28. Perdew JP, Burke K, Ernzerhof M. Generalized gradient approximation made simple. Phys Rev Lett. 1996;77(18):3865-3868.[DOI]
-
29. Grimme S, Antony J, Ehrlich S, Krieg H. A consistent and accurate ab initio parametrization of density functional dispersion correction (DFT-D) for the 94 elements H-Pu. J Chem Phys. 2010;132(15):154104.[DOI]
-
30. Grimme S, Ehrlich S, Goerigk L. Effect of the damping function in dispersion corrected density functional theory. J Comput Chem. 2011;32(7):1456-1465.[DOI]
-
31. Ying P, Fan Z. Combining the D3 dispersion correction with the neuroevolution machine-learned potential. J Phys: Condens Matter. 2024;36(12):125901.[DOI]
-
32. Togo A, Tanaka I. First principles phonon calculations in materials science. Scr Mater. 2015;108:1-5.[DOI]
-
33. Fan Z, Wang Y, Ying P, Song K, Wang J, Wang Y, et al. GPUMD: A package for constructing accurate machine-learned potentials and performing highly efficient atomistic simulations. J Chem Phys. 2022;157(11):114801.[DOI]
-
34. Fan Z, Dong H, Harju A, Ala-Nissila T. Homogeneous nonequilibrium molecular dynamics method for heat transport and spectral decomposition with many-body potentials. Phys Rev B. 2019;99(6):064308.[DOI]
-
35. Evans DJ. Homogeneous NEMD algorithm for thermal conductivity: Application of non-canonical linear response theory. Phys Lett A. 1982;91(9):457-460.[DOI]
-
36. Gabourie AJ, Fan Z, Ala-Nissila T, Pop E. Spectral decomposition of thermal conductivity: Comparing velocity decomposition methods in homogeneous molecular dynamics simulations. Phys Rev B. 2021;103(20):205421.[DOI]
-
37. Zhou Y, Zhang X, Hu M. Quantitatively analyzing phonon spectral contribution of thermal conductivity based on nonequilibrium molecular dynamics simulations. I. Phys Rev B. 2015;92(19):195204.[DOI]
-
38. Sääskilahti K, Oksanen J, Volz S, Tulkki J. Frequency-dependent phonon mean free path in carbon nanotubes from nonequilibrium molecular dynamics. Phys Rev B. 2015;91(11):115426.[DOI]
-
39. Fan Z, Pereira LFC, Hirvonen P, Ervasti MM, Elder KR, Donadio D, et al. Thermal conductivity decomposition in two-dimensional materials: Application to graphene. Phys Rev B. 2017;95(14):144309.[DOI]
-
40. Martyna GJ, Klein ML, Tuckerman M. Nosé–Hoover chains: The canonical ensemble via continuous dynamics. J Chem Phys. 1992;97(4):2635-2643.[DOI]
-
41. Wang X, Yang J, Ying P, Fan Z, Zhang J, Sun H. Dissimilar thermal transport properties in k-Ga2O3 and β-Ga2O3 revealed by homogeneous nonequilibrium molecular dynamics simulations using machine-learned potentials. J Appl Phys. 2024;135(6):065104.[DOI]
-
42. Jiang P, Qian X, Li X, Yang R. Three-dimensional anisotropic thermal conductivity tensor of single crystalline β-Ga2O3. Appl Phys Lett. 2018;113(23):232105.[DOI]
-
43. Maintz S, Deringer VL, Tchougréeff AL, Dronskowski R. LOBSTER: A tool to extract chemical bonding from plane-wave based DFT. J Comput Chem. 2016;37(11):1030-1035.[DOI]
-
44. Xiong K, Li Y, Lin Z, Luo G, Wu J. Phonon-mediated heat transport in CO2 hydrate. J Phys Chem A. 2026;130(1):319-331.[DOI]
-
45. Singh D, Murthy JY, Fisher TS. Mechanism of thermal conductivity reduction in few-layer graphene. J Appl Phys. 2011;110(4):044317.[DOI]
-
46. Fugallo G, Cepellotti A, Paulatto L, Lazzeri M, Marzari N, Mauri F. Thermal conductivity of graphene and graphite: Collective excitations and mean free paths. Nano Lett. 2014;14(11):6109-6114.[DOI]
-
47. Balandin AA, Ghosh S, Bao W, Calizo I, Teweldebrhan D, Miao F, et al. Superior thermal conductivity of single-layer graphene. Nano Lett. 2008;8(3):902-907.[DOI]
-
48. Liang T, Jiang W, Xu K, Bu H, Fan Z, Ouyang W, et al. PYSED: A tool for extracting kinetic-energy-weighted phonon dispersion and lifetime from molecular dynamics simulations. J Appl Phys. 2025;138(7):075101.[DOI]
Copyright
© The Author(s) 2026. This is an Open Access article licensed under a Creative Commons Attribution 4.0 International License (https://creativecommons.org/licenses/by/4.0/), which permits unrestricted use, sharing, adaptation, distribution and reproduction in any medium or format, for any purpose, even commercially, as long as you give appropriate credit to the original author(s) and the source, provide a link to the Creative Commons license, and indicate if changes were made.
Publisher’s Note
Science Exploration remains a neutral stance on jurisdictional claims in published
maps
and institutional affiliations. The views expressed in this article are solely those
of
the author(s) and do not reflect the opinions of the Editors or the publisher.
Share And Cite


Science Exploration Style
Wu X, Huang J, Li W, Guo Y, Zhang W, Cheng Y, et al. Insights into lattice thermal transport mechanisms in layered chalcogenides X2PdY6 (X = Nb, Ta; Y = S, Se) via machine learning molecular dynamics simulations. Thermo-X. 2026;2:202625. https://doi.org/10.70401/tx.2026.0031
Tips
Copy completed.
Submit a Manuscript
Author Instructions
Cite this Article
Article Metrics
0
View
0
Download
Cited
Article Updates

 Get citation
Science Exploration Style

Wu X, Huang J, Li W, Guo Y, Zhang W, Cheng Y, et al. Insights into lattice thermal transport mechanisms in layered chalcogenides X2PdY6 (X = Nb, Ta; Y = S, Se) via machine learning molecular dynamics simulations. Thermo-X. 2026;2:202625. https://doi.org/10.70401/tx.2026.0031
copy
Share Link
copy