Analyzing urban building energy demand under UHI influence in the tropical megacity of Mumbai Download PDF
Arunim Anand
1,*

,
Eswar Rajasekaran
1
,
Chirag Deb
2
*Correspondence to:
Arunim Anand, Department of Civil Engineering, Indian Institute of Technology Bombay, Powai, Mumbai 400076, Maharashtra, India.
E-mail: 214420001@iitb.ac.in
J Build Des Environ. 2025;3:202561. 10.70401/jbde.2025.0016
Received: July 31, 2025Accepted: October 17, 2025Published: October 27, 2025
Abstract
Buildings account for a substantial proportion of urban energy demand, making it essential to understand the interrelationships between the built environment, urban heat island (UHI) effects, and energy demand. This study investigates the impacts of UHI on urban building energy demand in Mumbai, India, using a multi-scale framework. First, UHI intensity is assessed by generating and analyzing Land Surface Temperature maps and calculating the Urban Thermal Comfort and Vulnerability Index. This assessment identifies UHI hotspots and regions with potential thermal discomfort. Subsequently, energy demand modelling is conducted across two locations with distinct thermal comfort conditions, spanning from the individual building to the urban scale. Detailed building information and site-specific climate data from the two contrasting locations are collected to support urban building energy modelling (UBEM). Results reveal that UHI increases cooling energy demand by 7.31% at the individual building level; however, its impact on urban-scale energy demand is significantly mitigated by building geometry and surrounding structures. Specifically, variations in building height and inter-building shading outweigh the influence of UHI, leading to a substantial 15.9% reduction in the mean cooling energy demand intensity. These findings highlight the critical role of urban morphology and density in shaping cooling energy demand under UHI conditions. By extending beyond individual building-level assessments to UBEM, the study contributes new evidence regarding UHI-energy interactions in a year-round warm tropical context such as Mumbai. Furthermore, the results position urban-scale cooling energy demand assessments as a transferable framework to integrate UHI research with energy policy, ultimately supporting climate-responsive planning.
Keywords
Urban building energy demand, urban heat island, building energy demand, urban climate, land surface temperature
1. Introduction
The United Nation states that cities account for more than 70% of global energy consumption[1]. As cities undergo transformation, expanding both horizontally and vertically, the construction and operation of buildings become central to urban development, driving a substantial increase in urban building energy demand[2,3]. The proliferation of buildings, ranging from residential to commercial and industrial structures, indicates a shift in urban energy consumption patterns. Meanwhile, buildings emerge as primary electricity consumers for cooling, heating, lighting, and other functions[4]. The evolution of urban environment also shapes the quality and scale of buildings. Improved urban lifestyles often involve more energy-demanding housing units equipped with a diverse range of amenities. To meet the demand for better work, entertainment, and recreational experiences, energy consumption associated with offices and commercial establishments like restaurants, theatres, and shopping malls increases concurrently[5]. Furthermore, the high density and clustering of buildings in urban areas exacerbate the dynamics of energy demand, amplifying the challenges related to energy consumption management[6].
The urban expansion gives rise to profound environmental transformations, which in turn alter local and regional climates. For instance, land surfaces change and natural vegetation is replaced by impermeable materials, leading to the formation of urban heat islands (UHI) effect. Under such circumstances, the temperature in urban areas is higher than that in surrounding rural areas. These UHIs exacerbate heat stress and adversely affect the thermal comfort of urban dwellers. The intensity of UHI is primarily determined by the thermal characteristics of urban materials, resulting in temperature differences of up to several degrees[7,8]. This effect tends to be more distinctive at night, as urban infrastructure, such as buildings and roads, absorbs and stores heat during the day and gradually releases it after sunset. UHI is particularly prevalent in megacities and rapidly developing urban areas[9,10,11]. As cities continue to expand and new urban centers emerge, urban population growth, climate change and UHI effects will lead to a surge in building energy demand, especially for cooling, ventilation and lighting systems[12,13].
UHIs have garnered considerable attention in urban studies due to their significant implications for environmental sustainability and human well-being. The most common approach to study UHI involves the use of land surface temperature (LST) from satellite sources such as Landsat and Moderate-resolution Imaging Spectroradiometer[14,15]. These datasets prove invaluable for analyzing daily, monthly or seasonal LST across diverse terrains[16,17]. Studies focusing on the relation between LST and land use have shown that at the city scale, a lower proportion of water bodies and vegetation, coupled with higher built-up spaces, constitutes the primary drivers of UHI[18-20]. Thus, the spatial distribution of LST is shaped by urban features and varies across ecological zones due to differences in climate, construction practices, and other factors[21,22]. At a finer level, UHI will also vary with settlement types and construction materials in practice.
In response to UHI and its implications for urban livability, increasing attention has been directed toward the relation between urban landscapes and thermal dynamics[23,24]. Numerous thermal comfort indices have been developed to examine the impacts of thermal environments on urban residents’ well-being. While some indices such as Physiological Equivalent Temperature and Temperature Humidity Index involve multiple climatic variables, others such as urban heat island intensity (UHII) and urban thermal field variance index (UTFVI) rely on air temperature and LST[25-29]. Urban thermal environment is also indirectly influenced by factors including spatial form, building typology, and policy intervention. For example, evidence suggests a positive correlation between polycentric urban development in morphology and the deterioration of thermal environment[30]. Similarly, UHI intensity is influenced by the size and compactness of urban areas[31].
It is crucial to recognize that the concept of thermal comfort extends beyond LST and air temperature of a region. Within the built environment, thermal comfort is additionally influenced by a complex interaction of factors such as humidity, wind speed, shading, and building design. These factors, together with indoor air quality, visual and acoustic comfort, collectively impact the indoor environmental quality for urban residents, shaping their appliance usage patterns and consequently influencing overall energy demand[32].
Several studies have highlighted the influence of the spatiotemporal variations in weather and UHI on building energy consumption[33-35]. To be specific, UHI effects can trigger a notable rise in cooling energy consumption of buildings, with values ranging from a median of 19% to a maximum of 120%[36]. A separate study reported that every 0.5 K increase in UHII can lead to an increase of up to 1.84 kWh/m2 in cooling energy consumption[37]. Significant disparities in energy demand have also been identified within and across cities, indicating an inherent relationship between urban morphology, LST and energy demand[38]. Despite extensive findings on how UHI and climate changes impact building energy demand, building typologies exhibit diverse characteristics in terms of usage and design in most urban settings, underscoring the necessity for comprehensive urban-scale energy assessments. Moreover, climatic variations at the urban scale have potential implications, enabling more informed decisions regarding adaptation and mitigation measures[39,40].
The increasing prevalence of UHIs is poised to escalate energy demand at a broader scale[36,41]. However, a major challenge in conducting assessment at the urban scale lies in acquiring high-resolution and reliable data such as weather variables, building characteristics and appliances. Additionally, robust analytical frameworks capable of handling such complex data are crucial. Urban building energy modelling (UBEM) is an emerging field that can analyze and forecast urban energy demand through precise simulations of hundreds or even thousands of buildings by incorporating critical inputs[42-44]. In UBEM, the physical properties and typologies of buildings encompass variables such as geometry, construction materials, window-to-wall ratios, usage and so forth. Weather-related inputs typically include temperature, humidity, solar radiation, wind speed. UBEM also accounts for human-related factors such as occupancy schedules and appliance usage behaviors. To support the planning and optimization of energy-efficient and sustainable urban environments, several UBEM tools have been developed in the last decade[45,46].
Most UBEM tools are robust and offer extensive capabilities and outputs, despite certain inherent limitations. Notably, the majority of contemporary UBEM tools rely on a single climate dataset to simulate energy demand across the entire city. The integration of finer-scale microclimate data into urban building datasets has proven effective in assessing variations in cooling energy demand across urban environments[47,48]. Furthermore, the access to detailed building data primarily depends on existing databases, widely available in developed countries but remain challenging to obtain in developing regions. Since large-scale in-situ data collection for buildings is a tedious task, the use of remote sensing data and geospatial tools becomes indispensable[49,50]. UBEM also provides a more holistic understanding of energy demand across entire neighborhoods and cities.
While UHI significantly elevates temperatures in cities before increasing the cooling energy demand of individual buildings, its influence on large-scale energy demand is further modulated by building-specific characteristics and broader urban morphology. Factors such as building height, footprint area, shape, and density of surrounding structures critically determine a building’s exposure to UHI-induced thermal stress and, consequently, its cooling demand. For instance, taller buildings often exhibit stratified thermal conditions with cooling loads varying between lower and upper floors[51,52]. Similarly, variations in building shapes and adjacent densities affect shading, resulting in differences in cooling energy demand[53,54].
1.1 Need and novelty of the study
The intensification of UHIs in megacities may markedly rise urban energy demand. Although numerous studies have examined the cooling energy demand of individual buildings in response to spatial and temporal temperature variations from the perspective of UHI, there is a notable research gap regarding fluctuations at a larger scale. The spatial diversity of urban climate, especially within mixed-use built environments, plays a crucial role in energy dynamics that cannot be captured at the individual building level. Despite the evident importance of UHI for cooling energy demand, research on the combined interaction among UHI, building geometry, and urban density remains limited. Moreover, a comprehensive analysis of thermal anomalies in year-round warm tropical cities with regard to the residents’ wellbeing and consequent impacts on urban-scale energy demand, has been largely absent.
An urban-scale modelling is vital for developing effective UHI mitigation policies, as studies focused solely on the building level may overlook the cumulative impacts of elevated temperatures and surrounding built-environment characteristics on cooling energy demand. Furthermore, urban-scale energy variations are more complex as diverse building geometries and typologies may alter localized UHI effects, climates and their subsequent impacts on indoor thermal conditions and cooling energy demand. This perspective offers a more holistic understanding of a city’s energy landscape, crucial for forming effective energy policies and urban planning strategies.
The novelty of this study lies in explicitly bridging this gap by adopting a multi-scale framework that links building-level UHI impacts with neighborhood- and city-scale energy dynamics. Unlike most previous studies that emphasize either UHI mapping or single-building simulations, this research integrates remote sensing based on UHI assessment with detailed UBEM. The approach demonstrates how UHI effects interact with urban-scale building morphology, density, and typologies to shape cooling demand in the context of a tropical megacity—a setting largely underrepresented in the literature despite its high vulnerability to rising cooling loads.
Against this background, this study proposes a multi-stage approach to evaluate UHI effects on urban building energy demand in the tropical megacity of Mumbai. Regions characterized by different thermal comfort zones are first identified by using remote sensing data. Then detailed building databases are developed for two locations representing distinct thermal zones. UBEM is finally employed to assess variations in cooling energy demand at building and urban scale across these two contrasting zones. By embedding UHI assessment within an urban-scale energy modelling framework, the study advances a replicable methodological contribution for future research in other data-scarce, rapidly growing tropical cities. The study covers assessments from the individual building level to the urban scale, incorporating local climate and urban morphological parameters unique to each location. Through this integrated framework, this study addresses the urgent need for urban-scale assessments of rising cooling energy demand to promote the sustainability and livability of urban areas amid environmental challenges.
2. Methodology
2.1 Study area and data sources
The study was conducted in Mumbai, the second most populous city in India. From an administrative perspective, the city spans about 900 km2 across two districts Mumbai and Mumbai Suburban. Mumbai has a tropical climate characterized by high temperatures and humidity throughout the year, and has undergone significant expansion of built-up areas over the past few decades[55]. For the built environment, the city hosts a diverse range of buildings from historic landmarks to modern skyscrapers. The city’s dense urban fabric, extensive paved surfaces, and concentration of high-rise buildings intensify the UHI effects in Mumbai[56]. These characteristics, combined with heterogeneous land-use patterns and prevalent building typologies suggest considerable variations in energy demand throughout the city.
To assess urban energy demand variations related to UHI effects, two locations were selected: the Indian Institute of Technology Bombay (IIT Bombay or IITB) campus in the Powai region of Mumbai, and a section of the Sion region in Central Mumbai. These sites represent two distinct thermal zones within the city, identified through LST and UTFVI analysis, as detailed in subsequent sections. IITB, situated near the Powai Lake and characterized by substantial vegetation cover, consistently exhibits lower LSTs. In contrast, Sion is a densely residential-commercial area with limited vegetation and a high impervious surface fraction, contributing to elevated daytime temperatures and greater nighttime heat retention. This thermal contrast provides a clear basis for evaluating the influence of UHI-driven thermal heterogeneity on cooling energy demand. Spanning over 2.5 km2, the IITB campus accommodates over 300 buildings with diverse functions, including residences, hostels, lecture halls, laboratories, and offices. The selection of this campus as a focal point for the study is based on its assorted building types and occupancy schedules. Similarly, the selected area in Sion covers over 100 buildings with varied functions. To compare cooling energy demand between the two areas, buildings with analogous construction materials and functional types are selected.
Multiple datasets were integrated for this analysis. Landsat-8 level-1 images serve as the primary dataset for deriving LST and assessing the spatial variability of UHI effects. Specifically, two cloud-free images, representing summer (April) and winter (January), were utilized to capture seasonal variations in LST. These images, covering a geographical area larger than Mumbai, were clipped to match the boundaries of the study area. To evaluate the spatial and temporal variations in air temperatures, hourly data were obtained from Central Pollution Control Board (CPCB) monitoring sites in Mumbai (Figure 1). For UBEM, the standard EnergyPlus weather (EPW) file for Mumbai, developed by the Indian Society of Heating, Refrigerating, and Air Conditioning Engineers (ISHRAE), was used as the reference dataset. This file contains the full set of meteorological parameters required for UBEM, including temperature, humidity, solar radiation, wind speed, and other atmospheric variables. To ensure localized climatic representation, hourly air temperature and relative humidity data from CPCB sensors were integrated into the EPW file, producing site-specific weather files for IITB and Sion. These revised files were then employed in all UBEM simulations. The use of in-situ CPCB data is indispensable, as it captures local climatic variations that cannot be resolved by standardized or coarse datasets, and simultaneously maintains the complete meteorological inputs essential for robust energy modeling.
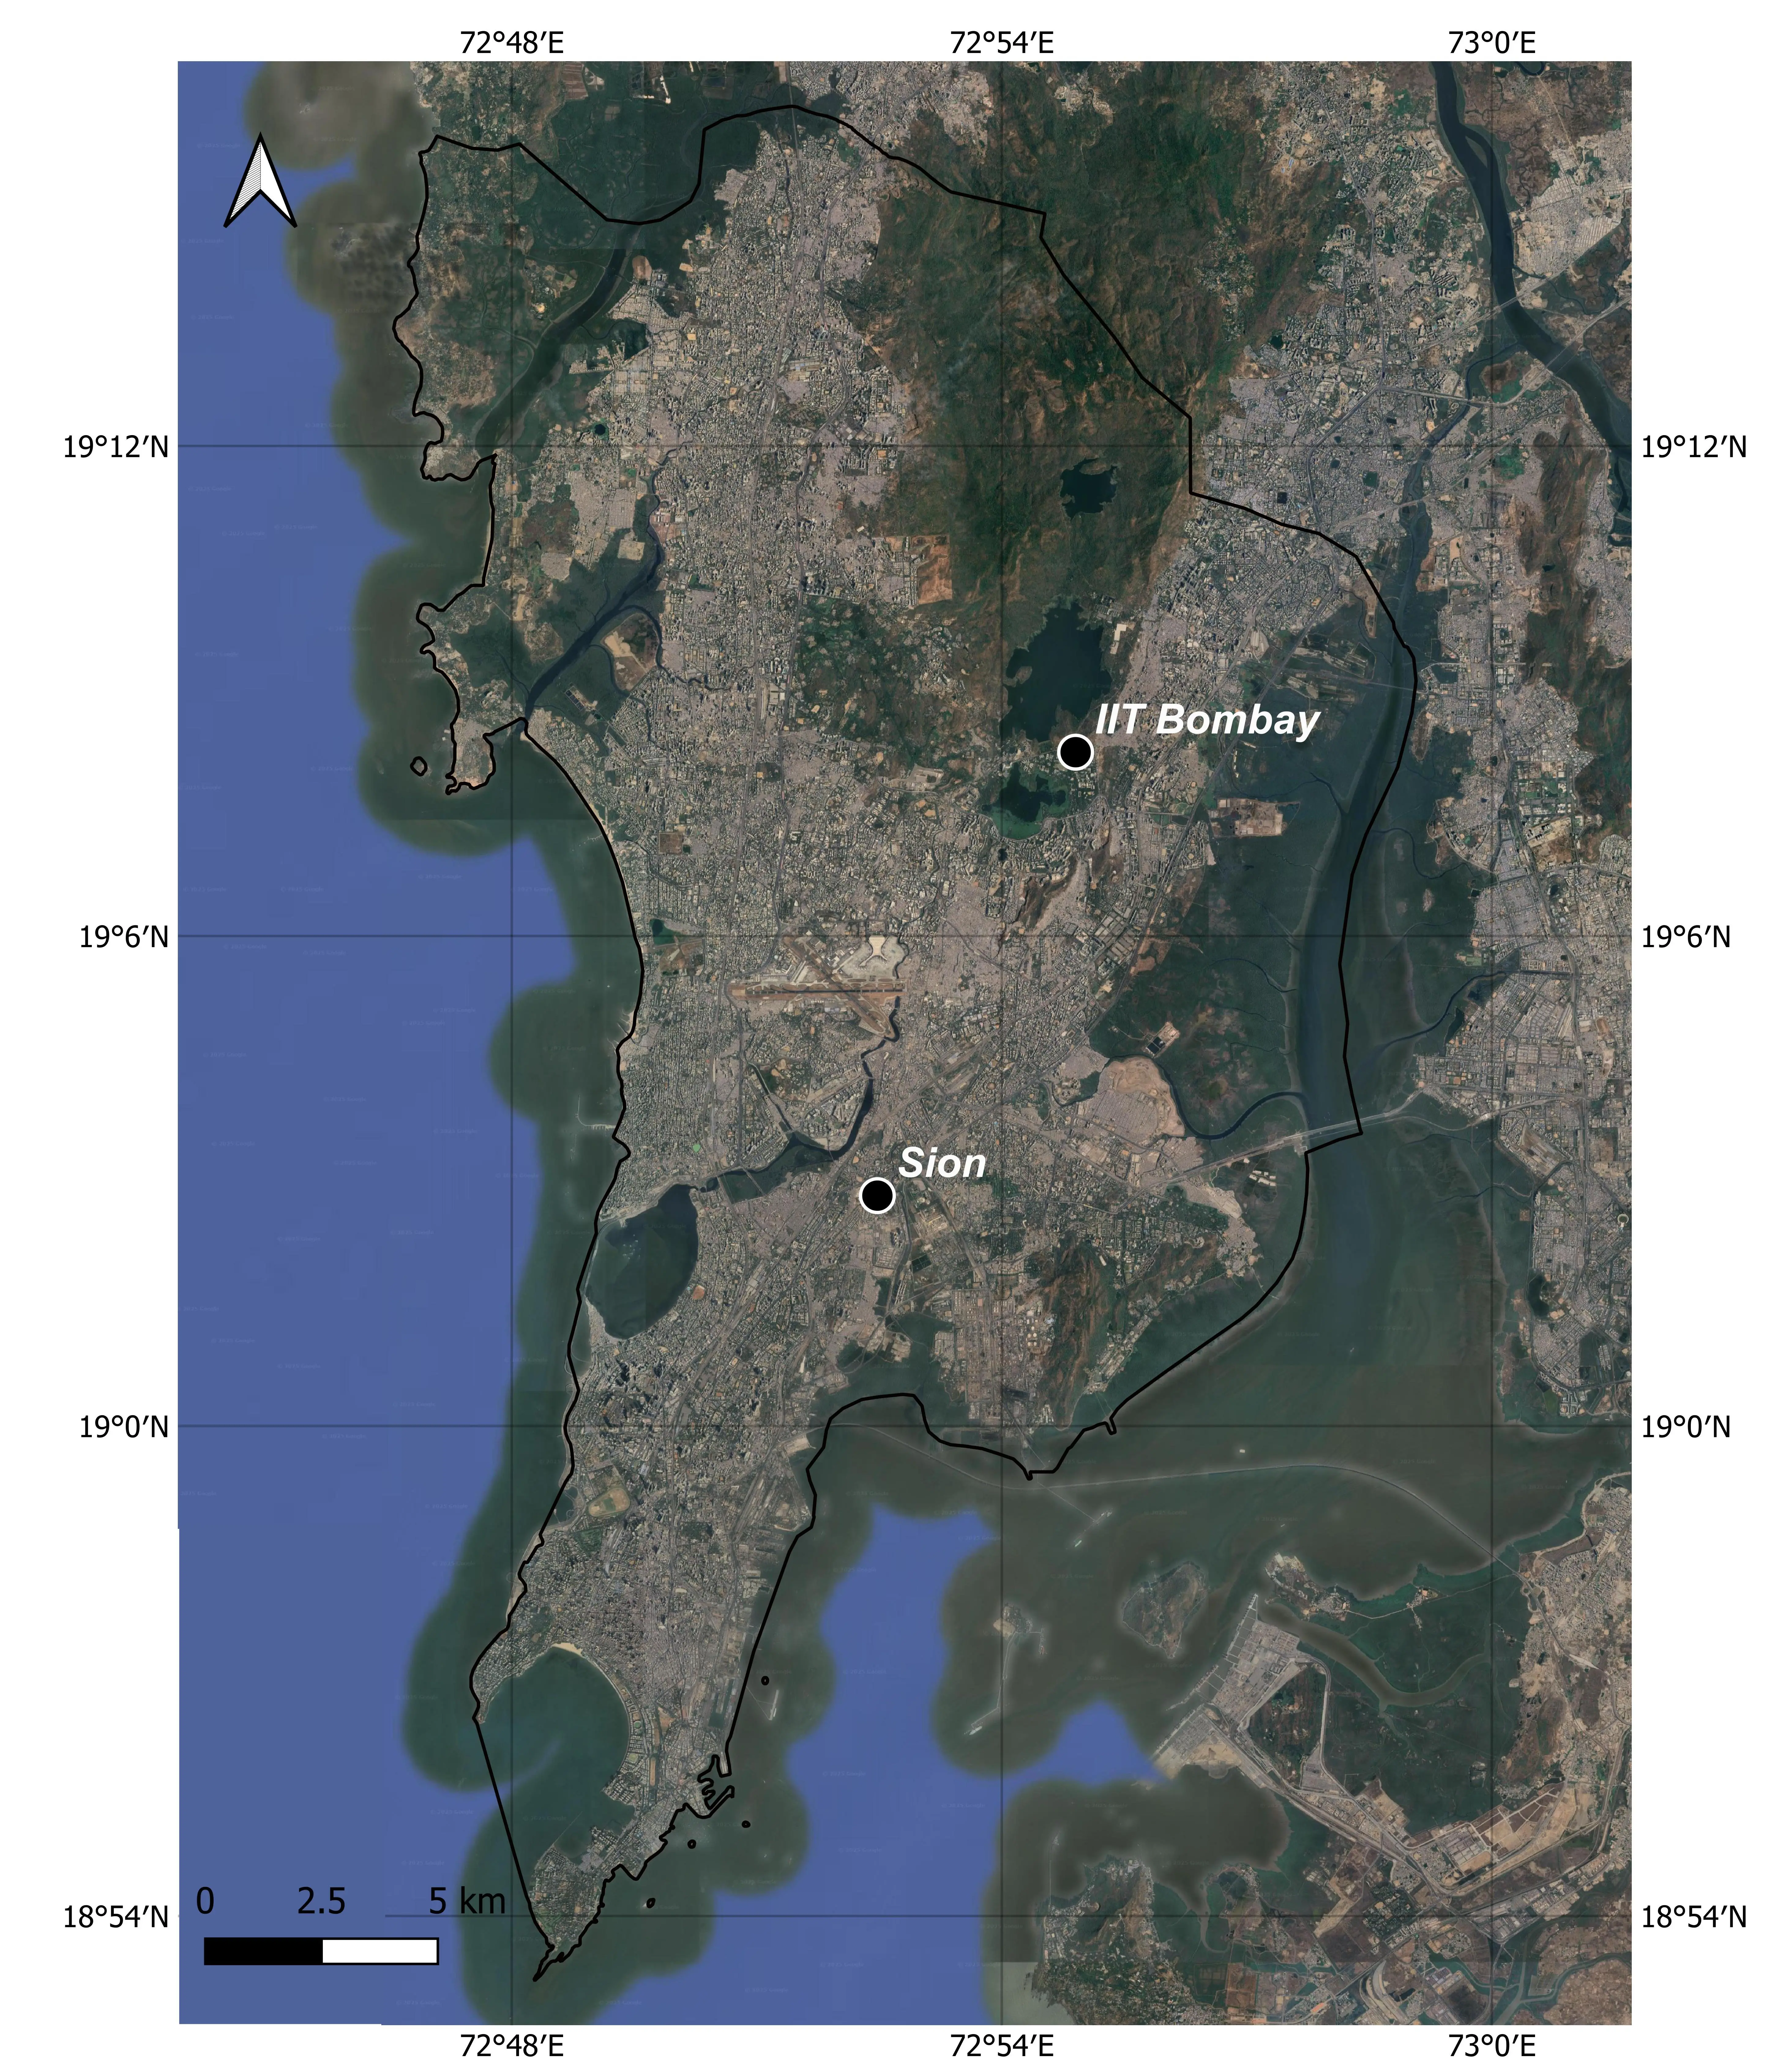
Figure 1. Study area covering the megacity of Mumbai for UHI analysis and the locations of IIT Bombay and Sion used for UBEM (Maps data: © 2025 Google). UHI: urban heat islands; IIT: Indian Institute of Technology; UBEM: urban building energy modelling.
Data acquisition for buildings and occupants required a multifaceted approach integrating multiple data sources. Building footprints and geometries stemmed from OpenStreetMap and were supplemented by processed high-resolution images and collected data during site visits. Building typologies and occupancy patterns were also gathered from site visits and secondary institutional sources such as IITB campus map, ensuring that diverse building types including residential houses, hostels, offices, classrooms, and laboratories, were adequately represented. For both sites, buildings with analogous materials were selected to directly compare cooling energy demands under distinct climate conditions.
The overall quality of the datasets was rigorously evaluated. Landsat-8 images underwent standard atmospheric and radiometric corrections; CPCB station data were checked for continuity and completeness; and building data from multiple sources were cross-validated to ensure consistency. This multi-source approach guaranteed that the study combined both spatially detailed and temporally resolved data with sufficient accuracy to underpin the subsequent UHI analysis and UBEM simulations.
The study employs multi-stage processes, first identifying two urbanized areas in Mumbai with potentially distinct thermal zones. For these areas, air temperature variations were analyzed, both spatially and temporally. Subsequently, these variations’ impacts on urban energy demands were assessed by utilizing the nearest weather data alongside similar building types in both areas.
2.2 UHI analysis and identification of regions with distinct UTFVI
To investigate the UHI effects in the regions, Landsat-8 images were processed in Google Earth Engine. Mumbai typically experiences cloud-free conditions during January and April, although temperatures in April are notably higher than those in January. Thermal bands from the dataset were used to retrieve brightness temperature, while optical bands were utilized to calculate the Normalized Differential Vegetation Index (NDVI). Both of these data were eventually employed to generate LST. Sanjay Gandhi National Park (SGNP), a well vegetated region located on the outer periphery of Mumbai sub-urban district, was chosen as the UHI reference site and afterwards variations across the entire region were analyzed.
Urban Thermal Field Vulnerability Index (UTFVI) has been employed as a robust metric to assess the thermal zones within the city based on LSTs. This index evaluates the thermal impact of each pixel within the urban domain relative to the overall urban environment[57]. The UTFVI is defined by the following equation[58]:
where, LSTs is the LST of a certain pixel and LSTmean is the average LST for the whole area of interest.
The UTFVI values are classified into six distinct classes corresponding to specific ecological evaluation indices related to thermal dynamics and human well-being (Table 1). Each class reflects different levels of UHI intensity and its consequent influence on the thermal comfort[59]. These indices, ranging from excellent to poor, serve as benchmarks for assessing the severity of UHI effects. UTFVI values below zero denote the absence of a discernible UHI effect in the pixel, indicative of maximum thermal comfort or excellent ecological quality within the area. Conversely, as UTFVI value increases, thermal comfort and ecological quality gradually decline from excellent to the least favorable condition[60].
| CLASS | UTFVI | UHI Presence | Ecological Evaluation Index |
| 1 | < 0 | None | Excellent |
| 2 | 0 - 0.005 | Weak | Good |
| 3 | 0.005 - 0.010 | Middle | Normal |
| 4 | 0.010 - 0.015 | Strong | Bad |
| 5 | 0.015 - 0.020 | Stronger | Worse |
| 6 | > 0.020 | Strongest | Worst |
UTFVI: urban thermal field variance index; UHI: urban heat islands.
Landsat data were utilized to generate daytime LST and UTFVI maps. UTFVI classes and proximity to CPCB weather stations were considered when selecting regions suitable for UBEM. Then the boundary of selected sites was defined to ensure that the majority of the region falls within 1 km buffers around CPCB stations (Figure 2). Prior to conducting UBEM, air temperature data from CPCB stations at each location were analyzed with respect to both summer and winter day LSTs. Further, daily and hourly differences in air temperature across different months and seasons were studied. Finally, weather data from two stations, IITB and Sion, integrated with an EPW file from ISHRAE, were utilized to compare cooling energy demand at building and urban scales.
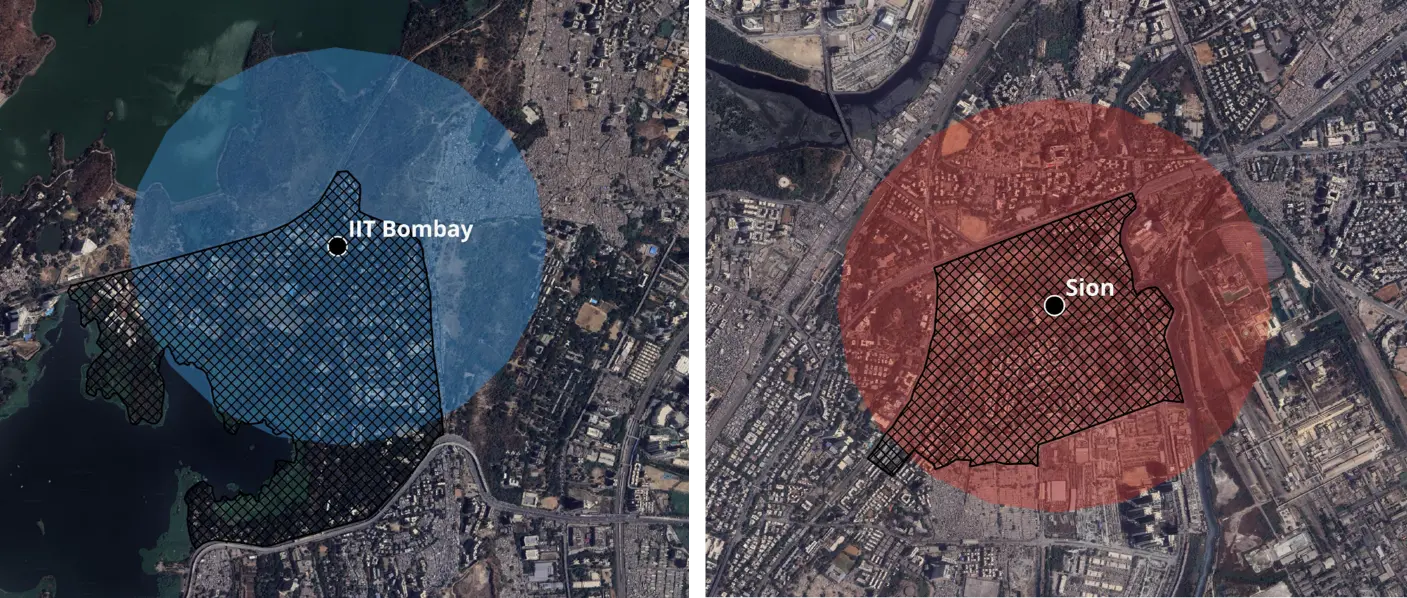
Figure 2. Buffers of 1 km around CPCB sites at IIT Bombay (top) and Sion (bottom). The stations’ buffers cover most part inside the boundaries of two regions (Maps data: © 2025 Google). CPCB: Central Pollution Control Board.
2.3 Urban building energy demand modelling
UBEM requires an extensive input database encompassing multiple buildings, rather than a single building energy modelling whose database pertains to an individual structure. In this study, simulations were organized into four progressive scenarios to systematically assess the influence of temperature, building geometry, urban morphology and functional diversity on cooling energy demand. All UBEM simulations were conducted in City Energy Analyst (CEA), a robust open-source tool. The first scenario examined a single residential building in IITB and Sion, with identical geometry and schedules, providing a controlled baseline to assess the impacts of localized climate on cooling energy demand. Within this scenario, additional simulations were conducted by changing the building heights. The second scenario extended the analysis to the urban scale by replicating residential buildings of uniform height, thereby isolating the effect of density. The third scenario introduced the actual variations in building heights within each location, enabling the model to compute energy demand with realistic shading and morphological effects. The fourth and final scenario represented a comprehensive urban condition by combining actual building heights with diverse functions such as residential, office, hostel, and laboratory spaces, thus integrating distinct schedules and operational patterns. This stepwise approach allowed that each parameter could be examined in isolation before arriving at an integrated UBEM framework.
Beyond weather data, the framework incorporated several key inputs and assumptions. Building geometry and morphology were derived from multiple sources as explained in Section 2.1. Envelope properties such as U-values for walls, roofs, and windows were standardized across both locations, consistent with ISHRAE guidelines for typical urban buildings in India. Internal gains from occupants, equipment, and lighting were included through CEA’s usage-type archetypes. The standardized residential profiles were applied in the first three scenarios, while function-specific schedules (residential, office, laboratory, etc.) incorporated in the fourth. Cooling systems were represented by standard split air-conditioners. Air infiltration rates were modelled according to ISHRAE, considering naturally ventilated residential spaces and mechanically ventilated offices and laboratories. Although several parameters were necessarily standardized, the scenario-based structure provided a clear progression from single-building analyses to realistic urban-scale conditions, with all scenarios modeled using hourly site-specific weather datasets (Figure 3). The methodology thus provides a controlled yet realistic framework, offering a clear basis for comparison across scenarios (Figure 4).
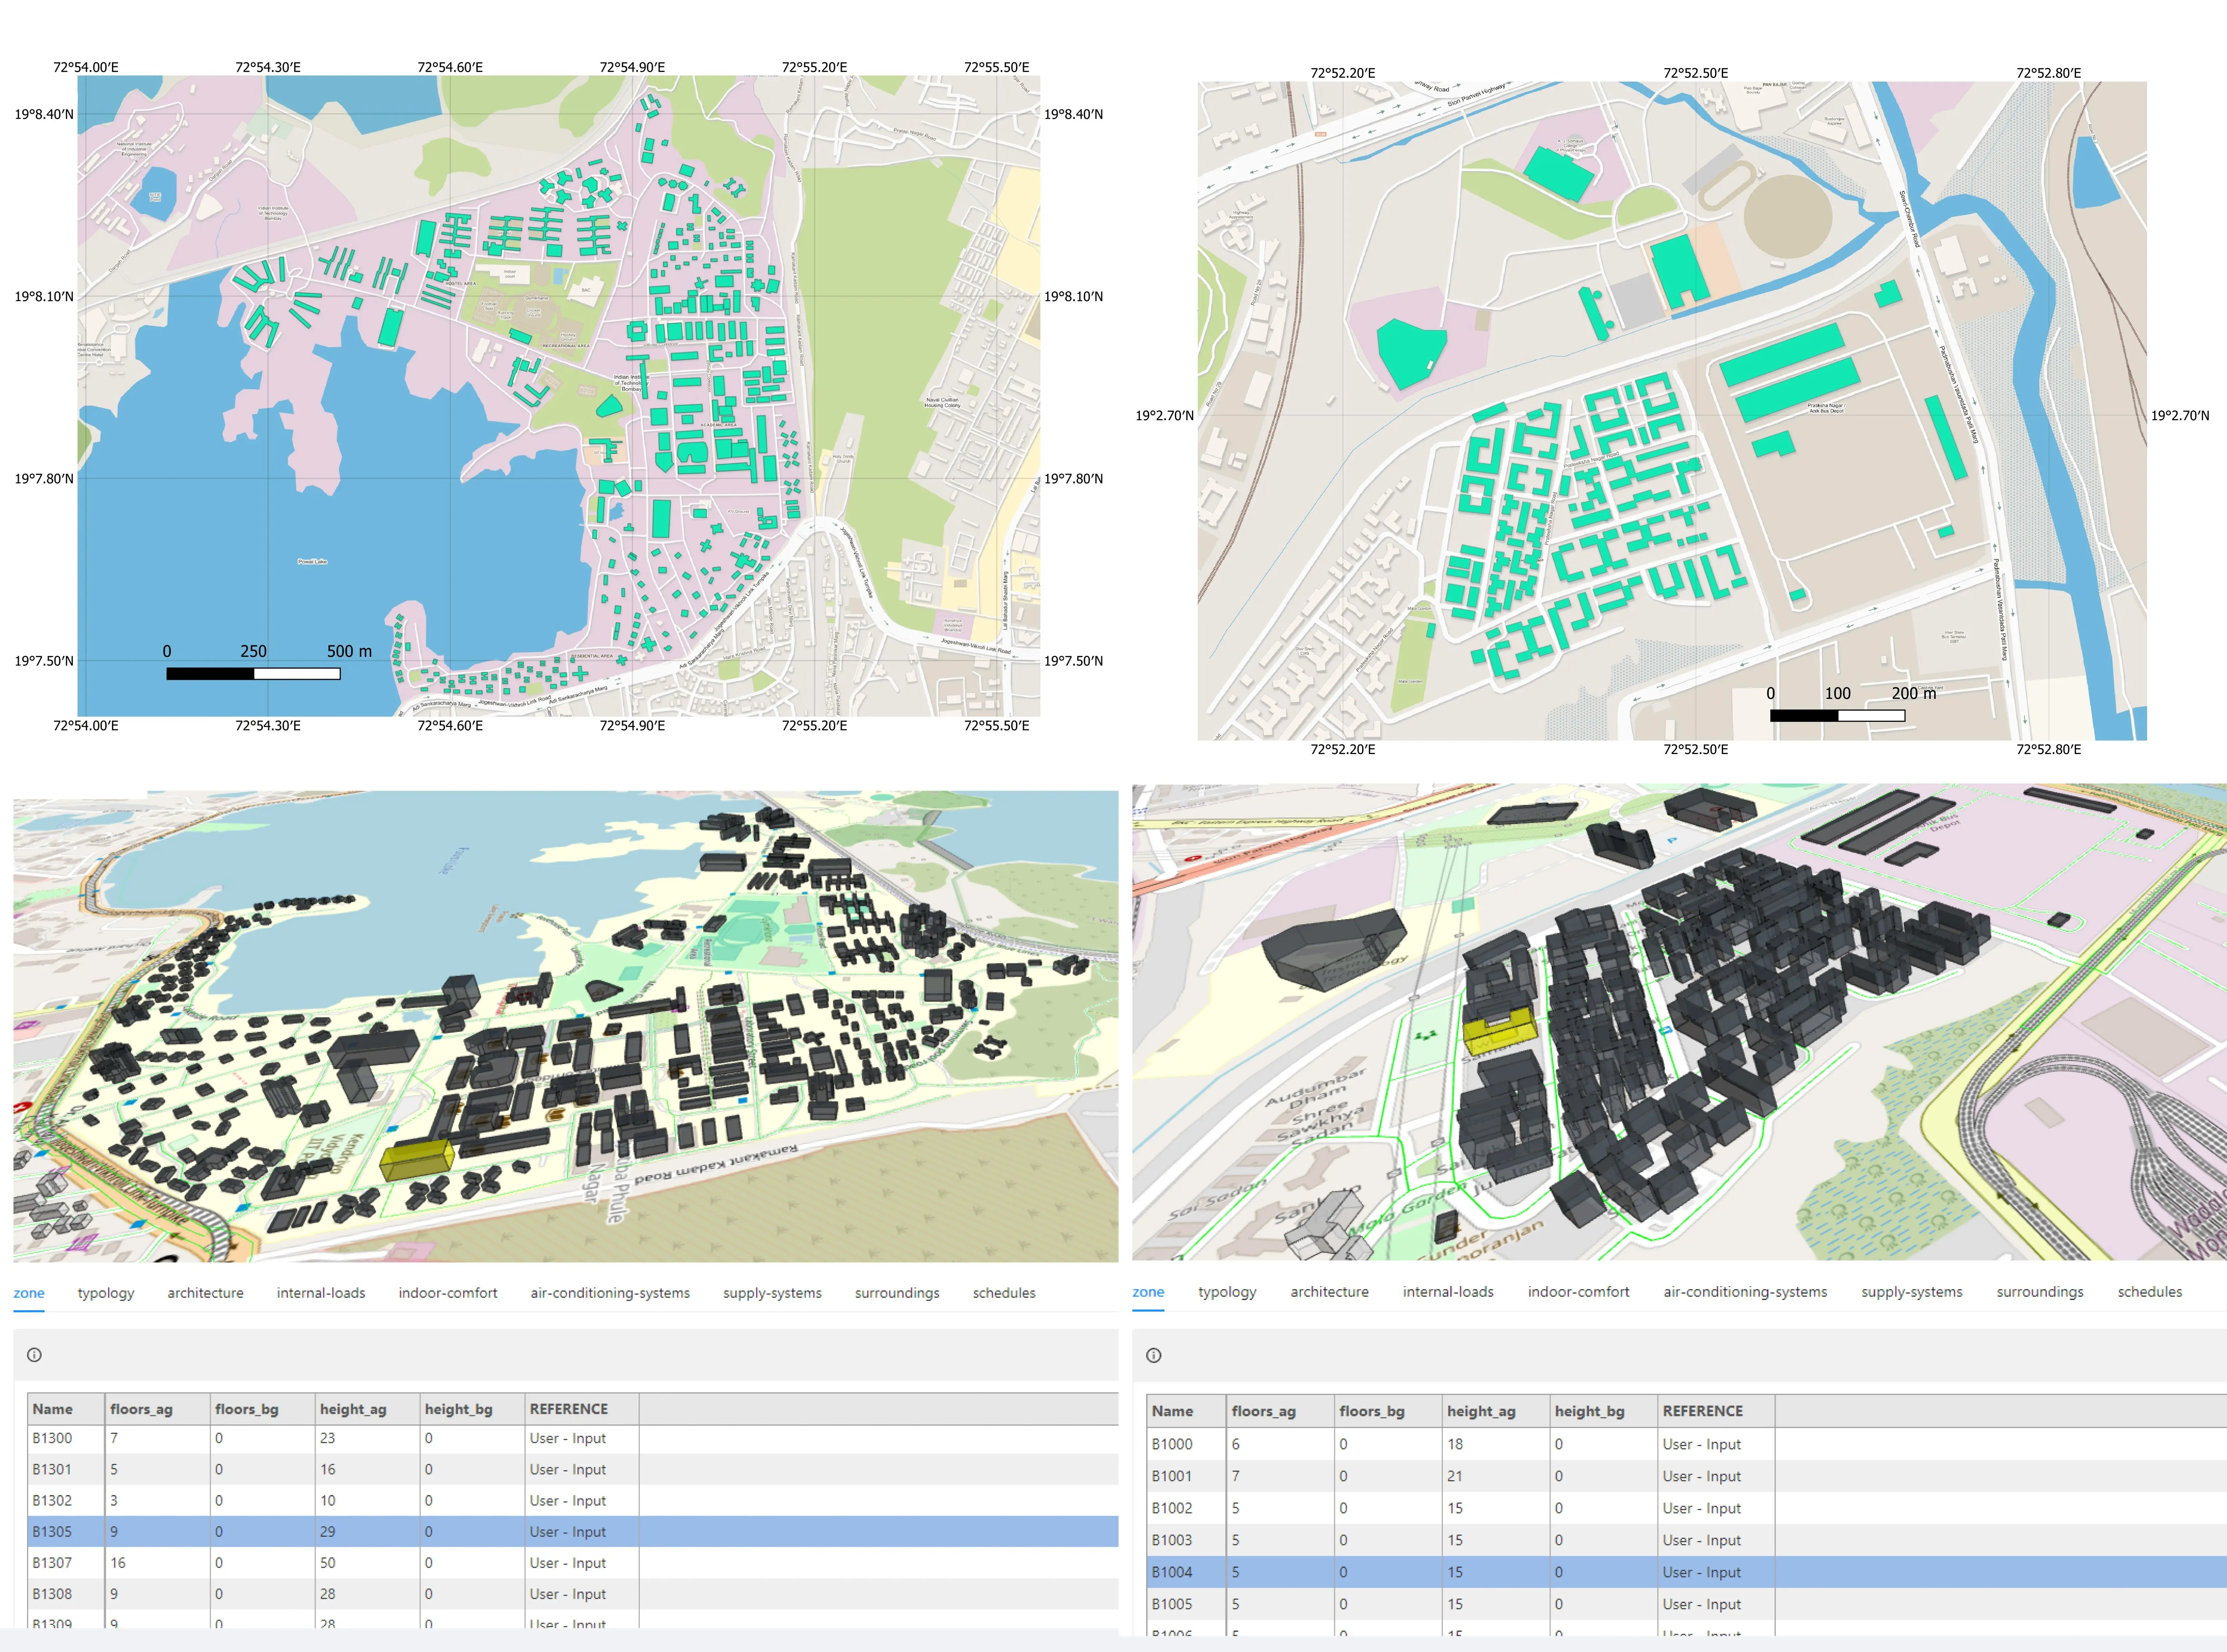
Figure 3. Building footprints and their corresponding 3D models for IIT Bombay (left) and Sion (right), with input databases pertaining to each building generated in CEA. IIT: Indian Institute of Technology; CEA: City Energy Analyst.
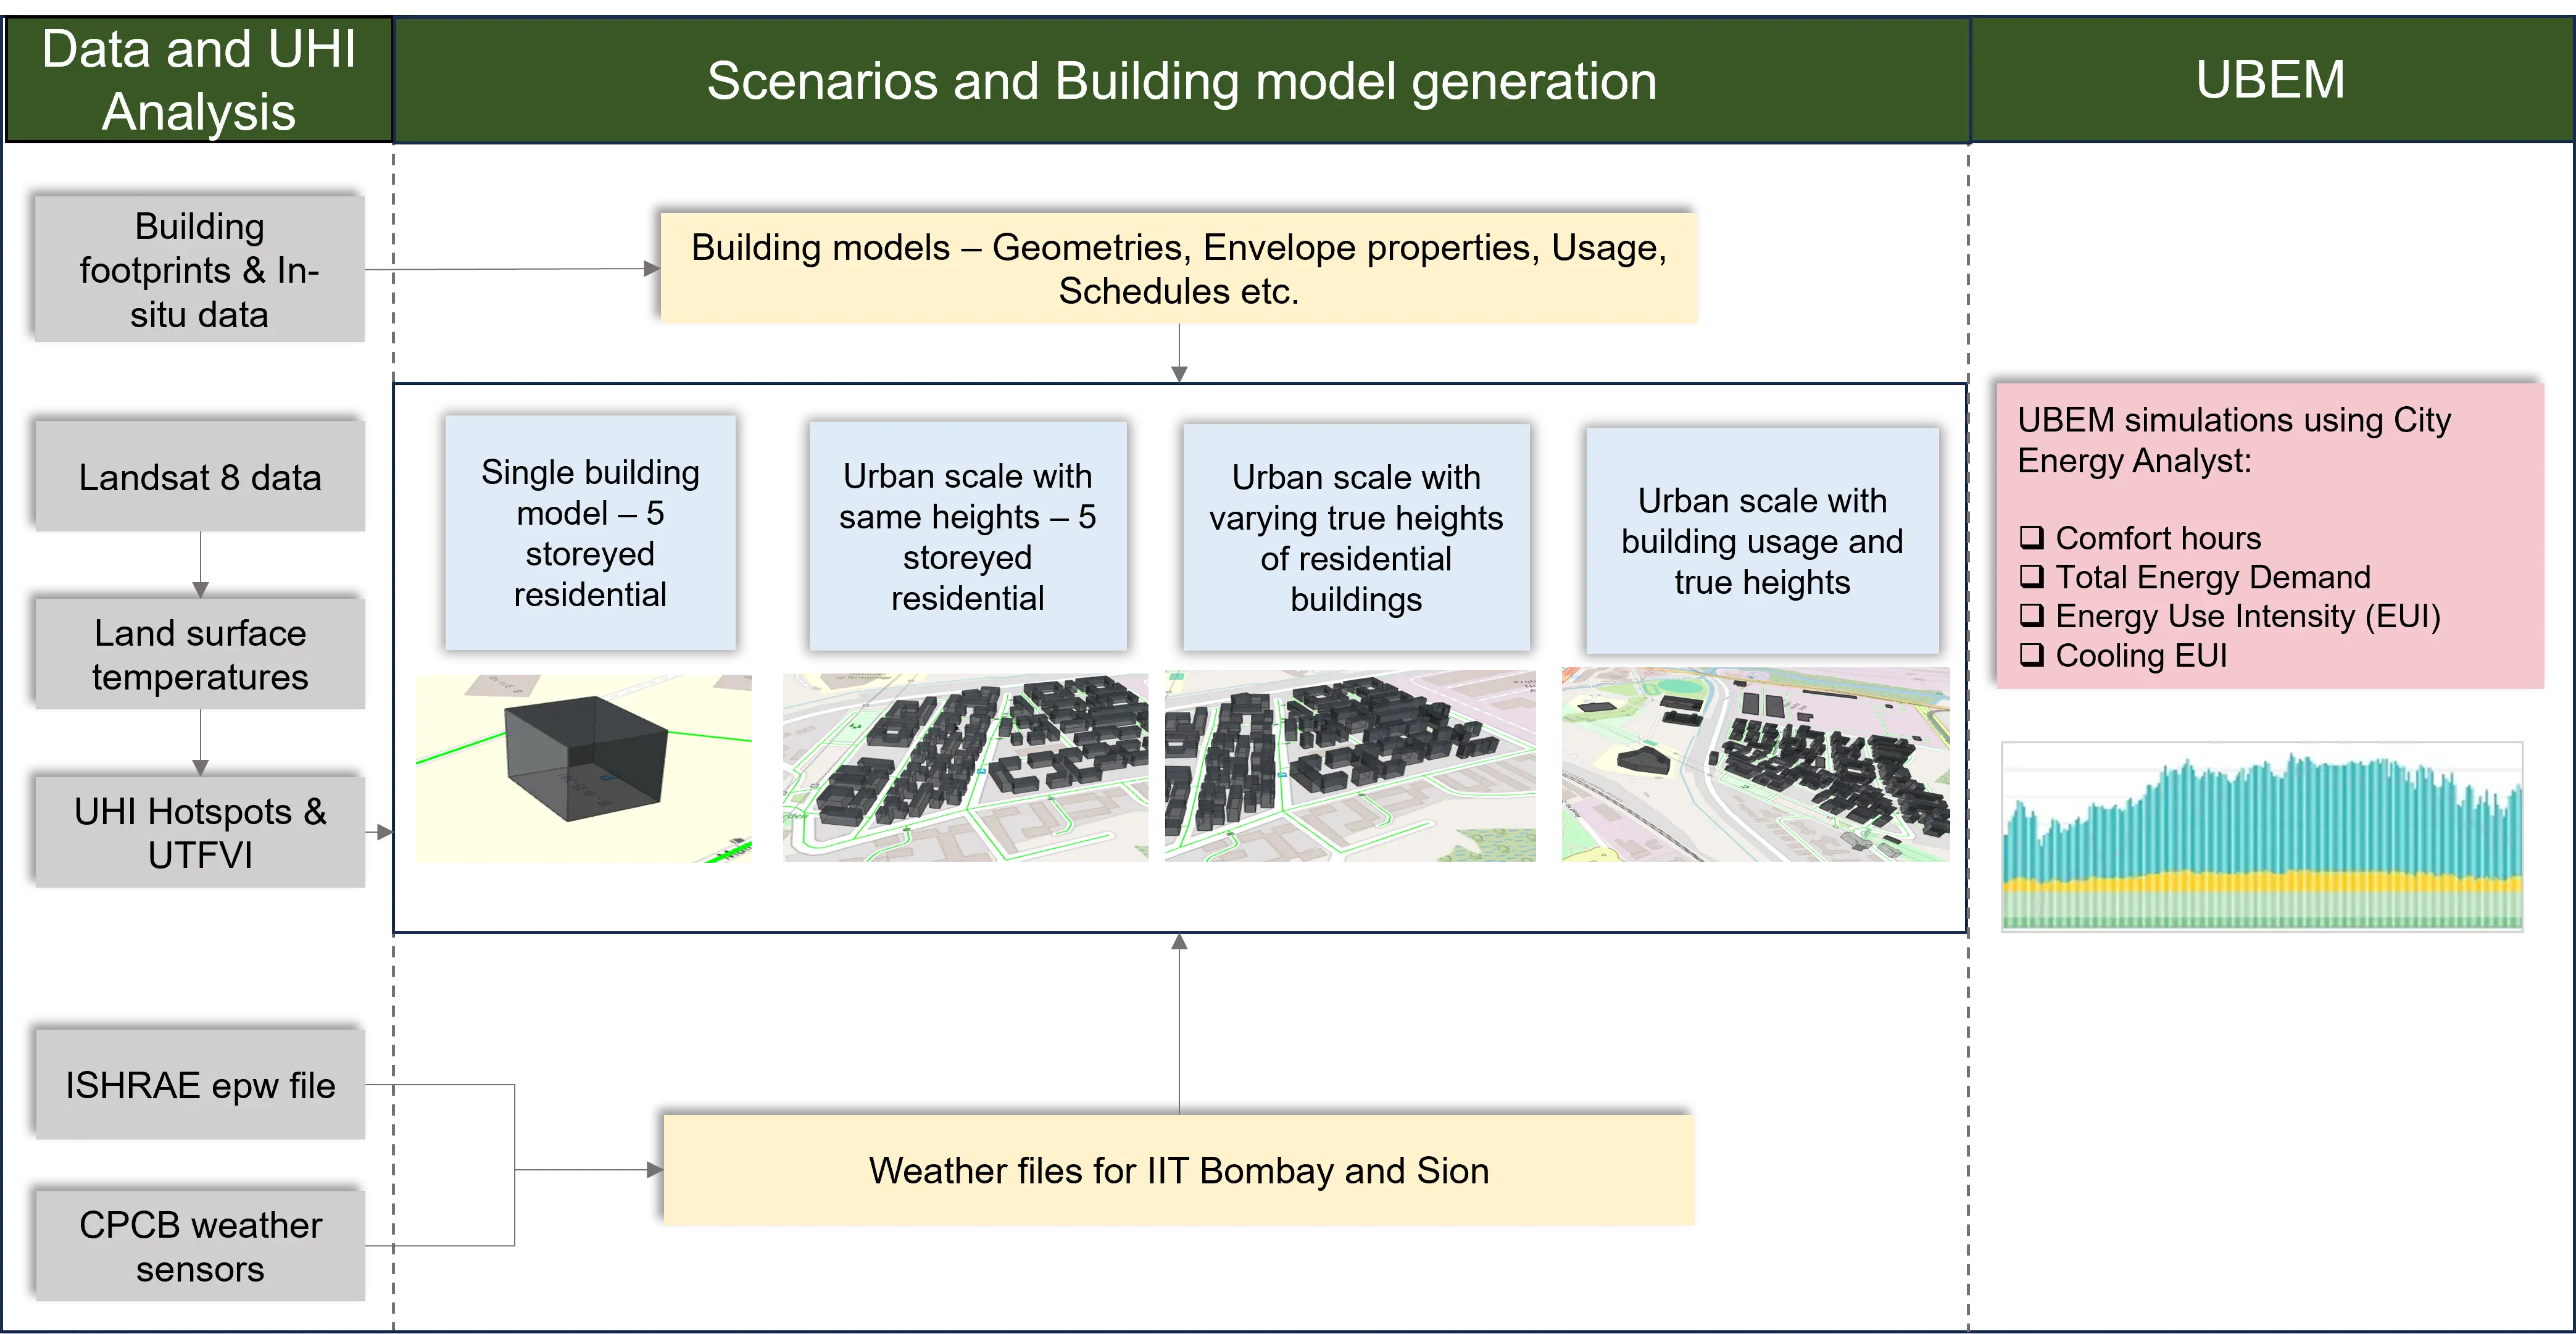
Figure 4. UBEM methodology flowchart for IIT Bombay and Sion: Four scenarios based on scale of model and input data. UBEM: Urban Building Energy Modelling; IIT: Indian Institute of Technology.
3. Results and Discussion
3.1 LST in Mumbai: UHI, UTFVI and air temperature variations
The LST extracted from Landsat data revealed notable variations across the study area during both summer and winter, ranging from 25.69 °C to 42.35 °C and 21.14 °C to 32.63 °C, respectively (Figure 5). The mean LST was 33.75 °C in summer and 25.16 °C in winter. Densely populated built-up areas, bare lands and open spaces consistently recorded the highest LST values, while water bodies and vegetated regions demonstrated the lowest. The pattern was further supported by the inverse relationship between NDVI values and LSTs, where areas with higher vegetation cover exhibit lower temperatures. This finding aligns with previous studies examining the connections between UHIs and vegetative indices[62-64]. Of particular interest, areas characterized by extensive built-up features such as roads and high-density settlements exhibit markedly higher LSTs compared to medium- and low-density settlement ones. Given the 30 m × 30 m resolution of Landsat data, urban pixels are heterogeneous and elevated LSTs are generally associated with a high proportion of impervious surfaces within a pixel[65]. Peripheral areas of Mumbai, featuring creeks and mangroves, showcased lower LST values compared to the central urban core. It is also noteworthy that certain core parts of southern and central Mumbai exhibit lower LST due to substantial vegetation within the built environment, thereby blurring the distinction between urban and rural zones.
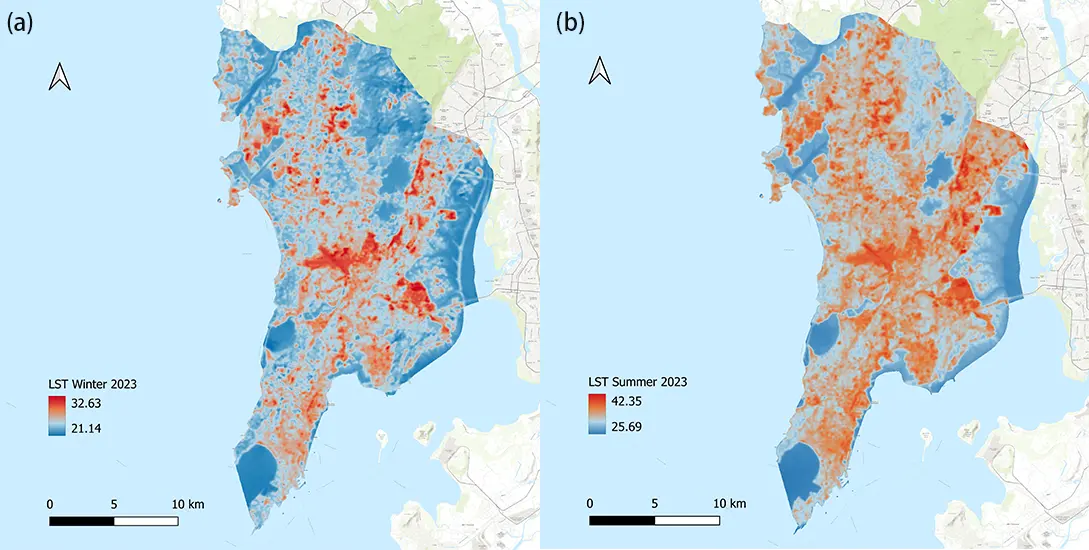
Figure 5. LST of Mumbai in January 2023 (a) and April 2023 (b). The summertime LST values are significantly higher than those of a winter month. LST: land surface temperature.
In this study, the SGNP, a densely vegetated and protected area, was used as the rural reference typically utilized in UHI analyses. The mean LST of SGNP was estimated at 31.5 oC in summer and 23.43 oC in winter. Only a few major lakes and gardens within the city exhibited lower LSTs compared to SGNP, while those with significantly higher LSTs included slums and continuously built-up spaces, particularly near the airport. Although the overall mean LST of the study area is not markedly higher than that of SGNP, several localized zones recorded temperatures more than 10°C above SGNP levels. To identify such UHI hotspots, the LST raster map was reclassified. All pixels with a value greater than μ + 3σ were assigned a value of 1, others assigned a value of 0 (Figure 6). The reclassification results revealed that 15.3% of Mumbai falls within UHI hotspot category.
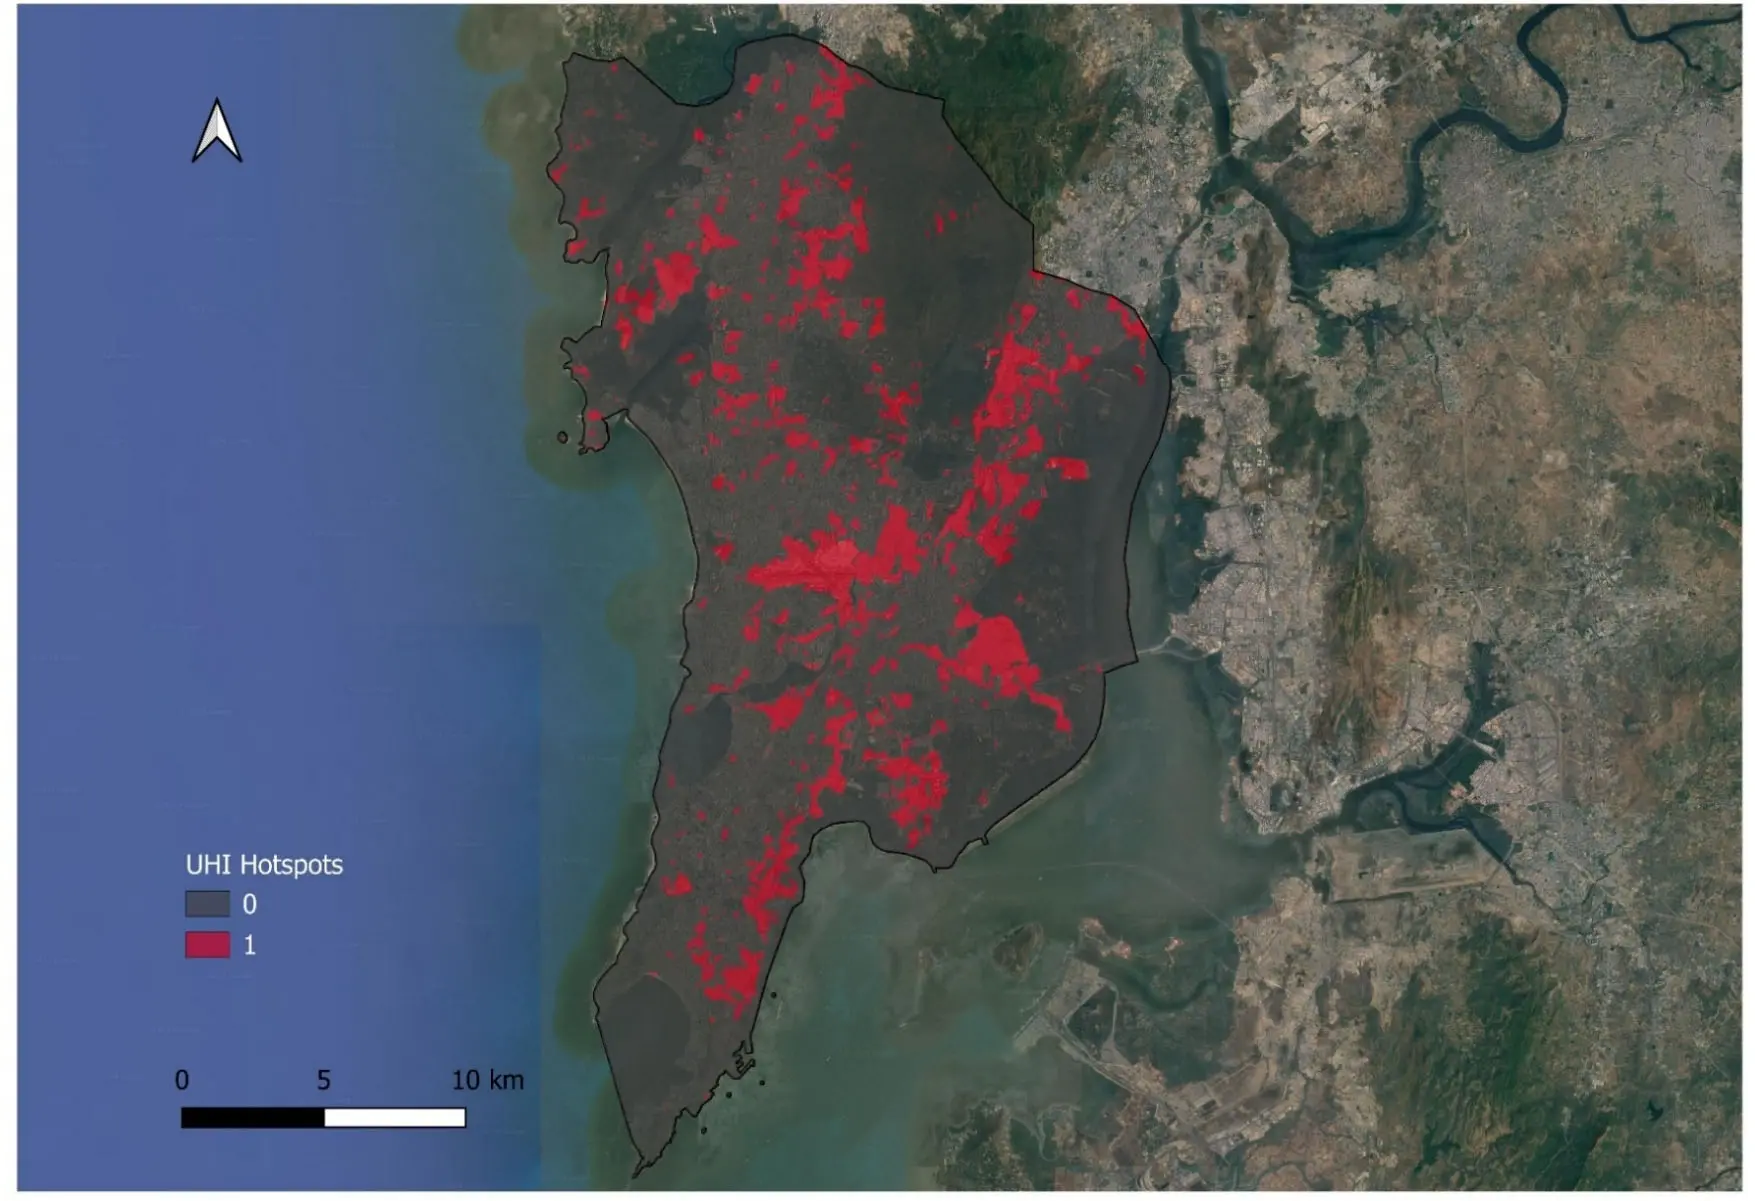
Figure 6. UHI hotspots in Mumbai as determined using SGNP as reference rural/vegetated area with lower LST (Maps data: © 2024 Google). UHI: urban heat islands; SGNP: Sanjay Gandhi National Park; LST: land surface temperature.
UTFVI quantitatively explained the overall urban environment of Mumbai related to thermal comfort and well-being associated with UHI presence. Examination of the UTFVI map reveals two predominant thermal comfort conditions within the city (Figure 7). Coastal regions and areas adjacent to mangroves exhibit favorable conditions owing to their cooling effects. Similar conditions are also observed near major lakes such as Vihar Lake and Powai Lake. Likewise, SGNP and the Aarey forest contributes to enhanced thermal comfort in neighboring areas, and smaller urban green spaces also offer additional localized benefits. For instance, the vicinity of IITB, adjacent to two lakes, falls within the excellent UTFVI class due to the cooling influence of nearby water bodies and abundant on-campus vegetation. In contrast, areas such as Sion and Andheri, near a CPCB site, exhibit the poorest UTFVI, indicating reduced thermal comfort. Buildings in these areas are likely to experience substantially higher cooling energy demands. However, accurate prediction requires high-resolution weather data capturing fine-scale variations across the urban areas[66].
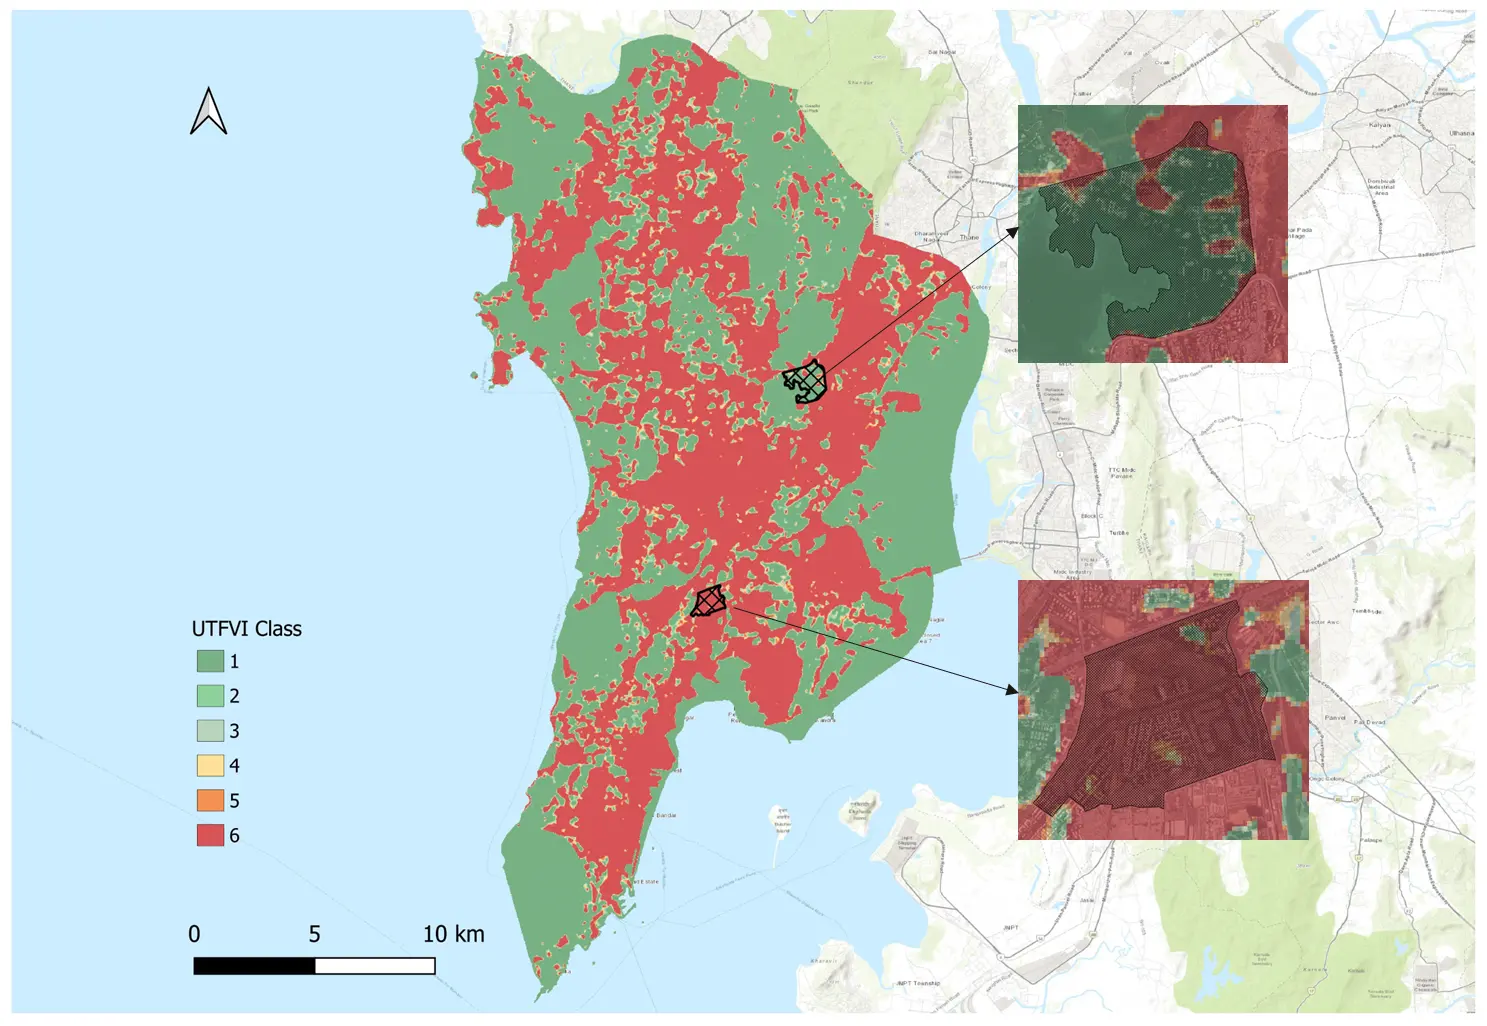
Figure 7. UTFVI map for Mumbai and Mumbai sub-urban representing the 6 classes. Most part of IIT Bombay (top right) falls in class 1 (Excellent), whereas most of the part in Sion (lower right) falls under class 6 (Worst). UTFVI: Urban Thermal Field Variance Index.
The LST variations were able to identify the urban hotspots in Mumbai. Spatial and temporal variations in air temperature data from CPCB monitoring sites, such as IITB, Sion, Kurla, and Terminal-2, further support the UHI effects. For instance, diurnal observations reveal that daytime temperatures at IITB and Terminal-2 are consistently higher than those at Sion, largely due to open spaces. However, nighttime temperatures at IITB drop sharply compared to the other three sites. The comparison of air temperature profiles between IITB and Sion sites underlines that the most pronounced UHI effects occur during the nighttime hours (from 7:00 PM to 6:00 AM). In May, the day-time air temperature at IITB peaks at 36.1 oC while for Sion, Kurla and Terminal-2, the maximum air temperatures are 32.97 oC, 35.24 oC and 35.26 oC, respectively. Additionally, IITB experiences the lowest temperature of 25.2 oC during May, compared to 27.3 °C at Sion. The hourly air temperature difference between the two locations ranges from -3.87 oC to 3.21 oC, indicating potential disparities in space-cooling energy demand across these regions.
The IITB-Sion comparison also indicates that, on average, IITB is over 2.0 °C cooler at night. Relative humidity levels differ between the two sites, with daytime levels at IITB about 1.8% higher than those at Sion, and nighttime levels exceeding Sion by over 7%. The temperature profile also shows that Sion records 22.1% more hours with temperatures above 25 °C compared to IITB. A seasonal analysis further displays that the UHI effect is the strongest during the post-monsoon season, when IITB is more than 3.5 °C cooler than Sion. This underlines distinct climatic conditions that may drive disparities in cooling energy demand. Significant daily variations also suggest substantial fluctuations in cooling energy demand throughout the year. These results indicate that Sion experiences a stronger UHI effect, particularly at night, while IITB’s cooler but moister microclimate may increase latent cooling loads. Together, these factors produce a dual effect that affects building cooling energy demand.
3.2 Scenario I: Energy demand at single building scale
In this scenario, end-use energy demand was simulated for a single residential building with the same number of floors in IITB and Sion, using identical building envelopes, occupancy schedules and appliance usage patterns. Temperature differences between the two locations resulted in discernible changes in energy demand, particularly in cooling Energy Use Intensity (EUI). To minimize the effects of building height on EUI, the number of floors was uniformly varied from 1 to 10 stories, reflecting the typical building height range at the two locations. The rationale behind considering a single residential building of similar construction type is the fact that the inter-building effect remains absent, ensuring that cooling energy demand is primarily influenced by temperature variations.
Simulation results revealed that the cooling EUI decreased with an increasing number of floors at each location, aligning with previous studies emphasizing the effects of building size on cooling demand[67,68]. However, the rate of this decrease diminished as the number of floors increased (Figure 8). When comparing Sion’s buildings to those at IITB, the EUI was found to be higher at Sion across all floor counts, with an increase ranging from 6.94% to 7.86% and an average increase of 7.22% (Table 2). The increase is consistent with prior studies reporting energy demand increases over 4%, and in some cases, exceeding 30%[34,69,70]. The primary reason for the higher cooling EUI at Sion is the elevated nighttime temperatures relative to those at IITB throughout the year.
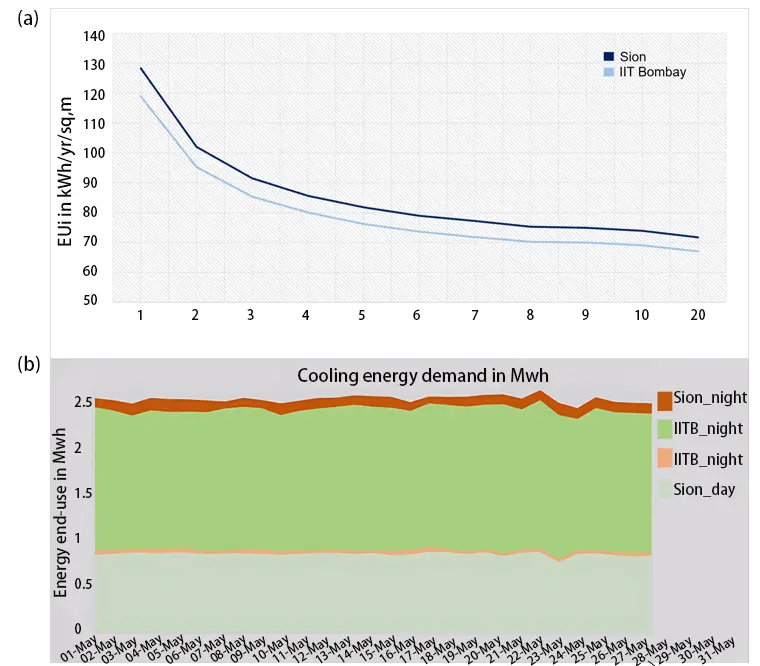
Figure 8. (a) Rate of decrease in mean cooling EUI with increasing height of building for IIT Bombay and Sion; Diurnal variation in cooling end-use energy demand for IIT Bombay and Sion in the month of May (bottom). EUI: Energy Use Intensity; IIT: Indian Institute of Technology.
Table 2. Building energy demand intensity for the two locations.
| Cooling EUI in kWh/yr/m2 | |||
| Floors | IIT Bombay | Sion | % rise in EUI (Sion vs IIT Bombay) |
| 1 | 118.9 | 128.25 | 7.86% |
| 2 | 95.24 | 102.03 | 7.13% |
| 3 | 85.36 | 91.47 | 7.16% |
| 4 | 80.05 | 85.67 | 7.02% |
| 5 | 76.19 | 81.76 | 7.31% |
| 6 | 73.62 | 78.96 | 7.25% |
| 7 | 71.85 | 77.23 | 7.49% |
| 8 | 70.21 | 75.3 | 7.25% |
| 9 | 70.01 | 74.94 | 7.04% |
| 10 | 69.04 | 73.88 | 7.01% |
| 20 | 67.1 | 71.76 | 6.94% |
EUI: Energy Use Intensity; IIT: Indian Institute of Technology.
Under simulated conditions representative of summer month (May), the building at Sion exhibited a notable increase of over 9.12% in cooling EUI compared to that at IITB. Conversely, during daytime periods, the IITB buildings displayed a 4.75% higher cooling EUI relative to Sion. This discrepancy can be attributed to higher daytime air temperatures of IITB. However, during nighttime, Sion’s elevated LST contributes to slower heat dissipation, resulting in higher nocturnal air temperatures and increased energy demand compared to IITB. These simulation outcomes outline the discernible influence of nighttime UHI phenomena on building-level cooling energy demand.
3.3 Scenario II: Residential buildings with identical heights and their inter-building effects on cooling energy demand
The evaluation of urban-scale energy demand at IITB and Sion was conducted in multiple stages. Initially, buildings in both regions were assumed to possess identical heights and to be of residential functions. Subsequently, the analysis incorporated actual building heights and functional types. In this scenario, 47 residential buildings at IITB and 56 at Sion were selected for comparison. All buildings were assigned a uniform height of 5 stories with consistent envelope characteristics and occupancy schedules. This standardization ensured the consistency by controlling building-specific factors such as appliance usage patterns, construction materials and window-to-wall ratios, allowing for a more focused assessment of the impact of local climate and urban morphology on energy use. The results indicated that cooling EUIs for IITB buildings ranged from 64.88 kWh/yr/m2 to 80.6 kWh/yr/m2, with a mean of 75.73 kWh/yr/m2. However, cooling EUIs at Sion varied from 67.8 kWh/yr/m2 to 94.38 kWh/yr/m2, with a mean of 78.39 kWh/yr/m2 (Figure 9). This diversity in cooling EUIs can be attributed to variations in surroundings, orientation and geometry[48,71,72].
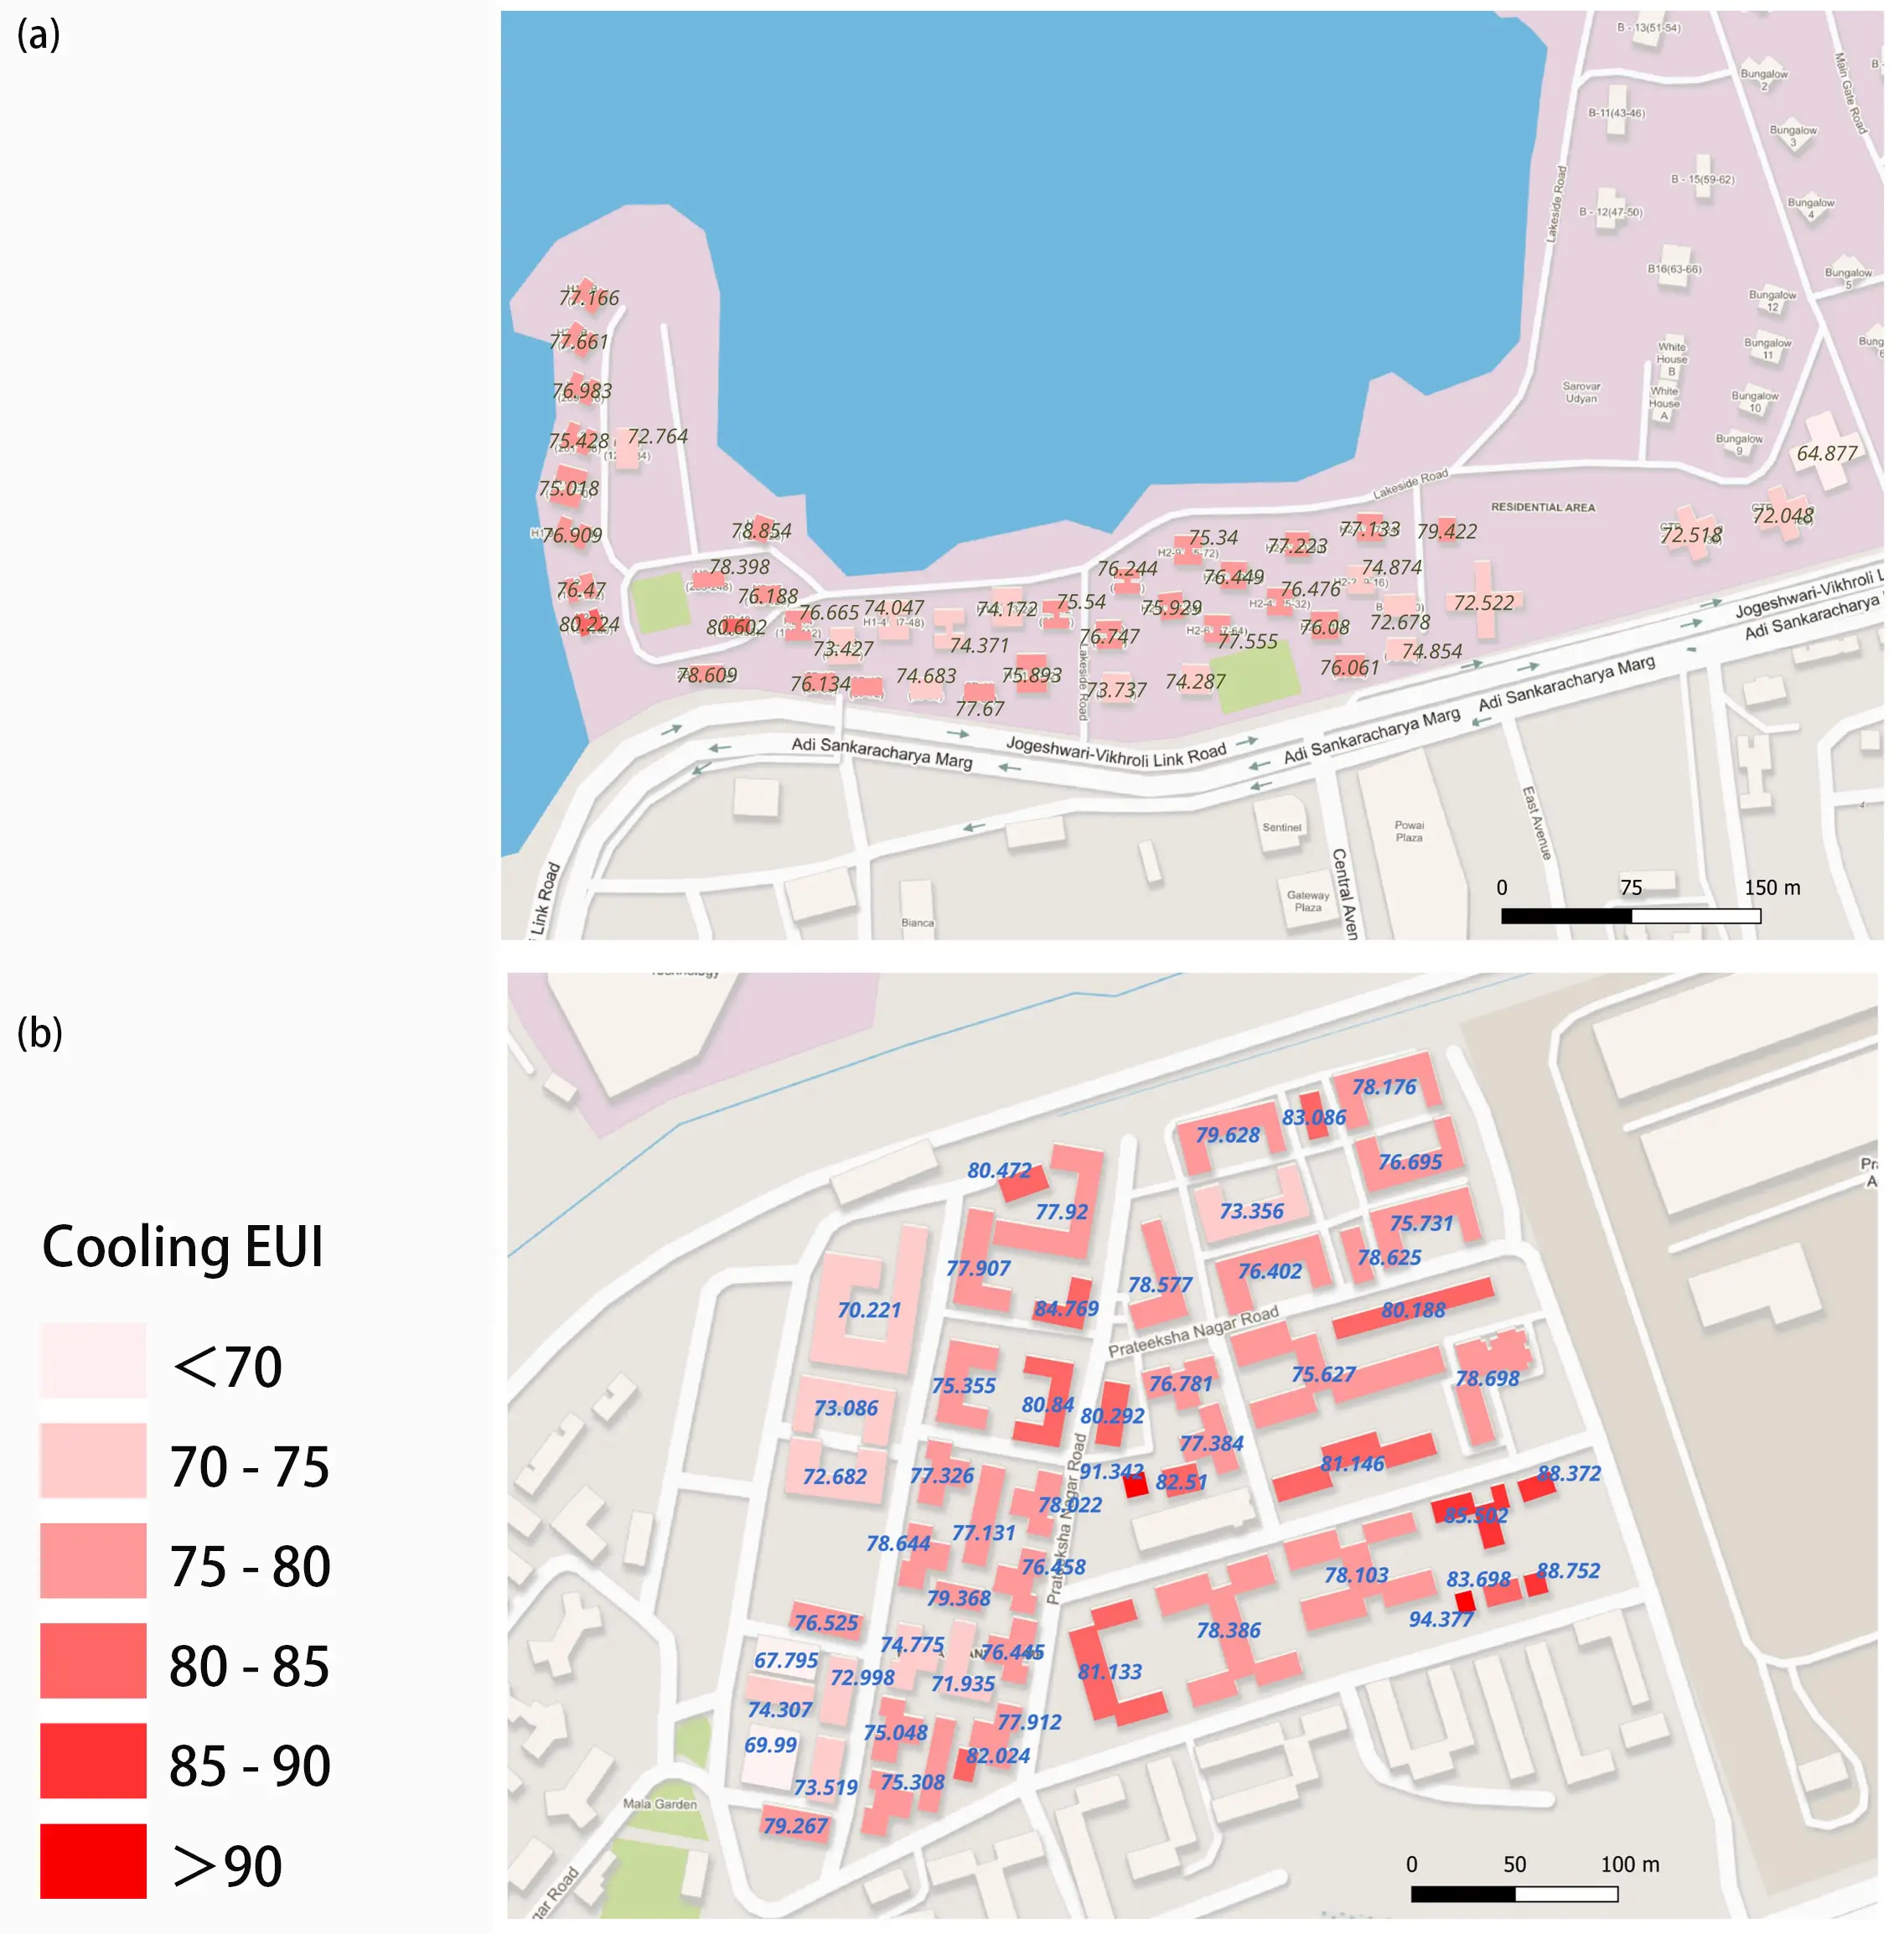
Figure 9. Cooling EUIs for residential buildings with specified height of 5 floors: (a) IIT Bombay; (b) Sion. The geometry of focal building and its distances from surrounding buildings significantly impact the thermal comfort and cooling EUI. EUI: Energy Use Intensity; IIT: Indian Institute of Technology.
Remarkably, in this scenario, the difference in mean cooling EUIs between the two locations was only 3.5%, representing a reduction by half relative to those at the individual building level. When compared with the single-building scenario with 5 floors, IITB buildings exhibited a reduction of only around 1% in cooling EUI, possibly due to substantial inter-building distances. In contrast, buildings at Sion, more closely spaced, showed a 4.4% decline in cooling EUI. This underscores the influence of inter-building shading effects during the daytime in densely built environments, where the close proximity of structures can reduce solar heat gains, and consequently lower energy consumption for cooling as supported by recent studies[73,74].
To assess the influence of surrounding buildings on EUI, pairwise edge-to-edge inter-building distances were calculated for all buildings, alongside two key morphological indicators: building density (Number of buildings per unit area) and building coverage ratio (Percentage of total building footprint area). Additionally, a Kolmogorov-Smirnov test was performed to statistically confirm that the two datasets represent distinct spatial configurations. Figure 10 illustrates the contrasting distributions of inter-building distances between the two locations, while Table 3 summarizes the key morphological indicators underlying their differing cooling energy demands.
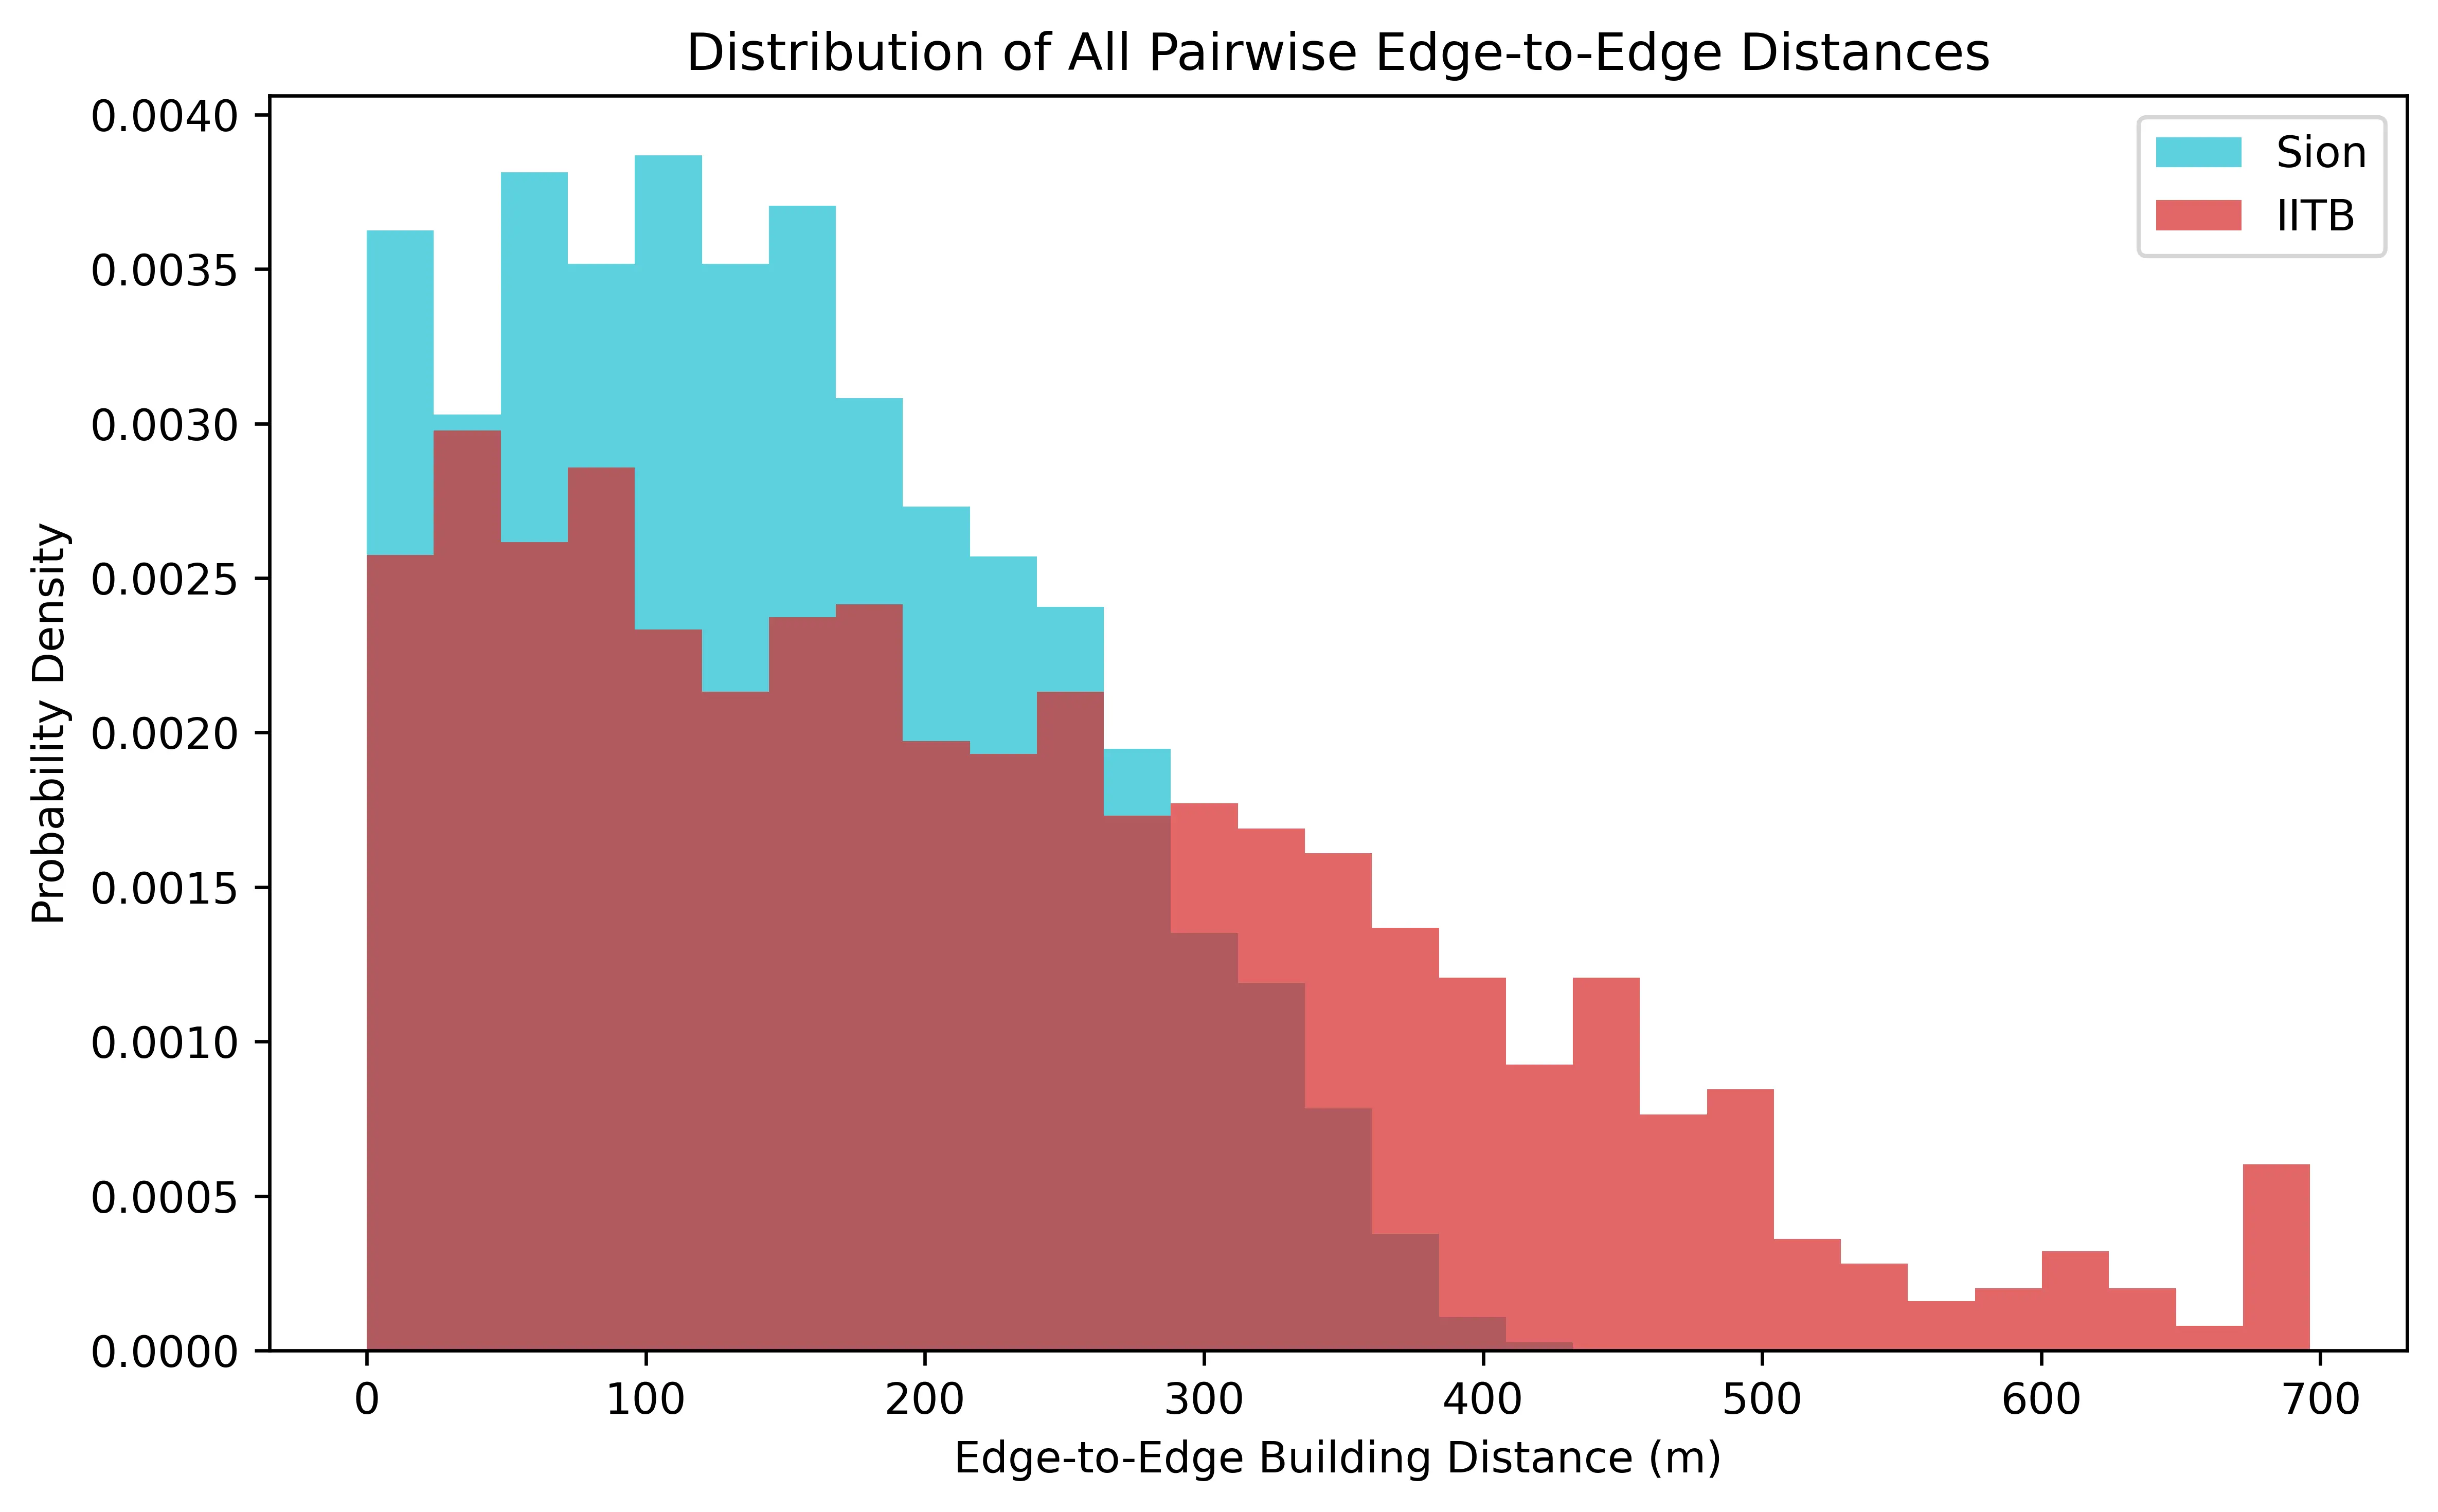
Figure 10. Probability density distribution of all pairwise edge-to-edge distances for Sion (blue) and IITB (red); the left-shifted curve for Sion confirms its tighter fabric. IITB: Indian Institute of Technology Bombay.
Table 3. Key morphological indicators for IITB and Sion.
| Metric | IITB | Sion |
| Buildings (N) | 56 | 46 |
| Convex-hull area (m²) | 1,34,428 | 1,04,874 |
| Building density (buildings km-2) | 342.19 | 533.98 |
| Building coverage ratio (%) | 8.62% | 33.59% |
| Mean inter-building distance (m) | 226.26 | 150.13 |
| Median inter-building distance (m) | 199.99 | 140.40 |
| Inter-quartile range (m) | 91.17-334.47 | 71.85-219.28 |
| KS Statistic/p-value | 0.237/5.467 x 10-31 | |
IITB: Indian Institute of Technology Bombay; KS: Kolmogorov-Smirnov.
The higher building density and fourfold increase in ground coverage at Sion suggest that more buildings are concentrated within a similar plan area. This compactness narrows urban canyons and enhances the potential for mutual shading, two conditions critically linked to reduced cooling loads. Studies from Central Europe and China investigating the influence of urban form on building energy demand report that the shading from surrounding buildings can reduce space cooling requirements by up to 50% compared to isolated buildings[75,76].
Building coverage also stands for a critical factor. Sion’s BCR of 30% sits within a range where shading may partially offset heat accumulation, whereas IITB’s 9% BCR leaves most ground and façade area exposed to direct radiation. Several recent studies support this trade-off: when surrounding blocks are considered around a reference building, cooling energy tends to decrease despite a slight penalty in winter heating[77-79]. The similarity between this controlled scenario and the real‐world contrast examined here strengthens the inference that neighbour shadows, rather than air temperature alone, dominate summertime performance.
The pairwise inter-building distance statistics provide deeper insights into the spatial configuration. Sion exhibits a lower mean pairwise distance compared to IITB, primarily due to its elongated slab-building typology. The upper quartile at Sion is 115 m less than at IITB, indicating far fewer extensive separations. Recent studies emphasize that long tails of wide gaps can diminish shading effects, even when mean values appear favourable. Buildings at Sion facilitates more consistent shading across most façades. The Kolmogorov-Smirnov test indicates that the two spacing datasets follow distinct distributions, reinforcing results from inter-building effect studies that neglecting such spatial differences can lead to significant misestimations of energy demand[80,81].
Taken together, recent studies and our results converge on a similar pattern. To be specific, higher building density increases mutual shading; greater coverage reduces sky exposure; a left-shifted spacing distribution ensures that most building walls benefits from these shading. This pattern highlights that elevated LST or air temperature due to an UHI effect does not necessarily translate into higher cooling energy demand. It also suggests that adjusting variables such as density, coverage, and spacing, offers urban planners considerable leverage to reduce cooling energy use, particularly in fast-growing cities where passive strategies must precede costly retrofits.
It is important to note, however, that the inter-building effect is significant only during the daytime and have negligible influence on nighttime energy demand, when the UHI effect is more pronounced[34,82]. Nighttime cooling demand remains largely driven by elevated temperatures in UHI-affected areas. Overall, while inter-building shading reduces cooling energy demand to some extent, elevated temperatures in UHI-affected areas remain the primary driver of increased cooling demand in this scenario.
3.4 Scenario III: Residential buildings with actual heights – Influence of building height variations on cooling energy demand
In this scenario, the actual heights and number of floors of residential buildings at IITB and Sion were incorporated. The selected residential regions are identical to those in scenario I, comprising the same set of buildings. In the IITB region, building heights range from 2 to 4 floors, with a notable exception of a 20-storey structure. Conversely, buildings at Sion are relatively taller, spanning from 5 to 8 floors. Variables such as occupancy, operational schedules, and construction materials were kept consistent across both locations, based on ground-truth for residential buildings. The estimated cooling EUIs for IITB buildings ranged from 76.99 kWh/yr/m2 to 99.77 kWh/yr/m2 with a mean of 92.56 kWh/yr/m2. Nevertheless, the cooling EUIs at Sion range from 67.45 kWh/yr/m2 to 98.18 kWh/yr/m2 with a mean of 77.8 kWh/yr/m2 (Figure 11).
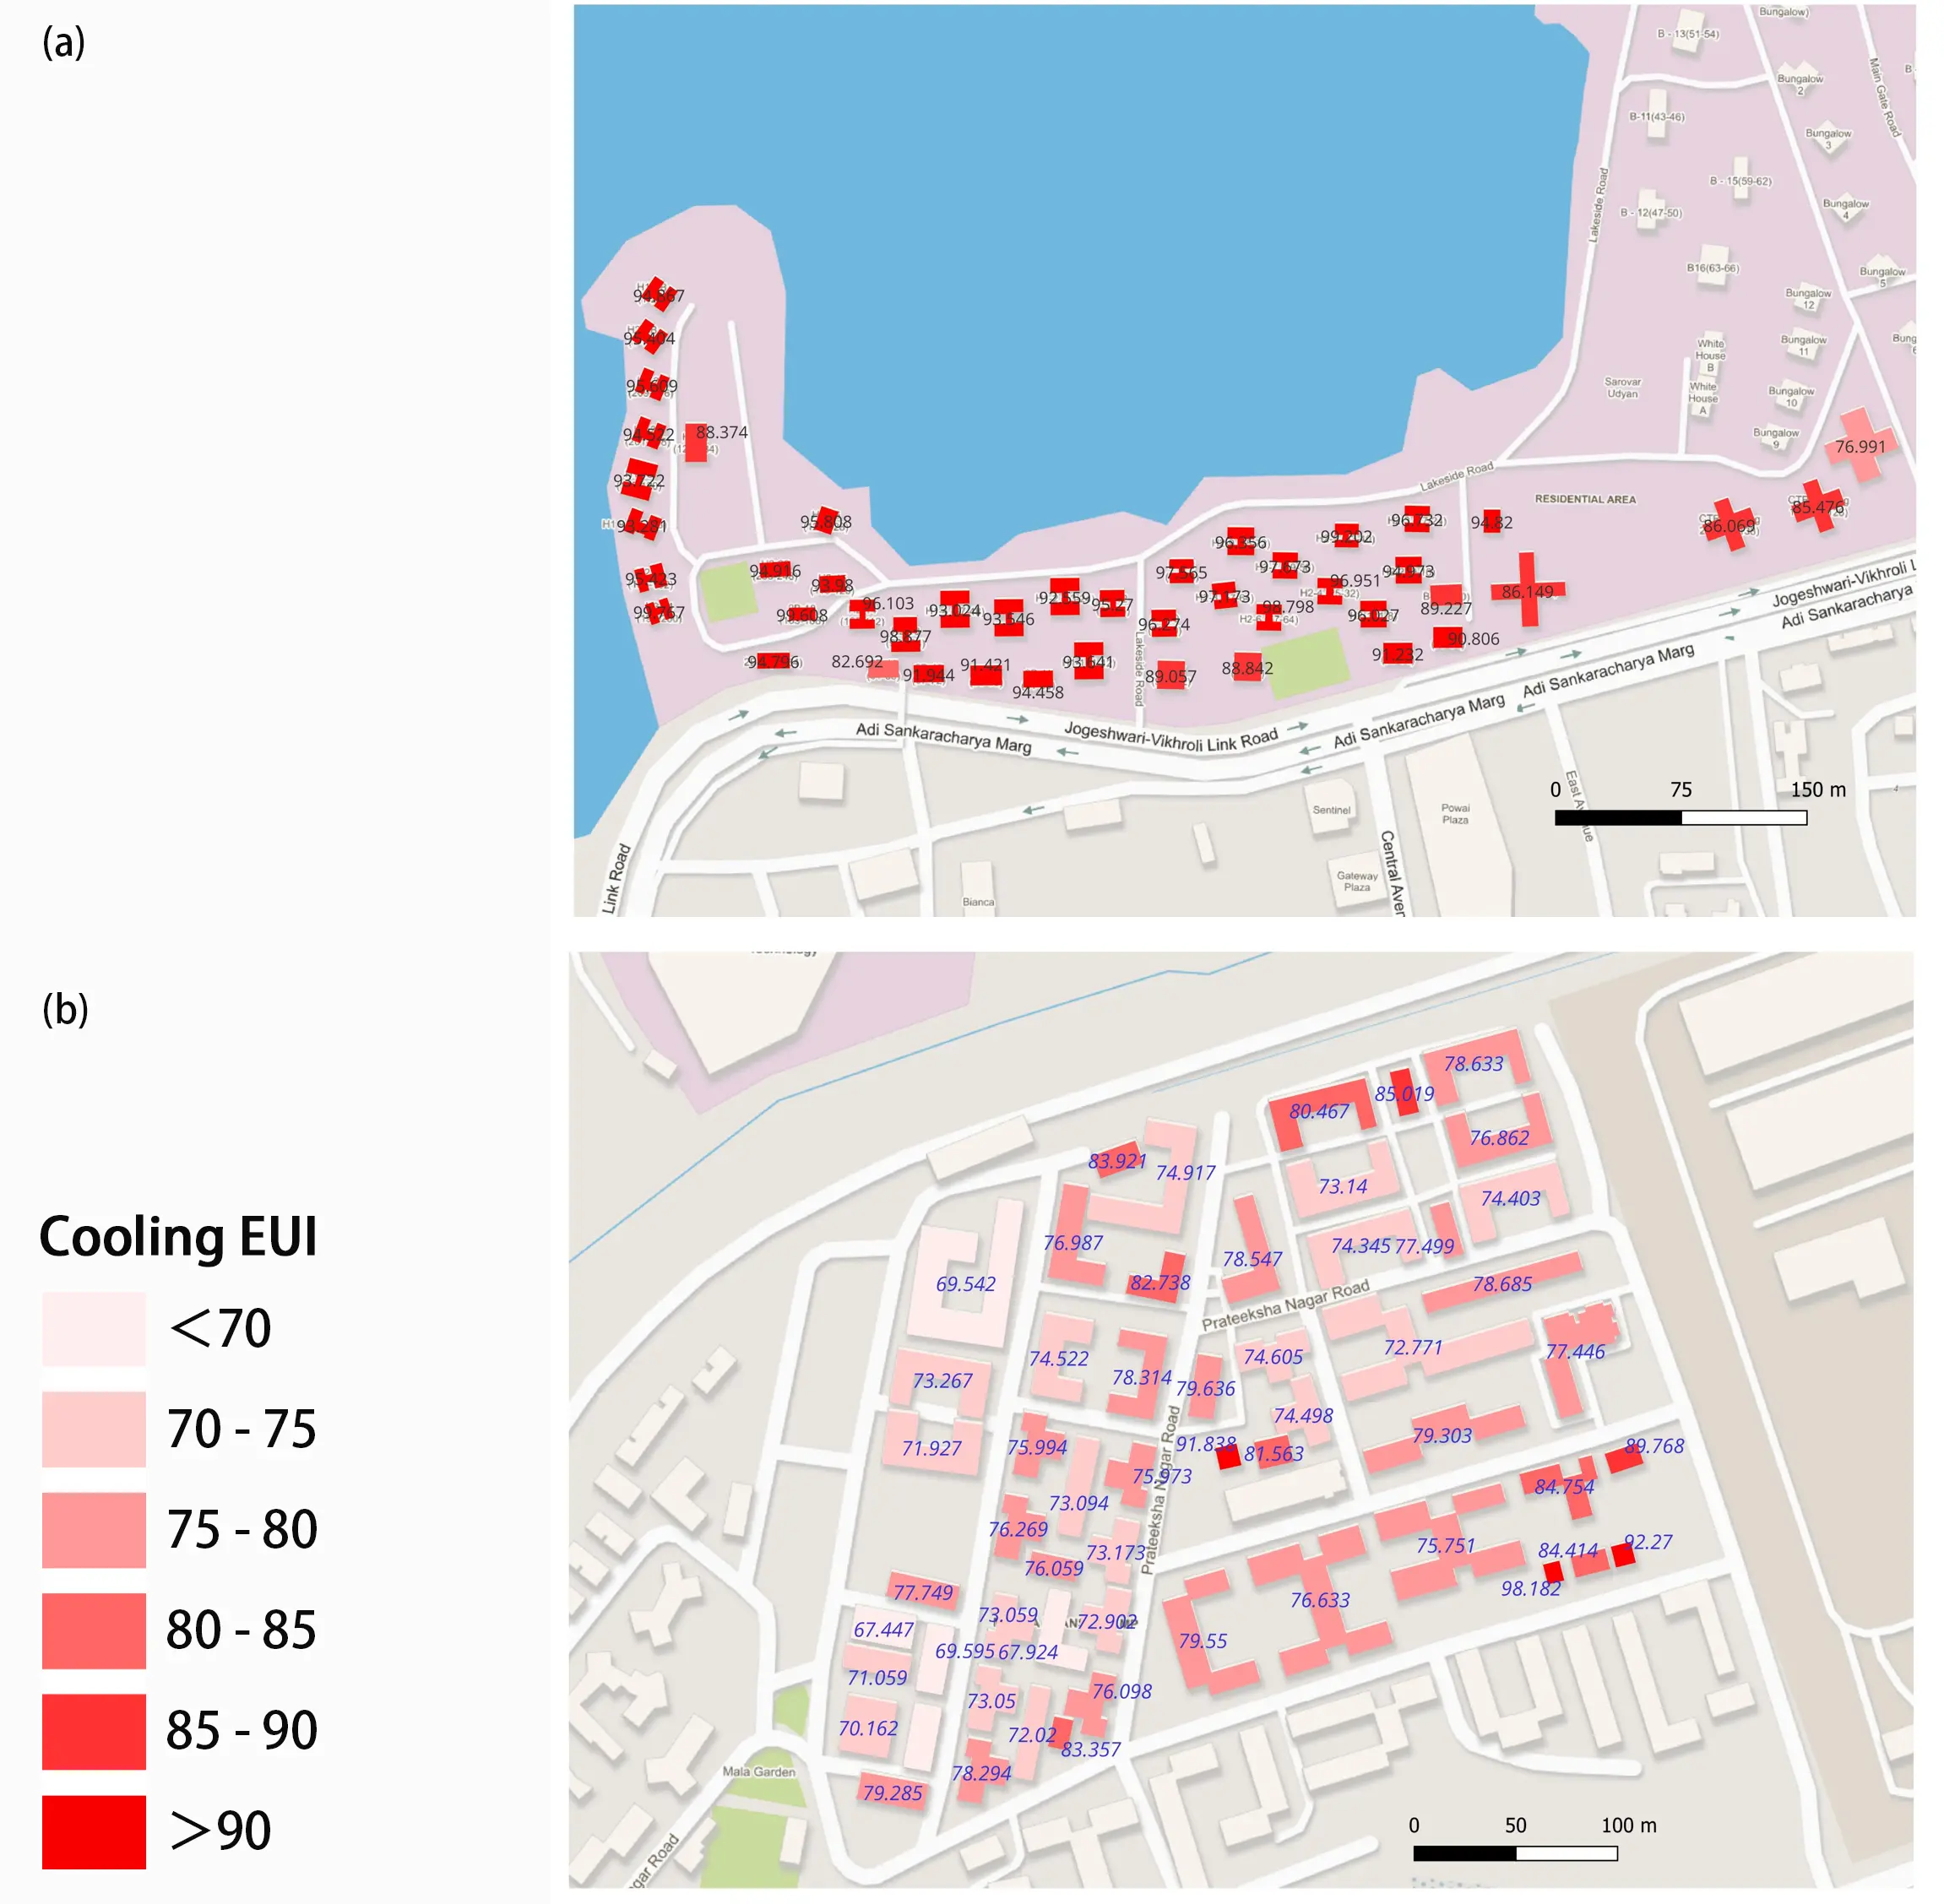
Figure 11. Spatial variation in cooling EUI with actual building height and floor parameters:(a) IIT Bombay; (b) Sion. The heights of the surrounding buildings have significant influence on cooling EUI at both locations. EUI: Energy Use Intensity; IIT: Indian Institute of Technology.
This scenario illustrates the combined effects of varying building heights, inter-building effects and temperature fluctuations at the two locations on cooling EUIs. Notably, the relatively lower building heights at IITB resulted in a substantial 22% increase in cooling EUIs, compared to scenario III with identical heights. Since over 80% of the residential buildings at IITB are only 2 or 3 floors tall, this trend significantly impacts the overall mean cooling EUI. In contrast, cooling EUIs at Sion remained comparatively stable, as building heights in this area showed minimal variation from previous scenarios. Similar profound impacts of building geometry on energy demand, particularly in the context of UHIs have been well documented in prior studies[35,67,71,83].
A comparison of cooling EUIs between the two locations revealed a noteworthy disparity: the mean cooling EUI for IITB buildings was 18.9% higher than that of Sion. This finding contrasts with the common assumption that buildings in urban regions with higher UHI intensity or UTFVI generally exhibit greater energy demand[36,82,84]. This highlights two key points: first, that the buildings’ physical characteristics have a more dominant impact on cooling energy demand than meteorological factors; and second, that the shading effects from surrounding buildings impact on energy use more strongly than the UHI effect itself.
When scrutinizing the diurnal variations, it becomes evident that Sion’s nighttime cooling EUI consistently exceeds that of IITB throughout the year, highlighting the impact of elevated temperatures due to UHI on nighttime energy demand. This scenario suggests that while LST and UTFVI are reliable indicators of localized thermal conditions, cooling energy demand is ultimately shaped by a more intricate relationship of factors. Although UHI corresponds to higher temperatures, its direct translation into increased energy consumption is moderated by the built environment. The urban morphological parameters not only regulate solar heat gains but also influence the spatial distribution of LST. These findings emphasize the importance of integrating high-resolution urban form data with thermal indices to more accurately capture the dynamics of energy demand. By integrating 3D building morphology indicators with urban energy predictions at the finest temporal scales under varying climate conditions, the findings can provide valuable policy insights, and reveal substantial potential for energy savings[84,85].
3.5 Scenario IV: UBEM for all types of buildings in IIT Bombay and Sion, integrating the effects of building typology
The campus of IITB features diverse buildings, including residential, university, laboratory facilities and so forth. The selected area at Sion hosts mostly residential buildings, with a limited number of other functions such as hospitals and universities (Figure 12). In this scenario, schedules and appliance patterns were adjusted according to building functions, while the construction type remained consistent across the two locations, as confirmed by ground-truth observations. Therefore, the total annual energy demand of buildings at both locations is predominantly determined by building typology, geometry, occupancy schedule and local climate (Figure 13). The Kernel density estimate plot of total and cooling energy demands indicates a greater proportion of residential buildings with lower energy demands compared to those with higher demands at both locations (Figure 14). The academic zone at IITB, including laboratories, lecture halls and offices, exhibits the highest annual energy demand, followed by large, high-occupancy student hostels. Conversely, single-family residences and small multi-residential buildings demonstrate low energy demand. This trend is common across nearly all typologies because the number of occupants is a key determinant of a building’s overall energy demand[86-88]. Similarly, the energy demand proportion in academic areas differs significantly from that of residential buildings. Specifically, the use of computer systems and machinery accounts for the highest energy demand in academic areas, followed by space cooling and lighting. In residential areas, however, the dominant energy demand stems from space cooling and lighting, driven by Mumbai’s year-round warm and humid climate.
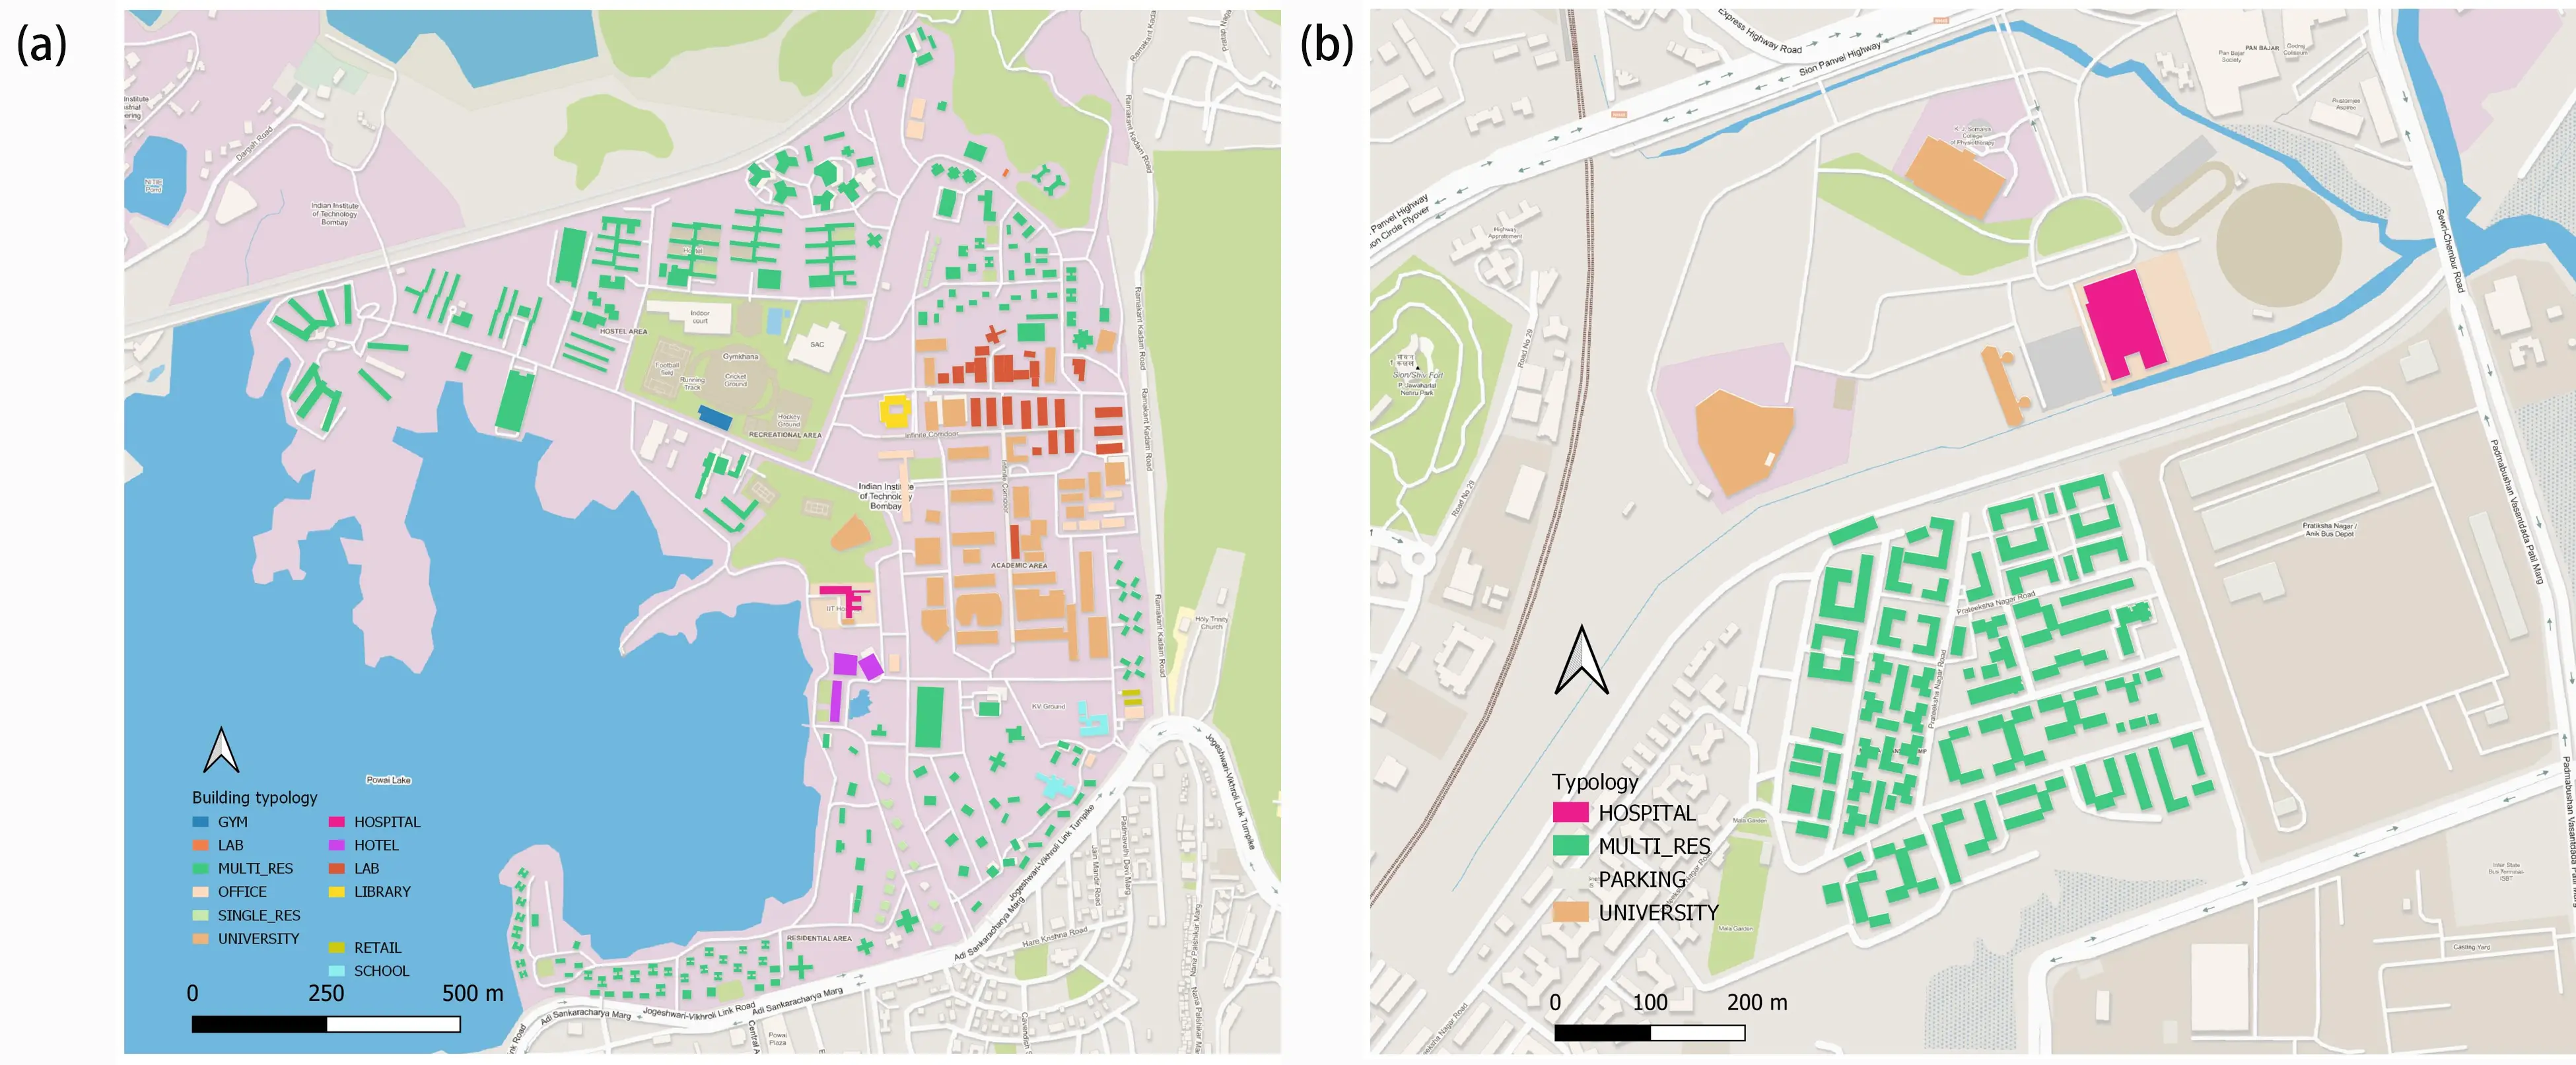
Figure 12. Building typologies: (a) IIT Bombay; (b) Sion. IIT Bombay campus hosts a mix of residential and academic buildings while the Sion region majorly has residential buildings. IIT: Indian Institute of Technology.
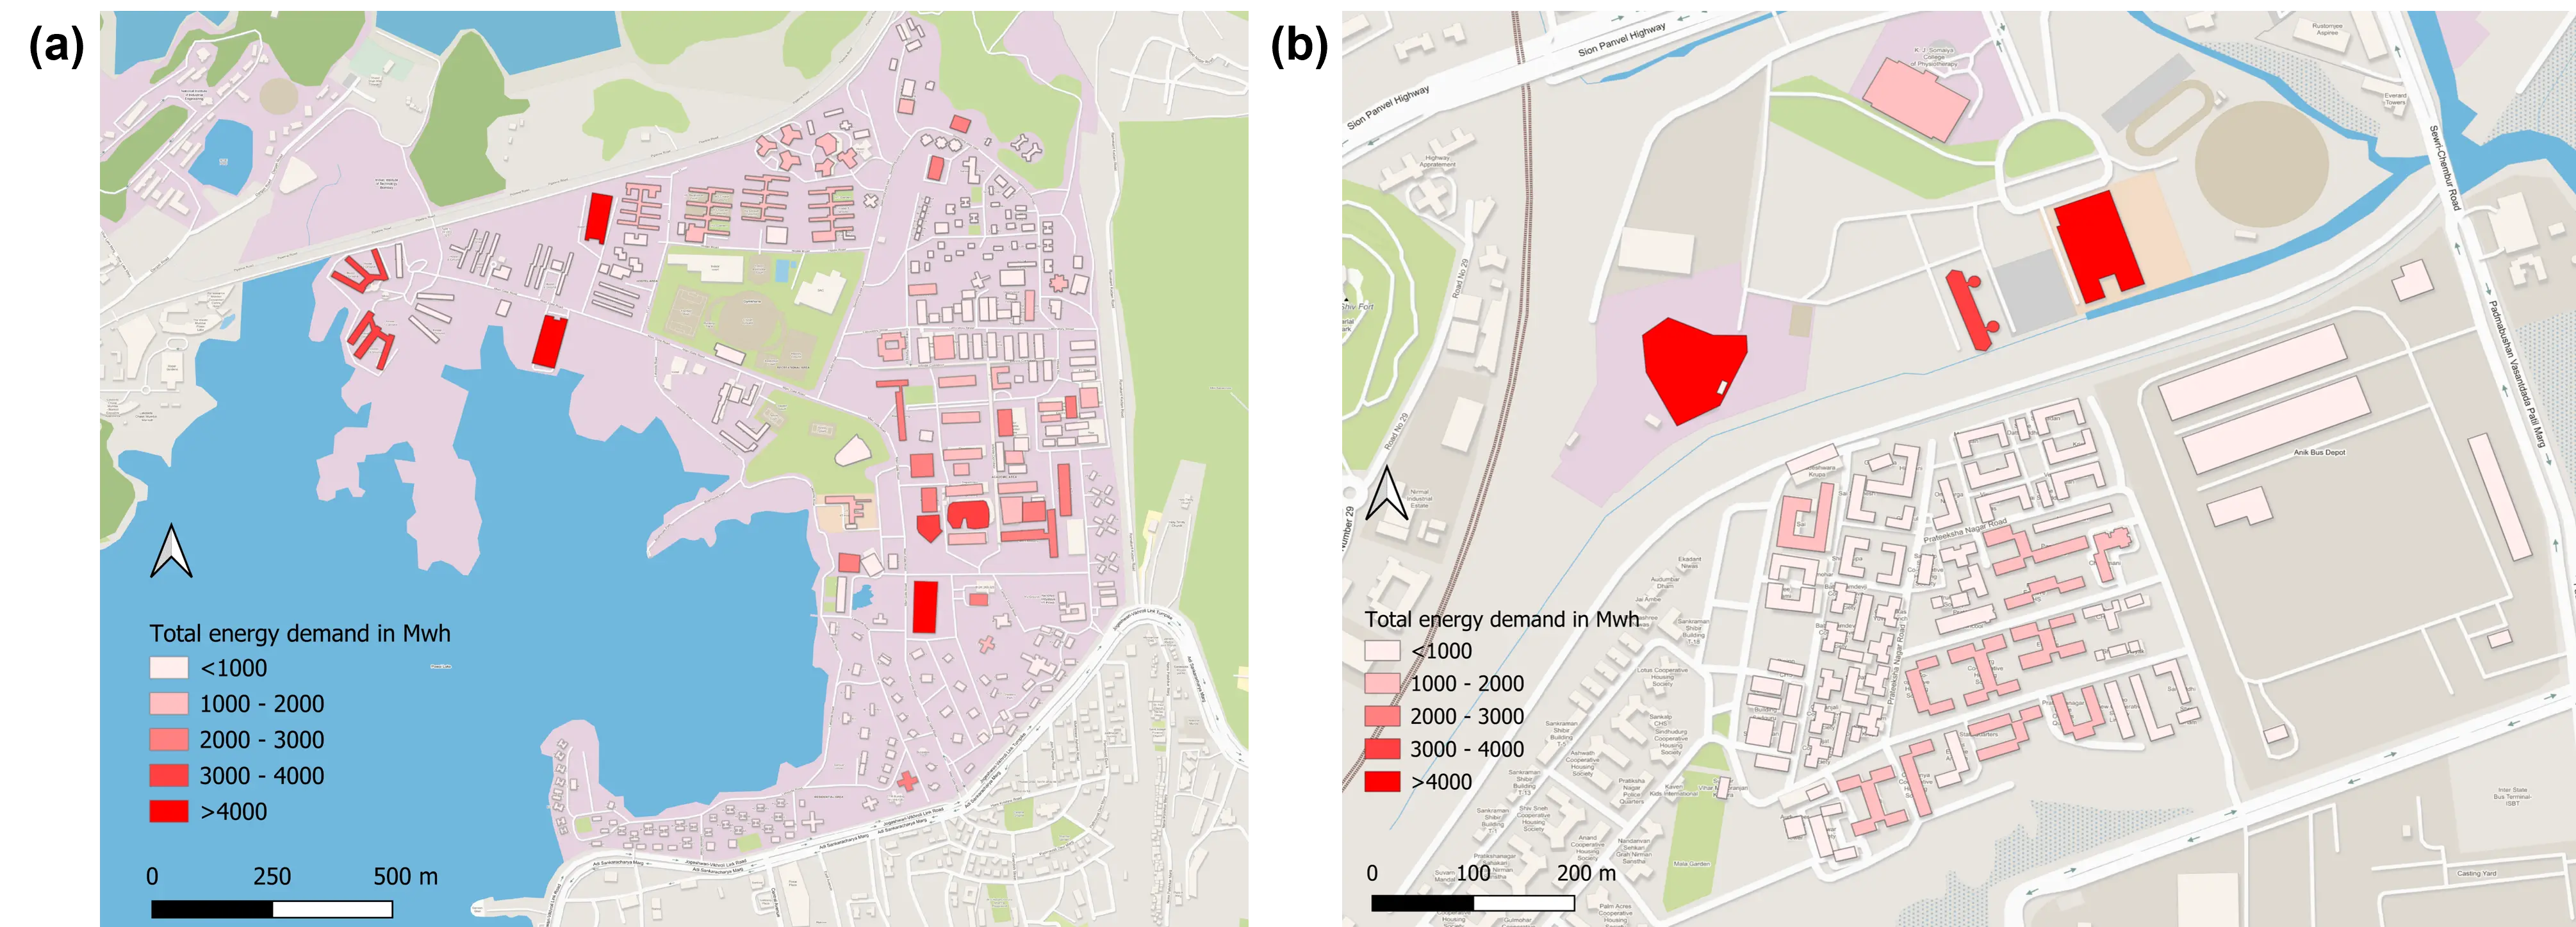
Figure 13. Total energy demand for IIT Bombay (Top) and Sion (Bottom). The total energy demand is highly influenced by building geometry, typology and schedule. IIT: Indian Institute of Technology.
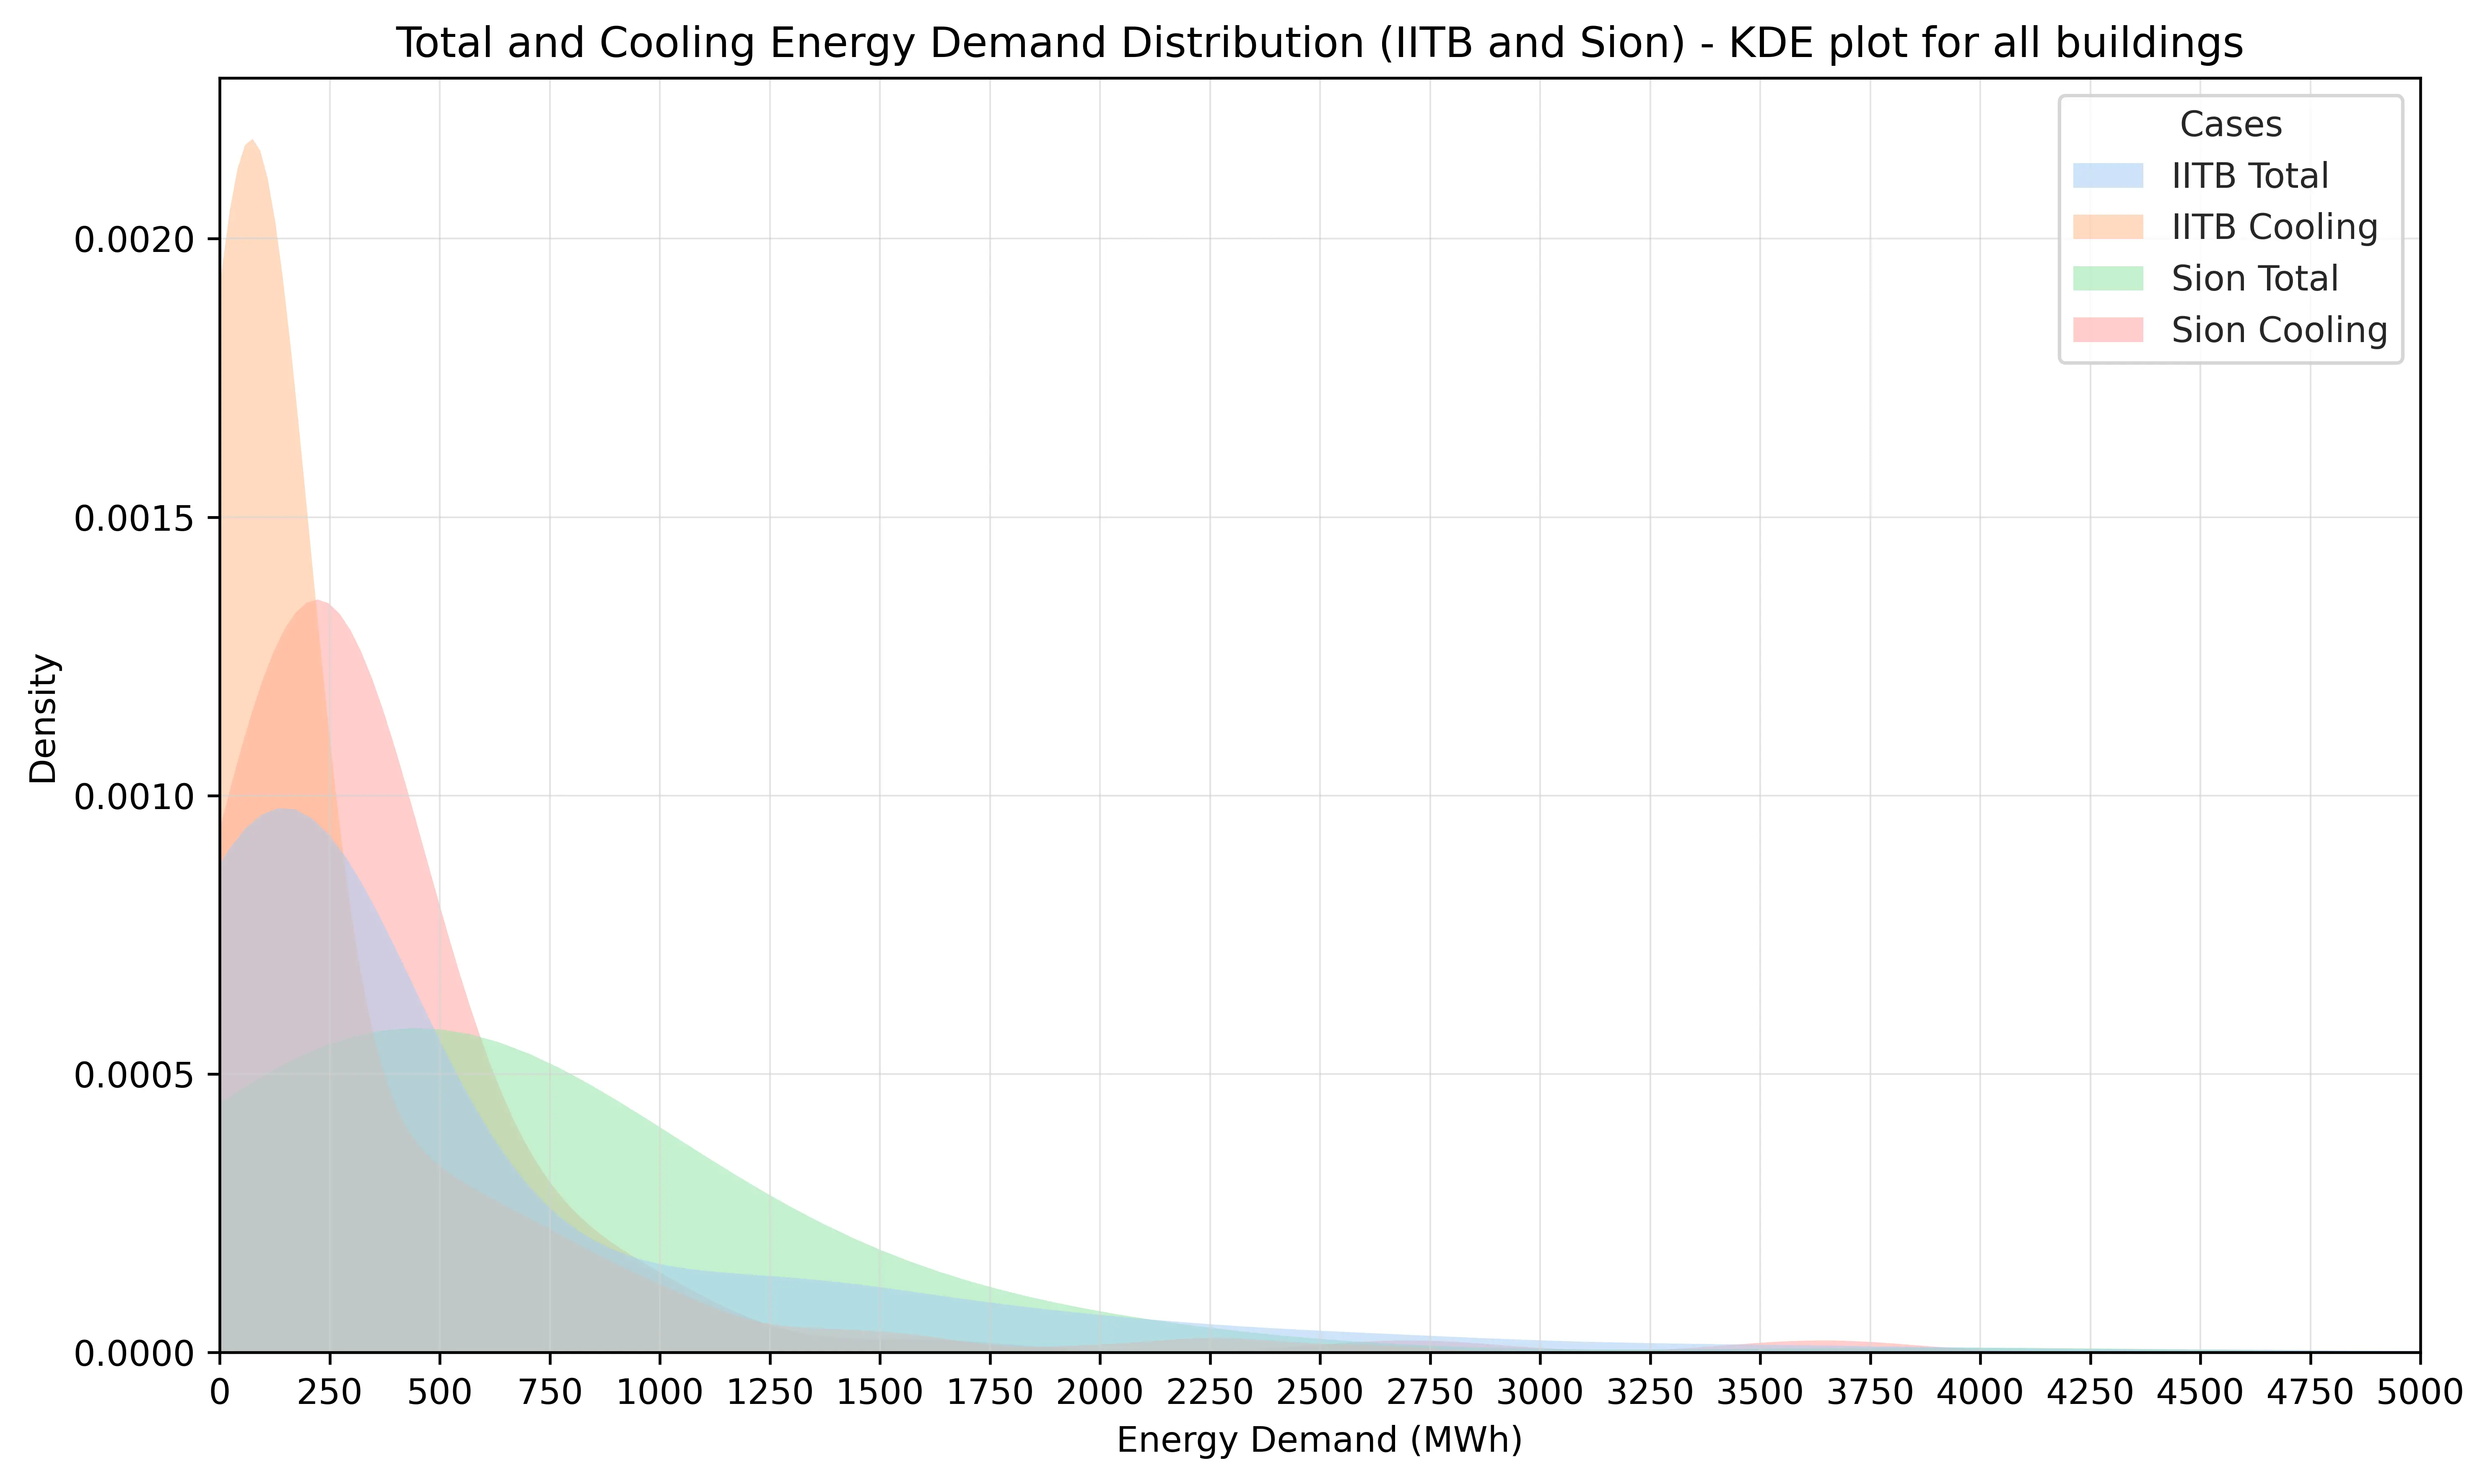
Figure 14. KDE showing total and cooling energy demand distribution for IIT Bombay and Sion. The area under the curve represents the total distribution of buildings for each dataset. KDE: kernel density estimate; IIT: Indian Institute of Technology.
To validate the findings from UBEM simulations, the estimates were cross-referenced against annual electricity consumption data from 45 buildings on the IITB campus, comprising both academic and residential structures. Since energy demand was predicted based on fixed cooling schedules which are determined by the building usage instead of considering actual occupant behaviors, the estimates significantly exceed the actual energy consumption. However, the correlation coefficient computed between the predicted energy demand and the actual consumption stood at 0.48, indicating a moderate level of agreement between the two datasets. Further examination involved adjusting the cooling energy demand for certain buildings, specifically those in hostel areas where most buildings are not equipped with air conditioning units. Following this adjustment, the correlation coefficient notably increased to 0.59, suggesting a more pronounced alignment between the simulated energy demands and the observed consumption patterns.
The cooling EUI highlights substantial differences among different building typologies. It ranges from 0 kWh/yr/m2 to 141.05 kWh/yr/m2 at IITB. Most hostel buildings exhibit relatively lower EUIs despite recording a higher total annual energy demand than several academic buildings. This disparity can be ascribed to the restricted utilization of electrical appliances in hostels. At Sion, the cooling EUI varies from 0 kWh/yr/m2 to 86.28 kWh/yr/m2. The highest EUI in the region is exhibited by a university building. Additionally, it is crucial to highlight that both locations host buildings with minimal cooling energy demand, such as parking spaces. Nevertheless, these buildings constitute a negligible proportion of the total building stock. On the whole, the mean cooling EUI of Sion is 22.97% lower than that of IITB. The EUIs are largely influenced by the existence of non-residential buildings on the IITB campus (Figure 15). This underscores that, in addition to climatic variations and inter-building effects, building usage plays a pivotal role in influencing energy demand within a diverse building mix, as noted in several previous studies[74,89,90].
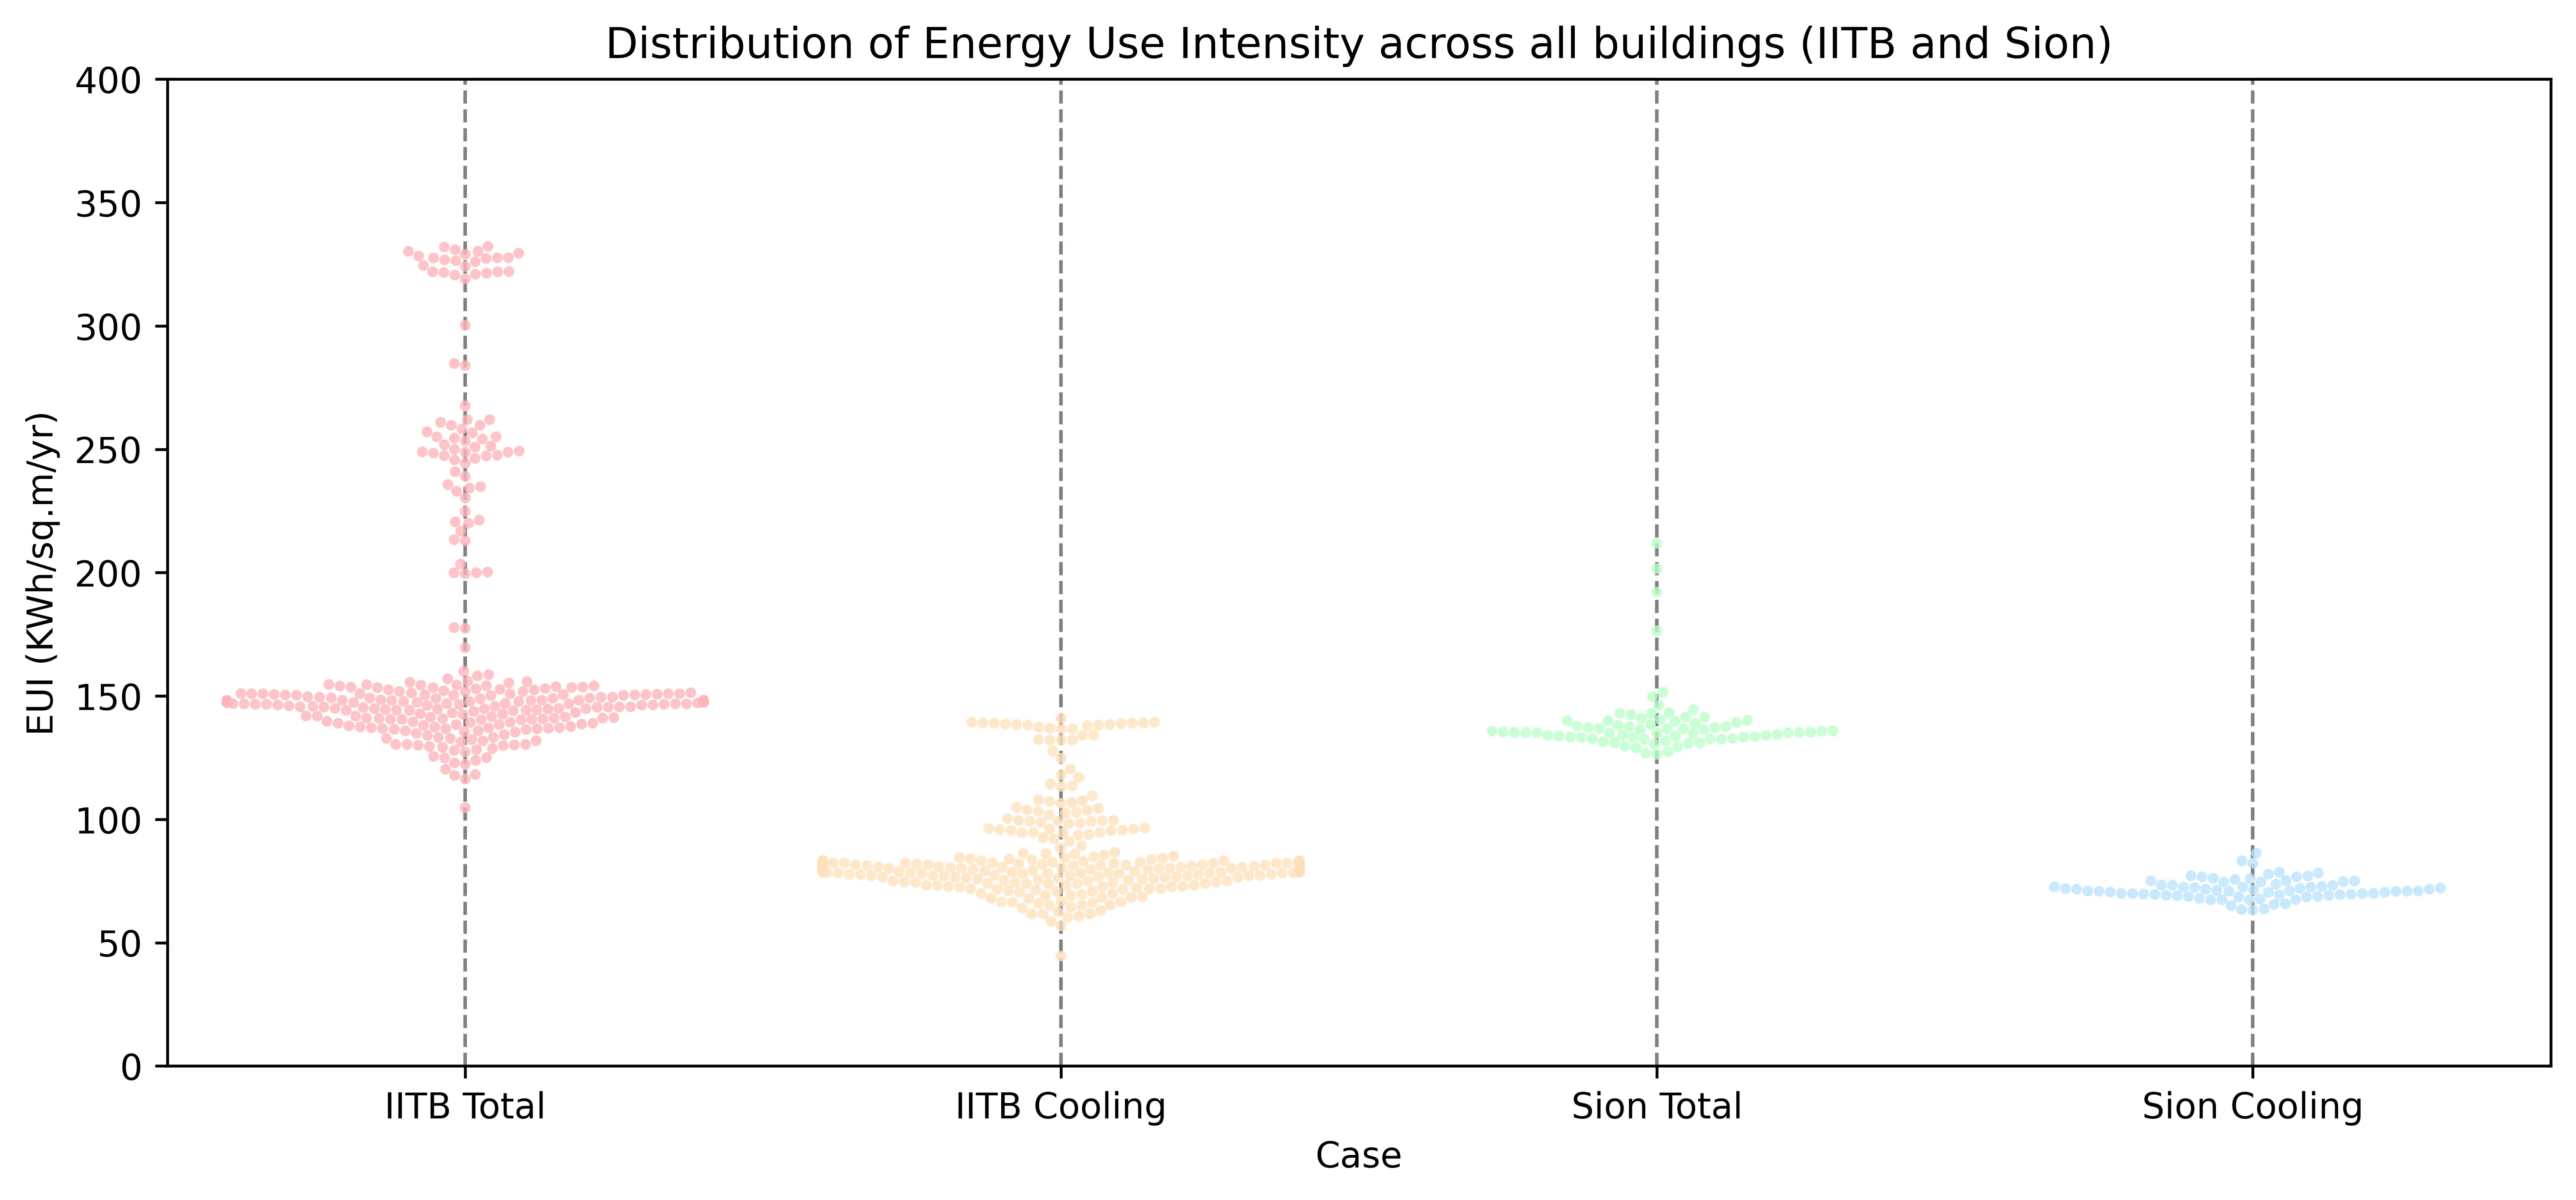
Figure 15. Total and cooling EUIs for IIT Bombay and Sion. With the integration of actual building usage, the cooling EUIs are significantly affected for both the locations. While IITB’s EUI show considerable variability due to a diverse range of building usage, Sion exhibits a more concentrated profile across its buildings. EUI: Energy Use Intensity; IIT: Indian Institute of Technology; IITB: Indian Institute of Technology Bombay.
The results of this scenario also suggest that while UHI significantly impacts building energy demand is crucial, any UBEM studies accounting for climate variations must be supported by a typology specific comprehensive 3D urban building database. In this way, energy-efficiency measures can be tailored and implemented based on key variables such as urban forms, microclimates, and building usage types, thereby optimizing their effectiveness at the urban scale[91,92]. The UHI in Mumbai exert a greater impact on the energy demand of residential buildings compared to academic or other typologies. The main reason for this phenomenon is the increased use of nighttime air conditioning in residential buildings, particularly sensitive to UHI intensity. This finding holds particular significance for warm and humid climates, adding valuable insights to the existing body of research from similar studies[36,82,93,94]. In essence, this scenario effectively illustrates the combined effects of building typology, occupancy, geometry and climate on urban energy demand in a tropical city.
To better interpret the four scenarios in relation to one another, it is essential to analyze their outcomes. Scenario I, focusing on an isolated single building, clearly demonstrated the profound influence of local climate variations, with the consistently higher cooling EUIs at Sion than IITB. However, as soon as inter-building interactions were introduced in Scenario II, the disparity between the two sites reduced greatly, revealing the critical role of mutual shading in shaping daytime cooling loads. Scenario III enhanced realism by incorporating actual building heights and revealed a striking reversal of expectations: despite Sion’s higher UHI intensity, IITB’s shorter and more exposed buildings produced higher cooling EUIs. This highlighted the dominant role of building morphology over temperature alone. Finally, Scenario IV integrated mixed typologies and occupancy schedules, where high-intensity academic and laboratory spaces at IITB further increased its energy demand relative to Sion. The results collectively show that the apparent climate penalty of UHI can be moderated or even offset by shading and building use patterns.
Taken together, the four scenarios illustrate a clear progression from controlled to realistic urban-scale conditions. Though Scenario I elucidates the fundamental influence of UHI on cooling building energy demand, Scenarios II and III underscore that urban morphology and building height distributions strongly mediate this effect. Scenario IV further shows that building typology and occupancy schedules compound these dynamics, producing energy demand outcomes that cannot be explained by climate alone. Consequently, the comparative framework clarifies how the balance between climate-driven effects and built-form-driven effects, such as building density or coverage ratio, shapes the overall cooling energy demand. The summary of all the energy demand modelling scenarios incorporated in this study is shown in Figure 16.
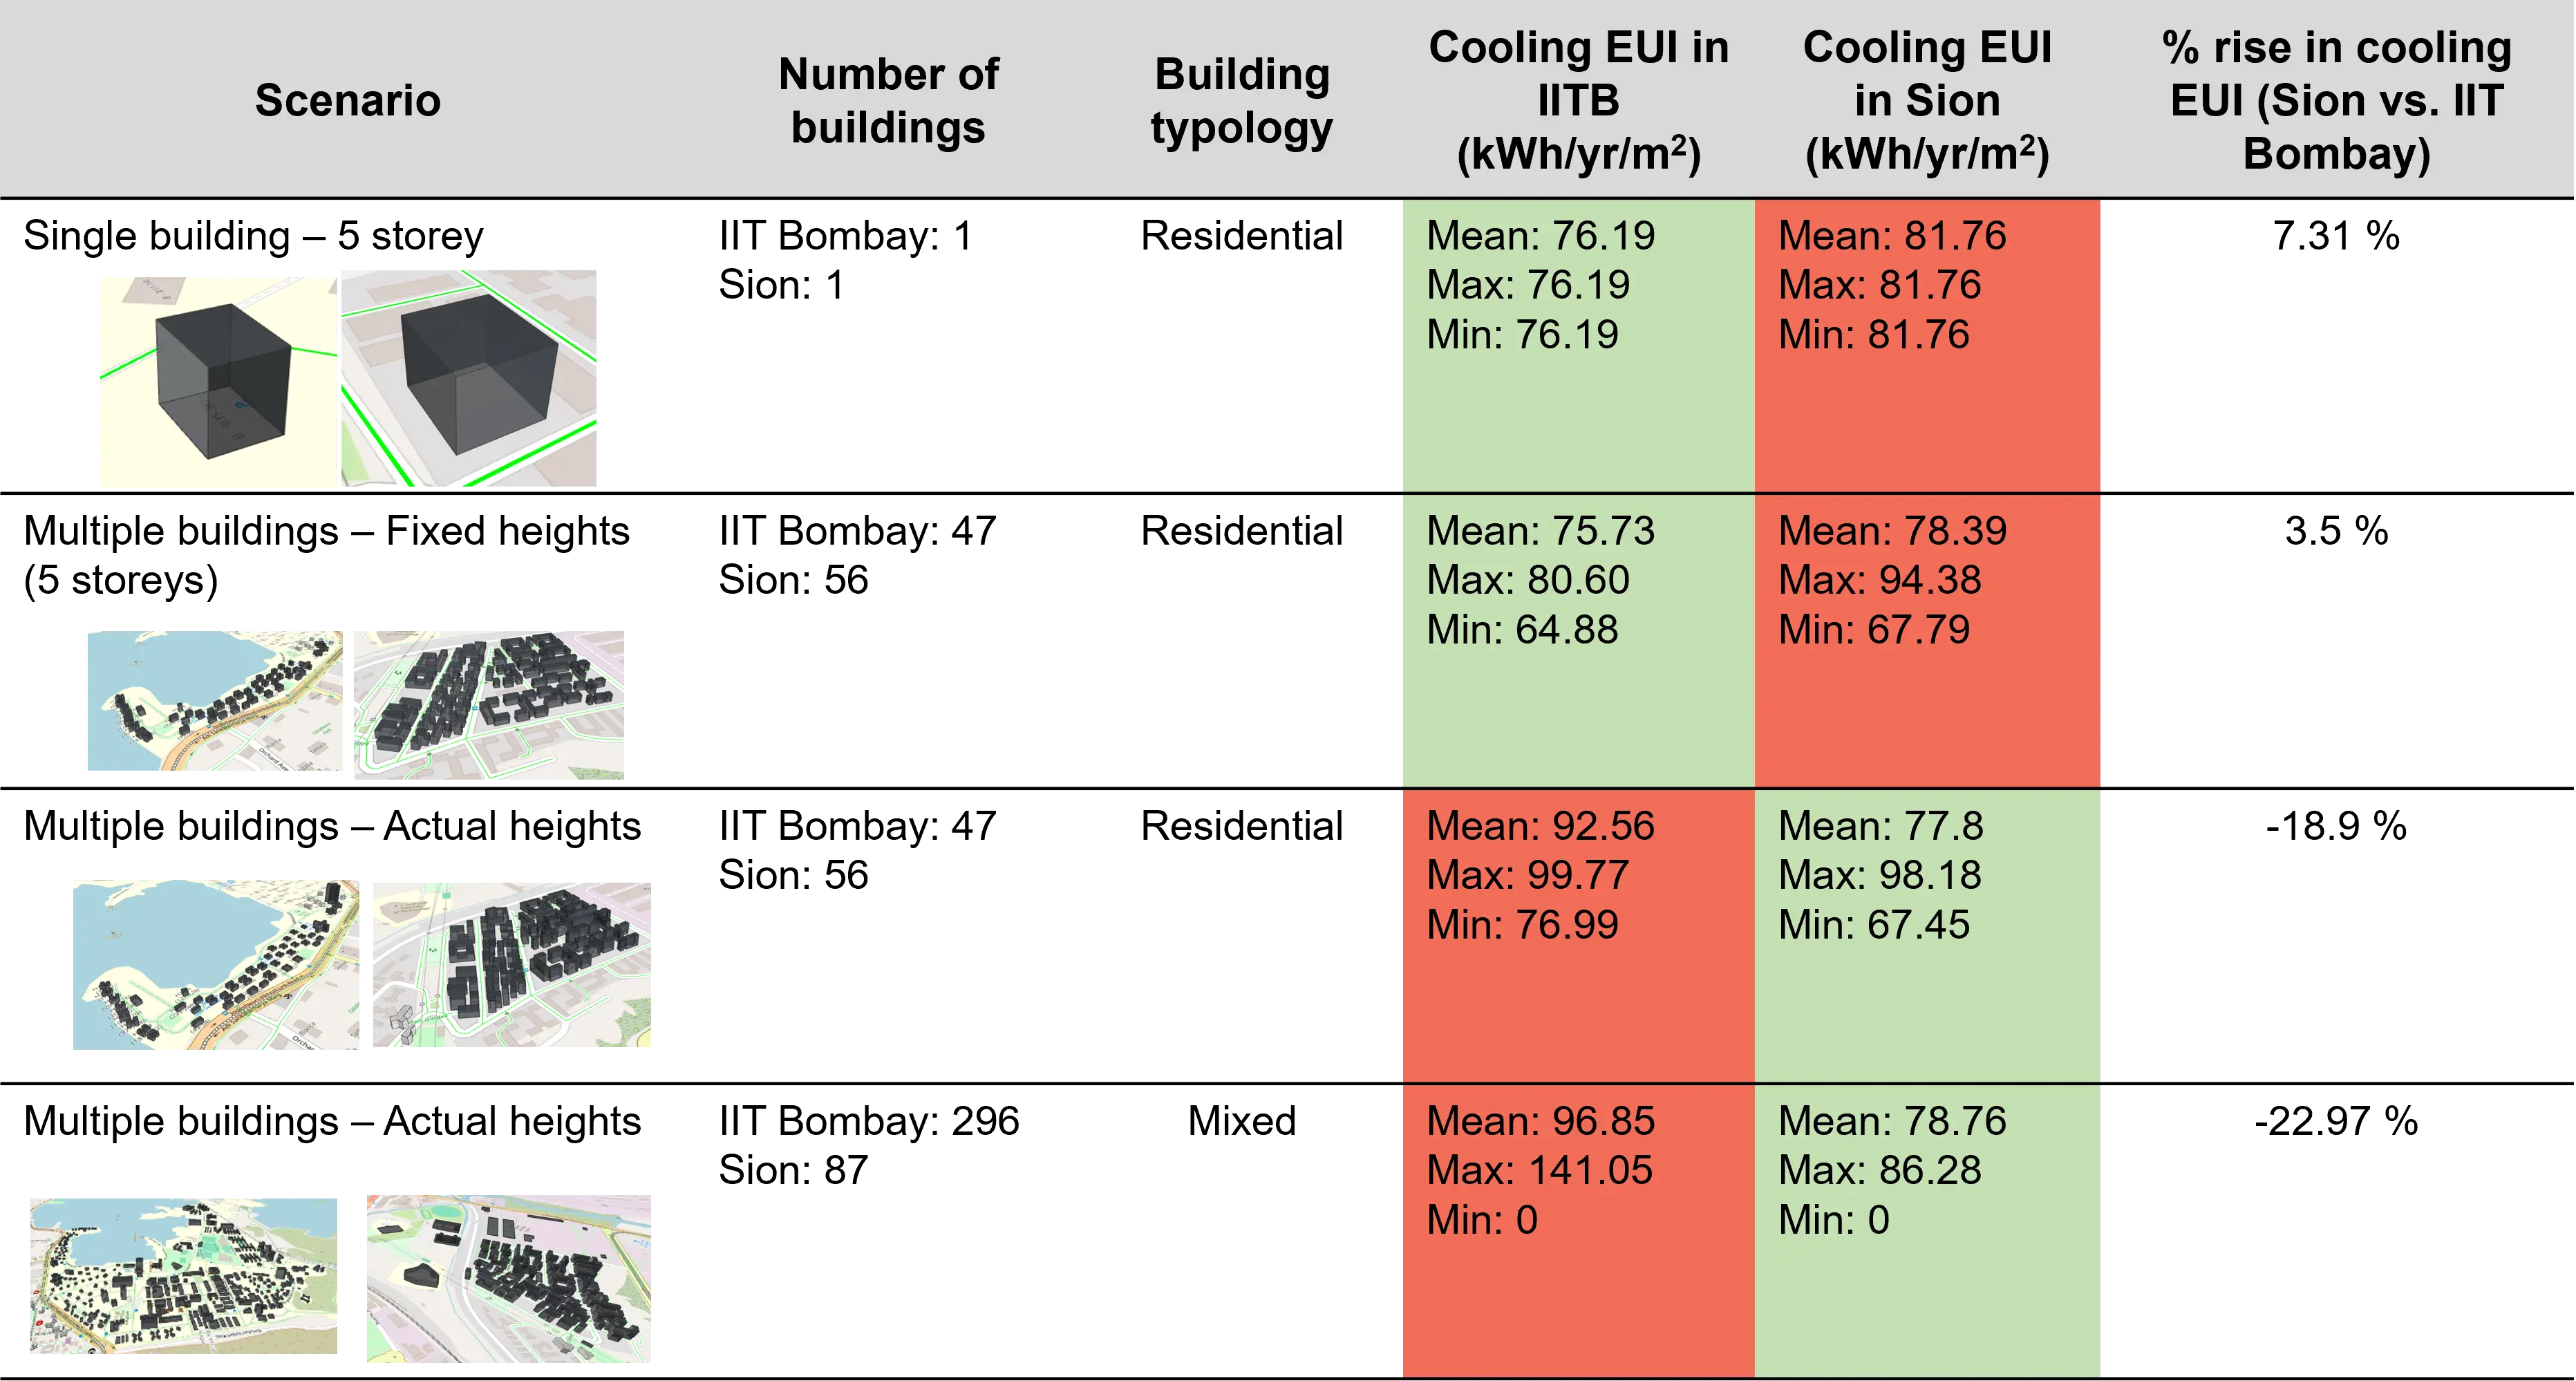
Figure 16. Summary of building energy demand simulations for the two locations and the relative variation in cooling EUI. The light red shading indicates higher mean cooling EUI and the green shading indicates lower mean cooling EUI. EUI: Energy Use Intensity; IITB: Indian Institute of Technology Bombay; IIT: Indian Institute of Technology.
The processes adopted in this study entailed exhaustive database generation for UBEM input variables for all the buildings, the impact of which is clearly reflected in the simulation outputs. For example, academic buildings exhibit a higher energy demand during the daytime because of high occupancy. Similarly, the space-cooling demand for residential buildings increases from the evening. The importance of input variables highlights the challenges to the reproducibility of UBEM in most urban areas of developing countries, owing to the lack of accurate building data such as footprints, heights, typologies, materials, ages, etc.[95,96]. Likewise, the simplification of schedules might fail to capture the complexity and variability inherent in real-world conditions, necessitating the development of innovative techniques for accurately determining occupant-related information[97,98]. Other critical factors include the built environment and micro-climate, both of which can demonstrate variations in energy demand patterns when examined at a finer temporal scale.
4. Conclusion
This study examined the influence of UHI intensity on urban building energy demand in Mumbai using a scenario-based UBEM approach. The analysis begins by mapping LST of the city, calculating UTFVI, and identifying UHI hotspots. It was observed that LST reasonably explains the UHI hotspots in the city, where densely built-up regions show much higher LST than the vegetated areas, water bodies and mangroves. Although LST alone does not directly determine cooling energy demand, the hourly profile of air temperature is the primary driving factor. UHI patterns, however, provide a reliable basis for identifying zones of thermal discomfort and areas where cooling energy demand is likely to elevate.
Two sites in Mumbai, IITB and Sion, were selected for multi-scale UBEM, from single-building to urban scale, based on their distinct UTFVI characteristics and proximity (within 1 km) to CPCB weather monitoring stations. Energy demand simulations for a single residential building with similar geometry at two locations reveals that the annual mean cooling EUI is 7.31% higher in Sion owing to its high nighttime temperatures, reflecting the effects of UHI. Variations in building height further highlighted that taller buildings, despite higher absolute energy usage, can exhibit lower EUI than shorter, more exposed structures. When multiple residential buildings of equivalent heights are considered, the difference in mean cooling EUI between the two sites reduced to 3.5%, illustrating the mitigating effect of inter-building shading.
The incorporation of actual building heights and typologies unveiled the complex interactions among building geometry, inter-building shading, usage-based schedules, and local climate. When only residential buildings with actual heights in the two locations were considered, the simulations showed an 18.9% reduction in mean cooling EUI at Sion compared to IITB. This is attributed to the high-rise buildings with high building coverage ratio and building density at Sion, in contrast to low-rise exposed residential buildings at IITB. When incorporating actual building typologies from the two locations, Sion exhibits a 22% decrease in mean cooling EUI. This clearly represents how building functions matter more than other inputs, since IITB hosts abundant laboratories, offices and academic buildings with high cooling energy usage.
These findings underscore three key contributions of the study. The first is that while UHI effects are clearly visible in isolated building scenarios, urban-scale energy outcomes are shaped more strongly by building form, function, and inter-building interactions. The second is that UBEM is established as a robust framework for transcending building-level assessments and capturing the complex interaction between urban form and local climate. The third is the methodological value of integrating in-situ weather data into UBEM workflows to improve model accuracy in cities.
In addition, this study highlights the pressing necessity to develop comprehensive urban datasets at the building level, with geotagged footprints, geometry, number of floors, occupancy, building usage, and household characteristics. At the same time, the study acknowledges several limitations. The analysis was confined to two sites, and although they reflect distinct UHI conditions, expanding to more diverse urban contexts would enhance the applicability of the findings. Limitations in weather data resolution, both spatial and temporal, constrained the analysis. Future research could leverage high-resolution microclimate datasets or integrated urban climate models to address these gaps. Furthermore, the study primarily focused on building cooling energy demand, and future research could extend to heating, lighting, and urban infrastructure energy systems for a more holistic perspective. Finally, while the study illustrates the value of a multi-scale UBEM approach, future research could advance methodological innovation by integrating UBEM with socio-economic datasets to capture behavioral dimensions of energy demand. Such efforts would facilitate a comprehensive analysis of urban energy systems, including identifying energy efficiency opportunities, assessing the potential for renewable energy integration, and formulating targeted policy interventions to promote sustainable urban development.
Acknowledgements
The authors would like to thank Central Pollution Control Board (CPCB) and Maharashtra Pollution Control Board (MPCB), for providing air quality data for various locations in Mumbai, India.
Authors contribution
Anand A: Conceptualization, methodology, data curation, model development, analysis, interpretation, visualization, article conception and design, manuscript drafting and revision.
Rajasekaran E: Supervision, article design, conceptual and technical guidance, validation, and manuscript review and editing.
Deb C: Supervision, conceptual and technical guidance, model verification, validation, and manuscript review and editing.
Conflict of interest
The authors declare no conflicts of interest.
Ethical approval
Not applicable.
Consent to participate
Not applicable.
Funding
None.
Copyright
© The Author(s) 2025.
References
-
1. United Nations Human Settlements Programme (UN-Habitat). World Cities Report 2024 [Internet]. Nairobi (Kenya): UN-Habitat; 2024. Available from: https://unhabitat.org/wcr/
-
2. Mahtta R, Fragkias M, Güneralp B, Mahendra A, Reba M, Wentz EA, et al. Urban land expansion: The role of population and economic growth for 300+ cities. Npj Urban Sustain. 2022;2(1):5.[DOI]
-
3. Madlener R, Sunak Y. Impacts of urbanization on urban structures and energy demand: What can we learn for urban energy planning and urbanization management? Sustain Cities Soc. 2011;1(1):45-53.[DOI]
-
4. Santamouris M, Vasilakopoulou K. Present and future energy consumption of buildings: Challenges and opportunities towards decarbonisation. e-Prime - Adv Electr Eng Electron Energy. 2021;1:100002.[DOI]
-
5. Ye Y, Zuo W, Wang G. A comprehensive review of energy-related data for U.S. commercial buildings. Energy Build. 2019;186:126-137.[DOI]
-
6. Güneralp B, Zhou Y, Ürge-Vorsatz D, Gupta M, Yu S, Patel PL, et al. Global scenarios of urban density and its impacts on building energy use through 2050. Proc Natl Acad Sci U.S.A. 2017;114(34):8945-8950.[DOI]
-
7. Siddiqui A, Kushwaha G, Nikam B, Srivastav SK, Shelar A, Kumar P. Analysing the day/night seasonal and annual changes and trends in land surface temperature and surface urban heat island intensity (SUHII) for Indian cities. Sustain Cities Soc. 2021;75:103374.[DOI]
-
8. Rajeswari JR, Fountoukis C, Siddique A, Moosakutty S, Mohieldeen Y, Ayoub MA, et al. Urban heat island phenomenon in a desert, coastal city: The impact of urbanization. Urban Clim. 2024;56:102016.[DOI]
-
9. Kotharkar R, Ramesh A, Bagade A. Urban heat island studies in South Asia: A critical review. Urban Clim. 2018;24:1011-1026.[DOI]
-
10. Firozjaei MK, Weng Q, Zhao C, Kiavarz M, Lu L, Alavipanah SK. Surface anthropogenic heat islands in six megacities: An assessment based on a triple-source surface energy balance model. Remote Sens Environ. 2020;242:111751.[DOI]
-
11. Sharmin T, Chappell A. Detecting the changing impact of urbanisation on urban heat islands in a tropical megacity using local climate zones. Energy Built Environ. 2025.[DOI]
-
12. Rutter P, Keirstead J. A brief history and the possible future of urban energy systems. Energy Policy. 2012;50:72-80.[DOI]
-
13. Zhao P, Zhang M. The impact of urbanisation on energy consumption: A 30-year review in China. Urban Clim. 2018;24:940-953.[DOI]
-
14. Jamei Y, Rajagopalan P, Sun QC. Time-series dataset on land surface temperature, vegetation, built up areas and other climatic factors in top 20 global cities (2000-2018). Data Brief. 2019;23:103803.[DOI]
-
15. Sánchez-Aparicio M, Andrés-Anaya P, Del Pozo S, Lagüela S. Retrieving Land Surface Temperature from Satellite Imagery with a Novel Combined Strategy. Remote Sens. 2020;12(2):277.[DOI]
-
16. Amindin A, Pouyan S, Pourghasemi HR, Yousefi S, Tiefenbacher JP. Spatial and temporal analysis of urban heat island using Landsat satellite images. Environ Sci Pollut Res. 2021;28(30):41439-41450.[DOI]
-
17. Estoque RC, Murayama Y. Monitoring surface urban heat island formation in a tropical mountain city using Landsat data (1987-2015). ISPRS J Photogramm Remote Sens. 2017;133:18-29.[DOI]
-
18. Nega W, Balew A. The relationship between land use land cover and land surface temperature using remote sensing: systematic reviews of studies globally over the past 5 years. Environ Sci Pollut Res. 2022;29(28):42493-42508.[DOI]
-
19. Kafy AA, Dey NN, Al Rakib A, Rahaman ZA, Nasher NMR, Bhatt A. Modeling the relationship between land use/land cover and land surface temperature in Dhaka, Bangladesh using CA-ANN algorithm. Environ Chall. 2021;4:100190.[DOI]
-
20. Wu Z, Zhang Y. Water bodies’ cooling effects on urban land daytime surface temperature: Ecosystem service reducing heat island effect. Sustainability. 2019;11(3):787.[DOI]
-
21. Kodimalar T, Vidhya R, Eswar R. Land surface emissivity retrieval from multiple vegetation indices: a comparative study over India. Remote Sens Lett. 2019;11(2):176-185.[DOI]
-
22. Budamagunta M, Gaur A, Verma A, Anand A, Deb C. Clustering Indian districts based on multidimensional demographic and climate data. In: Proceedings of the 9th ACM International Conference on Systems for Energy-Efficient Buildings, Cities, and Transportation; 2022 Nov 9; Boston, Massachusetts. New York: Association for Computing Machinery; 2022. p. 450-455.[DOI]
-
23. Maithani S, Nautiyal G, Sharma A. Investigating the effect of lockdown during COVID-19 on land surface temperature: study of Dehradun city, India. J Indian Soc Remote Sens. 2020;48(9):1297-1311.[DOI]
-
24. Dan Y, Li H, Jiang S, Yang Z, Peng J. Changing coordination between urban area with high temperature and multiple landscapes in Wuhan City, China. Sustain Cities Soc. 2022;78:103586.[DOI]
-
25. Höppe P. The physiological equivalent temperature-a universal index for the biometeorological assessment of the thermal environment. Int J Biometeorol. 1999;43(2):71-75.[DOI]
-
26. Chen YC, Matzarakis A. Modified physiologically equivalent temperature—Basics and applications for western European climate. Theor Appl Climatol. 2017;132(3-4):1275-1289.[DOI]
-
27. Cevik Degerli B, Cetin M. Evaluation of UTFVI index effect on climate change in terms of urbanization. Environ Sci Pollut Res. 2023;30(30):75273-75280.[DOI]
-
28. Sharma R, Pradhan L, Kumari M, Bhattacharya P. Assessing urban heat islands and thermal comfort in Noida City using geospatial technology. Urban Clim. 2021;35:100751.[DOI]
-
29. Kim SW, Brown RD. Urban heat island (UHI) intensity and magnitude estimations: A systematic literature review. Sci Total Environ. 2021;779:146389.[DOI]
-
30. Yue W, Qiu S, Xu H, Xu L, Zhang L. Polycentric urban development and urban thermal environment: A case of Hangzhou, China. Landsc Urban Plan. 2019;189:58-70.[DOI]
-
31. Zhou B, Rybski D, Kropp JP. The role of city size and urban form in the surface urban heat island. Sci Rep. 2017;7(1):4791.[DOI]
-
32. Verma A, Gupta V, Nihar K, Jana A, Jain RK, Deb C. Tropical climates and the interplay between IEQ and energy consumption in buildings: A review. Build Environ. 2023;242:110551.[DOI]
-
33. Yang X, Yao L, Li M, Cao J, Zhong Q, Peng W, et al. How heat waves and urban microclimates affect building cooling energy demand? Insights from fifteen eastern Chinese cities. Appl Energy. 2025;384:125424.[DOI]
-
34. Yang X, Peng LLH, Jiang Z, Chen Y, Yao L, He Y, et al. Impact of urban heat island on energy demand in buildings: Local climate zones in Nanjing. Appl Energy. 2020;260:114279.[DOI]
-
35. Ma YX, Yu AC. Impact of urban heat island on high-rise residential building cooling energy demand in Hong Kong. Energy Build. 2024;311:114127.[DOI]
-
36. Li X, Zhou Y, Yu S, Jia G, Li H, Li W. Urban heat island impacts on building energy consumption: A review of approaches and findings. Energy. 2019;174:407-419.[DOI]
-
37. Su MA, Ngarambe J, Santamouris M, Yun GY. Empirical evidence on the impact of urban overheating on building cooling and heating energy consumption. iScience. 2021;24(5):102495.[DOI]
-
38. Chen HC, Han Q, De Vries B. Modeling the spatial relation between urban morphology, land surface temperature and urban energy demand. Sustain Cities Soc. 2020;60:102246.[DOI]
-
39. Hunt A, Watkiss P. Climate change impacts and adaptation in cities: a review of the literature. Clim Change. 2010;104(1):13-49.[DOI]
-
40. Kotharkar R, Bagade A. Evaluating urban heat island in the critical local climate zones of an Indian city. Landsc Urban Plan. 2018;169:92-104.[DOI]
-
41. Santamouris M, Cartalis C, Synnefa A, Kolokotsa D. On the impact of urban heat island and global warming on the power demand and electricity consumption of buildings—A review. Energy Build. 2015;98:119-124.[DOI]
-
42. Reinhart CF, Davila CC. Urban building energy modeling—A review of a nascent field. Build Environ. 2016;97:196-202.[DOI]
-
43. Fonseca JA, Nguyen TA, Schlueter A, Marechal F. City Energy Analyst (CEA): Integrated framework for analysis and optimization of building energy systems in neighborhoods and city districts. Build Environ. 2016;113:202-226.[DOI]
-
44. Deb C, Schlueter A. Review of data-driven energy modelling techniques for building retrofit. Renew Sustain Energy Rev. 2021;144:110990.[DOI]
-
45. Ferrando M, Causone F, Hong T, Chen Y. Urban building energy modeling (UBEM) tools: A state-of-the-art review of bottom-up physics-based approaches. Sustain Cities Soc. 2020;62:102408.[DOI]
-
46. Hong T, Chen Y, Luo X, Luo N, Lee SH. Ten questions on urban building energy modeling. Build Environ. 2020;168:106508.[DOI]
-
47. Ma R, Ren B, Zhao D, Chen J, Lu Y. Modeling urban energy dynamics under clustered urban heat island effect with local-weather extended distributed adjacency blocks. Sustain Cities Soc. 2020;56:102099.[DOI]
-
48. Mondal N, Anand P, Khan A, Deb C, Cheong D, Sekhar C, et al. Systematic review of the efficacy of data-driven urban building energy models during extreme heat in cities: Current trends and future outlook. Build Simul. 2024;17(5):695-722.[DOI]
-
49. Anand A, Deb C. The potential of remote sensing and GIS in urban building energy modelling. Energy Built Environ. 2024;5(6):957-969.[DOI]
-
50. Gorzalka P, Garbasevschi OM, Schmiedt J, Droin A, Linkiewicz MM, Wurm M, et al. Collecting data for urban building energy modelling by remote sensing and machine learning. In: Proceedings of Building Simulation 2021: 17th Conference of IBPSA; 2021 Sep 1-3; Bruges, Belgium. International Building Performance Simulation Association; 2021. p. 1139-1146.[DOI]
-
51. Shareef S. The impact of urban morphology and building’s height diversity on energy consumption at urban scale. The case study of Dubai. Build Environ. 2021;194:107675.[DOI]
-
52. Hameed A, Kakoo H, Musa V, Abdulla SI, Ebrahimpou A. A multi-sectional analysis of building height, layout, and urban density on seasonal energy consumption: A case study. Sustain Eng Innov. 2024;6(2):167-176.[DOI]
-
53. Wang P, Yang Y, Ji C, Huang L. Influence of built environment on building energy consumption: a case study in Nanjing, China. Environ Dev Sustain. 2023;26(2):5199-5222.[DOI]
-
54. Li J, Liang C, Zhou W. A review of building physical shapes on heating and cooling energy consumption. Energies. 2024;17(22):5766.[DOI]
-
55. Yu S, Zhang Z, Liu F, Wang X, Hu S. Urban expansion in the megacity since 1970s: A case study in Mumbai. Geocarto Int. 2019;36(6):603-621.[DOI]
-
56. Shahfahad , Talukdar S, Rihan M, Hang HT, Bhaskaran S, Rahman A. Modelling urban heat island (UHI) and thermal field variation and their relationship with land use indices over Delhi and Mumbai metro cities. Environ Dev Sustain. 2021;24(3):3762-3790.[DOI]
-
57. Sobrino JA, Irakulis I. A methodology for comparing the surface urban heat island in selected urban agglomerations around the world from Sentinel-3 SLSTR data. Remote Sens. 2020;12(12):2052.[DOI]
-
58. Singh P, Kikon N, Verma P. Impact of land use change and urbanization on urban heat island in Lucknow city, Central India. A remote sensing based estimate. Sustain Cities Soc. 2017;32:100-114.[DOI]
-
59. Chatterjee S, Dinda A. Determination of characterized urban thermal zones (UTZ) for assessing microclimates in the tropical metropolitan area of Kolkata. Sustain Cities Soc. 2022;80:103807.[DOI]
-
60. Shahfahad , Rihan M, Naikoo MW, Ali MA, Usmani TM, Rahman A. Urban heat island dynamics in response to land-use/land-cover change in the coastal city of Mumbai. J Indian Soc Remote Sens. 2021;49(9):2227-2247.[DOI]
-
61. Liu L, Zhang Y. Urban heat island analysis using the Landsat TM data and ASTER data: A case study in Hong Kong. Remote Sens. 2011;3(7):1535-1552.[DOI]
-
62. Singh P, Verma P, Chaudhuri AS, Singh VK, Rai PK. Evaluating the relationship between Urban Heat Island and temporal change in land use, NDVI and NDBI: a case study of Bhopal city, India. Int J Environ Sci Technol. 2023;21(3):3061-3072.[DOI]
-
63. Singh M, Sharston R, Murtha T. Critical evaluation of the spatiotemporal behavior of UHI, through correlation analyses based on multi-city heterogeneous dataset. Sustain Cities Soc. 2024;110:105576.[DOI]
-
64. Jamei Y, Rajagopalan P, Sun QC. Spatial structure of surface urban heat island and its relationship with vegetation and built-up areas in Melbourne, Australia. Sci Total Environ. 2019;659:1335-1351.[DOI]
-
65. Zhou D, Xiao J, Bonafoni S, Berger C, Deilami K, Zhou Y, et al. Satellite remote sensing of surface urban heat islands: Progress, challenges, and perspectives. Remote Sens. 2018;11(1):48.[DOI]
-
66. Yang M, Wang H, Yu CW, Cao SJ. A global challenge of accurately predicting building energy consumption under urban heat island effect. Indoor Built Environ. 2022;32(3):455-459.[DOI]
-
67. Salvati A, Palme M, Chiesa G, Kolokotroni M. Built form, urban climate and building energy modelling: Case-studies in Rome and Antofagasta. J Build Perform Simul. 2020;13(2):209-225.[DOI]
-
68. Ahmadian E, Sodagar B, Bingham C, Elnokaly A, Mills G. Effect of urban built form and density on building energy performance in temperate climates. Energy Build. 2021;236:110762.[DOI]
-
69. Litardo J, Palme M, Borbor-Cordova M, Caiza R, Macias J, Hidalgo-Leon R, et al. Urban Heat Island intensity and buildings’ energy needs in Duran, Ecuador: Simulation studies and proposal of mitigation strategies. Sustain Cities Soc. 2020;62:102387.[DOI]
-
70. Prataviera E, Romano P, Carnieletto L, Pirotti F, Vivian J, Zarrella A. EUReCA: An open-source urban building energy modelling tool for the efficient evaluation of cities energy demand. Renew Energy. 2021;173:544-560.[DOI]
-
71. Perera ATD, Coccolo S, Scartezzini JL. The influence of urban form on the grid integration of renewable energy technologies and distributed energy systems. Sci Rep. 2019;9(1):17756.[DOI]
-
72. Ji Q, Li C, Makvandi M, Zhou X. Impacts of urban form on integrated energy demands of buildings and transport at the community level: A comparison and analysis from an empirical study. Sustain Cities Soc. 2022;79:103680.[DOI]
-
73. Liu H, Pan Y, Yang Y, Huang Z. Evaluating the impact of shading from surrounding buildings on heating/cooling energy demands of different community forms. Build Environ. 2021;206:108322.[DOI]
-
74. Woo YE, Cho GH. Impact of the surrounding built environment on energy consumption in mixed-use building. Sustainability. 2018;10(3):832.[DOI]
-
75. Zhao Y, Ding X, Wu Z, Yin S, Fan Y, Ge J. Impact of urban form on building energy consumption in different climate zones of China. Energy Build. 2024;320:114579.[DOI]
-
76. Sadłowska-Sałęga A, Wąs K. Impact of shading effect from nearby buildings on energy demand and load calculations for historic city centres in central Europe. Energies. 2024;17(24):6400.[DOI]
-
77. Xie X, Luo Z, Grimmond S, Sun T. Impact of building density on natural ventilation potential and cooling energy saving across Chinese climate zones. Build Environ. 2023;244:110621.[DOI]
-
78. Alhazmi M, Anand J. The relative importance of building design parameters in reducing energy use and sensible heat release from buildings in light of forecasted future weather data and building coverage ratio. In: ASHRAE. 2025 ASHRAE Winter Conference: Proceedings of the 2025 ASHRAE Winter Conference; 2025 Feb 8-12; Orlando, FL. Atlanta: ASHRAE; 2025. p. 1185-1194. Available from: https://www.osti.gov/servlets/purl/2538070
-
79. Wang P, Liu Z, Zhang L. Sustainability of compact cities: A review of Inter-Building Effect on building energy and solar energy use. Sustain Cities Soc. 2021;72:103035.[DOI]
-
80. Yu C, Pan W. Inter-building effect on building energy consumption in high-density city contexts. Energy Build. 2023;278:112632.[DOI]
-
81. Ascione F, Bianco N, Iovane T, Mastellone M, Mauro GM. Is it fundamental to model the inter-building effect for reliable building energy simulations? Interaction with shading systems. Build Environ. 2020;183:107161.[DOI]
-
82. Kumari P, Garg V, Kumar R, Kumar K. Impact of urban heat island formation on energy consumption in Delhi. Urban Clim. 2021;36:100763.[DOI]
-
83. Liu K, Xu X, Zhang R, Kong L, Wang W, Deng W. Impact of urban form on building energy consumption and solar energy potential: A case study of residential blocks in Jianhu, China. Energy Build. 2023;280:112727.[DOI]
-
84. Romano P, Prataviera E, Carnieletto L, Vivian J, Zinzi M, Zarrella A. Assessment of the urban heat island impact on building energy performance at district level with the EUReCA platform. Climate. 2021;9(3):48.[DOI]
-
85. Wang Y, Sun G, Wu Y, Rosenberg MW. Urban 3D building morphology and energy consumption: empirical evidence from 53 cities in China. Sci Rep. 2024;14(1):12887.[DOI]
-
86. Xie Y, Noor AIM. Factors affecting residential end-use energy: Multiple regression analysis based on buildings, households, lifestyles, and equipment. Buildings. 2022;12(5):538.[DOI]
-
87. Akbari S, Haghighat F. Occupancy and occupant activity drivers of energy consumption in residential buildings. Energy Build. 2021;250:111303.[DOI]
-
88. Sood D, Alhindawi I, Ali U, McGrath JA, Byrne MA, Finn D, et al. Simulation-based evaluation of occupancy on energy consumption of multi-scale residential building archetypes. J Build Eng. 2023;75:106872.[DOI]
-
89. Sohn MD, Dunn LN. Exploratory analysis of energy use across building types and geographic regions in the United States. Front Built Environ. 2019;5:105.[DOI]
-
90. Pasichnyi O, Wallin J, Kordas O. Data-driven building archetypes for urban building energy modelling. Energy. 2019;181:360-377.[DOI]
-
91. Abdul Mujeebu M, Bano F. Energy-saving potential and cost-effectiveness of active energy-efficiency measures for residential building in warm-humid climate. Energy Sustain Dev. 2022;67:163-176.[DOI]
-
92. Shi L, Luo Z, Matthews W, Wang Z, Li Y, Liu J. Impacts of urban microclimate on summertime sensible and latent energy demand for cooling in residential buildings of Hong Kong. Energy. 2019;189:116208.[DOI]
-
93. Skelhorn CP, Levermore G, Lindley SJ. Impacts on cooling energy consumption due to the UHI and vegetation changes in Manchester, UK. Energy Build. 2016;122:150-159.[DOI]
-
94. Salvati A, Coch Roura H, Cecere C. Assessing the urban heat island and its energy impact on residential buildings in Mediterranean climate: Barcelona case study. Energy Build. 2017;146:38-54.[DOI]
-
95. Kong D, Cheshmehzangi A, Zhang Z, Ardakani SP, Gu T. Urban building energy modeling (UBEM): a systematic review of challenges and opportunities. Energy Effic. 2023;16(6):69.[DOI]
-
96. Johari F, Peronato G, Sadeghian P, Zhao X, Widén J. Urban building energy modeling: State of the art and future prospects. Renew Sustain Energy Rev. 2020;128:109902.[DOI]
-
97. Dabirian S, Miller C, Adli A, Eicker U. Gaussian-based plug load profile prediction in non-residential buildings archetype. Appl. Energy. 2024;374:123970.[DOI]
-
98. Banfi A, Ferrando M, Li P, Shi X, Causone F. Integrating occupant behaviour into Urban-Building Energy Modelling: A review of current practices and challenges. Energies. 2024;17(17):4400.[DOI]
Copyright
© The Author(s) 2025. This is an Open Access article licensed under a Creative Commons Attribution 4.0 International License (https://creativecommons.org/licenses/by/4.0/), which permits unrestricted use, sharing, adaptation, distribution and reproduction in any medium or format, for any purpose, even commercially, as long as you give appropriate credit to the original author(s) and the source, provide a link to the Creative Commons license, and indicate if changes were made.
Publisher’s Note
Science Exploration remains a neutral stance on jurisdictional claims in published
maps
and institutional affiliations. The views expressed in this article are solely those
of
the author(s) and do not reflect the opinions of the Editors or the publisher.
Share And Cite


Science Exploration Style
Anand A, Rajasekaran E, Deb C. Analyzing urban building energy demand under UHI influence in the tropical megacity of Mumbai. J Build Des Environ. 2025;3:202561. https://doi.org/10.70401/jbde.2025.0016
Tips
Copy completed.
Submit a Manuscript
Author Instructions
Cite this Article
Article Metrics
0
View
0
Download
Cited
Article Updates

Science Exploration Style
Anand A, Rajasekaran E, Deb C. Analyzing urban building energy demand under UHI influence in the tropical megacity of Mumbai. J Build Des Environ. 2025;3:202561. https://doi.org/10.70401/jbde.2025.0016
copy