Assessing urban flood resilience: A coupled AHP-entropy-GIS approach
Yusi Liu
1
,
Junxue Zhang
1,*

,
Ashish T. Asutosh
2
,
Yingnan Li
3,4
*Correspondence to:
Junxue Zhang, School of Civil engineering and Architecture, Jiangsu University of Science and Technology, Zhenjiang 212100, Jiangsu, China.
E-mail: zjx2021@just.edu.cn
J Build Des Environ. 2026;4:2025105. 10.70401/jbde.2026.0024
Received: November 11, 2025Accepted: January 19, 2026Published: January 26, 2026
Abstract
Against the backdrop of global climate anomalies and rapid urbanization, rainfall-induced urban flooding has become increasingly frequent. Wuxi, a city in southern Jiangsu Province, suffers annual casualties and economic losses due to flooding, leading to urban chaos. This study proposes a quantitative evaluation of the level of urban flood resilience using a system of resilience evaluation indicators. An evaluation indicator system for urban flood resilience encompassing infrastructure, environment, society, and economy was constructed with 26 indicators. A hybrid multi-criteria decision-making method integrating the Analytic Hierarchy Process, entropy weight method, and GIS technology was developed to assess flood resilience in Wuxi systematically. Additionally, emergy analysis was applied to evaluate urban sustainability. The results indicate that five administrative districts centered in Liangxi District and parts of Yixing City near water bodies exhibit low resilience due to gentle slopes, proximity to active river channels, and high population density. In contrast, most areas of Jiangyin City demonstrate higher resilience owing to elevated terrain, fewer social vulnerabilities, and advanced economic development. The model’s consistency was validated using the Area Under the Curve (AUC) method, yielding an AUC of 0.843. The Emergy Sustainability Index for Wuxi was 0.08 < 1, indicating an unsustainable state. This study provides actionable recommendations for enhancing urban flood management and regional resilience.
Keywords
Resilience, emergy analysis, GIS, urban flooding
1. Introduction
With global warming, extreme precipitation is expected to intensify in most regions worldwide, potentially increasing the intensity and frequency of floods, and imposing heavy costs on human society and economies[1]. Flood disasters are among the most frequent and widespread disasters globally[2]. Recent studies predict that under future climate change scenarios, the frequency and intensity of flood disasters may increase significantly[3]. Additionally, factors such as rapid urbanization, population growth, and economic development will continue to exacerbate global flood risks[4,5]. According to the 2022 National Top Ten Natural Disasters released by the Ministry of Emergency Management[6], half were flood-related disasters, accounting for approximately 53% of total deaths and missing persons and 54% of direct economic losses. Building urban resilience is considered an effective measure to address urban disaster issues[7]. It has been applied in various fields related to disaster risk management, sustainable development, and environmental science[8].
The term “resilience” is derived from the Latin word “Resilientem”, meaning to rebound or bounce back[9]. In the context of disaster risk reduction and management, resilience is defined as the ability of a system, community, or society to resist, absorb, adapt to, and recover from disasters promptly and effectively, including maintaining and restoring its basic structures and functions[10]. For urban areas, resilience has been defined as the ability to face the adverse impacts of extreme events and to adapt and respond to various disturbances[11]. Disaster resilience is a specific type of resilience, referring to the resilience of specific parts of a system to specific disturbances, with waterlogging disaster resilience being a more refined category within this framework[12].
Therefore, it is crucial to enhance flood resilience when addressing urban waterlogging issues. Substantial research has employed Multi-Criteria Decision Analysis (MCDA) frameworks to quantify this multifaceted concept. Common methodologies include the Analytic Hierarchy Process (AHP), which leverages expert knowledge to derive subjective indicator weights[13-15], and the entropy weight method, which calculates objective weights based on data dispersion[16-20]. The integration of GIS has further enabled the spatial visualization and analysis of resilience patterns, providing essential insights for planners[21,22]. However, both the AHP and entropy weight methods have limitations when used in isolation. The subjective nature of AHP may introduce bias, while the purely data-driven entropy method might neglect critical expert-based contextual knowledge. To enhance the robustness of the weighting process and mitigate the drawbacks of single-method approaches, this study adopts a hybrid weighting strategy that integrates AHP and the entropy weight method. This is combined with GIS technology for spatial analysis and visualization.
Cities are complex systems where society, economy, nature, and infrastructure interact in multiple ways[23]. Existing waterlogging-related resilience assessment systems often overemphasize objective factors while neglecting subjective factors. Urban waterlogging resistance capacity not only depends on urban system construction but also considers the behavior of different actors under dynamic rainfall conditions. The available indicators are limited to the top policy level and lack research on the underlying strategies. In addition, most of the existing research data sources are single statistics, which do not allow for a refined assessment process.
To address these gaps, this study introduces a comprehensive assessment framework. First, it establishes a multi-indicator urban flood resilience system structured around four core dimensions: Infrastructure, Environment, Society, and Economy. The hybrid AHP-entropy weighting method is applied within a GIS platform to quantitatively and spatially assess resilience across the city of Wuxi, a typical rapidly urbanizing area in China. Second, the study incorporates emergy analysis, an ecological economics method pioneered by H.T. Odum[24], to evaluate urban sustainability. Emergy analysis converts inputs and outputs of different forms into a common unit of solar energy, enabling a unified assessment of socio-economic and ecological performance[25]. This method has been effectively applied to evaluate sponge city projects in China[26-28]. For Wuxi, we construct an emergy-based sustainability model, employing indices like the Emergy Sustainability Index (ESI) to provide holistic, dimensionally consistent guidance for optimizing flood management strategies.
In summary, while a foundation for resilient city research exists both domestically and internationally—with assessment frameworks expanding into multiple dimensions to include socio-economic factors, indicators becoming more refined, methodologies evolving from single to multi-method modeling for greater objectivity, and the adaptability of evaluation systems improving—research on urban resilience by domestic scholars remains largely at the preliminary stage of theoretical exploration. Quantitative resilience assessment still lacks authoritative standards and practical validation. By integrating a hybrid MCDA-GIS model with systemic emergy analysis, this study aims to provide a holistic tool that combines spatial diagnostics with sustainability evaluation, thereby offering a more systematic and actionable scientific basis for urban flood resilience planning.
The objectives of this study are to: (1) propose a flood resilience assessment framework applicable to Wuxi based on the current research; (2) formulate a flood assessment index system for Wuxi, quantify the indexes using multi-source data, and quantitatively assess the flood resilience by using an assignment method combining hierarchical analysis and entropy weighting; (3) analyze the distributional characteristics of the urban flood resilience of the study area and verify the accuracy of the assessment framework by using the flooding event Area Under the Curve (AUC) curve; (4) make specific recommendations for flood disaster management and urban planning in the study area based on the emergy method.
2. Data and Methodology
2.1 Study area
Wuxi City, located in the southeastern part of Jiangsu Province, China (31°07′-32°02′N, 119°33′-120°38′E), serves as a nationally critical flood control city (Figure 1). The city covers a total area of 4,627.47 km2, with mountainous and hilly regions spanning 3,687.85 km2 and water bodies occupying 939.61 km2. As part of the Jiangnan Watertown region, Wuxi lies within the Taihu Lake Basin of the middle and lower reaches of the Yangtze River, characterized by an intricate network of rivers and well-developed water systems. The terrain is predominantly flat, interspersed with low mountains and residual hills. The southern region comprises a water-network plain, the northern area consists of a high-sand plain, the central zone is a low-lying polder water network, and the southwestern part features elevated low mountains and hills. Precipitation is concentrated from June to August, accounting for approximately 46% of the annual rainfall. The unique geographical location and climatic conditions render Wuxi highly susceptible to frequent flood disasters[29].
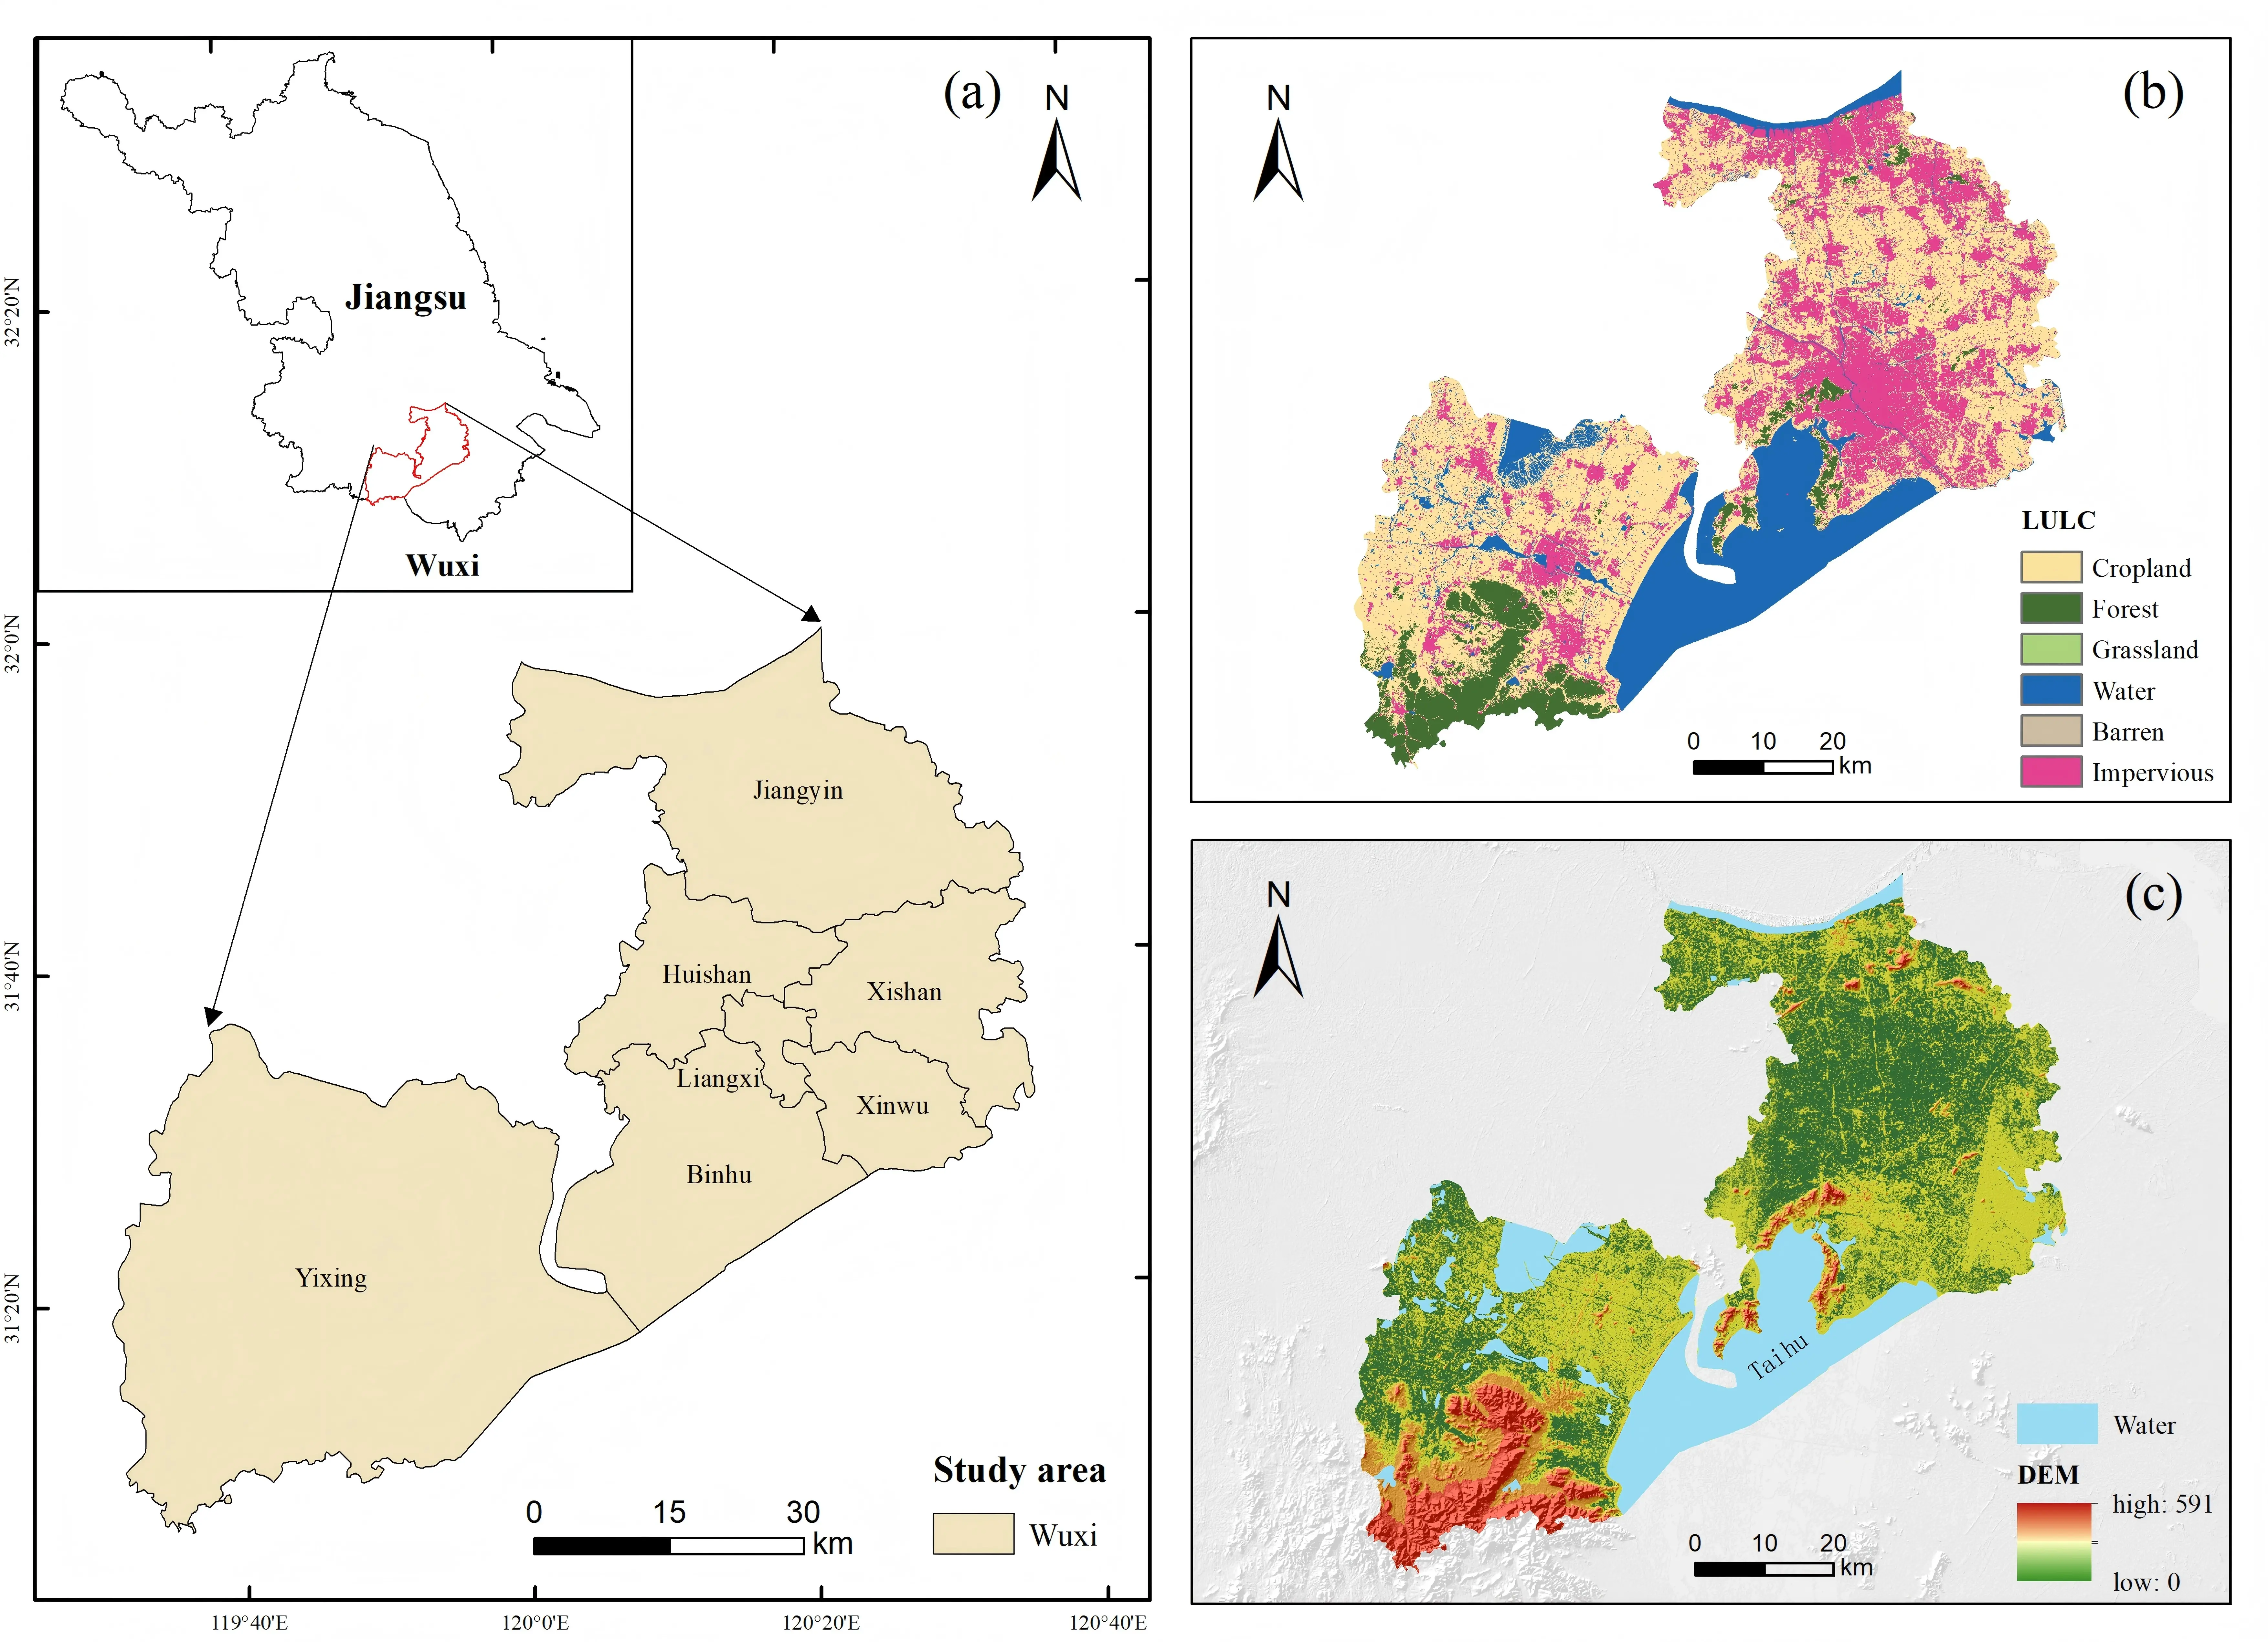
Figure 1. (a) Geographical location of the study area; (b) Land use classification; (c) Topographic features.
2.2 Data acquisition and preparation technique
Establishing a scientific evaluation index system and criteria is pivotal for assessing urban resilience to waterlogging disasters. Drawing on internationally recognized frameworks—Bruneau et al.’s TOSE model[30], Cutter’s DROP model[31], and Marasco et al.’s PEOPLES model[32]—the urban flood resilience of Wuxi is categorized into four dimensions, tailored to local characteristics. Infrastructure Dimension: Challenges in Wuxi’s old urban areas include outdated drainage pipelines, insufficient long-term planning, and low construction standards for drainage facilities. Certain roads and low-lying zones suffer from inadequate elevation and suboptimal drainage network design. Additionally, changes in urban underlying surfaces, such as the conversion of permeable land to impermeable surfaces, diminish infiltration capacity, exacerbating waterlogging risks. Environmental Dimension: Bordered by the Yangtze River to the north and Taihu Lake to the south, Wuxi’s dense river network and spatially heterogeneous rainfall patterns contribute to localized extreme precipitation events. Maximum rainfall occurs in June, with summer precipitation constituting 44% of the annual total. The topography slopes from higher elevations in the southwest to lower elevations in the central region.
Social Dimension: Floods disproportionately impact vulnerable populations, including the elderly, children, and those reliant on minimum living allowances. Mobile phone and internet usage play critical roles in disaster preparedness education and early warning dissemination.
Economic Dimension: Economically vulnerable groups, such as low-income rural residents, face greater challenges in post-disaster recovery. Medical infrastructure, investment, and personnel are vital for rapid rehabilitation. The city’s industrial composition and economic development level significantly influence both disaster susceptibility and recovery capacity.
Through extensive literature review and expert consultation, 26 indicators were selected to construct Wuxi’s urban waterlogging resilience evaluation system. The selection criteria for the indicators in this study and the methodology flowchart are summarized and presented in Table 1 and Figure 2, respectively.
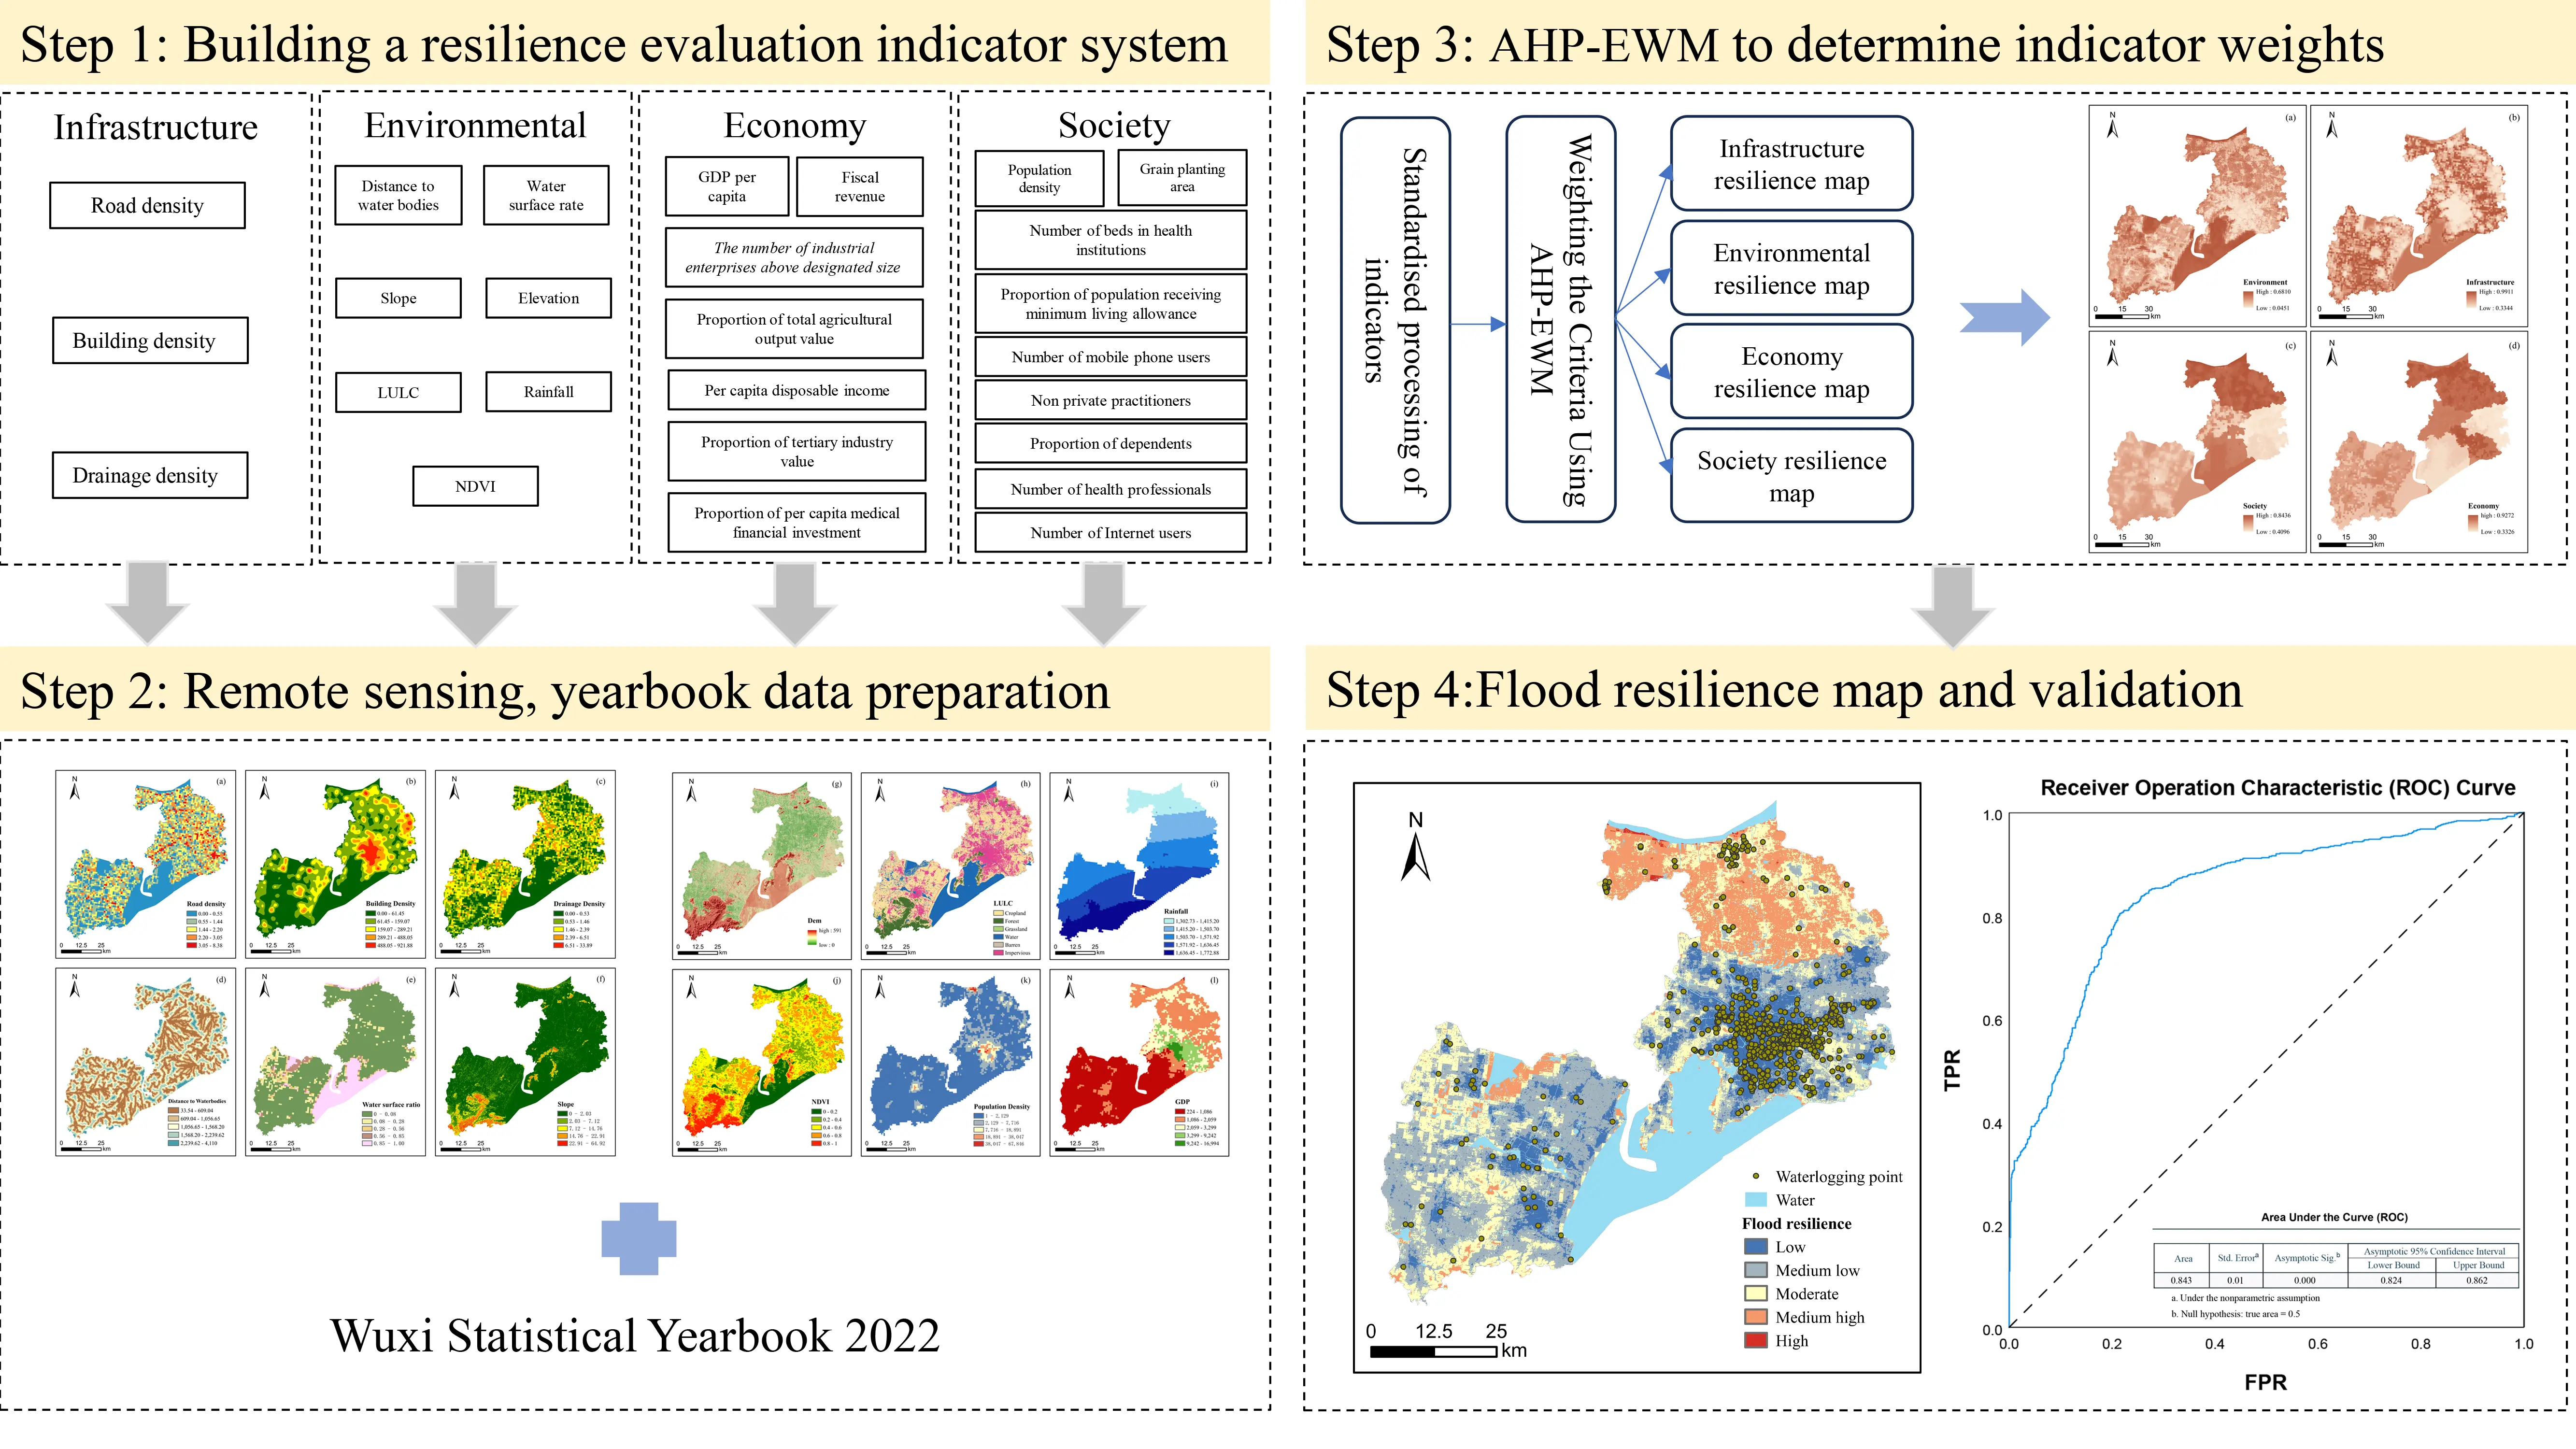
Table 1. Urban flood resilience evaluation index system and selection basis.
| Criterion Layer | Parameters | Index Selection Basis | Affect | |
| Infrastructure | Road density | Road density affects evacuation speed, with more routes contributing to resilience[33,34]. | + | |
| Building density | High building density reduces infiltration capacity due to increased impervious cover, leading to a higher risk of surface flooding[35]. | - | ||
| Drainage density | Drainage networks can discharge rainwater in a timely manner, reducing flood occurrence[36]. | + | ||
| Environment | Distance to water bodies | The closer an area is to rivers and lakes, the higher the flood risk[37]. | + | |
| Water surface rate | A higher water surface rate provides more natural storage, enabling efficient stormwater recycling and discharge[38]. | + | ||
| Slope | Slope determines flood velocity, making it an important evaluation index[39]. | + | ||
| Elevation | Low-lying areas are more prone to rain and flood damage[22]. | + | ||
| LULC | Different land use types have varying rainwater infiltration rates[40]. | - | ||
| Rainfall | Rainfall acts as the principal trigger of flooding by generating surface runoff[41,42]. | - | ||
| NDVI | NDVI is an important indicator of vegetation cover, which absorbs large amounts of rainwater and reduces waterlogging[43]. | + | ||
| Economy | GDP per capita | Areas with higher GDP per capita are more resilient to floods[44]. | + | |
| The number of industrialenterprises above the designated size | Large companies are more resilient to flooding[45]. | + | ||
| Proportion of total agricultural output value | Waterlogging disasters have statistically significant detrimental impacts on agricultural productivity[46]. | - | ||
| Per capita disposable income | Higher disposable income enables faster recovery from floods[47]. | + | ||
| Proportion of tertiary industry value | A larger share of tertiary output reduces vulnerability to flooding and increases regional resilience[45]. | + | ||
| Proportion of per capita medical financial investment | Greater financial investment in healthcare per capita increases city resilience to flooding[45]. | + | ||
| Fiscal revenue | Fiscal revenue represents local government economic strength. Higher fiscal revenue enhances resilience to flood disasters[45]. | + | ||
| Society | Population density | Higher population density increases flood disaster damage[48,49]. | - | |
| Number of beds in healthinstitutions | More beds enable more patients to be treated during and after disasters[34]. | + | ||
| Grain planting area | Larger crop areas increase vulnerability to flooding and reduce resilience[46]. | - | ||
| The proportion of population receiving a minimum living allowance | Vulnerable populations with low economic capacity and poor living conditions have weaker disaster-coping abilities[50]. | - | ||
| Number of mobile phone users | The number of mobile phone subscribers affects the speed of disaster information transmission[51]. | + | ||
| Non private practitioners | The greater job security and organizational support associated with non-private sector employment reduce social vulnerability, thereby enhancing regional resilience[45]. | + | ||
| Number of Internet users | The number of Internet users affects the speed of disaster information transmission[51]. | + | ||
| Proportion of dependents | Dependents are less resilient to disasters[52]. | - | ||
| Number of health professionals | Health workers can provide relief during and after floods[34]. | + |
LULC: Land Use and Land Cover; NDVI: Normalized Difference Vegetation Index; GDP: Gross Domestic Product.
2.3 Data processing
This study employs a GIS-based multi-criteria method to quantify urban flood resilience. The data types and sources required for the study are shown in Table 2. Basic social and economic data for 2022 were obtained from the Wuxi Statistical Yearbook. Environmental and infrastructure data sources include the Resource and Environmental Science Data Center of the Chinese Academy of Sciences, the Geospatial Data Cloud, and previous research results. For vector data, ArcGIS conversion functions were used to convert vector data into raster data to unify the basic units of the indicators. During data processing, data that could not directly reflect the indicators were spatially processed. All data were standardized to obtain xi, and the weights ωi for each indicator were calculated using the AHP-entropy weight method. By calculating the weighted average of each layer, the resilience value of each grid cell to urban waterlogging was obtained. The spatial resolution of each grid layer was set to 30 m × 30 m, and the projected coordinate system used was WGS_1984_UTM_Zone_50N.
3. Weighting the Criteria Using AHP-EWM
To determine the weights of each quantified indicator, this framework adopts a mature method that combines subjective and objective weighting approaches. Specifically, the AHP is used to calculate the subjective weights of the indicators, while the entropy weight method is used to determine the objective weights. These two methods are then combined to provide a comprehensive assessment of urban waterlogging resilience. The AHP, proposed by Saaty in 1980, is an effective decision-making method that creates a hierarchical structure by assigning weights to each indicator, reducing the complexity of decision-making[53]. Saaty’s AHP provides a method for solving various decision-making problems and is a powerful tool in hazard management as it considers multiple evaluation parameters and converts each parameter into a score for effective judgment. The AHP is the most widely used multi-criteria decision-making method in flood studies[54] and has been extensively applied to calculate indicator weights[55]. The EWM relies more on the internal relationships of the raw data, determining the weights of each indicator by calculating their entropy values. The smaller the entropy value, the more effective information the indicator provides, and the greater its weight. Combining these two methods effectively reduces the conflict between subjectivity and objectivity, improving the accuracy and reliability of weight allocation.
Before calculating the indicator weights, this study standardizes the raw data by applying the min-max normalization method to ensure consistency and comparability of all indicators. The basic calculation formulas are as follows:
Positive indicators:
Negative indicators:
Where Xij is the original value of the indicator, and Yij is the standardized data. i = 1,2,...,n; j = 1,2,...,m.
4. Analytic Hierarchy Process
4.1 Hierarchical structure model construction
Based on the primary factors influencing waterlogging disasters and their interrelationships, a hierarchical structure model was constructed, comprising three layers from top to bottom: the goal layer, criterion layer, and indicator layer. Taking the urban flood resilience framework proposed in this study as an example, the goal layer corresponds to the urban resilience index, the criterion layer includes infrastructure, environment, society, and economy, while the indicator layer consists of specific measurable indicators.
4.2 Judgment matrix formulation
A pairwise comparison judgment matrix was constructed to evaluate the relative importance of peer indicators with respect to their subordinate indicators through pairwise comparison. Since the significance of factors varies in contributing to urban flood resilience, comparisons of relative importance were conducted for indicators within the same hierarchy using the 1-9 scale method (Table 3).
Table 3. Saaty’s pairwise comparison scale.
| Scale | Meaning |
| 1 | Equally important |
| 3 | Moderately more important |
| 5 | Strongly more important |
| 7 | Very strongly more important |
| 9 | Extremely more important |
| 2,4,6,8 | Intermediate values |
4.3 Consistency check
The maximum eigenvalue and its corresponding eigenvector were calculated for each matrix. A consistency check was performed using the consistency index (CI), random consistency index (RI), and consistency ratio (CR). If the test passed, the normalized eigenvector was adopted as the weight vector; otherwise, the pairwise comparison matrix was reconstructed. The formulas are as follows:
where λmax is the maximum eigenvalue, n is the number of indicators, CI is the consistency index, and RI is the average random consistency index (values listed in Table 4). The matrix passes the consistency test if CR < 0.1.
Table 4. Average randomness index.
| N | 1 | 2 | 3 | 4 | 5 | 6 | 7 | 8 | 9 | 10 |
| RI | 0 | 0 | 0.52 | 0.89 | 1.12 | 1.26 | 1.36 | 1.41 | 1.46 | 1.49 |
RI: random consistency index.
4.4 Entropy weight method
(1) Calculate the proportion Pij of the indicator value for the j-th evaluation subject under the i-th indicator:
(2) Compute the entropy value ej:
(3) Determine the indicator weight wj:
To address the limitations of a single weighting method, a combined weighting approach integrating subjective weighting (AHP) and objective weighting (entropy method) was adopted. The combined weight Zj was calculated as:
A hierarchical structure model based on the indicator system was established, and the AHP-entropy method was applied to determine the relative importance of indicators at each level. MATLAB software was used to compute the individual and combined weights of all indicators. Using grid units as the fundamental units for resilience assessment ensured granularity in the evaluation process. The final indicator weights are summarized in Table 5. Remote sensing data are illustrated in the Figure 3.
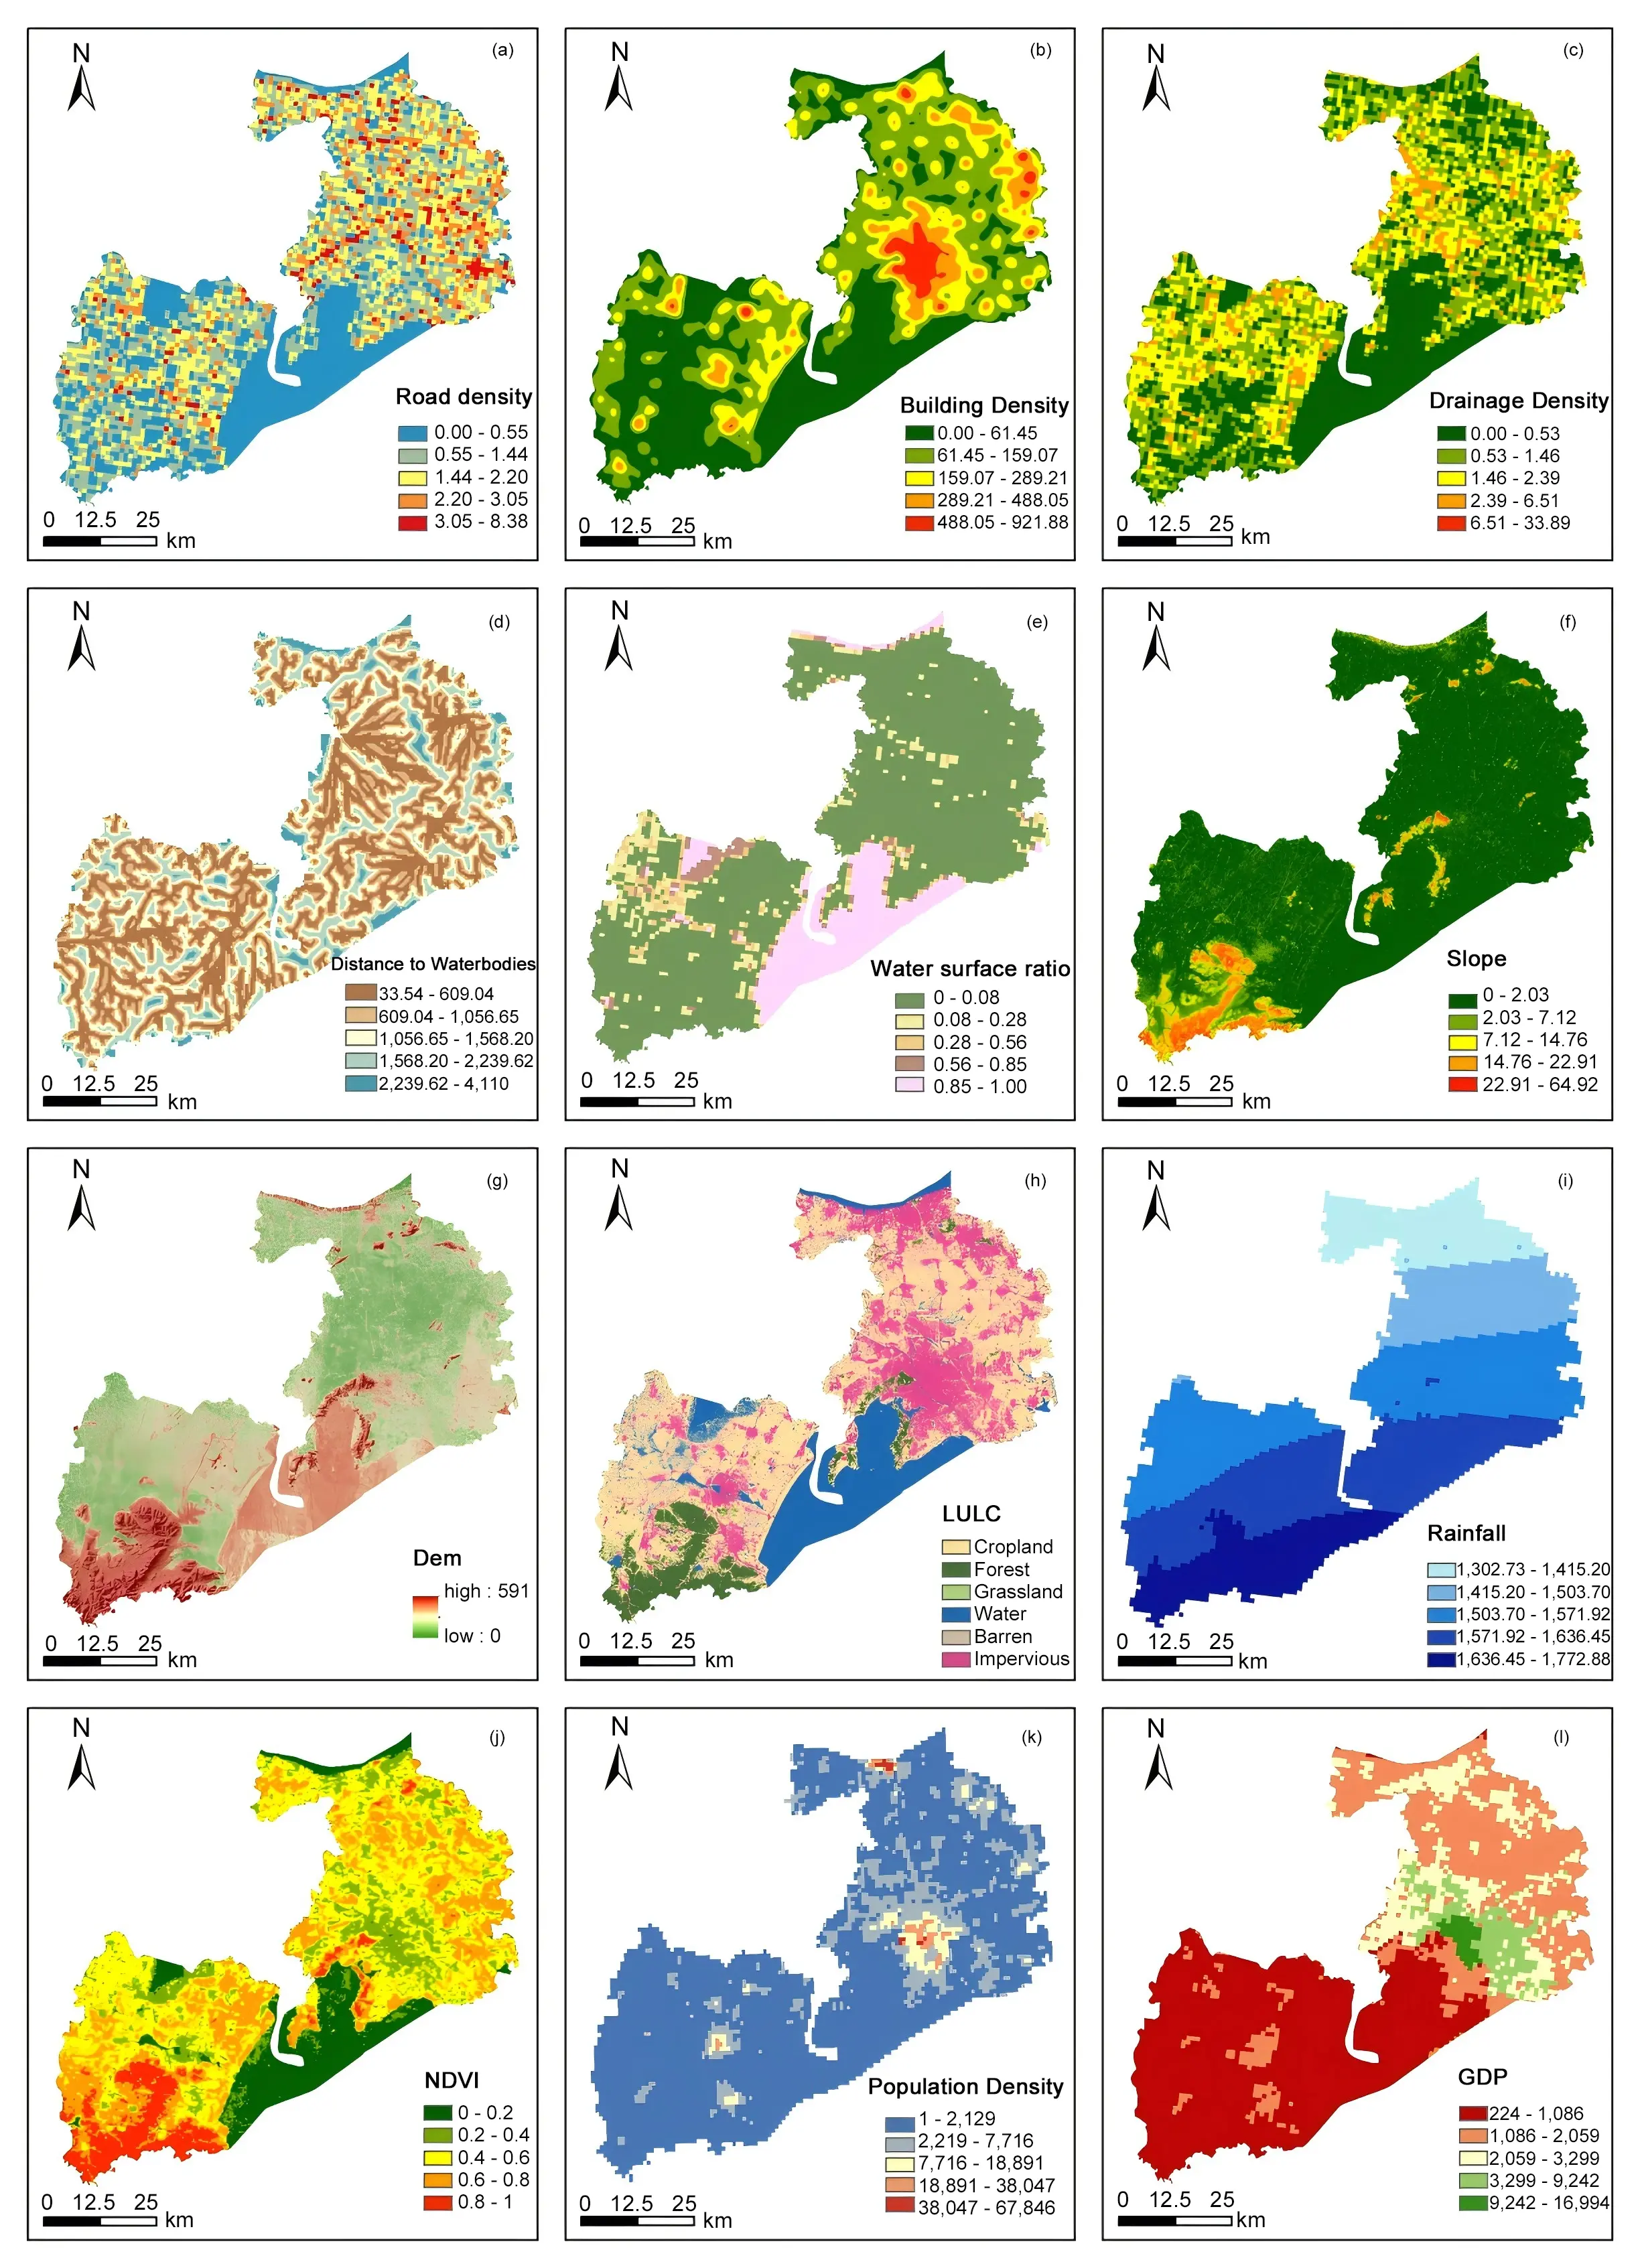
Table 5. Weight of flood resilience index.
| Criterion Layer | Criterion Layer weight | Index layer | AHP weight | EWM weight | Combined weight |
| Infrastructure | 0.4139 | Road density | 0.103 | 0.024 | 0.071 |
| Building density | 0.207 | 0.017 | 0.101 | ||
| Drainage density | 0.103 | 0.043 | 0.128 | ||
| Environment | 0.3578 | Distance to water bodies | 0.03 | 0.042 | 0.036 |
| Water surface rate | 0.041 | 0.093 | 0.108 | ||
| Slope | 0.031 | 0.066 | 0.059 | ||
| Elevation | 0.036 | 0.093 | 0.097 | ||
| LULC | 0.086 | 0.02 | 0.049 | ||
| Rainfall | 0.061 | 0.046 | 0.081 | ||
| NDVI | 0.072 | 0.025 | 0.052 | ||
| Economy | 0.0943 | GDP per capita | 0.021 | 0.066 | 0.040 |
| The number of industrial enterprises above the designated size | 0.014 | 0.027 | 0.011 | ||
| Proportion of total agricultural output value | 0.006 | 0.029 | 0.005 | ||
| Per capita disposable income | 0.018 | 0.028 | 0.015 | ||
| Proportion of tertiary industry value | 0.005 | 0.05 | 0.008 | ||
| Proportion of per capita medical financial investment | 0.013 | 0.031 | 0.015 | ||
| Fiscal revenue | 0.013 | 0.034 | 0.013 | ||
| Society | 0.1340 | Population density | 0.032 | 0.026 | 0.024 |
| Number of beds in healthinstitutions | 0.01 | 0.044 | 0.013 | ||
| Grain planting area | 0.005 | 0.018 | 0.002 | ||
| The proportion of population receiving a minimum living allowance | 0.022 | 0.021 | 0.013 | ||
| Number of mobile phone users | 0.009 | 0.027 | 0.007 | ||
| Non private practitioners | 0.012 | 0.029 | 0.010 | ||
| Number of Internet users | 0.009 | 0.025 | 0.007 | ||
| Proportion of dependents | 0.02 | 0.023 | 0.013 | ||
| Number of health professionals | 0.014 | 0.053 | 0.022 |
AHP: Analytic Hierarchy Process; EWM: entropy weight method; LULC: Land Use and Land Cover; NDVI: Normalized Difference Vegetation Index.
4.5 Emergy approach
This study employs the emergy analysis method established by H.T. Odum to quantify the utilization efficiency of resource inputs and outputs, including material and energy flows, within the system. The emergy analysis method converts diverse energy and material flows of different categories and properties in ecological-economic systems into a unified standard of solar emergy, enabling quantitative evaluation of environmental loads and sustainability[56]. Emergy theory transforms various types and qualities of energy into a standardized energy metric, overcoming barriers to the unified evaluation of heterogeneous energy forms and significantly simplifying energy assessment complexity.
The latest emergy baseline (12 × 1024 sej/a) was adopted, with raw data sourced from the 2023 Wuxi Statistical Yearbook. Emergy transformation rates were referenced from relevant literature[57-61]. Based on the collection of 2022 foundational data on Wuxi’s natural geography, socioeconomics, and other aspects, emergy theory and related analytical indicators were applied for data processing. Aligned with Wuxi’s sponge city development context, seven major components were selected: renewable resources, locally renewable resource products, non-renewable natural resources, locally non-renewable resource products, imported emergy, exported emergy, and waste emergy. Emergy indicators were systematically organized from emergy analysis tables, and eight ecological metrics encompassing economic, social, and environmental dimensions were chosen, including emergy density, environmental loading ratio (ELR), emergy yield ratio (EYR), ESI, emergy-based sustainable development index (EISD), emergy exchange ratio (EER), emergy self-sufficiency ratio (ESR), and waste-to-renewable emergy ratio.
The emergy calculation formulas are as follows:
Solar emergy = Area × Annual average solar radiation
Rainwater chemical emergy = Area × Annual rainfall × Gibbs free energy × Water density
Rainwater potential emergy = Area × Average elevation × Annual rainfall × Water density × Gravitational acceleration
Wind energy = Area × Height × Air density × Eddy diffusivity × Wind speed gradient
Geothermal energy = Area × Heat flux per unit area
Topsoil loss emergy = Area × Erosion rate × Organic content in eroded soil × Organic matter energy
Other emergy = Energy × Emergy transformation rate
Product output emergy = Yield × Energy conversion coefficient × Emergy transformation rate
5. Results and Discussion
5.1 Overall resilience analysis
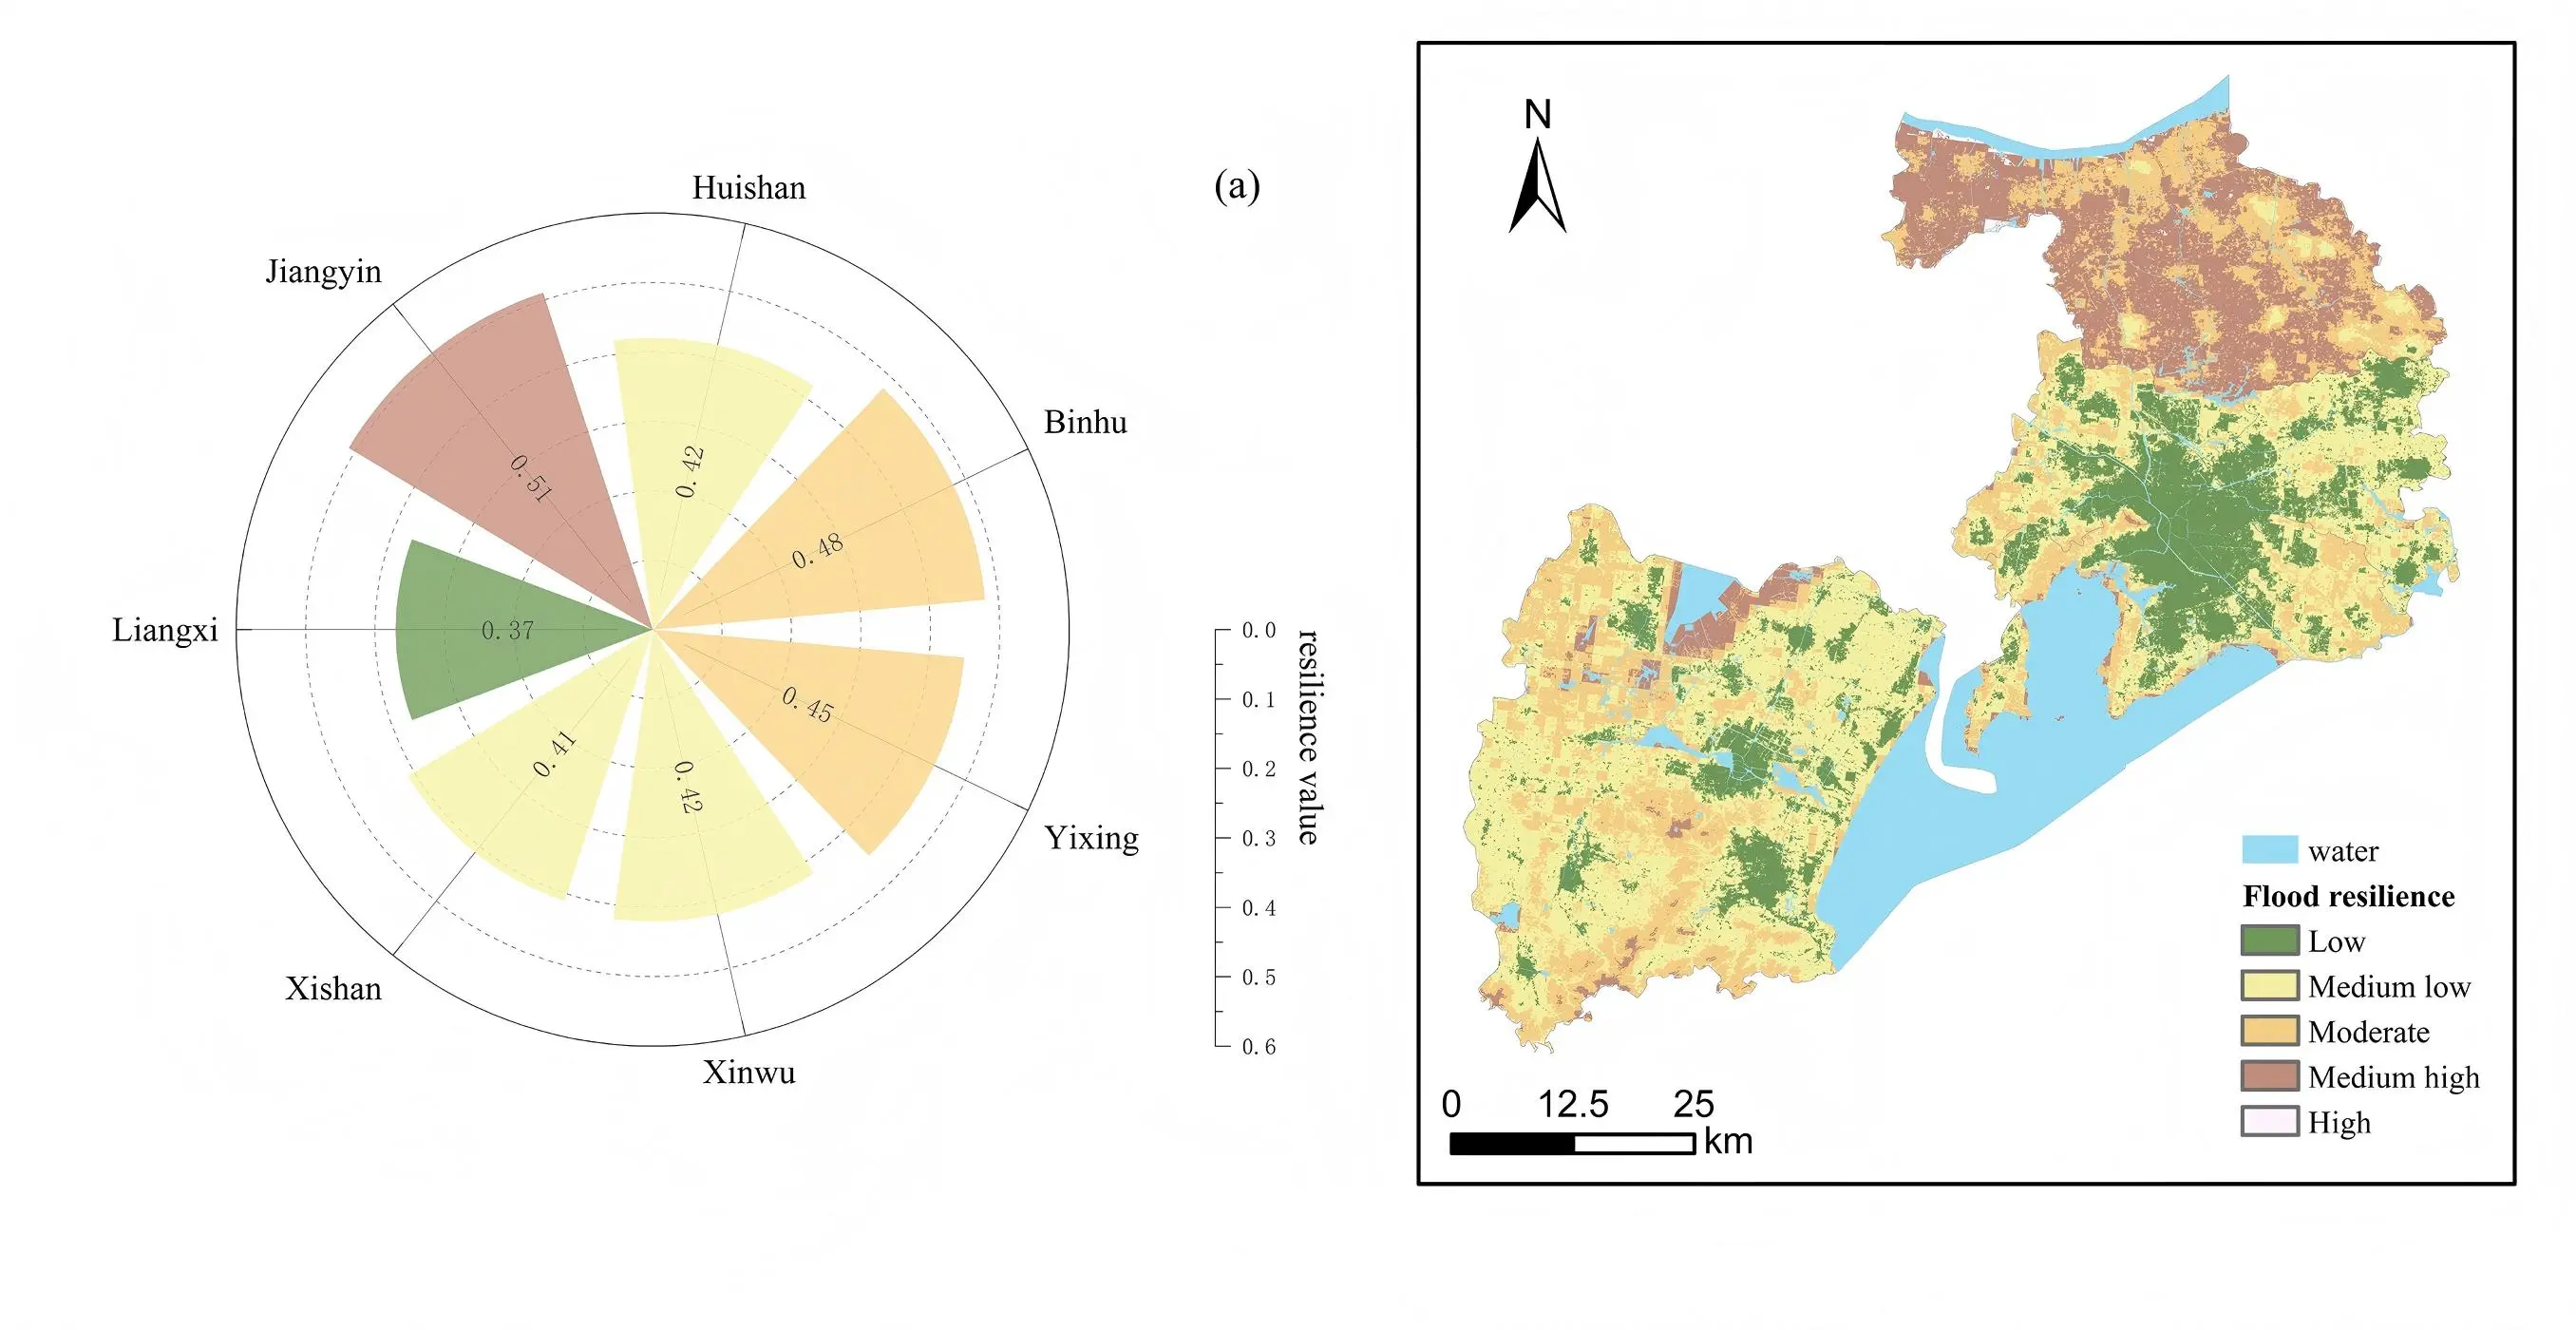
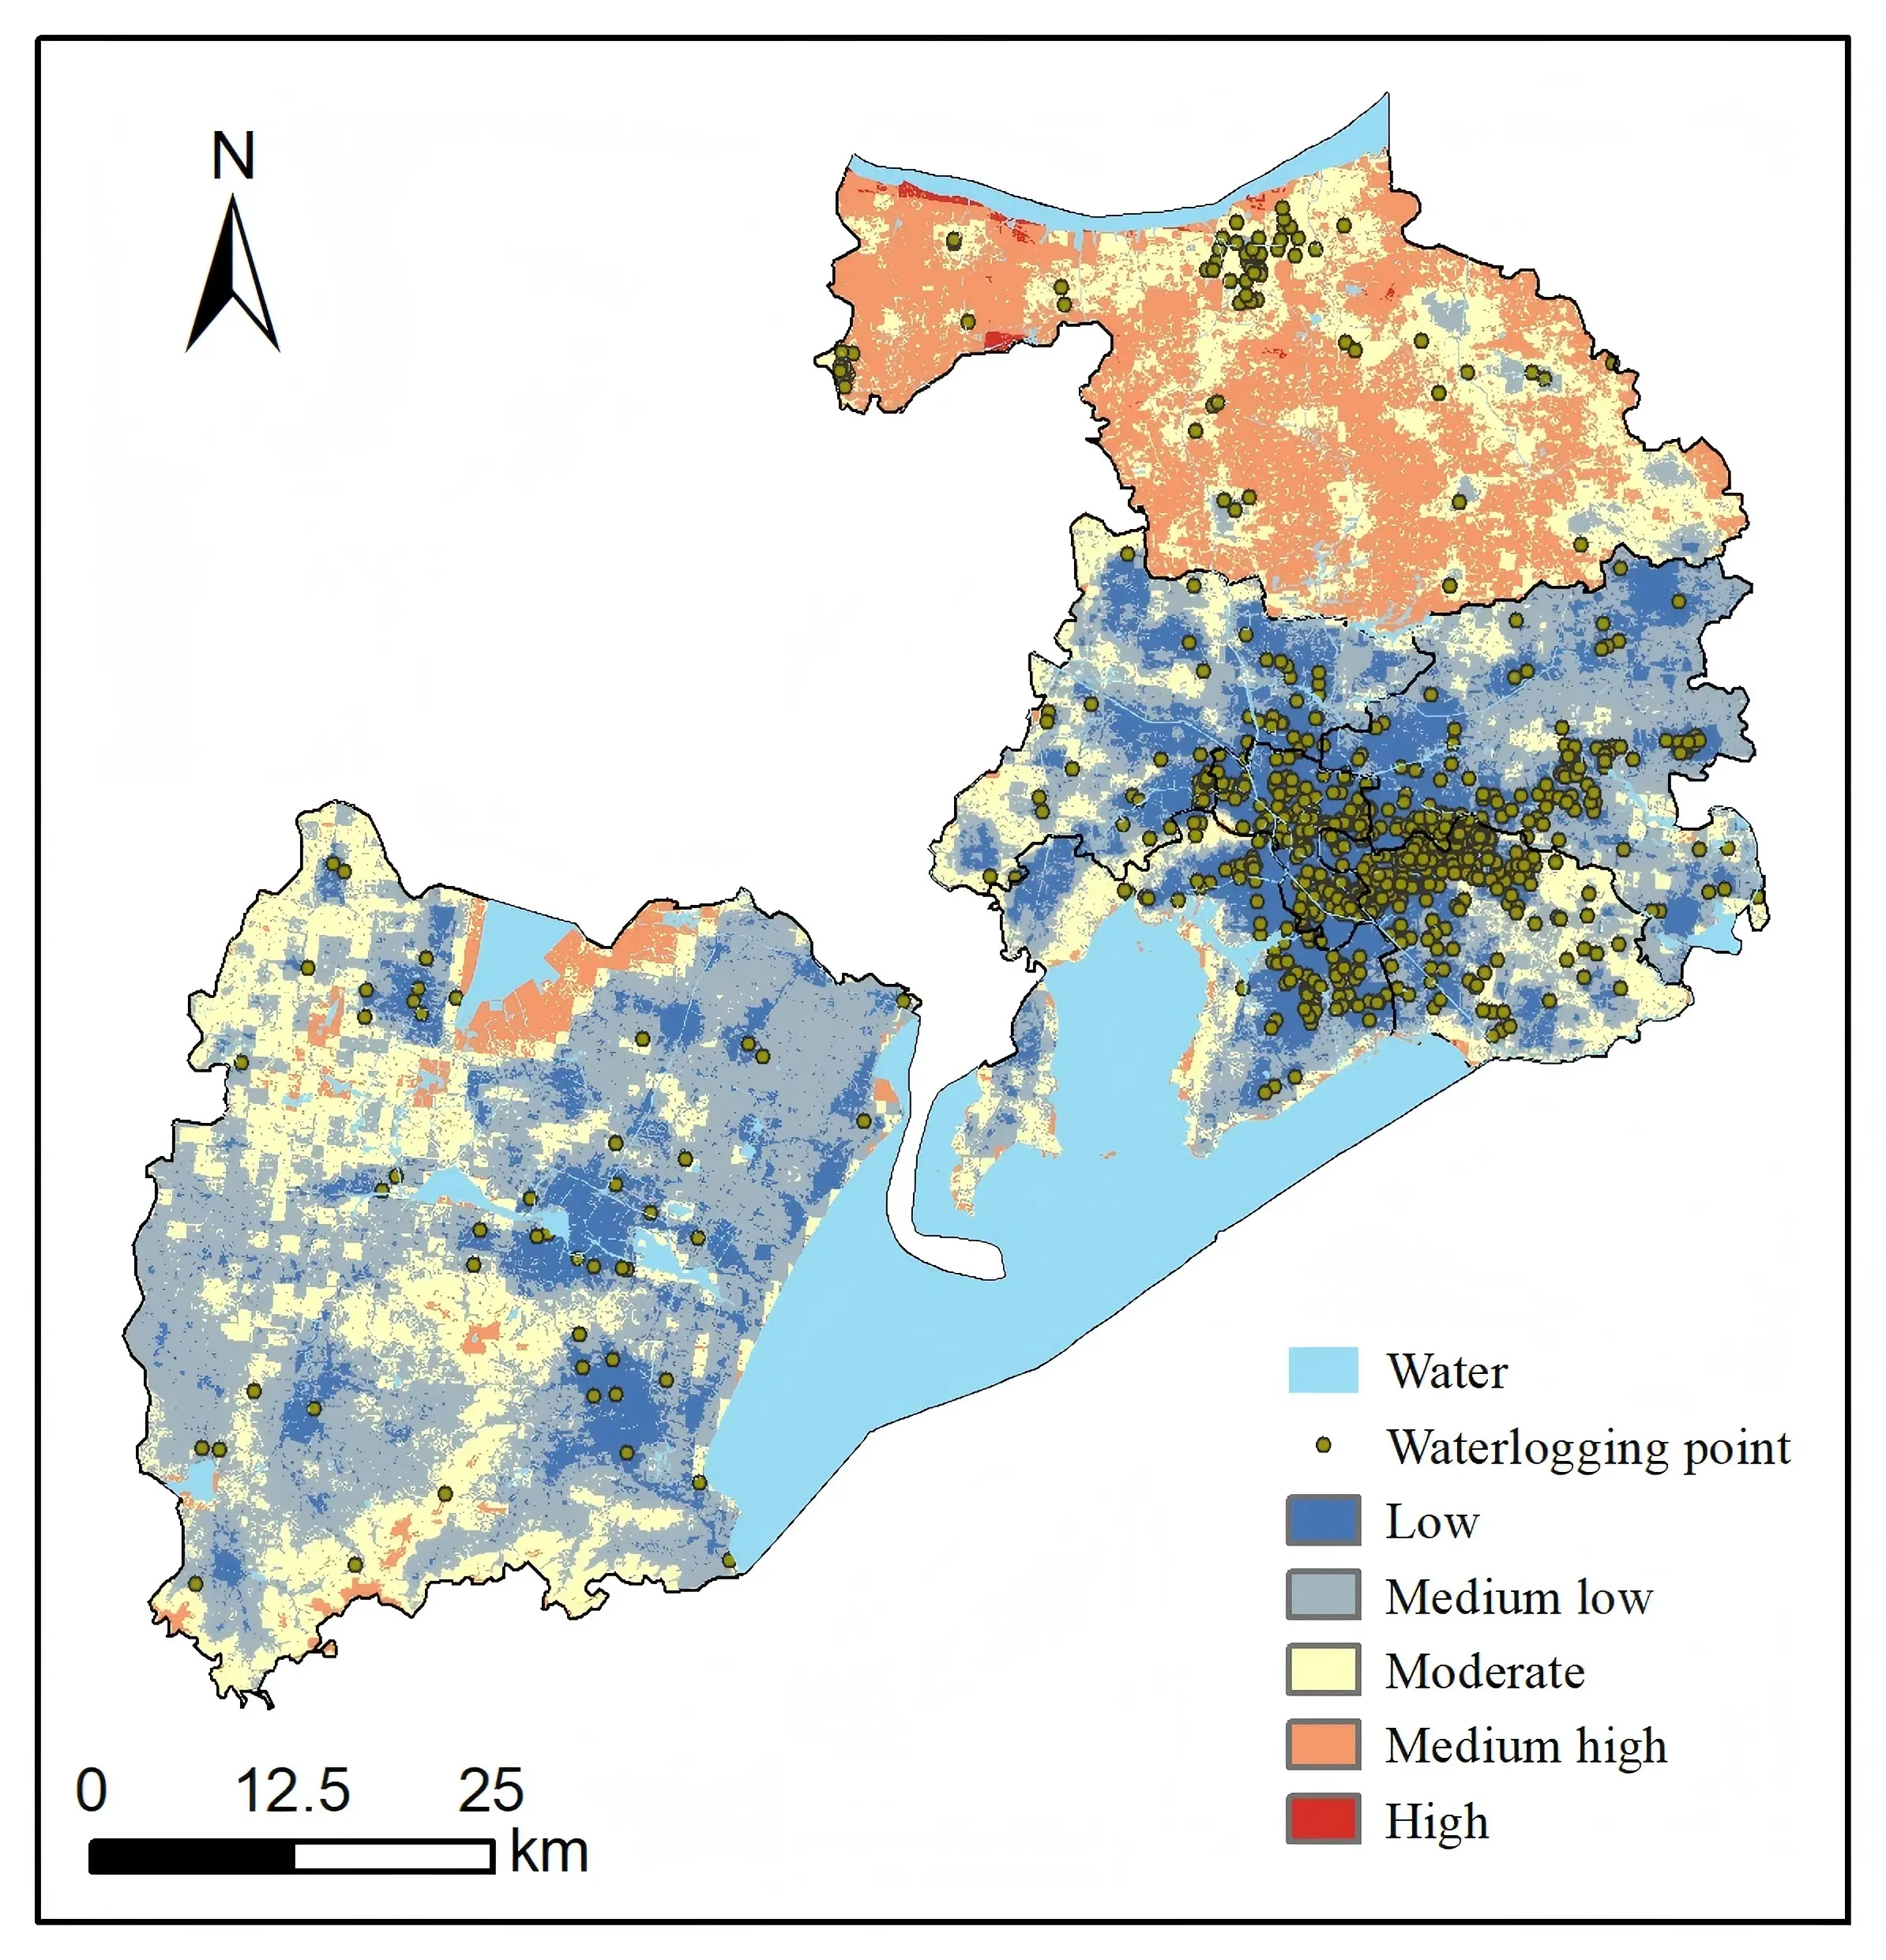
To quantitatively assess the spatial heterogeneity of flood resilience, a comprehensive GIS-based overlay analysis was conducted. First, all collected raster datasets for the evaluation indicators were standardized to a common scale using the ArcGIS Raster Calculator, thereby eliminating dimensional inconsistencies and ensuring comparability. Subsequently, the combined indicator weights derived from the integrated AHP-Entropy method were systematically applied to these standardized layers through weighted overlay analysis within the Spatial Analyst module. This process synthesized the multi-dimensional criteria into a composite flood resilience index for Wuxi City. The continuous resilience index was then classified to interpret the spatial patterns. Using the Natural Breaks (Jenks) classification method, which optimally groups similar values to maximize between-class variance, the index was reclassified into five distinct resilience tiers with the “Reclassify” tool. The resulting area proportions are: Low (15.72%), Medium-Low (32.28%), Moderate (23.14%), Medium-High (27.81%), and High (1.05%).
Figure 4 visually encapsulates the final assessment, depicting the composite resilience levels across Wuxi's seven administrative districts under pluvial flood scenarios. A clear spatial dichotomy is evident. The central urban core, encompassing Liangxi District and adjacent low-lying areas of Yixing City, is identified as a vulnerability hotspot. This is attributable to a confluence of risk factors: low topographic elevation, proximity to active water channels, gentle slopes that impede rapid drainage, and high population density. Conversely, northwestern Jiangyin City and the southern/northwestern sectors of Yixing City emerge as high-resilience zones. These areas benefit from an advantageous synergy of inherent and adaptive traits: elevated terrain, steeper slopes that enhance natural runoff, lower population density, greater surface permeability, and the robust economic capacity associated with advanced development, which supports stronger infrastructure and faster recovery.
5.2 Infrastructure and environmental resilience analysis
The overall resilience map and the resilience values for each district are displayed in Figure 5 and Figure 6, respectively. The analysis reveals pronounced spatial disparities in infrastructure and environmental resilience across Wuxi City, with a distinct vulnerability core identified in the central urban area. A cluster of twenty-one towns and subdistricts, radiating from Liangxi District, consistently exhibits the lowest resilience levels. This pattern is primarily attributed to a synergistic accumulation of risk factors characteristic of dense urban cores: low-lying topography, minimal vegetation coverage, and extremely high urban density. As Wuxi’s historic central area, Liangxi District epitomizes this vulnerability. Its landscape is dominated by densely packed buildings and extensive impervious surfaces, which have largely replaced natural vegetated areas. This widespread surface hardening fundamentally disrupts the natural hydrological cycle by drastically increasing surface runoff coefficients and severely limiting the landscape’s innate capacity for rainwater retention and infiltration. Compounding this issue is excessive underground development, which may alter sub-surface flow paths and further reduce natural water storage potential.
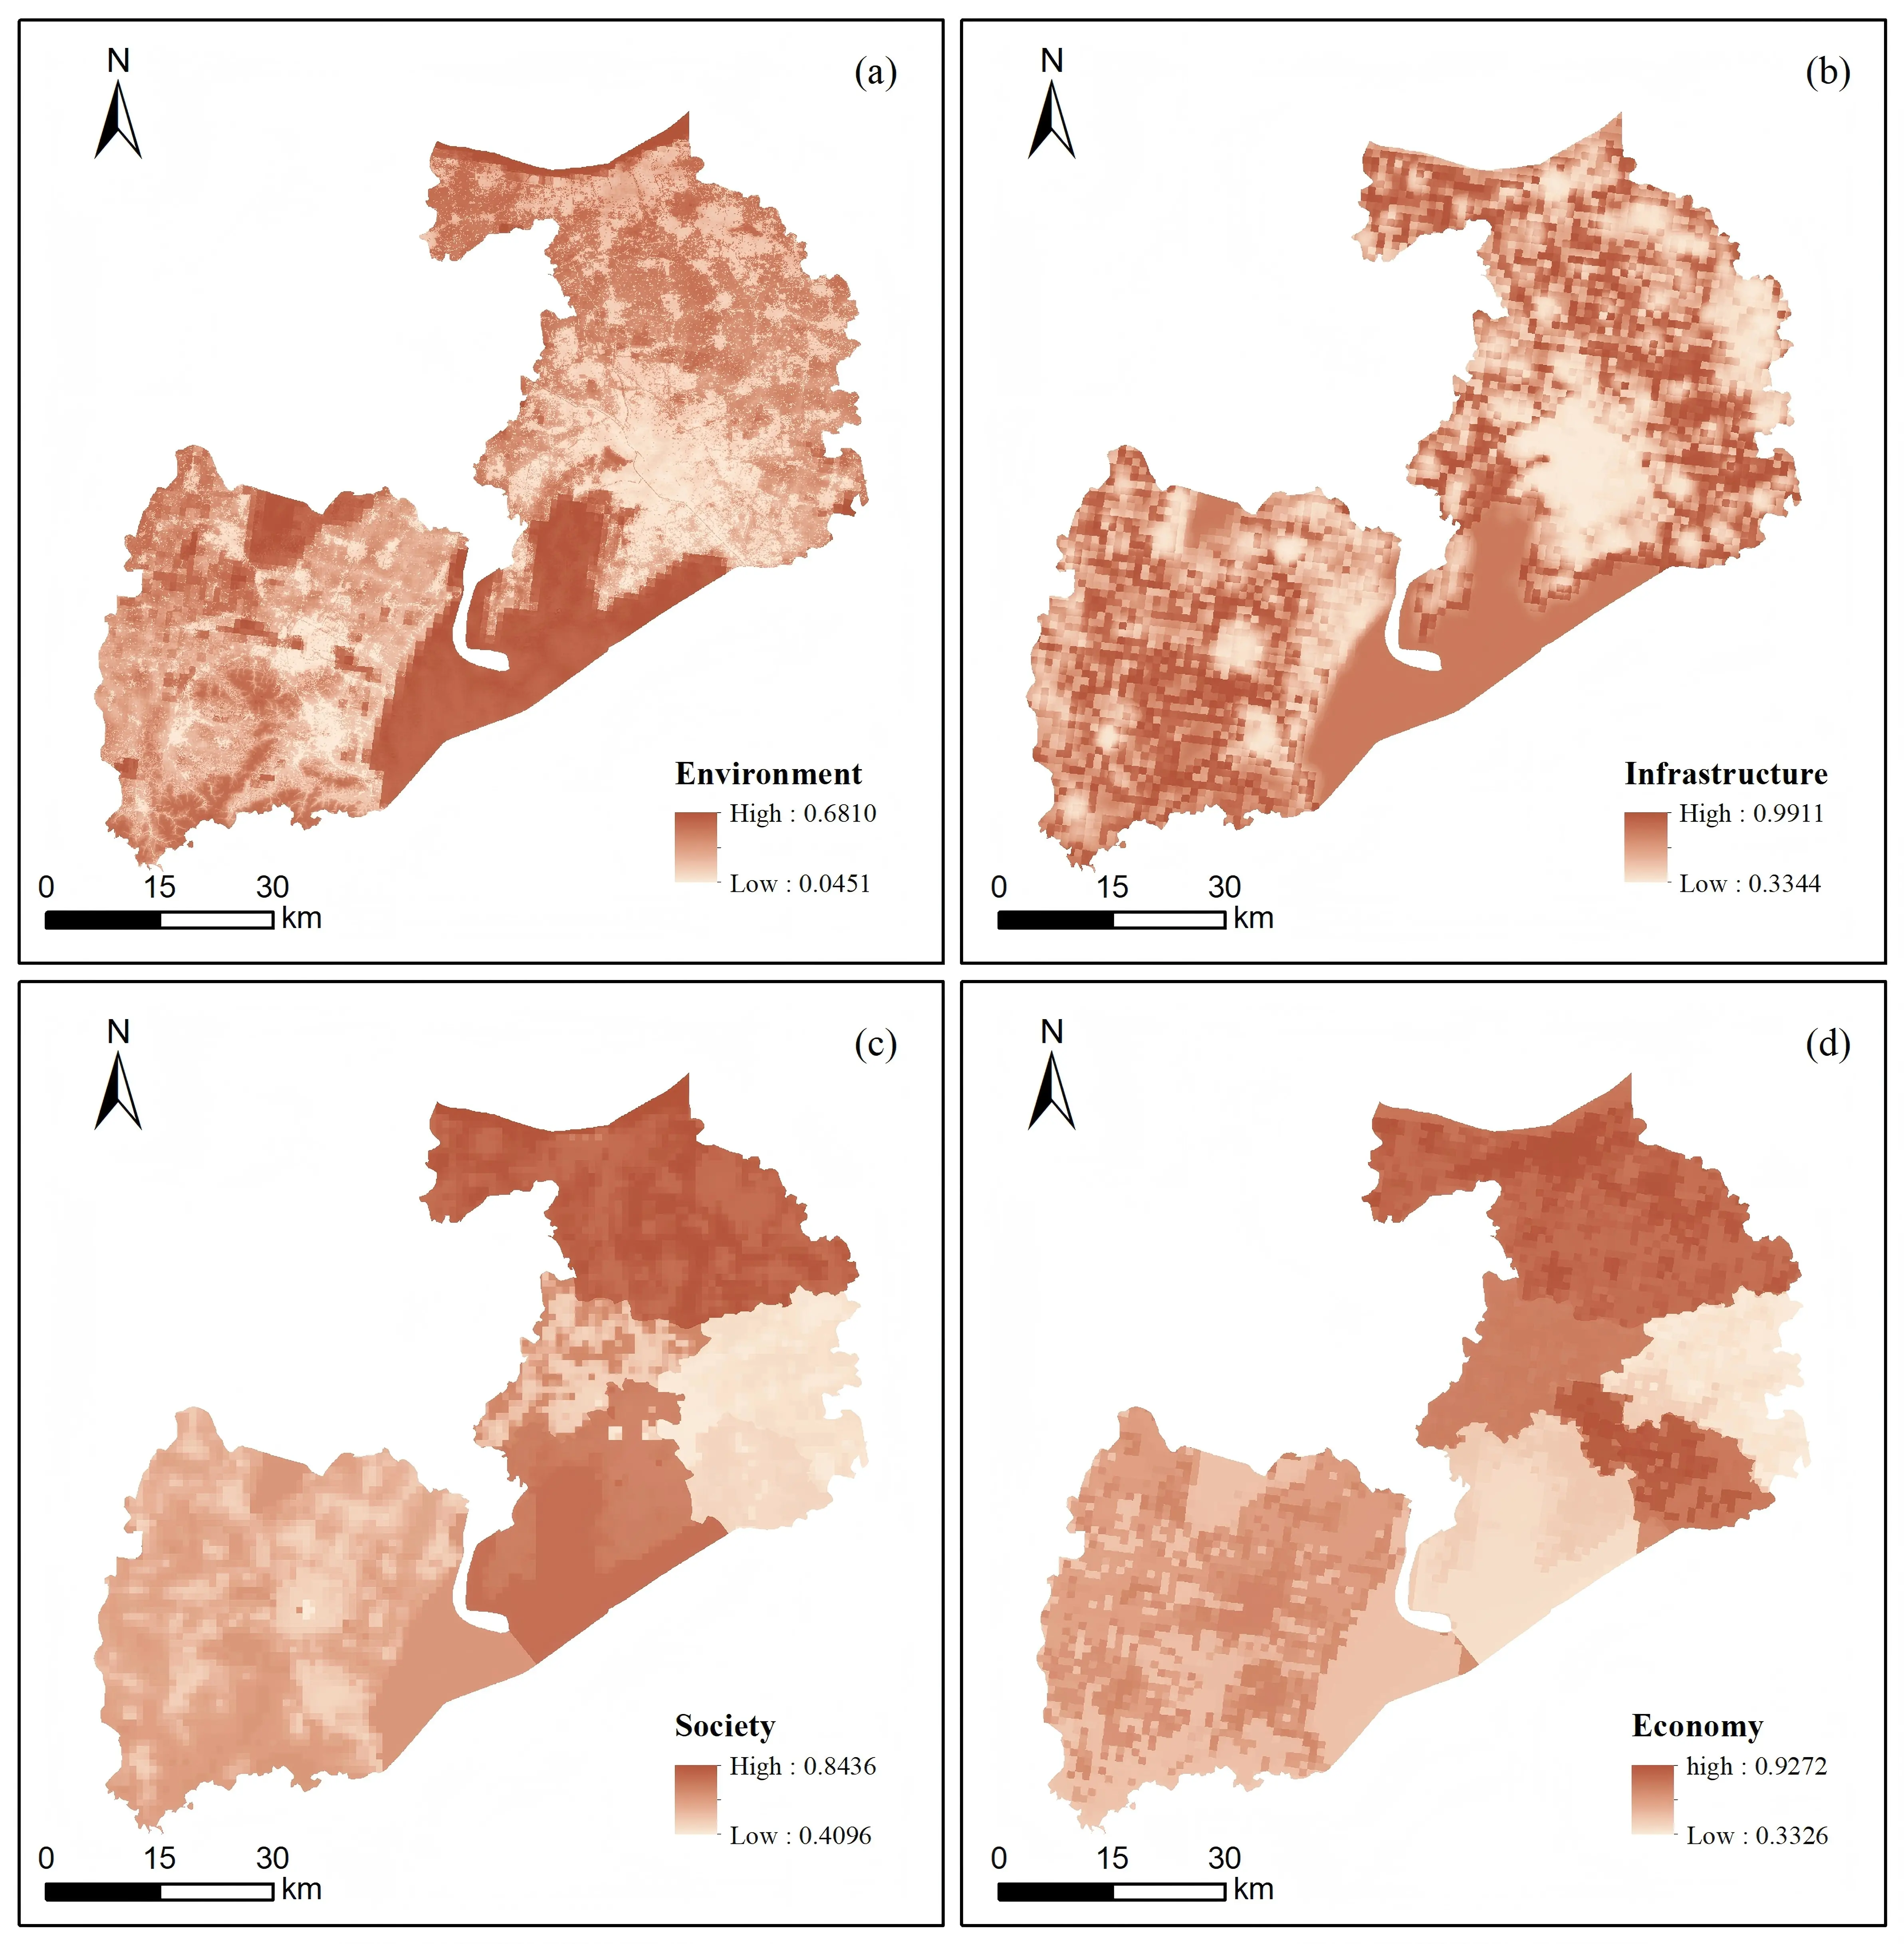
Figure 5. Spatial resilience distribution of infrastructure, environment, society and economy.
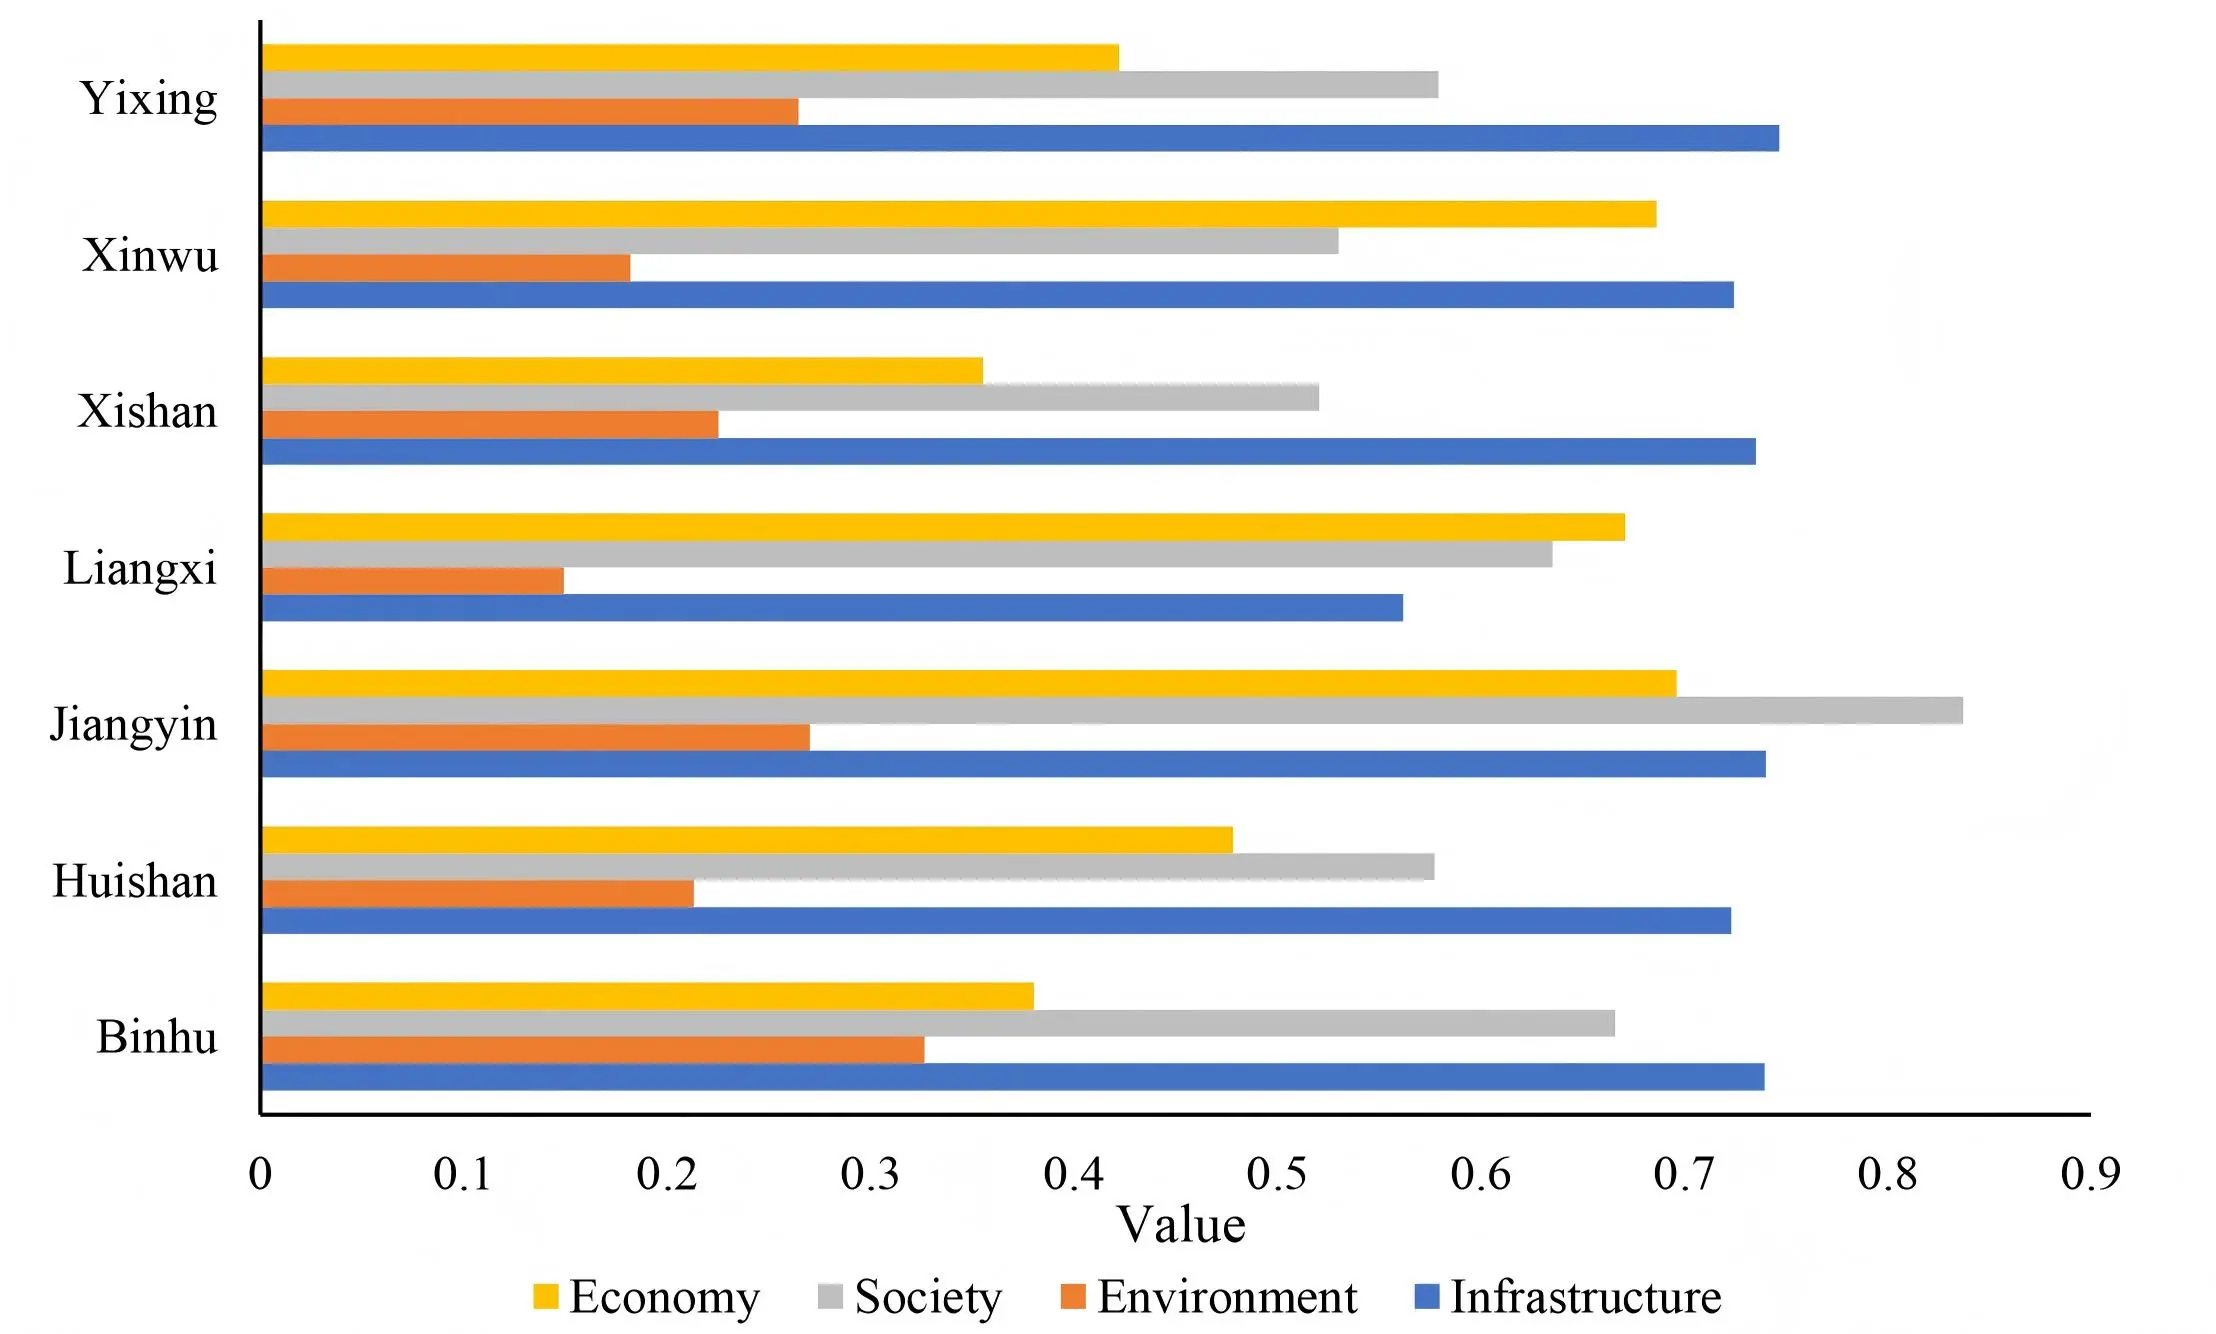
Figure 6. Environmental, social, economic and infrastructure resilience index for districts.
Beyond the central core, specific low-resilience zones are identified in other districts, each with distinct yet interlinked causal pathways: In Jiangyin City, subdistricts like Gushan Town and Chengjiang Subdistrict show lower resilience. Here, gentle terrain slows natural drainage, while widespread surface hardening from development reduces infiltration. This, coupled with a relatively high local precipitation and limited natural water surface area, weakens the region's overall capacity for stormwater retention and storage. In Yixing City, areas such as Yicheng Subdistrict present a different profile. Despite experiencing lower precipitation, their resilience is compromised by high road density, significant conversion of green space to impervious cover, and a topographic disadvantage, which promotes runoff convergence and increases exposure to pluvial flooding. In Binhu District, low-resilience zones are strategically located at topographic depressions, often along roads at the foot of hills. These areas act as natural sinks for surface runoff. During intense rainfall, the insufficient capacity of drainage infrastructure at these critical points, combined with frequent blockages of stormwater inlets by debris, creates acute bottlenecks that rapidly exacerbates waterlogging risks.
5.3 Economic and social resilience analysis
Social resilience exhibits significant inter-district variation, closely tied to demographic structure and institutional capacity. Jiangyin City and Binhu District emerge as areas of relatively high social resilience. This strength is largely underpinned by their superior endowment of healthcare resources, including a substantial number of health professionals and well-equipped medical facilities. This robust infrastructure forms a critical foundation for providing effective disaster relief and medical assistance during and after flood events. Jiangyin City, in particular, ranks highest in social resilience. This leading position can be attributed to its favorable employment structure, characterized by a large non-private sector workforce associated with greater job security and organizational support, coupled with the highest internet penetration rate among the studied districts. This combination ensures not only economic stability for households but also enables the efficient, timely dissemination of early warnings and disaster-related information, facilitating coordinated public response and post-disaster recovery. Conversely, parts of Huishan District, Xishan District, and Yixing City are characterized by lower social resilience. These areas face compounded challenges: high population density increases the number of people at risk, while a larger proportion of socio-economically vulnerable populations reduces the community’s aggregate capacity to prepare for and absorb shocks. This inherent vulnerability is exacerbated by comparatively insufficient flood prevention preparedness, medical service capacity, and limitations in sanitary infrastructure, creating a gap between needs and available response resources during crises.
Strong economic capacity is a critical factor in enhancing a city’s ability to withstand and recover from disasters. Districts like Binhu District and Xishan District display lower economic resilience. This is primarily due to their below-average per capita GDP, an economic base with a higher reliance on agriculture, a sector highly sensitive to climate disruptions and limited fiscal revenues. These constraints restrict the local governments’ ability to invest in large-scale, resilient infrastructure and comprehensive social safety nets. In stark contrast, economically robust regions such as Jiangyin City, Liangxi District, and Huishan District demonstrate higher resilience. Their strength stems from higher per capita disposable incomes and economies dominated by more diversified and less climate-sensitive secondary and tertiary sectors. This economic profile generates greater and more stable fiscal revenues. Consequently, local governments in these regions possess enhanced capacity to allocate substantial investments into advanced flood prevention infrastructure, early warning systems, and disaster mitigation programs. This financial and institutional capacity directly translates into an improved regional ability to absorb economic shocks and accelerate post-disaster recovery, forming a virtuous cycle of investment and resilience building.
The analysis underscores that socio-economic resilience is not monolithic but is results from a complex interplay of employment structure, communication infrastructure, healthcare capacity, economic diversification, and fiscal strength. These factors collectively determine a region's intrinsic ability to prepare for, cope with, and recover from flood disturbances.
5.4 Emergy analysis
Table 6, Table 7, Table 8, Table 9 and Table 10 present the emergy analysis of Wuxi City, encompassing renewable emergy, local renewable resource products in 2022, non-renewable natural environmental emergy in 2022, local non-renewable resource products in 2022, monetary flows in 2022, and waste flows.
Table 6. Renewable energy emergy calculation results.
| Item | Original Data (J/t/$) | UEV (sej/unit) | Emergy (sej) |
| Sunlight | 9.39E+21 | 1.00E+00 | 9.39E+21 |
| Wind | 1.41E+18 | 6.23E+02 | 8.76E+20 |
| Rain (chemical potential) | 3.58E+16 | 1.82E+04 | 6.52E+20 |
| Rain (geopotential) | 3.98E+17 | 8.89E+03 | 3.53E+21 |
| Earth’s Rotational Energy | 6.71E+15 | 5.80E+04 | 3.89E+20 |
Table 7. Locally Renewable Resource Products emergy calculation results.
| Item | Original Data (J/t/$) | UEV (sej/unit) | Emergy (sej) |
| Grain | 9.01E + 15 | 1.10E + 05 | 9.91E + 20 |
| Oil Crops | 2.95E + 14 | 8.90E + 04 | 2.63E + 19 |
| Fruits | 6.00E + 14 | 8.90E + 04 | 5.34E + 19 |
| Vegetables | 3.02E + 15 | 7.40E + 04 | 2.24E + 20 |
| Meat | 3.68E + 13 | 5.30E + 06 | 1.95E + 20 |
| Aquatic Products | 4.15E + 14 | 2.00E + 06 | 8.30E + 20 |
| Egg | 4.81E + 13 | 4.40E + 06 | 2.12E + 20 |
| Milk | 1.08E + 13 | 3.30E + 06 | 3.55E + 19 |
Table 8. Non-Renewable Natural Resources and Local Non-Renewable Resource Products emergy calculation results.
| Item | Original Data (J/t/$) | UEV (sej/unit) | Emergy (sej) |
| Soil Loss | 1.10E + 12 | 1.68E + 09 | 1.84E + 21 |
| Cement | 1.90E + 07 | 1.98E + 15 | 3.77E + 22 |
| Fertilizer | 4.41E + 04 | 4.62E + 15 | 2.04E + 20 |
| Steel | 1.13E + 07 | 1.78E + 15 | 2.01E + 22 |
| Plastics | 2.95E + 06 | 3.80E + 14 | 1.12E + 21 |
| Pesticides | 1.91E + 09 | 2.03E + 09 | 3.88E + 18 |
| Electricity | 5.03E + 10 | 7.20E + 11 | 3.62E + 22 |
Table 9. Input emergy calculation results.
| Item | Original Data (J/t/$) | UEV (sej/unit) | Emergy (sej) |
| Imports | 3.79E + 10 | 1.13E + 12 | 4.28E + 22 |
| Foreign Investment | 3.83E + 09 | 2.7E + 12 | 1.03E + 22 |
| Tourism Revenue | 2.03E + 10 | 5E + 12 | 1.02E + 23 |
| Raw Coal | 5.04E + 17 | 6.69E + 04 | 3.37E + 22 |
| Coke | 1.27E + 17 | 1.10E + 05 | 1.40E + 22 |
| Diesel | 1.84E + 15 | 1.11E + 05 | 2.04E + 20 |
| Gasoline | 7.75E + 14 | 5.40E + 04 | 4.19E + 19 |
| Natural Gas | 2.31E + 17 | 4.80E + 04 | 1.11E + 22 |
| Fuel Oil | 2.34E + 14 | 5.40E + 04 | 1.27E + 19 |
Table 10. Output and waste emergy calculation results.
| Item | Original Data (J/t/$) | UEV (sej/unit) | Emergy (sej) |
| Exports | 7.28E + 10 | 5.96E + 12 | 4.34E + 23 |
| Waste Gas | 1.09E + 12 | 6.66E + 08 | 7.29E + 20 |
| Wastewater | 1.71E + 14 | 1.88E + 06 | 3.22E + 20 |
| Solid Waste | 1.11E + 13 | 1.80E + 06 | 1.99E + 19 |
The calculations reveal that the total emergy input of Wuxi City in 2022 reached 3.28 × 10²³ sej. Renewable energy inputs accounted for 1.48 × 10²² sej (5% of total emergy), while local renewable resource products contributed 2.57 × 10²¹ sej (1%). Among local renewable resources, grains, aquatic products, poultry eggs, vegetables, and meats dominated the composition, collectively representing 95.51% of local renewable resource products. Non-renewable natural environmental resources constitute 1.84 × 10²¹ sej (1%), indicating a negligible combined impact of local renewable products and non-renewable natural resources on the total emergy.
The primary contributor to total emergy was imported inputs at 2.14 × 10²³ sej (65%). Among imported emergy sources, tourism revenue (48%) exerted the greatest influence, followed by imported emergy (20%) and actual utilized foreign investment (5%), with raw coal in fuels representing the largest fuel component (16%). Local non-renewable resources constituted the secondary influence, comprising cement (39.54%), chemical fertilizers (0.21%), steel (21.06%), plastics (1.18%), and electricity generation (38%), where cement emerged as the predominant factor, contributing 12% to total emergy. The total output emergy measured 4.34 × 10²³ sej, while waste flows amounted to 1.07 × 10²¹ sej.
Wuxi’s ecological emergy indicators are presented in Table 11. The emergy density of 7.1 × 10¹³ sej/m2 reflects the city’s high economic development intensity. The ESI, defined as the ratio of EYR to ELR, evaluates the sustainable development capacity of the urban ecosystem. For Wuxi in 2022, ESI = 0.08 < 1, indicating a consumer-oriented economic system due to a low EYR (1.54) and high ELR (17.86). The elevated ELR primarily stems from untreated rainwater pollutants, imposing significant environmental pressure. The low EYR suggests heavy reliance on external resources. To enhance sustainability assessment, the composite EISD was introduced, integrating socio-economic benefits and ecological pressures. With an EISD of 0.04, higher values denote greater competitive advantages in sustainable development by maximizing socio-economic returns per unit of environmental pressure. The emergy exchange ratio (EER = 0.49 < 1) reveals low emergy utilization efficiency. The emergy self-sufficiency ratio (ESR = 0.05) highlights Wuxi’s dependency on external resources, while the waste-to-renewable emergy ratio (0.06) underscores substantial environmental stress from waste emissions.
Table 11. Calculated results of ecological indicators.
| Items | Results |
| ED | 7.10E + 13 |
| ELR | 1.79E + 01 |
| EYR | 1.54E + 00 |
| ESI | 8.60E - 02 |
| EISD | 4.24E - 02 |
| EER | 0.49 |
| ESR | 0.05 |
| Waste-to-Renewable Emergy Ratio | 0.06 |
ED: emergy density; ELR: environmental loading ratio; EYR: emergy yield ratio; ESI: emergy sustainability index; EISD: emergy-based sustainable development index; EER: emergy exchange ratio; ESR: emergy self-sufficiency ratio.
5.5 Accuracy validation
To verify the reliability of the results, 816 waterlogging points were collected from municipal reports and the official government service app of Wuxi City. As shown in Figure 7. these points are predominantly distributed in areas with lower resilience values, such as Liangxi District. Extracting the corresponding resilience values for these points revealed that most waterlogging points exhibited low values across multiple dimensions, preliminarily confirming the framework’s reliability in assessing urban flood resilience under heavy rainfall and flooding conditions.
To further validate the model’s accuracy, the Receiver Operating Characteristic (ROC) curve and the AUC were employed, where a higher AUC value indicates better classification performance[62]. For validation, historical water-logging point coordinates from an official source were overlaid directly on the resilience raster to extract corresponding values. Non-waterlogging (non-event) points were generated using simple random sampling in ArcGIS at a 1:1 ratio with event points to form the training dataset. The random sampling ensured broad geographical dispersion of points across the study area. Visual inspection confirmed that points were not clustered exclusively within specific land-cover types, mitigating the risk of severe sampling bias. The resulting AUC value of 0.843 indicates acceptable model accuracy (Figure 8).
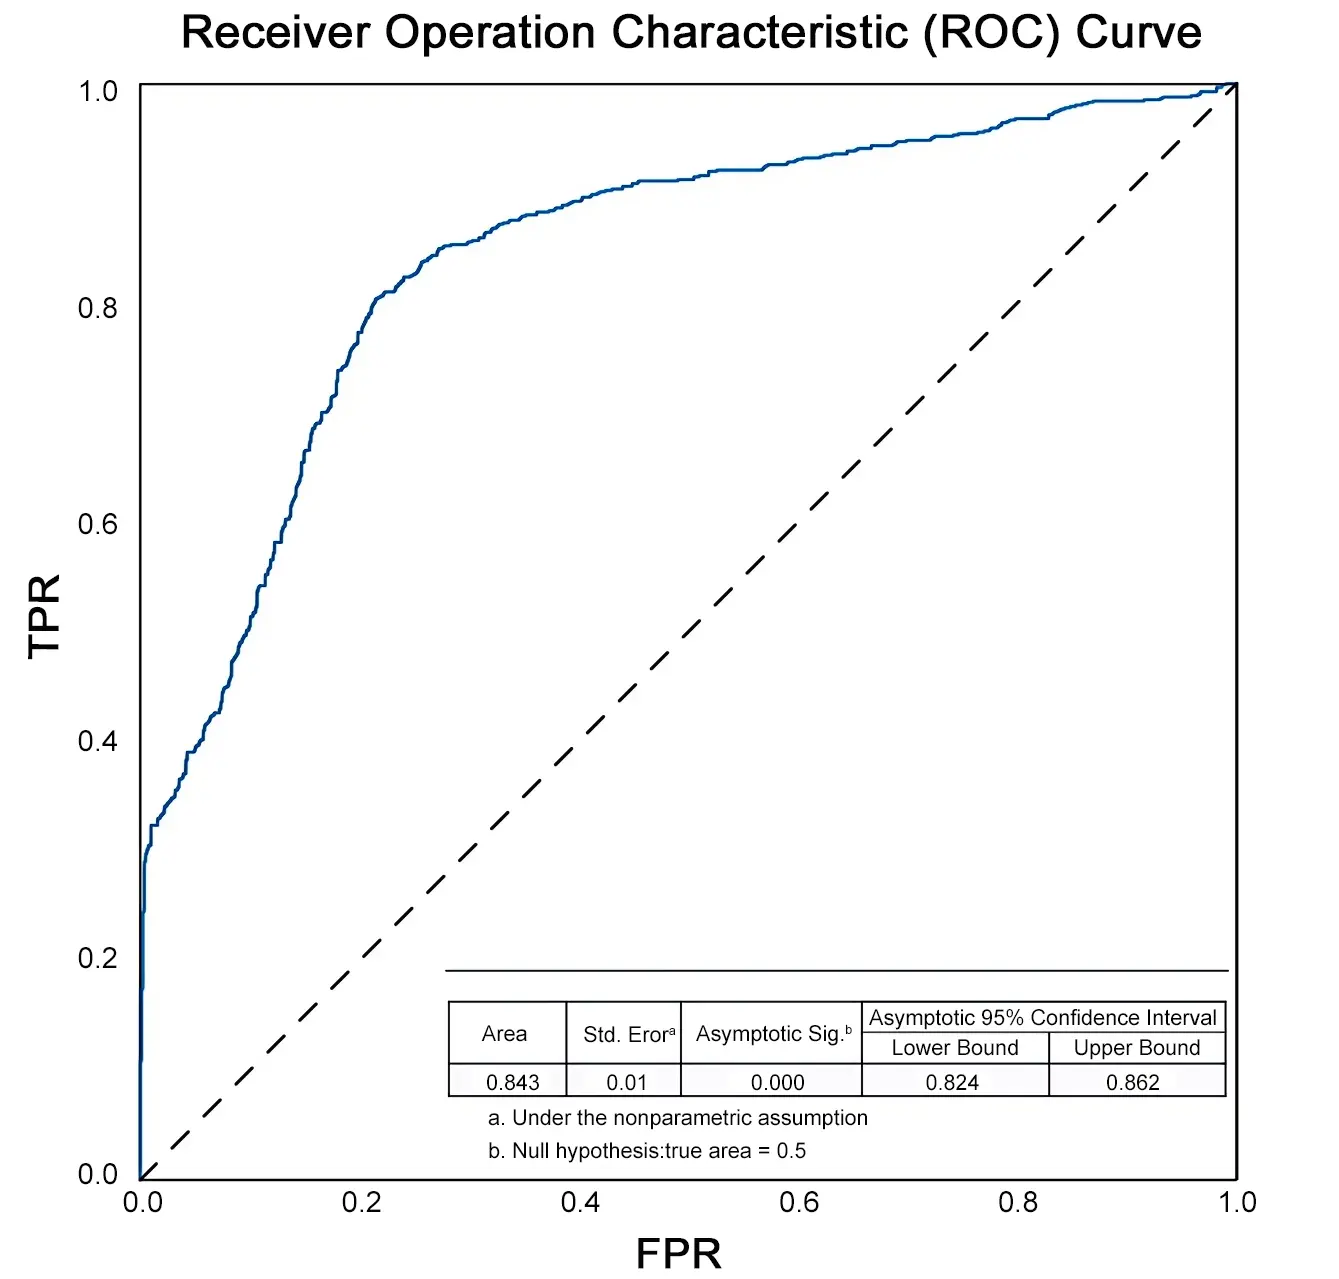
Figure 8. ROC curve and AUC for flood resilience map. ROC: Receiver Operating Characteristic; AUC: Area Under the Curve; TPR: True Positive Rate; FPR: False Positive Rate.
5.6 Recommendations and measures
In summary, significant spatial disparities in flood resilience exist across Wuxi City, necessitating targeted and differentiated strategies to enhance overall systemic capacity. Districts identified with lower resilience levels, particularly Liangxi, Huishan, Xishan, and Binhu, require prioritized intervention. Guided by the principles of emergy analysis and sustainability evaluation from this study, future urban planning should implement tailored measures across infrastructure, environmental, social, and economic dimensions to strengthen flood resistance, adaptation, and recovery capacities. The proposed integrated framework is outlined below.
1. Infrastructure development. Enhancement should begin with source control to alleviate stormwater concentration and discharge pressure. In Liangxi District, the core urban area with the lowest resilience score, priority must be given to upgrading flood control infrastructure, including levees, pumping stations, and the underground drainage network. Given its high building density and impervious surface ratio, which are key negative indicators in our assessment, complementary context-adaptive green infrastructure is critical. This includes retrofitting permeable pavements, expanding sunken green spaces and bioretention cells, and constructing grass swales to restore infiltration and retention. For frequently waterlogged areas in Binhu, Huishan, and Xishan Districts, the strategy should leverage their relatively better natural drainage potential. Upgrades should focus on optimizing the existing well-developed river networks as primary discharge channels, while systematically eliminating bottlenecks in the pipe network. The integration of distributed stormwater storage facilities at key topographic depressions is essential to mitigate peak flows.
2. Environmental management. Urban expansion has encroached upon aquatic spaces and simplified natural channels, thereby weakening the landscape’s innate regulatory capacity. Restoration in Binhu District, with its dense river networks, should focus on the ecological rehabilitation of waterways, including re-naturalizing straightened channels to slow flow and increase retention. A comprehensive city-wide strategy should include enhancing mountain water conservation by utilizing natural ditches to create purification and buffering corridors, thereby mitigating the impact of upstream floods on urban drainage. It must also involve optimizing identified topographic depressions through the strategic construction of multi-functional retention basins and stormwater wetlands. Critically, the strategy needs to implement targeted vegetation-based measures to increase urban green coverage, prioritizing afforestation in low-resilience zones. This directly addresses the low NDVI scores associated with higher vulnerability by boosting rainfall interception, evapotranspiration, and soil infiltration.
3. Social engagement. Wuxi's strength in IoT technology should be harnessed to accelerate the development of an intelligent flood monitoring and early-warning system. Deploying sensors in identified high-risk zones for real-time data collection, integrated with the city operations platform, will enable dynamic risk assessment and precise emergency response, which directly builds upon the positive role of “internet users” highlighted in our social dimension analysis. Furthermore, public participation and individual resilience must be strengthened. This involves establishing community-based flood response teams, conducting localized risk awareness and preparedness training, and fostering mutual-aid networks. Government agencies should optimize digital communication channels for the timely dissemination of warnings and evacuation guidelines, ensuring that the high mobile phone penetration rate translates into effective risk communication.
4. Economic strategies. Robust economic capacity is a fundamental driver of resilience, enabling investment in other dimensions. Fiscal policies should direct resources towards resilience-building projects, particularly in suburban and lower-resilience districts, to alleviate pressure on the urban core. This includes investing in basic public services to protect vulnerable populations identified by social indicators. To mitigate direct financial losses, it is crucial to explore and promote comprehensive catastrophe insurance systems. Furthermore, promoting equitable and diversified economic growth across sectors will bolster long-term fiscal health and cross-sectoral resilience, ensuring sustainable capacity for post-disaster recovery.
These measures, grounded in emergy theory and interdisciplinary collaboration, aim to transform Wuxi into a flood-resilient city capable of withstanding future climate challenges while fostering sustainable urban development.
6. Conclusions
This study developed a hybrid multi-criteria decision-making framework that integrates the AHP-EWM with GIS technologies to systematically quantify urban waterlogging resilience in Wuxi City. Building on established urban resilience evaluation frameworks, we incorporated localized indicators that characterize urban waterlogging hazards, thereby proposing a geospatially integrated approach for assessing flood resilience at a refined scale. Using Wuxi as a case study, resilience was evaluated across four dimensions: infrastructure, environment, economy, and society. Environmental and infrastructure metrics were derived from remote sensing raster data, while socio-economic indicators were sourced from statistical yearbooks at the district/county level. The AHP-EWM method was employed to determine indicator weights, and ArcGIS software facilitated data processing, raster calculations, and mapping to generate a spatial distribution map of waterlogging resilience for Wuxi. The resilience index was classified into five tiers using the Natural Breaks method, with higher tiers indicating stronger adaptive capacity. Model accuracy was validated through the ROC curve analysis. Subsequently, from an urban sustainability perspective, emergy analysis was applied to evaluate Wuxi’s sustainability indicators.
Based on these findings, targeted recommendations for enhancing flood management capabilities in various administrative districts were proposed through an integrated analysis of waterlogging resilience and emergy indicators. This framework advocates for a transition from traditional engineering solutions to diversified flood management measures that align with national development goals and holistically integrate natural, economic, social, and infrastructural considerations. The methodology identifies priority areas for improvement in urban planning and suggests institutional optimization strategies through policy interventions and public engagement, offering novel insights for strengthening urban flood resilience. It assists governmental authorities in prioritizing flood control measures by promoting a shift from singular engineering schemes to multi-faceted strategies that consider a synthesis of natural, economic, social, and infrastructural factors, in accordance with overarching developmental objectives. The implementation of such comprehensive measures enables effective flood risk management and mitigates the impacts of waterlogging.
This study has several limitations that warrant optimization and, concurrently, point to directions for future research. First, the assessment is inherently static, providing a snapshot of resilience for a specific period (2022). It does not simulate the dynamic evolution of resilience under scenarios of climate change, urban development, or extreme rainfall events. Second, there are specific aspects related to data and methodology that could be enhanced: (1) Socio-economic data were primarily sourced from annual statistical reports at the district/county level, which may not sufficiently capture the detailed spatial patterns of waterlogging. (2) The historical waterlogging points used for model validation were sampled via a simple random strategy. Future work could employ more robust techniques such as stratified random sampling based on key environmental variables, or spatial cross-validation to more rigorously assess the model’s spatial generalizability. (3) The use of cumulative rainfall depth simplifies the rainfall-runoff relationship. Future refinements should integrate local Intensity-Duration-Frequency curves and soil moisture data to achieve a more physically rigorous characterization of the hydrological hazard.
This study establishes a methodological framework that provides a scientific basis for other cities confronting analogous flood risks. It offers a replicable approach to guide the formulation of targeted built-environment planning strategies, which can be tailored to local geographical and socio-economic contexts to pursue the dual goals of enhanced urban resilience and sustainability. Consequently, this work demonstrates the value of an integrated, multi-criteria spatial assessment framework in facilitating a critical transition for urban flood management—from reliance on fragmented, grey-infrastructure solutions toward holistic, systemic planning that synergizes ecological, social, and economic dimensions.
Authors contribution
Zhang J: Conceptualization, methodology, formal analysis, resources, writing-review & editing.
Liu Y: Investigation.
Asutosh AT, Li Y: Writing-review & editing.
Conflicts of interest
Junxue Zhang is a Youth Editorial Board Member of Journal of Building Design and Environment. The other authors declare no conflicts of interest.
Ethical approval
Not applicable.
Consent to participate
Not applicable.
Consent for publication
Not applicable.
Availability of data and materials
The data and materials could be obtained from the corresponding author upon request.
Funding
The work described in this paper was supported by Undergraduate Innovation and Entrepreneurship Training Program Project of Jiangsu University of Science and Technology (Grant No. 202410289054Z, 2024), the China Postdoctoral Science Foundation (Grant No.2023M741758), the Major Projects of Philosophical and Social Science Research in Universities in Jiangsu Province (Grant No.2023SJZD131), and the Nanjing Postdoctoral Research Funding Program in 2023.
Copyright
© The Author(s) 2026.
References
-
1. Tabari H. Climate change impact on flood and extreme precipitation increases with water availability. Sci Rep. 2020;10(1):13768.[DOI]
-
2. Abdi-Dehkordi M, Bozorg-Haddad O, Salavitabar A, Mohammad-Azari S, Goharian E. Development of flood mitigation strategies toward sustainable development. Nat Hazards. 2021;108(3):2543-2567.[DOI]
-
3. Alifu H, Hirabayashi Y, Imada Y, Shiogama H. Enhancement of river flooding due to global warming. Sci Rep. 2022;12(1):20687.[DOI]
-
4. Meerow S, Newell JP, Stults M.. Defining urban resilience: A review. Landsc Urban Plan. 2016;147:38-49.[DOI]
-
5. Huang ZK, Zeng NC, Zhang DM, Argyroudis S, Mitoulis SA. Resilience models for tunnel recovery after earthquakes. Engineering. 2025;54:320-345.[DOI]
-
6. Fu X, Liu Y, Xie Z, Jiang F, Xu J, Yang Z, et al. A coupled PSR-based framework for holistic modeling and flood resilience assessment: A case study of the 2022 flood events in five southern provinces of China. J Hydrol. 2024;636:131255.[DOI]
-
7. Rachunok B, Bennett J, Flage R, Nateghi R. A path forward for leveraging social media to improve the study of community resilience. Int J Disaster Risk Reduct. 2021;59:102236.[DOI]
-
8. Seddon N, Chausson A, Berry P, Girardin CAJ, Smith A, Turner B. Understanding the value and limits of nature-based solutions to climate change and other global challenges. Philos Trans R Soc B Biol Sci. 2020;375(1794):20190120.[DOI]
-
9. Olsson L, Jerneck A, Thoren H, Persson J, O’Byrne D. Why resilience is unappealing to social science: Theoretical and empirical investigations of the scientific use of resilience. Sci Adv. 2015;1(4):e1400217.[DOI]
-
10. Fekete A. Critical infrastructure and flood resilience: Cascading effects beyond water. WIREs Water. 2019;6(5):e1370.[DOI]
-
11. Leitner H, Sheppard E, Webber S, Colven E.. Globalizing urban resilience. Urban Geogr. 2018;39(8):1276-1284.[DOI]
-
12. Bertilsson L, Wiklund K, de Moura Tebaldi I, Rezende OM, Veról AP, Miguez MG. Urban flood resilience – A multi-criteria index to integrate flood resilience into urban planning. J Hydrol. 2019;573:970-982.[DOI]
-
13. Alshehri SA, Rezgui Y, Li H.. Disaster community resilience assessment method: A consensus-based Delphi and AHP approach. Nat Hazards. 2015;78(1):395-416.[DOI]
-
14. Yu S, Yuan M, Wang Q, Corcoran J, Xu Z, Peng J. Dealing with urban floods within a resilience framework regarding disaster stages. Habitat Int. 2023;136:102783.[DOI]
-
15. Qasim S, Qasim M, Shrestha RP, Khan AN, Tun K, Ashraf M. Community resilience to flood hazards in Khyber Pukhthunkhwa province of Pakistan. Int J Disaster Risk Reduct. 2016;18:100-106.[DOI]
-
16. Wu J, Li B. Spatio-temporal evolutionary characteristics and type classification of marine economy resilience in China. Ocean Coast Manag. 2022;217:106016.[DOI]
-
17. Xiao S, Zou L, Xia J, Dong Y, Yang Z, Yao T. Assessment of the urban waterlogging resilience and identification of its driving factors: A case study of Wuhan City, China. Sci Total Environ. 2023;866:161321.[DOI]
-
18. Wang Z, Fu H, Zhou L. Multiple urban resilience evaluation of resource-based cities’ sustainable transformation effect. Resour Conserv Recycl. 2023;191:106912.[DOI]
-
19. Zhou X, Wang H, Duan Z, Zhou G. Exploring the impacts of urbanization on ecological resilience from a spatiotemporal heterogeneity perspective: Evidence from 254 cities in China. Environ Dev Sustain. 2024;12:1-20.[DOI]
-
20. Shi C, Guo N, Gao X, Wu F.. How carbon emission reduction is going to affect urban resilience. J Clean Prod. 2022;372:133737.[DOI]
-
21. Haghighi Fard SM, Doratli N. Evaluation of resilience in historic urban areas by combining multi-criteria decision-making system and GIS, with sustainability and regeneration approach: The case study of Tehran (IRAN). Sustainability. 2022;14(5):2495.[DOI]
-
22. Tayyab M, Zhang J, Hussain M, Ullah S, Liu X, Khan SN, et al. GIS-based urban flood resilience assessment using urban flood resilience model: A case study of Peshawar City, Khyber Pakhtunkhwa, Pakistan. Remote Sens. 2021;13(10):1864.[DOI]
-
23. Li W, Jiang R, Wu H, Xie J, Zhao Y, Song Y, et al. A system dynamics model of urban rainstorm and flood resilience to achieve the sustainable development goals. Sustain Cities Soc. 2023;96:104631.[DOI]
-
24. Odum HT. Self-organization, transformity, and information. Science. 1988;242(4882):1132-1139.[DOI]
-
25. Yao X, Chen W, Song C, Gao S. Sustainability and efficiency of water-land-energy-food nexus based on emergy-ecological footprint and data envelopment analysis: Case of an important agriculture and ecological region in Northeast China. J Clean Prod. 2022;379:134854.[DOI]
-
26. Wang N, Li H, Zhang J, Deng J, She L. Research on sustainable evaluation model of sponge city based on emergy analysis. Water. 2023;15(1):32.[DOI]
-
27. Zhou H, Li H, Zhao X, Ding Y. Emergy ecological model for sponge cities: A case study of China. J Clean Prod. 2021;296:126530.[DOI]
-
28. Zhang X, Li , S . Urban ecological sustainability evaluation of artificial system and natural system based on emergy and GIS. J Southeast Univ. 2021,37(01);75-83.[DOI]
-
29. Zhang X, Liu G, Chen G, Xu J, Yang F, Huang X. Study on risk assessment and countermeasures of urban extreme rainstorm flood disaster. China Flood Drought Manag. 2023,33(08);13-18.[DOI]
-
30. Bruneau M, Chang SE, Eguchi RT, Lee GC, O’Rourke TD, Reinhorn AM, , et al. A framework to quantitatively assess and enhance the seismic resilience of communities. Earthq Spectra. 2003;19(4):733-752.[DOI]
-
31. Cutter SL, Barnes L, Berry M, Burton C, Evans E, Tate E, et al. A place-based model for understanding community resilience to natural disasters. Glob Environ Change. 2008;18(4):598-606.[DOI]
-
32. Marasco S, Cardoni A, Zamani Noori A, Kammouh O, Domaneschi M, Cimellaro GP. Integrated platform to assess seismic resilience at the community level. Sustain Cities Soc. 2021;64:102506.[DOI]
-
33. Tran D, Xu D, Dang V, Alwah AAQ. Predicting urban waterlogging risks by regression models and internet open-data sources. Water. 2020;12(3):879.[DOI]
-
34. Kotzee I, Reyers B. Piloting a social-ecological index for measuring flood resilience: A composite index approach. Ecol Indic. 2016;60:45-53.[DOI]
-
35. Mabrouk M, Haoying H. Urban resilience assessment: A multicriteria approach for identifying urban flood-exposed risky districts using multiple-criteria decision-making tools (MCDM). Int J Disaster Risk Reduct. 2023;91:103684.[DOI]
-
36. Lu H, Zhang C, Jiao L, Wei Y, Zhang Y. Analysis on the spatial-temporal evolution of urban agglomeration resilience: A case study in Chengdu-Chongqing Urban Agglomeration, China. Int J Disaster Risk Reduct. 2022;79:103167.[DOI]
-
37. Pragya , Kumar M, Tiwari A, Majid SI, Bhadwal S, Sahu N, et al. Integrated spatial analysis of forest fire susceptibility in the indian Western Himalayas (IWH) using remote sensing and GIS-based fuzzy AHP approach. Remote Sens. 2023;15(19):4701.[DOI]
-
38. Wang Y, Meng F, Liu H, Zhang C, Fu G. Assessing catchment scale flood resilience of urban areas using a grid cell based metric. Water Res. 2019;163:114852.[DOI]
-
39. Hamidi AR, Wang J, Guo S, Zeng Z. Flood vulnerability assessment using MOVE framework: A case study of the northern part of district Peshawar, Pakistan. Nat Hazards. 2020;101(2):385-408.[DOI]
-
40. Hossain MK, Meng Q. A fine-scale spatial analytics of the assessment and mapping of buildings and population at different risk levels of urban flood. Land Use Policy. 2020;99:104829.[DOI]
-
41. Liu D, Feng J, Li H, Fu Q, Li M, Faiz MA, et al. Spatiotemporal variation analysis of regional flood disaster resilience capability using an improved projection pursuit model based on the wind-driven optimization algorithm. J Clean Prod. 2019;241:118406.[DOI]
-
42. Waghwala RK, Agnihotri PG. Flood risk assessment and resilience strategies for flood risk management: A case study of Surat City. Int J Disaster Risk Reduct. 2019;40:101155.[DOI]
-
43. Abenayake CC, Mikami Y, Matsuda Y, Jayasinghe A. Ecosystem services-based composite indicator for assessing community resilience to floods. Environ Dev. 2018;27:34-46.[DOI]
-
44. Song J, Chang Z, Li W, Feng Z, Wu J, Cao Q, et al. Resilience-vulnerability balance to urban flooding: A case study in a densely populated coastal city in China. Cities. 2019;95:102381.[DOI]
-
45. Li G, Kou C, Wang Y, Yang H. System dynamics modelling for improving urban resilience in Beijing, China. Resour Conserv Recycl. 2020;161:104954.[DOI]
-
46. Zhang Q, Gu X, Singh VP, Liu L, Kong D. Flood-induced agricultural loss across China and impacts from climate indices. Glob Planet Change. 2016;139:31-43.[DOI]
-
47. Kakinuma K, Puma MJ, Hirabayashi Y, Tanoue M, Baptista EA, Kanae S. Flood-induced population displacements in the world. Environ Res Lett. 2020;15(12):124029.[DOI]
-
48. Tu Y, Shi H, Chen K, Liang Y, Zhou X, Lev B. Three-reference-point based group ELECTRE III method for urban flood resilience evaluation. Expert Syst Appl. 2022;210:118488.[DOI]
-
49. Hadipour V, Vafaie F, Kerle N. An indicator-based approach to assess social vulnerability of coastal areas to sea-level rise and flooding: A case study of Bandar Abbas city, Iran. Ocean Coast Manag. 2020;188:105077.[DOI]
-
50. Kim H, Marcouiller DW, Woosnam KM. Rescaling social dynamics in climate change: The implications of cumulative exposure, climate justice, and community resilience. Geoforum. 2018;96:129-140.[DOI]
-
51. Mazzoglio P, Macchia S, Gallo E, Winter J, Claps P. Disaster tales as communication tool for increasing risk resilience. Int J Disaster Risk Sci. 2021;12(3):341-354.[DOI]
-
52. Sun R, Gong Z, Gao G, Shah AA. Comparative analysis of multi-criteria decision-making methods for flood disaster risk in the yangtze river delta. Int J Disaster Risk Reduct. 2020;51:101768.[DOI]
-
53. Saaty T. The analytic hierarchy process: Planning, priority setting, resource allocation. New York: McGraw-Hill International Book Co.; 1980.
-
54. de Brito MM, Evers M. Multi-criteria decision-making for flood risk management: a survey of the current state of the art. Nat Hazards Earth Syst Sci. 2016;16(4):1019-1033.[DOI]
-
55. Abdrabo KI, Kantoush SA, Esmaiel A, Saber M, Sumi T, Almamari M, et al. An integrated indicator-based approach for constructing an urban flood vulnerability index as an urban decision-making tool using the PCA and AHP techniques: A case study of Alexandria, Egypt. Urban Clim. 2023;48:101426.[DOI]
-
56. Vega-Azamar RE, Glaus M, Hausler R, Oropeza-García NA, Romero-López R. An emergy analysis for urban environmental sustainability assessment, the Island of Montreal, Canada. Landsc Urban Plan. 2013;118:18-28.[DOI]
-
57. Lou B, Ulgiati S. Identifying the environmental support and constraints to the Chinese economic growth—An application of the Emergy Accounting method. Energy Policy. 2013;55:217-233.[DOI]
-
58. Chen W, Geng Y, Dong H, Tian X, Zhong S, Wu Q, et al. An emergy accounting based regional sustainability evaluation: A case of Qinghai in China. Ecol Indic. 2018;88:152-160.[DOI]
-
59. Zhan J, Zhang F, Chu X, Liu W, Zhang Y. Ecosystem services assessment based on emergy accounting in Chongming Island, Eastern China. Ecol Indic. 2019;105:464-473.[DOI]
-
60. Brown , M . T., & Ulgiati, S. (2016). Ecol Model. 2016;339:148-156.[DOI]
-
61. Li G, Kuang Y, Huang N, Chang X. Emergy synthesis and regional sustainability assessment: Case study of pan-pearl river delta in China. Sustainability. 2014;6(8):5203-5230.
Copyright
© The Author(s) 2026. This is an Open Access article licensed under a Creative Commons Attribution 4.0 International License (https://creativecommons.org/licenses/by/4.0/), which permits unrestricted use, sharing, adaptation, distribution and reproduction in any medium or format, for any purpose, even commercially, as long as you give appropriate credit to the original author(s) and the source, provide a link to the Creative Commons license, and indicate if changes were made.
Publisher’s Note
Science Exploration remains a neutral stance on jurisdictional claims in published
maps
and institutional affiliations. The views expressed in this article are solely those
of
the author(s) and do not reflect the opinions of the Editors or the publisher.
Share And Cite


Science Exploration Style
Liu Y, Zhang J, Asutosh AT, Li Y. Assessing urban flood resilience: A coupled AHP-entropy-GIS approach. J Build Des Environ. 2026;4:2025105. https://doi.org/10.70401/jbde.2026.0024
Tips
Copy completed.
Submit a Manuscript
Author Instructions
Cite this Article
Article Metrics
0
View
0
Download
Cited
Article Updates

- Abstract
- Keywords
- 1. Introduction
- 2. Data and Methodology
- 3. Weighting the Criteria Using AHP-EWM
- 4. Analytic Hierarchy Process
- 5. Results and Discussion
- 6. Conclusions
- Authors contribution
- Conflicts of interest
- Ethical approval
- Consent to participate
- Consent for publication
- Availability of data and materials
- Funding
- Copyright
Science Exploration Style
Liu Y, Zhang J, Asutosh AT, Li Y. Assessing urban flood resilience: A coupled AHP-entropy-GIS approach. J Build Des Environ. 2026;4:2025105. https://doi.org/10.70401/jbde.2026.0024
copy
Share Link
copy