Performance and lifecycle assessment of fly ash-slag geopolymer mortar using seawater and sea sand
Hao Chen
Xiang Liu
*

,
Wen-Qing Deng
Fang-Wen Ge
Xu-Hong Liu
*Correspondence to:
Xiang Liu, School of Civil Engineering, Fujian University of Technology, Fuzhou 350118, Fujian, China.
E-mail: liuxiang@fjut.edu.cn
J Build Des Environ. 2026;4:2025134. 10.70401/jbde.2026.0027
Received: December 08, 2025Accepted: January 23, 2026Published: January 28, 2026
This manuscript is made available in its unedited form to allow early access to the reported findings. Further editing will be completed before final publication. As such, the content may include errors, and standard legal disclaimers are applicable.
Abstract
Seawater-sea sand concrete has emerged as an innovative construction material due to its effective utilization of marine resources. At the same time, geopolymer concrete has shown rapid hardening capabilities, low energy consumption, and eco-friendly properties, making it highly promising for structural reinforcement. This study evaluated the effects of alkali modulus, alkali concentration, and fly ash (FA) content on the performance of geopolymer FA-slag seawater-sea sand mortar (SWSSGM). Performance characteristics such as consistency, flowability, compressive strength, and flexural strength were tested. The findings indicate that FA enhances workability, whereas slag powder has the opposite effect. Increasing alkali concentration reduces consistency but increases slump. Optimal compressive and flexural strength is achieved when the alkali modulus is 1.2, alkali content is 15%, and FA content is 30%. Generally, higher alkali concentrations promote strength development, while increased FA content raises porosity and reduces strength. However, strength gains over time are more pronounced, and the effects of alkali modulus require further investigation. Multiple linear regression analysis of the three factors affecting SWSSGM properties demonstrates that a quadratic polynomial regression model yields high coefficients of determination (R2 ≥ 0.92), enabling accurate predictions of SWSSGM performance parameters. From a lifecycle (cradle-to-gate) perspective, SWSSGM outperforms traditional cement-based materials in terms of carbon emissions, energy consumption, and resource efficiency, showcasing its significant low-carbon, energy-saving, and environmentally friendly attributes. Through systematic optimization of SWSSGM’s design parameters, performance prediction modeling, and preliminary environmental assessment, this study provides guidance for its sustainable application in coastal engineering projects.
Keywords
Seawater-sea sand, geopolymer, strength, workability, life cycle assessment
1. Introduction
Concrete is commonly utilized in different construction projects because of its outstanding mechanical properties and cost efficiency. Nevertheless, the widespread use of concrete has given rise to substantial environmental challenges. One of the major concerns is the overextraction of river sand, which has led to resource depletion. This problem is especially conspicuous in coastal areas, where the price of sea sand has been continuously increasing. Moreover, the production of concrete consumes around 2 billion tons of freshwater globally each year[1]. As a result, seawater and sea sand have attracted attention as sustainable substitutes.
The production of conventional concrete makes a considerable contribution to global CO2 emissions, constituting approximately 7% of the total emissions[2]. To tackle this issue, researchers have concentrated on the development of low-carbon binder materials. Geopolymers, emerging as a novel green inorganic binder, present substantial benefits. For instance, they can reduce CO2 emissions by 55-75% in comparison to traditional concrete[3]. Additionally, geopolymers exhibit excellent mechanical properties and
In terms of the mechanical properties of seawater and seawater sand concrete: To illustrate, Younis et al.[6] reported that incorporating seawater could slightly improve the compressive and tensile strengths within the first seven days of curing. Nevertheless, a strength loss of about 7-10% was observed afterward. Correspondingly, Pan et al.[7] found that while the inclusion of both seawater and sea sand promoted early-age strength gain, a minor reduction in compressive strength was observed at the
Furthermore, Xiao et al.[12] investigated the mechanical properties of Seawater Sea-Sand Natural Aggregate Concrete (SSNAC), finding that early strength increased by 36%-76% compared to conventional concrete, though long-term strength decreased slightly by
The durability of SWSSC is a multifaceted subject, and extensive research has been carried out on this aspect, with a focus on factors such as water absorption[15], chloride-ion corrosion[16], sulfate attack[17], and freeze-thaw cycles[18]. Studies show that SWSSC performs well in reducing water absorption and improving sulfate resistance, but its freeze-thaw durability may deteriorate faster due to ion effects[15-18].
Geopolymers are inorganic polymers synthesized from aluminosilicate-rich minerals or industrial by-products activated by alkaline activators. Current research primarily focuses on activators and raw materials. Commonly used geopolymer activators include alkaline oxides such as KOH, NaOH, and Na2CO3, as well as alkaline silicates such as Na2SiO3 and K2SiO3, which can be used individually or in combinations. Different types of activators significantly influence the performance of geopolymers. Zhang et al.[19] found that high alkalinity activators can promote the formation of hydration products in nickel slag materials, thereby enhancing the strength of the material. Sasui et al.[5] revealed that moderately increasing the Na2SiO3-to-NaOH ratio significantly enhances material microstructure and strength, but excessively high ratios may lead to pore formation, negatively affecting concrete density. Furthermore, Wan et al.[20] indicated that the incorporation of nano-silica significantly densifies the microstructure of alkali-activated gelling materials, thereby achieving a 97% strength retention rate after long-term seawater immersion and enhancing corrosion resistance. Sarkar et al.[21] indicated that incorporating Bacillus Cohnii into alkali-activated fly ash (FA) composites significantly densified the microstructure, reduced pore size by 35%, and enabled self-healing of cracks up to 0.59 mm wide, while enhancing resistance to sulfate attack and chloride ion penetration.
Researchers have focused on the activation of different aluminosilicates by geopolymer activators. Currently, ground granulated blast furnace slag (GBFS) and FA, rich in aluminosilicate content, are widely used as binders[5,22]. Additionally, Guo et al.[23] conducted a study on the performance of geopolymer mortar made from FA and steel slag, finding that the inclusion of steel slag improved early strength. However, when steel slag content exceeded 10%, the later-stage strength decreased. Si et al.[24] enhanced the mechanical properties of metakaolin-based geopolymers by adding 5%-10% glass powder. This addition resulted in a denser structure, reduced early shrinkage, and decreased water loss in the samples. Cao et al.[25] studied the microstructure of alkali-activated nickel-iron slag mortar and found that adding nickel-iron slag improved slag reactivity and increased C-A-S-H gel content, enhancing the mortar’s overall performance.
SWSSC and geopolymer concrete (GC) both feature environmentally friendly and reliable performance characteristics, with GC particularly excelling in chloride ion penetration resistance compared to traditional concrete[26]. In recent years, researchers have thoroughly investigated the diverse performance characteristics of GC made with seawater and sea sand, including its mechanical properties[27-30], durability[31,32], microstructural characteristics[29,33], and environmental and economic benefits[28,34,35]. Studies have addressed mix design optimization[28], performance under marine corrosion environments[32], bonding behavior with novel composite materials such as FRP reinforcements[36,37], and the enhancement of overall material performance through green and sustainable methods[34,35]. Table 1 compiles experimental data on geopolymer seawater-sea sand concrete, summarizing key experimental parameters from current studies.
Table 1. Recent studies on SWSSG.
| NO. | Type | Types of alkali exciters | Silicon aluminates types | Slump (mm) | Fcu (MPa) | Ff (MPa) | Reference | |||||
| 3d | 7d | 28d | 56d | 3d | 7d | 28d | ||||||
| ASC30 | C | NaOH | GBFS | 32.6 | Cui et al.[37] | |||||||
| ASC60 | C | NaOH + Na2SiO3 | GBFS | 64.5 | ||||||||
| SS-0.32-0% | C | NaOH + Na2SiO3 | 20% FA + 80% GBFS | 71 | Dai et al.[31] | |||||||
| SS-0.37-0% | C | NaOH + Na2SiO3 | 20% FA + 80% GBFS | 67 | ||||||||
| SS-0.42-0% | C | NaOH + Na2SiO3 | 20% FA + 80% GBFS | 62 | ||||||||
| 10-60-S | M | NaOH | 40%FA+60%GBFS | 50 | 63.3 | 73.1 | Xu et al.[29] | |||||
| 10-20-S | M | NaOH | 80% FA + 20% GBFS | 23.73 | ||||||||
| 10-40-S | M | NaOH | 60% FA + 40% GBFS | 51.48 | ||||||||
| 8-60-S | M | NaOH | 40% FA + 60% GBFS | 51 | ||||||||
| 12-60-S | M | NaOH | 40% FA + 60% GBFS | 65.5 | ||||||||
| IC | C | NaOH + Na2SiO3 | 20% M + 10% SF | 72 | Dou et al.[32] | |||||||
| F8S2-S | M | Na2SiO3 | 71.25% FA + 23.75% GBFS + 5% SF | 84.5 | Lao et al.[52] | |||||||
| F2S8-S | M | Na2SiO3 | 23.75% FA + 71.25% GBFS + 5% SF | 143 | ||||||||
| SWSSC | C | Metasilicate | GBFS | 34 | Li et al.[33] | |||||||
| SWSSC2 | C | Metasilicate | GBFS | 42.9 | ||||||||
| SWSSM | M | Metasilicate | GBFS | 48.7 | ||||||||
| S3:7-A0.8 | C | NaOH + Na2SiO3 | 30% FA + 70% GBFS | 205 | 64.95 | Lu et al.[8] | ||||||
| S3:7-A1 | C | NaOH+Na2SiO3 | 30%FA+70%GBFS | 206 | 62.61 | |||||||
| S3:7-A1.25 | C | NaOH + Na2SiO3 | 30% FA + 70% GBFS | 205 | 60.76 | |||||||
| S3:7-A1.5 | C | NaOH+Na2SiO3 | 30% FA + 70% GBFS | 207 | 49.74 | |||||||
| S5:5-A1- | C | NaOH + Na2SiO3 | 50% FA + 50% GBFS | 224 | 49.55 | |||||||
| S7:3-A1 | C | NaOH + Na2SiO3 | 70% FA + 30% GBFS | 233 | 34.28 | |||||||
| Mix 1 | C | NaOH + Na2SiO3 | 80% FA +20% GBFS | 15 | 41 | 54 | Lyu et al.[27] | |||||
| Mix 2 | C | Sodium metasilicate pentahydrate | 80% FA + 20% GBFS | 16 | 38 | 53 | ||||||
| Mix 3 | C | Sodium metasilicate anhydrous | 80% FA + 20% GBFS | 14 | 41 | 54 | ||||||
| Mix 4 | C | NaOH + Na2SiO3 | 80% FA + 20% M | 8 | 19 | 24 | ||||||
| Type I | C | NaOH + Na2SiO3 | 25% FA + 75% GBFS | 64.75 | 78.99 | |||||||
| Type II | C | NaOH + Na2SiO3 | 75% FA + 25% GBFS | 59.25 | 72.25 | |||||||
| SSASC | C | NaOH + Na2SiO3 | GBFS | 95 | 57.1 | 59.15 | 61.66 | |||||
| SSGM-0 | M | NaOH + Na2SiO3 | 15% FA + 80% GBFS | 191 | 34.1 | 41.5 | 52.4 | 5.47 | 7.79 | 8.66 | ||
| BF0 | C | NaOH + Na2SiO3 | 15% FA + 80% GBFS | 164 | 37.14 | 43.44 | 52.3 | |||||
| M1 | C | NaOH + Na2SiO3 | 15% FA + 80% GBFS | 166 | 40.7 | 41.4 | 53.2 | |||||
| M2 | C | NaOH + Na2SiO3 | 190 | 35 | 38.8 | 51.8 | ||||||
| M3 | C | NaOH+Na2SiO3 | 202 | 29.1 | 38.6 | 50.8 | ||||||
| SA1 | M | NaOH + Na2SiO3 | 15% FA + 80% GBFS | 195 | 33.6 | 35.9 | 44.6 | 8 | 8.21 | 9.01 | ||
| SWSSGC-C40 | C | NaOH + Na2SiO3 | 15% FA + 80% GBFS | 198 | 42.3 | |||||||
| SWSSGC-C50 | C | NaOH + Na2SiO3 | 200 | 56.9 | ||||||||
| SWSSGC-C60 | C | NaOH + Na2SiO3 | 193 | 64.6 | ||||||||
| SS-AAM | M | NaOH + Na2SiO3 | 15% FA + 80% GBFS | 196 | 30.1 | 37 | 48 | 5.52 | 7.62 | 8.63 | ||
FA: fly ash; GBFS: granulated blast furnace slag; SF: silica fume; M: metakaolin; fcu: cubic compressive strength; ff: flexural strength; C and M: concrete and mortar;
Research on geopolymer seawater-sea sand mortar and concrete is currently limited, particularly regarding mix design. Factors such as the particle size of sea sand, types of alkali, properties of silicoaluminate, water-to-binder ratio, alkali concentration, and different alkali proportions can affect the performance of GC made with seawater and sea sand. Therefore, a three-factor, three-level orthogonal test was designed to explore the performance of SWSSGM. The factors examined included the alkali modulus of water glass, its concentration, and the proportion of FA. A comprehensive assessment of workability and mechanical properties, such as slump, consistency, compressive strength, and flexural strength, was conducted. To understand the effects of these factors on workability and strength, microstructural analysis was performed, and a regression model was developed to guide material design and optimization. Additionally, a preliminary cradle-to-gate lifecycle assessment (LCA) was included to evaluate the environmental impact and sustainability of SWSSGM using untreated marine resources, supporting the green development of marine and coastal civil engineering projects for a more sustainable approach to material utilization in construction.
2. Materials and Experimental Methods
2.1 Raw materials
The SWSSGM was formulated utilizing S95-grade ground GBFS and Grade I FA as the precursor materials. Figure 1 depicts the scanning electron microscopy (SEM) micrographs of the raw materials, highlighting the notable morphological distinctions between the two constituents. The GBFS particles exhibit irregular angular shapes with rough surfaces, whereas the FA is distinguished by its smooth, spherical particles, which display considerable size variations. Complementary analyses of particle size distribution, conducted via laser granulometry (Figure 2), reveal that GBFS possesses a coarser granulometry with a D50 value of 18.41 μm, in contrast to the finer FA particles, which exhibit a D50 value of 12.40 μm.
Figure 1. Morphology of GBFS and FA. (a) GBFS; (b) FA. GBFS: granulated blast furnace slag; FA: fly ash; EHT: electron high tension; WD: working distance; Mag: magnification.
Figure 2. Particle size distributions of GBFS and FA. GBFS: granulated blast furnace slag; FA: fly ash.
Additionally, X-ray diffraction (XRD) was utilized to examine the mineralogical composition of GBFS and FA, as depicted in Figure 3. The results indicate that the unreacted GBFS and FA mainly comprise amorphous phases. These amorphous phases are regarded as reactive components that take part in the geopolymerization process under the action of the alkaline activator. X-ray fluorescence spectroscopy was used to assess the chemical composition of the materials. The findings are displayed in Table 2. In comparison with ordinary Portland cement, GBFS exhibits a lower Ca/Si ratio and a higher Al/Si ratio, which leads to differences in the hydration products of the matrix.
Table 2. Chemical components of raw material obtained by XRF.
| Precursor material | Chemical composition (wt%) | |||||||||
| SiO2 | Al2O3 | CaO | Fe2O3 | SO3 | K2O | TiO2 | MgO | Na2O | P2O5 | |
| FA | 47.52 | 30.41 | 7.80 | 6.57 | 2.09 | 1.50 | 1.47 | 1.01 | 0.68 | 0.36 |
| GBFS | 32.85 | 14.67 | 38.53 | 0.96 | 2.50 | 0.73 | 1.19 | 7.38 | 0.57 | 0.04 |
XRF: X-ray fluorescence; GBFS: granulated blast furnace slag; FA: fly ash.
The alkali activator was formulated by combining water glass with NaOH. The water glass had a modulus of 3.3, while the NaOH was in the form of 99% purity solid flakes. The sea sand was sourced from the coastal area of Fujian, China, and has not undergone desalination or filtration treatment. Its basic parameters are shown in Table 3. As demonstrated by the particle size distribution in Figure 4, the sea sand complies with the requirements for Zone II construction sand as specified in JGJ 206-2010[38]. Artificial seawater was prepared in accordance with ASTM D1141-98[39], and its chemical composition is provided in Table 4. Additionally, Figure 5 displays photographs of the materials.
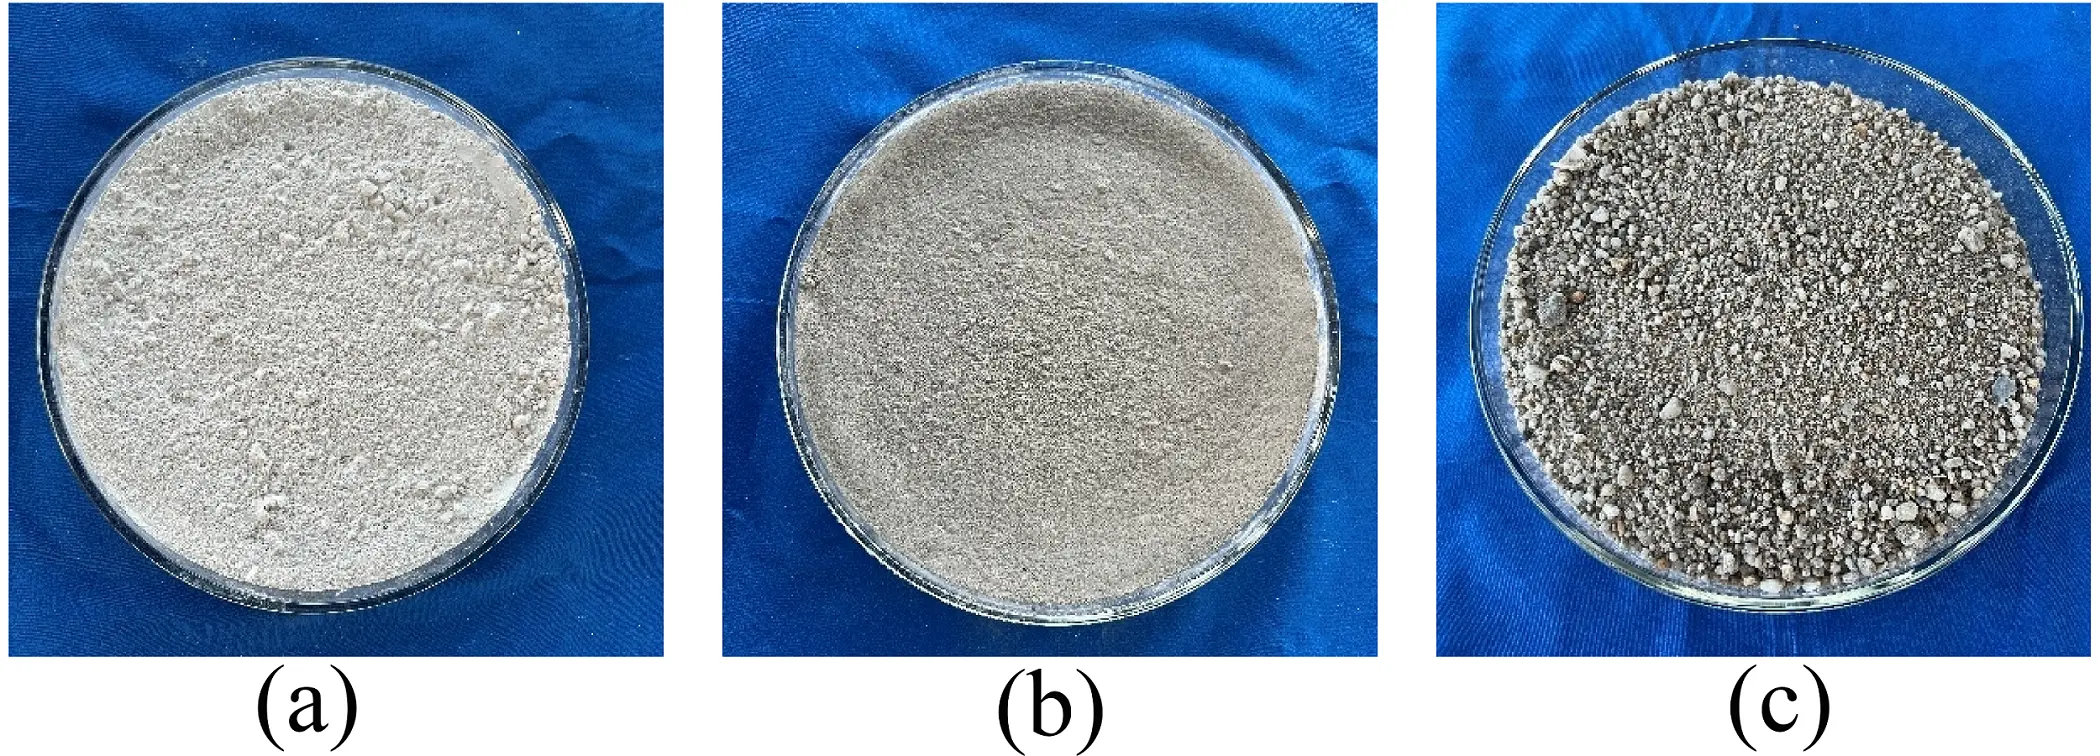
Figure 5. Raw materials. (a) GBFS; (b) FA; (c) Sea sand. GBFS: granulated blast furnace slag; FA: fly ash.
Table 3. Basic parameters of sea sand.
| Type of fine aggregate | Apparent density (kg/m3) | Bulk density (kg/m3) | Tight density (kg/m3) | Fineness modulus |
| Sea sand | 2,701 | 1,493 | 2,118 | 3.13 |
Table 4. Chemical composition of artificial seawater (g/L).
| KCl | CaCl2 | MgCl2 | NaCl | Na2SO4 | NaHCO3 | KBr |
| 0.695 | 1.16 | 5.20 | 24.53 | 4.09 | 0.201 | 0.101 |
Sodium-based alkaline activator solutions were utilized to activate the initial precursors. Artificial seawater was added to a sodium silicate solution containing 27.3% (by mass) of SiO2 and 8.54% (by mass) of Na2O, followed by the addition of 99% purity solid NaOH flakes. The alkali modulus (SiO2/Na2O) and alkali concentration (the weight ratios of SiO2, Na2O, and NaOH to the binder) of the activator solution were adjusted accordingly. The required NaOH content (mNaOH) for any desired modulus and alkali concentration of the geopolymer activator solution was calculated using Equation (1).
where S1: concentration of silica (SiO2) in the water glass solution (%); S2: concentration of sodium oxide (Na2O) in the water glass solution (%); S3: alkali concentration of the solution (%); M: alkali modulus of the solution; m1: Mass of the aluminosilicate (kg).
2.2 Specimen mixing ratio and specimen production
Three crucial parameters were considered, specifically the proportion of FA, and the alkali concentration, and the alkali modulus. The selected value ranges for these parameters were determined based on preliminary proportioning tests to ensure workable and polymerizable mixes. A three-factor, three-level orthogonal experimental design, as presented in Table 5, was adopted. Throughout the experiment, the water-to-binder ratio was kept constant at a value of 0.5, and the binder-to-sand ratio was also fixed at 0.5. A total of 27 mix designs (3 × 3 × 3) were formulated, with the details provided in Table 6.
Table 5. Test parameter and level.
| Factor | K1 | K2 | K3 |
| Modulus | 1.0 | 1.2 | 1.4 |
| Concentration | 10% | 15% | 20% |
| FA ratios | 30% | 50% | 70% |
FA: fly ash.
Table 6. Proportion of geopolymer mortar test.
| Mix. | Modulus | Concentration | Raw material (kg/m3) | ||||
| FA | GBFS | alkali stimulant | Sea sand | Seawater | |||
| OM 1 | 1.0 | 10% | 176 | 410 | 121 | 1,170 | 225 |
| OM 2 | 293 | 293 | 121 | 1,170 | 225 | ||
| OM 3 | 410 | 176 | 121 | 1,170 | 225 | ||
| OM 4 | 15% | 176 | 410 | 179 | 1,170 | 192 | |
| OM 5 | 293 | 293 | 179 | 1,170 | 192 | ||
| OM 6 | 410 | 176 | 179 | 1,170 | 192 | ||
| OM 7 | 20% | 176 | 410 | 240 | 1,170 | 159 | |
| OM 8 | 293 | 293 | 240 | 1,170 | 159 | ||
| OM 9 | 410 | 176 | 240 | 1,170 | 159 | ||
| OM 10 | 1.2 | 10% | 176 | 410 | 126 | 1,170 | 220 |
| OM 11 | 293 | 293 | 126 | 1,170 | 220 | ||
| OM 12 | 410 | 176 | 126 | 1,170 | 220 | ||
| OM 13 | 15% | 176 | 410 | 189 | 1,170 | 183 | |
| OM 14 | 293 | 293 | 189 | 1,170 | 183 | ||
| OM 15 | 410 | 176 | 189 | 1,170 | 183 | ||
| OM 16 | 20% | 176 | 410 | 254 | 1,170 | 147 | |
| OM 17 | 293 | 293 | 254 | 1,170 | 147 | ||
| OM 18 | 410 | 176 | 254 | 1,170 | 147 | ||
| OM 19 | 1.4 | 10% | 176 | 410 | 133 | 1,170 | 215 |
| OM 20 | 293 | 293 | 133 | 1,170 | 215 | ||
| OM 21 | 410 | 176 | 133 | 1,170 | 215 | ||
| OM 22 | 15% | 176 | 410 | 199 | 1,170 | 176 | |
| OM 23 | 293 | 293 | 199 | 1,170 | 176 | ||
| OM 24 | 410 | 176 | 199 | 1,170 | 176 | ||
| OM 25 | 20% | 176 | 410 | 265 | 1,170 | 137 | |
| OM 26 | 293 | 293 | 265 | 1,170 | 137 | ||
| OM 27 | 410 | 176 | 265 | 1,170 | 137 | ||
GBFS: granulated blast furnace slag; FA: fly ash.
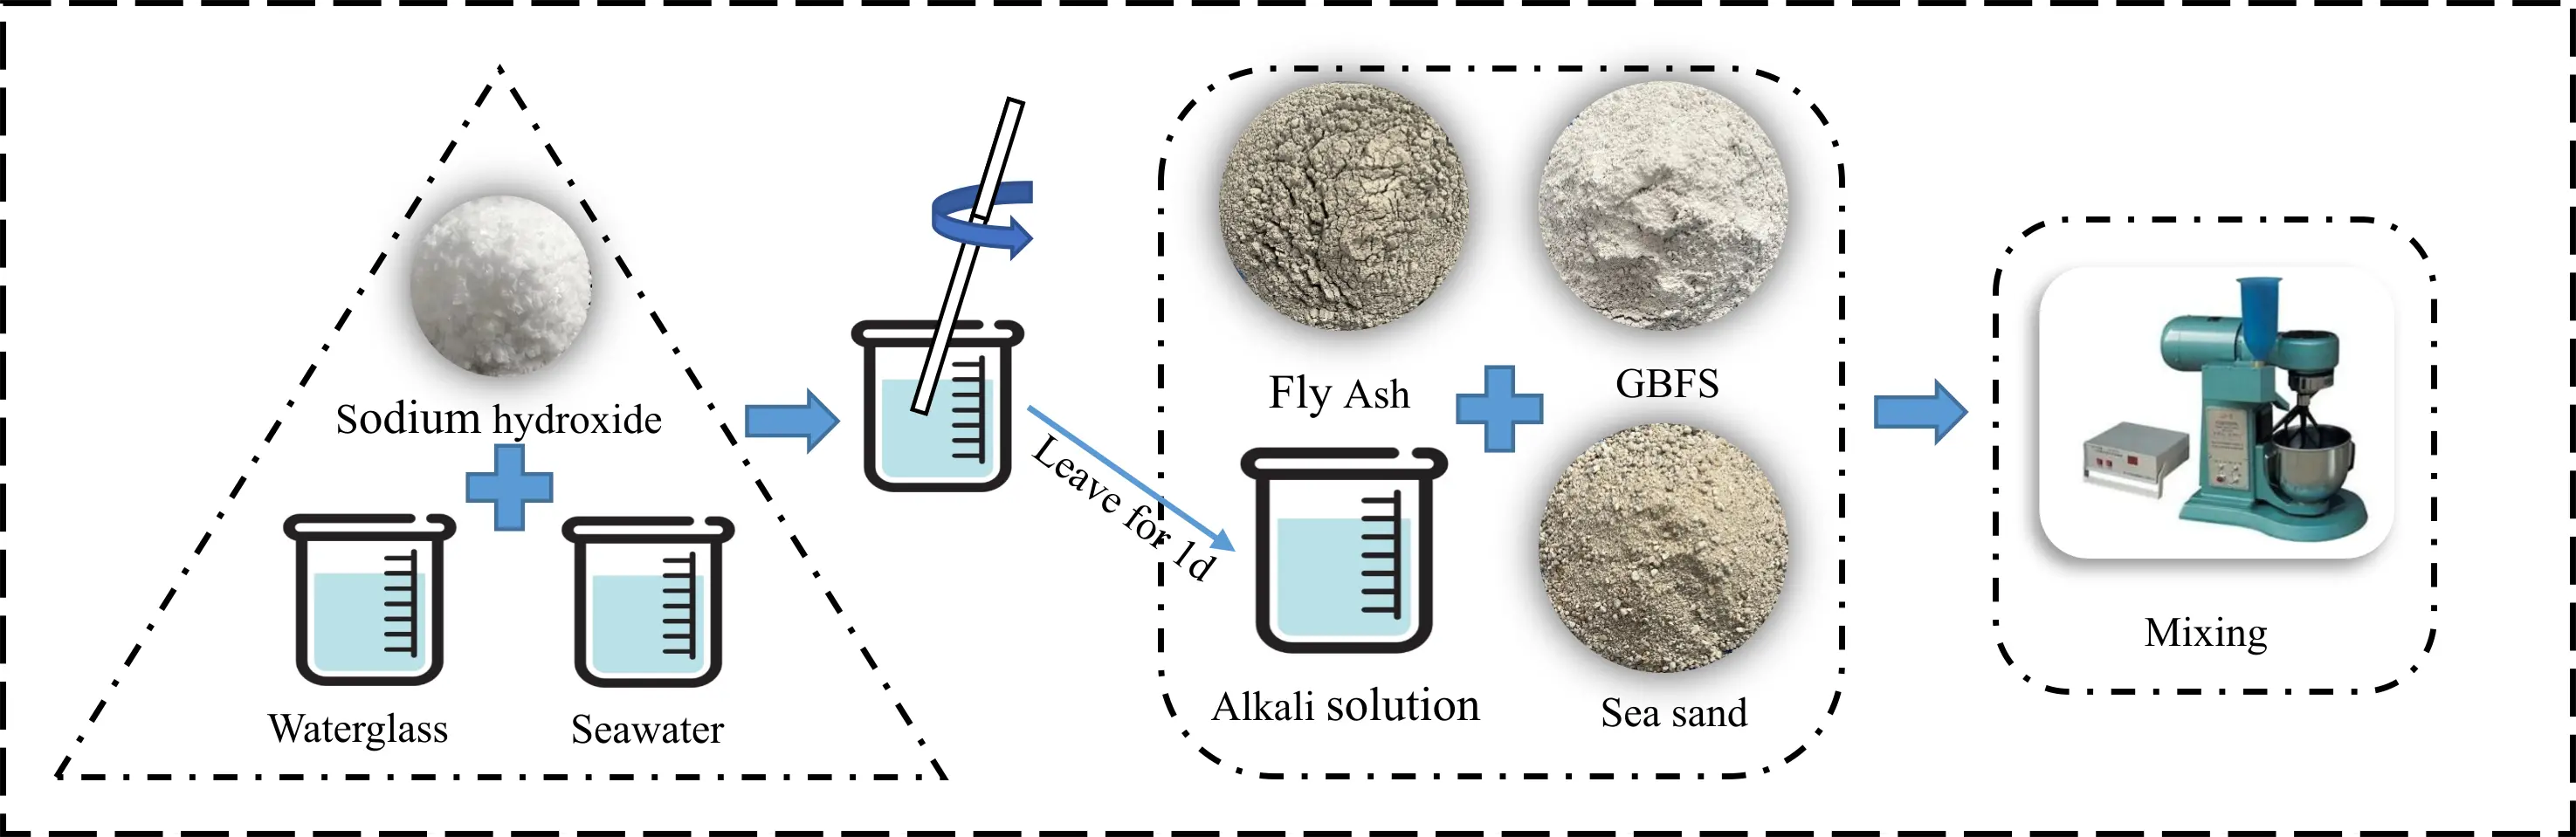
In strict compliance with GB/T 17671-2021[40], the dimensions of the specimens are 40 × 40 × 160 mm, with 6 specimens produced for each mix, totaling 162 geopolymers mortar specimens. These specimens underwent testing to evaluate their mechanical performance at various curing ages. The preparation process is visually represented in Figure 6. The steps for preparation are as follows: 1) Mix the water glass with sodium hydroxide solution according to the designed alkali modulus and concentration, and let it stand to cool for 24 hours to room temperature. 2) Prepare the alkali activator. Dry mix the FA, slag, and sea sand for 1 minute until uniformly combined. 3) Add the prepared alkali activator along with seawater to the dry materials, first stirring at low speed for
2.3 Testing methods
2.3.1 Consistency and flowability
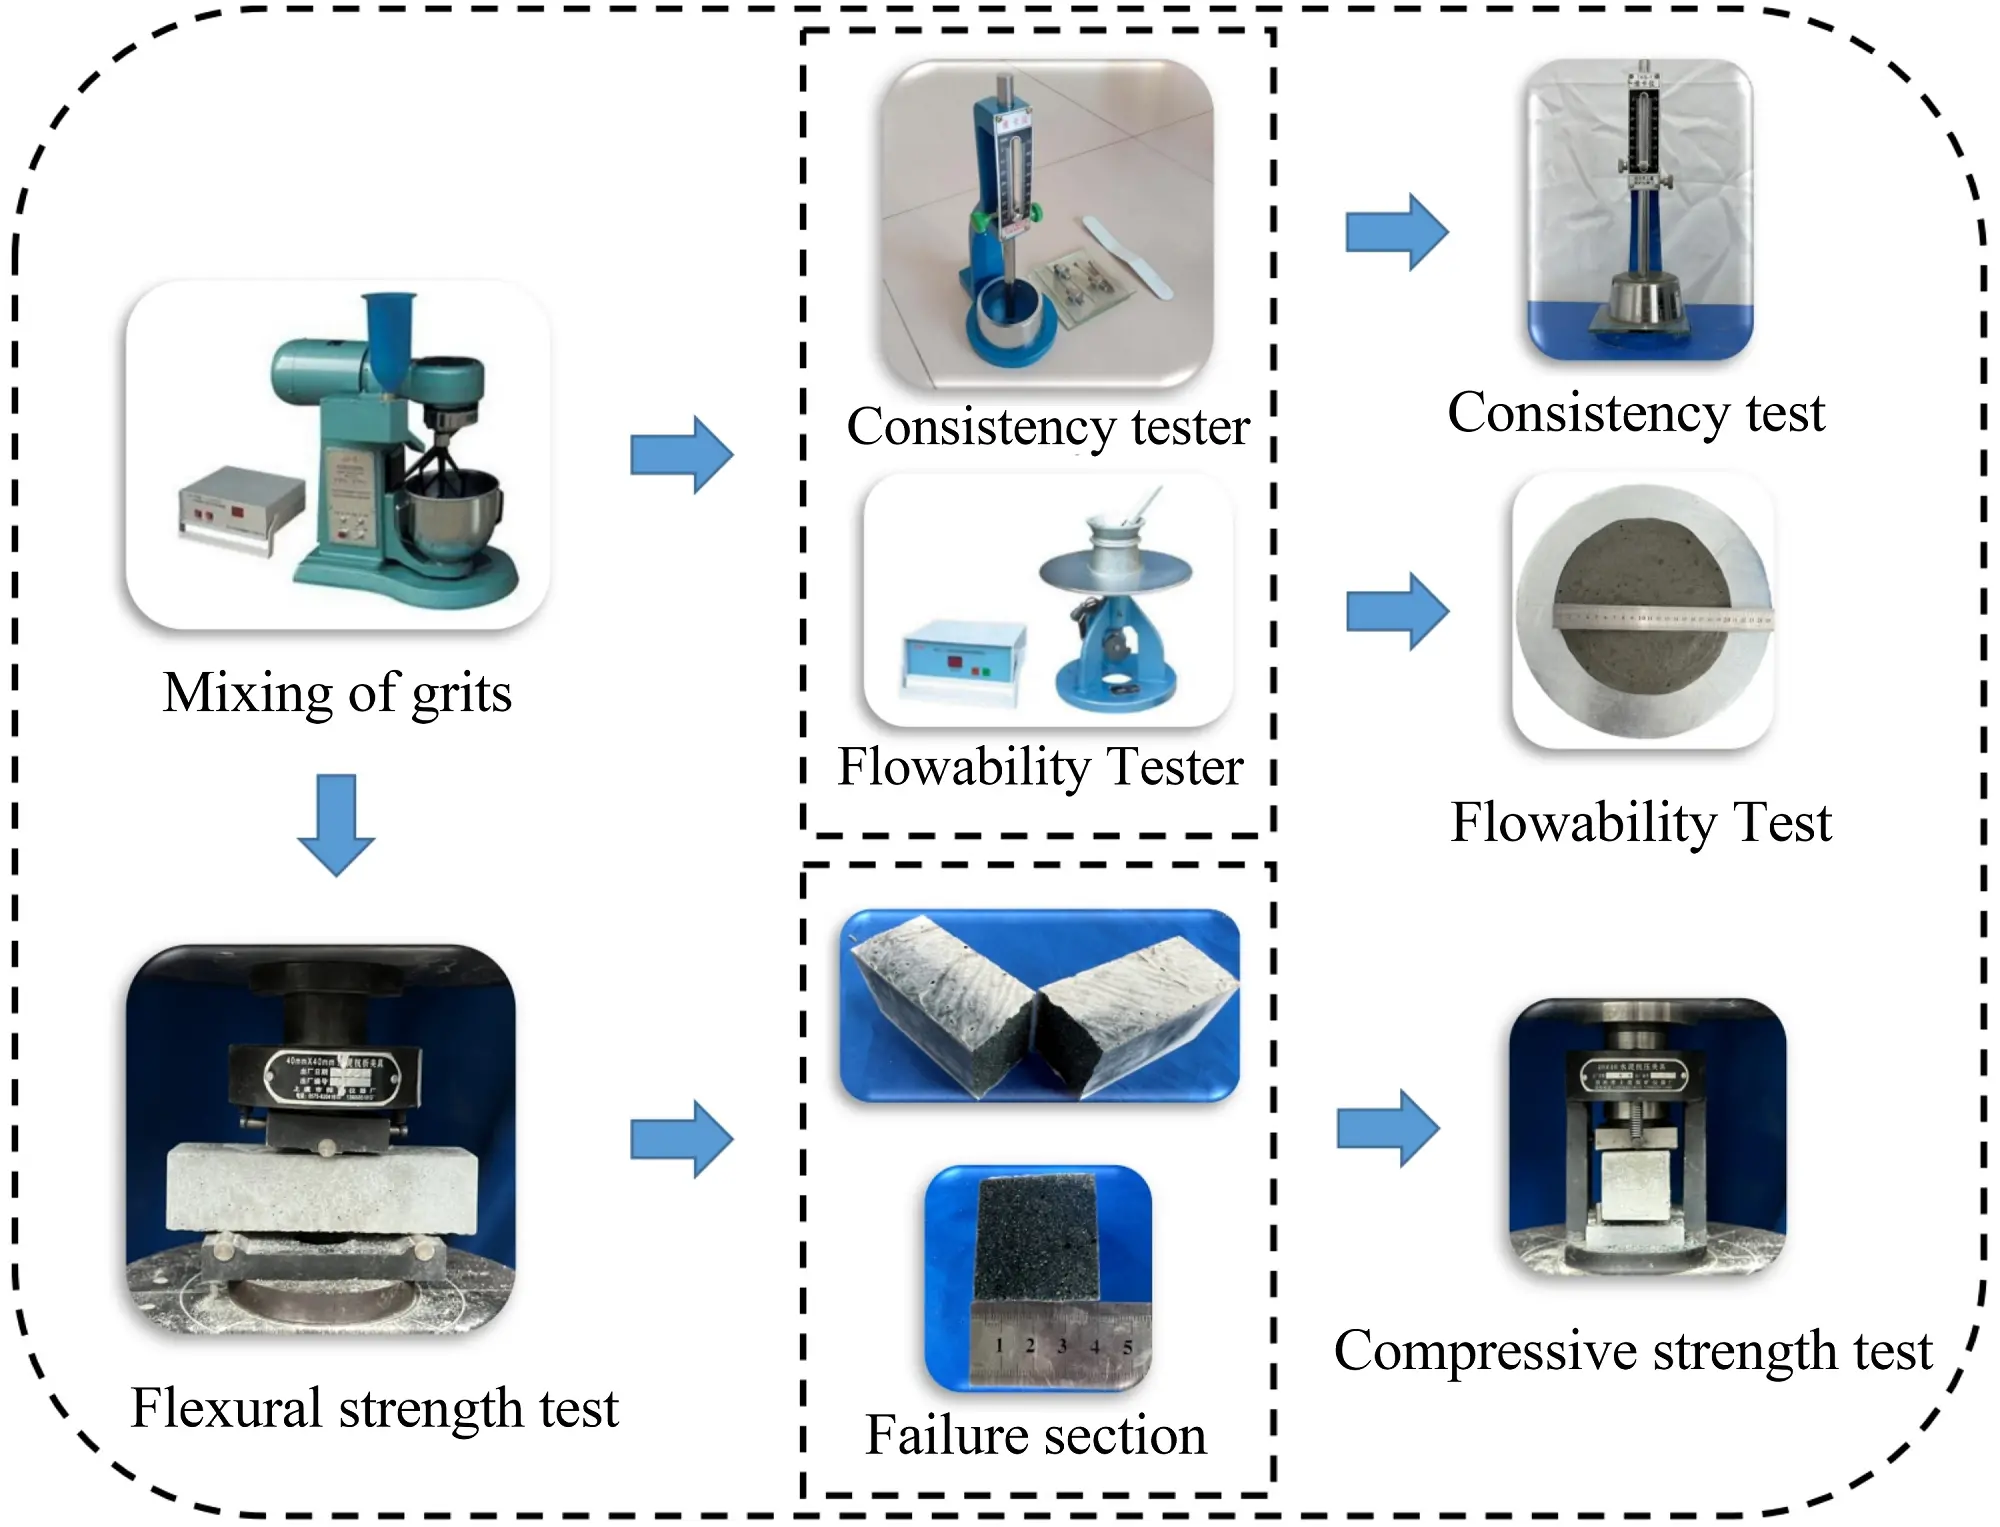
The consistency of the geopolymer mortar was assessed in strict accordance with the specifications of GB/T 1346-2011[41], and its flowability was measured following the guidelines of GB/T 2419-2005[42]. The detailed testing procedures are vividly presented in Figure 7.
2.3.2 Compressive and flexural strength tests
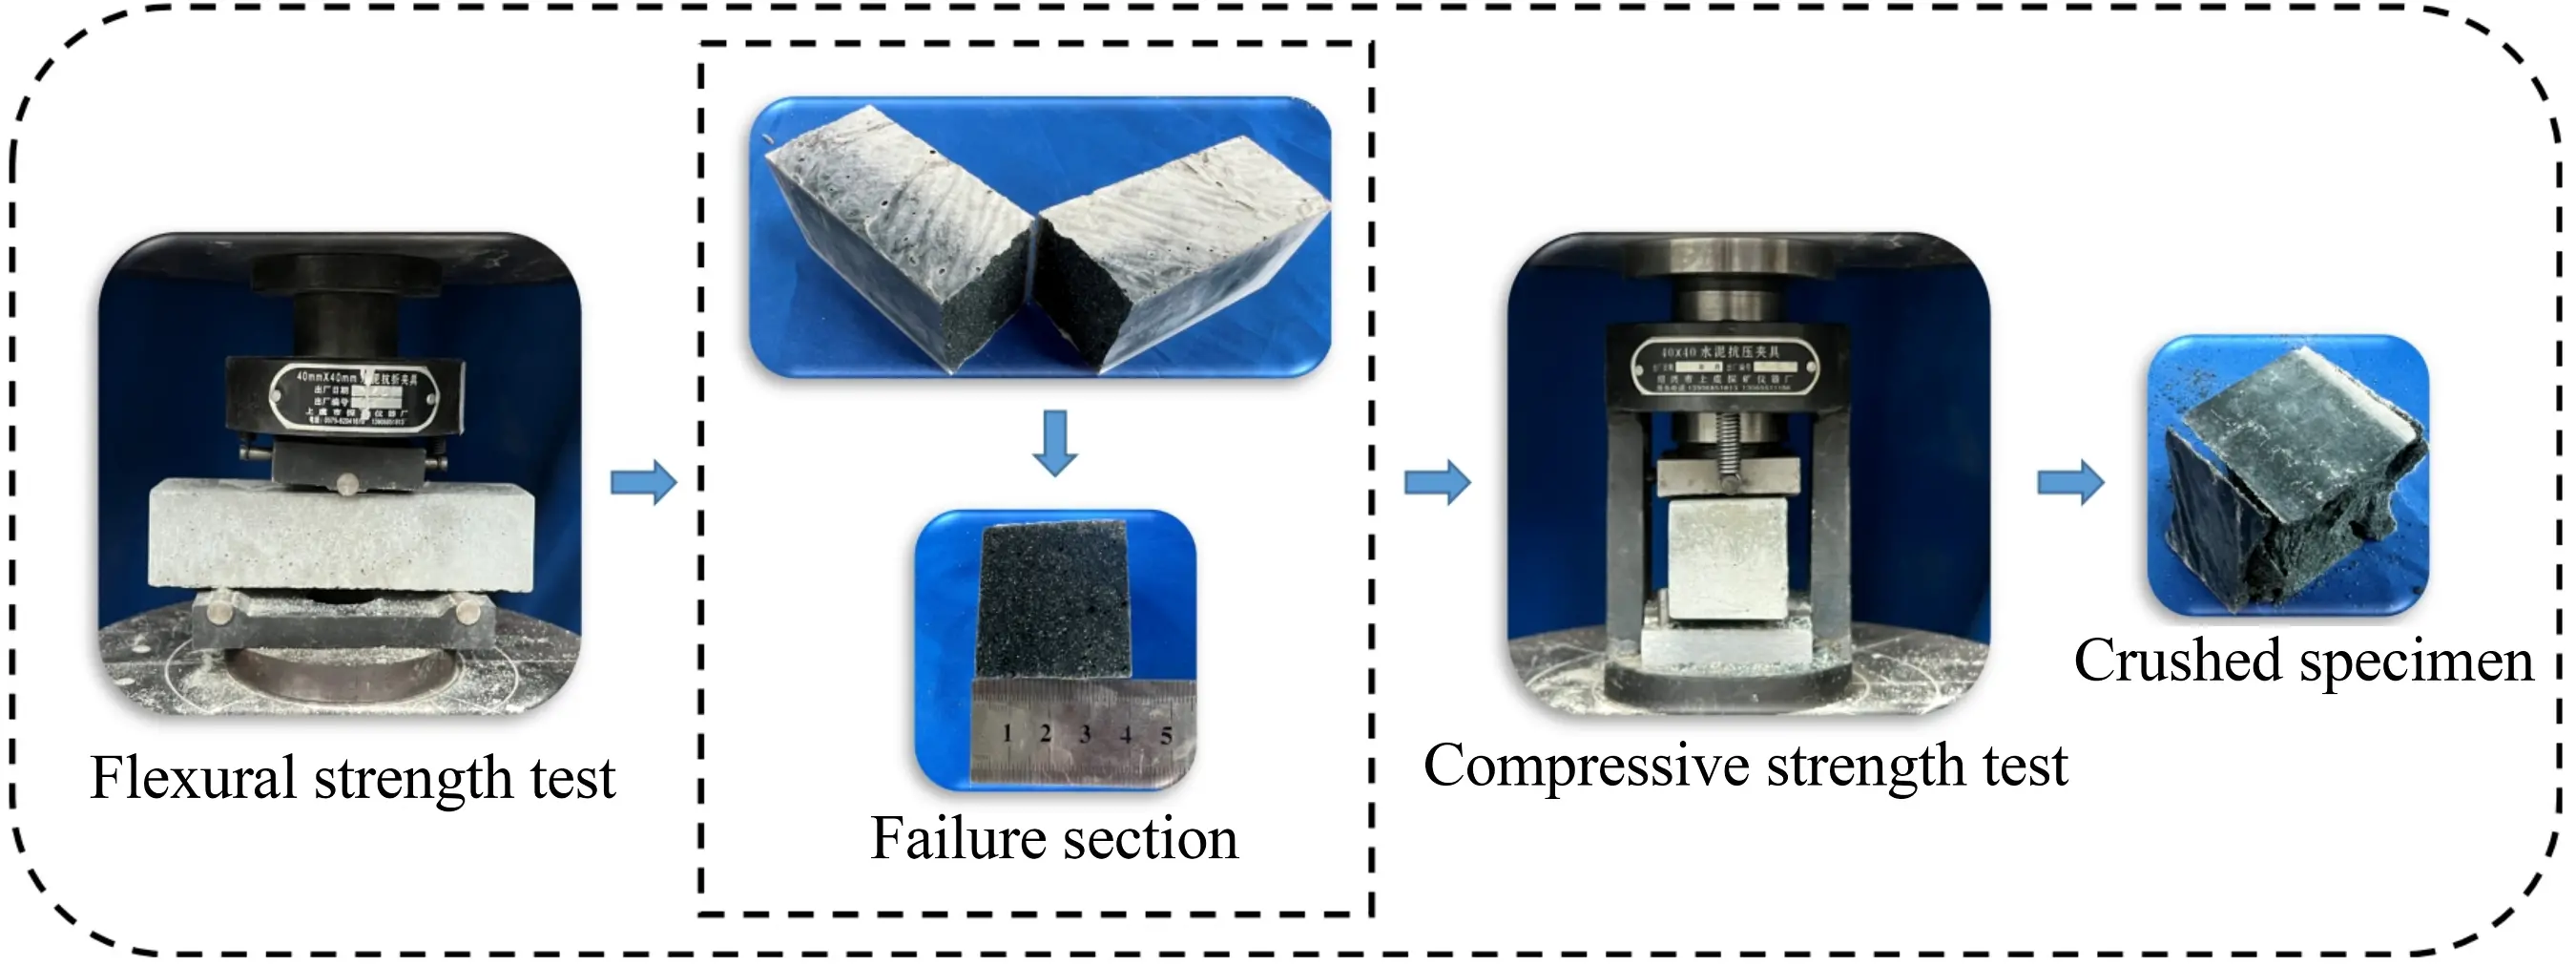
The compressive strength and flexural strength tests were conducted in accordance with the specifications of GB/T 17671-2021[40], and the testing process is shown in Figure 8.
The formula for calculating the flexural strength is as follows:
where Ri is the flexural strength (MPa); Ff is the load at the midpoint (N); L is the distance between the lower supports (mm); and b is the side length of the cross-section (mm).
The formula for calculating the compressive strength is as follows:
where Rc is the compressive strength (MPa); Fc is the applied load (N); and A is the cross-sectional area (mm2).
2.3.3 SEM and XRD analysis
SEM was utilized to examine the microstructure and morphology of the mortar samples that had been cured for 28 days. Upon the completion of the compressive strength tests, specific mortar samples were carefully sectioned for subsequent SEM analysis.
After 28 days of curing, the crystalline phases of the mortar samples were assessed using a powder XRD. The XRD analysis was conducted at an operating voltage of 40 kV and a current of 36 mA. Diffraction patterns were obtained in a 2θ range from 10° to 80° with a scan rate of 10° per minute. For the XRD analysis, the samples were finely ground to ensure that the particle size was smaller than 75 μm.
3. Results and Discussion
The summary of experimental results is summarized in Table 7.
Table 7. Experimental results.
| Type | Compressive strength (MPa) | Flexural strength (MPa) | Slump (mm) | Consistency (mm) | ||
| 7-days | 28-days | 7-days | 28-days | |||
| AAA | 36.82 | 40.98 | 6.04 | 7.43 | 4.80 | 16.60 |
| AAB | 14.52 | 19.63 | 3.70 | 5.19 | 3.90 | 18.00 |
| AAC | 2.89 | 3.93 | 0.82 | 1.11 | 2.50 | 20.70 |
| ABA | 47.30 | 55.88 | 6.89 | 8.29 | 2.30 | 22.50 |
| ABB | 39.51 | 55.09 | 6.18 | 8.16 | 1.80 | 25.00 |
| ABC | 33.22 | 41.67 | 4.14 | 6.50 | 1.70 | 26.20 |
| ACA | 47.48 | 59.95 | 6.49 | 8.52 | 2.20 | 21.80 |
| ACB | 39.19 | 59.30 | 4.92 | 6.89 | 1.30 | 25.50 |
| ACC | 29.25 | 43.65 | 3.83 | 6.83 | 1.00 | 27.00 |
| BAA | 31.88 | 35.56 | 3.26 | 4.12 | 4.40 | 16.70 |
| BAB | 2.16 | 2.65 | 0.95 | 1.35 | 3.70 | 17.80 |
| BAC | 0.53 | 0.78 | 0.82 | 1.11 | 2.20 | 19.60 |
| BBA | 56.92 | 63.71 | 6.36 | 8.56 | 2.20 | 21.50 |
| BBB | 50.26 | 56.32 | 6.06 | 7.33 | 2.00 | 23.90 |
| BBC | 29.21 | 38.29 | 4.86 | 6.74 | 1.50 | 24.60 |
| BCA | 55.02 | 58.52 | 6.20 | 8.12 | 1.90 | 22.50 |
| BCB | 42.55 | 54.95 | 5.91 | 7.17 | 1.20 | 23.20 |
| BCC | 24.01 | 39.13 | 4.61 | 6.47 | 0.90 | 24.40 |
| CAA | 0.44 | 0.50 | 0.83 | 0.95 | 5.00 | 15.30 |
| CAB | 0.78 | 0.90 | 0.87 | 1.03 | 4.00 | 15.50 |
| CAC | 0.45 | 0.56 | 0.66 | 0.91 | 3.50 | 17.00 |
| CBA | 45.76 | 64.46 | 6.59 | 8.76 | 2.00 | 21.50 |
| CBB | 38.53 | 51.43 | 5.32 | 6.90 | 1.70 | 23.50 |
| CBC | 19.14 | 32.38 | 4.21 | 5.89 | 1.30 | 26.00 |
| CCA | 51.35 | 59.58 | 6.21 | 7.38 | 2.00 | 22.00 |
| CCB | 37.28 | 49.34 | 6.80 | 8.90 | 1.50 | 22.50 |
| CCC | 23.77 | 35.13 | 4.67 | 6.69 | 1.20 | 23.50 |
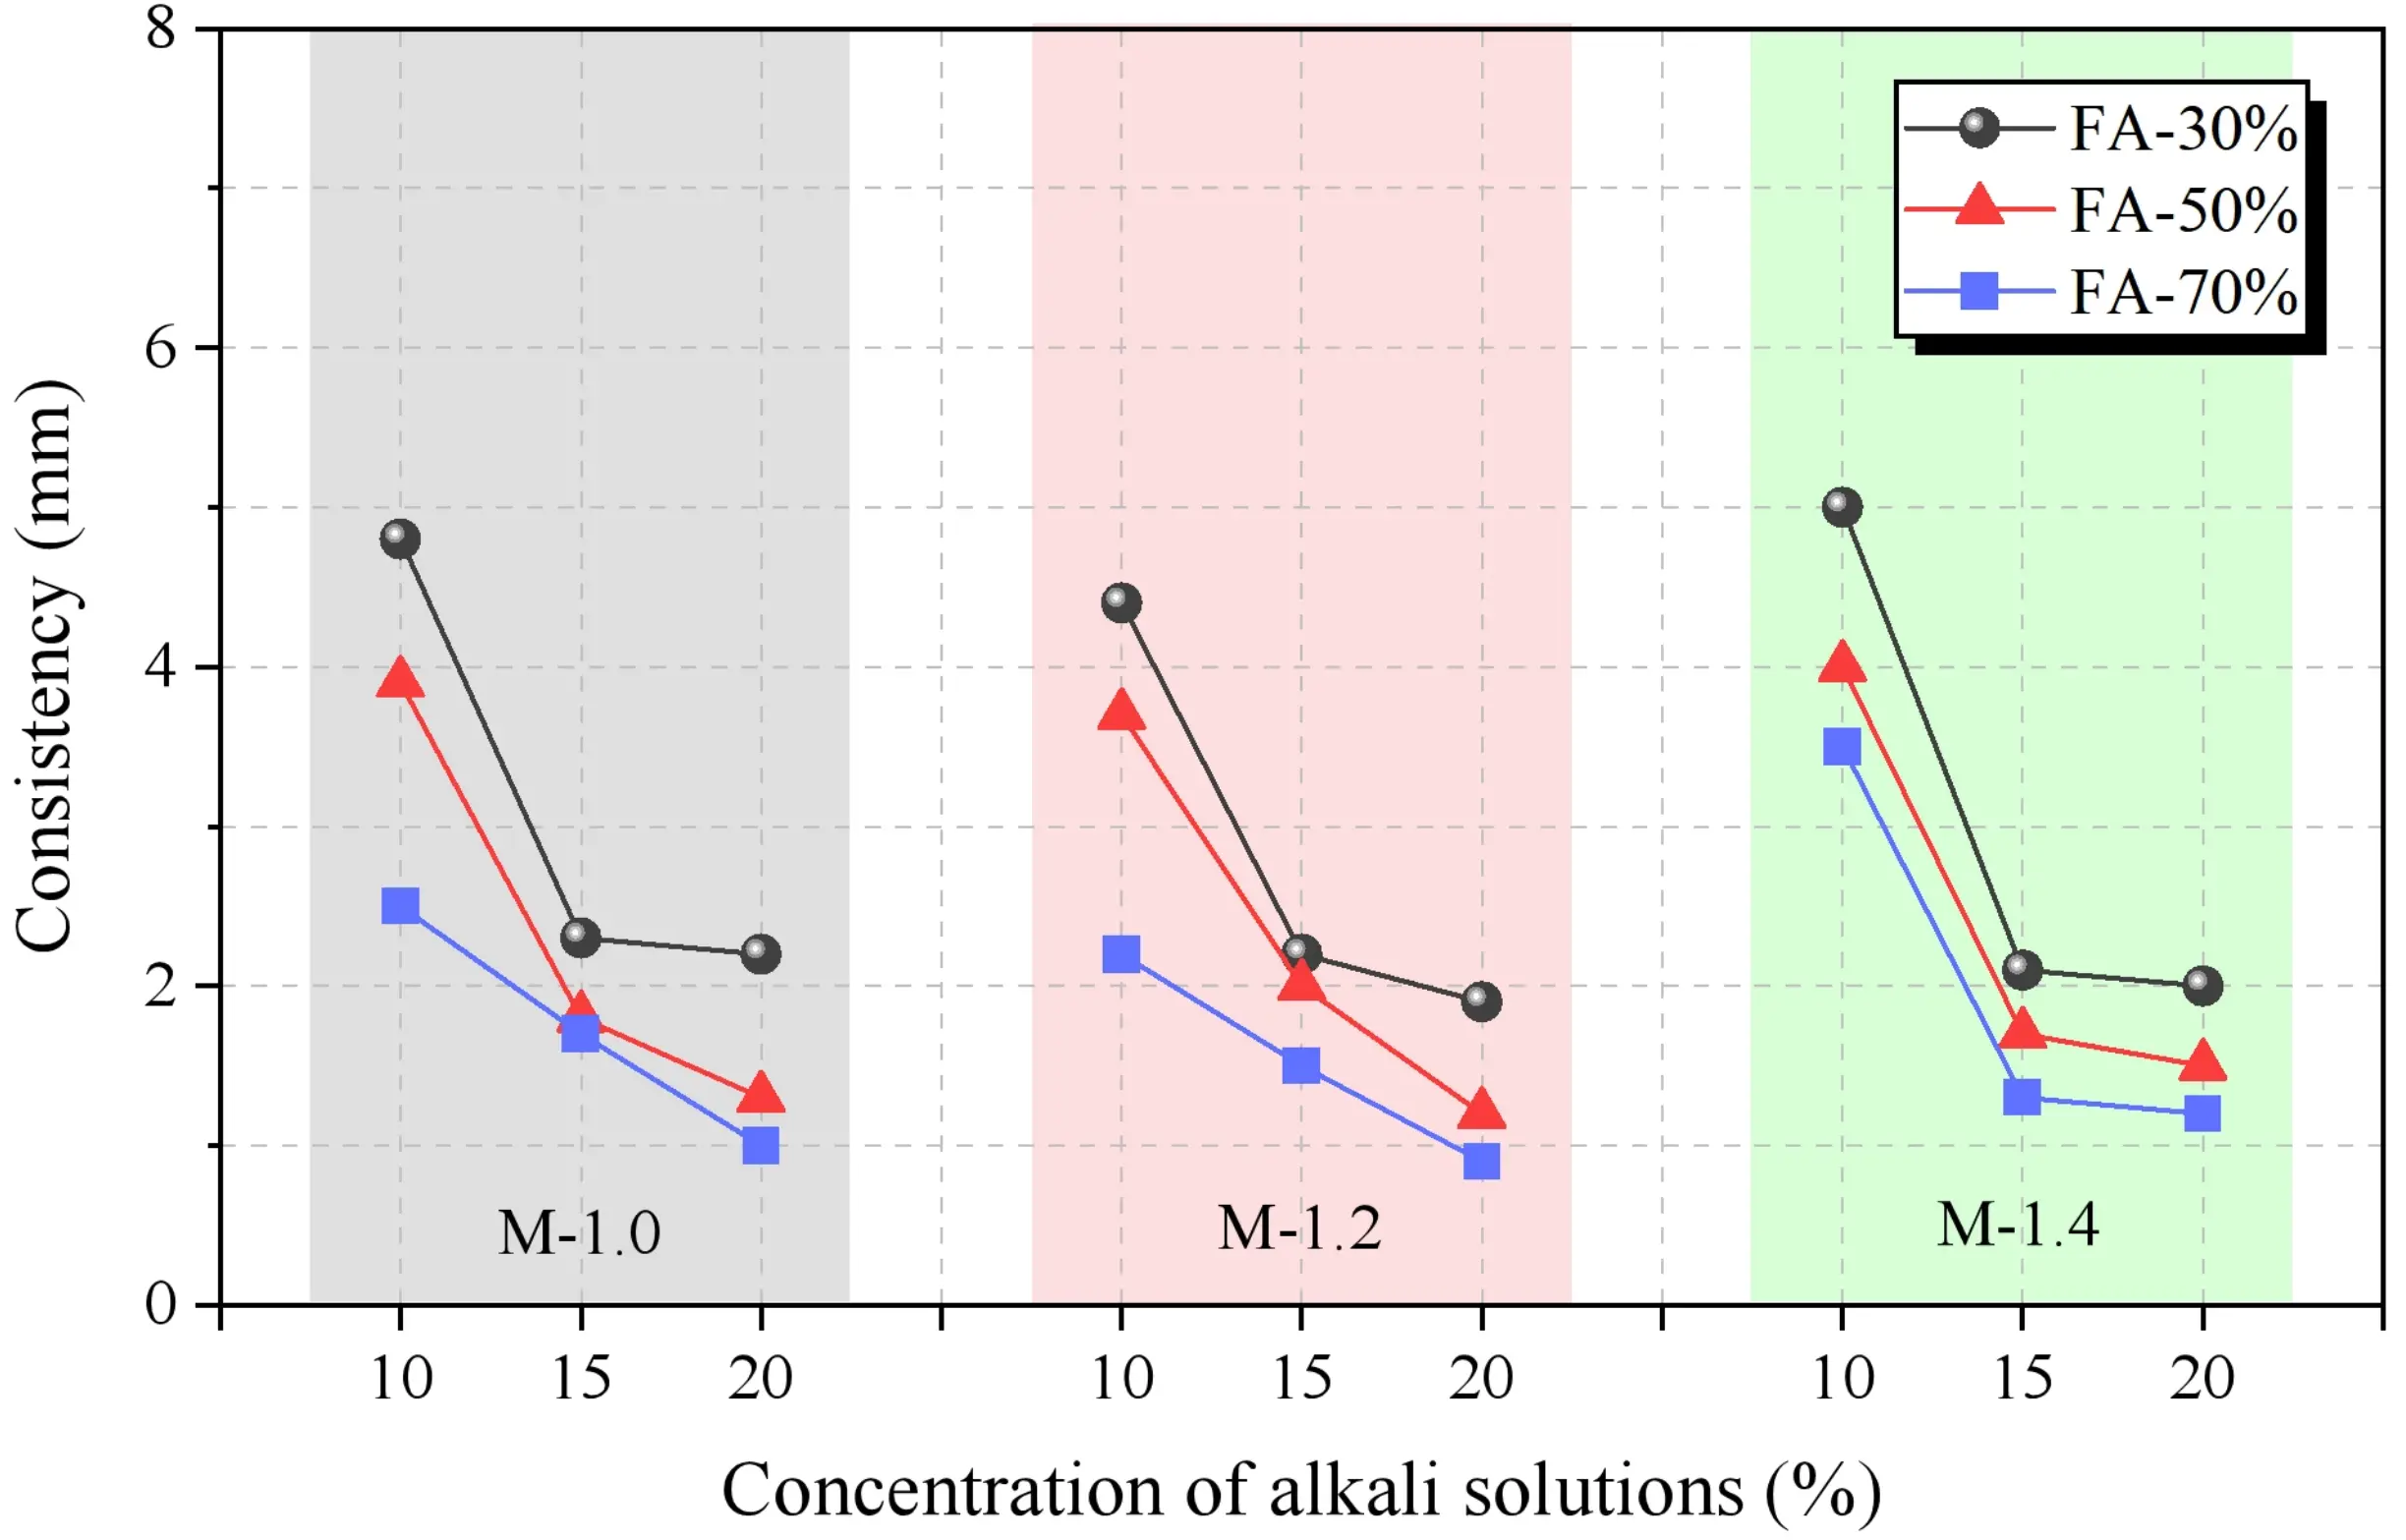
3.1 Consistency
Based on the observations from Figure 9, under the same water-to-binder ratio, the consistency of SWSSGM decreases with an increase in the amount of FA, while an increase in the GBFS content leads to greater consistency. This indicates that FA is more effective than GBFS in enhancing the workability of GC. The increase in GBFS content raises the Ca2+ concentration in the solution, accelerating the formation of calcium silicate hydrate[43]. Additionally, at varying concentrations of alkaline solution, the consistency decreases initially and then stabilizes, whereas no clear trend was observed in experiments with different alkali moduli, warranting further investigation.
To further analyze the effects of three factors on the consistency of SWSSGM, pairwise combinations of these factors were created, and the data for the remaining factor were averaged, as shown in Figure 10. From Figure 10a, it is evident that as the concentration of the alkaline solution increases, consistency decreases by 61.18% when the concentration rises from 10% to 20%. A significant reduction of 51.18% occurs when the concentration increases from 10% to 15%. However, when increasing from 15% to 20%, consistency continues to decrease, but at a slower rate, with only a 20.48% reduction. This phenomenon is attributed to the increase in moisture within the paste as the concentration of the alkaline solution rises. By the time the concentration reaches 15%, the consistency of the paste is already close to its peak, and further increases in concentration do not significantly lower consistency. As can be observed from Figure 10b, the consistency decreased as the modulus varied from 1.0 to 1.4. Figure 10c illustrates that with increasing FA content, consistency gradually decreases, with a 41.26% reduction observed as the FA proportion increases from 30% to 70%. This observation aligns with the results in Figure 9.
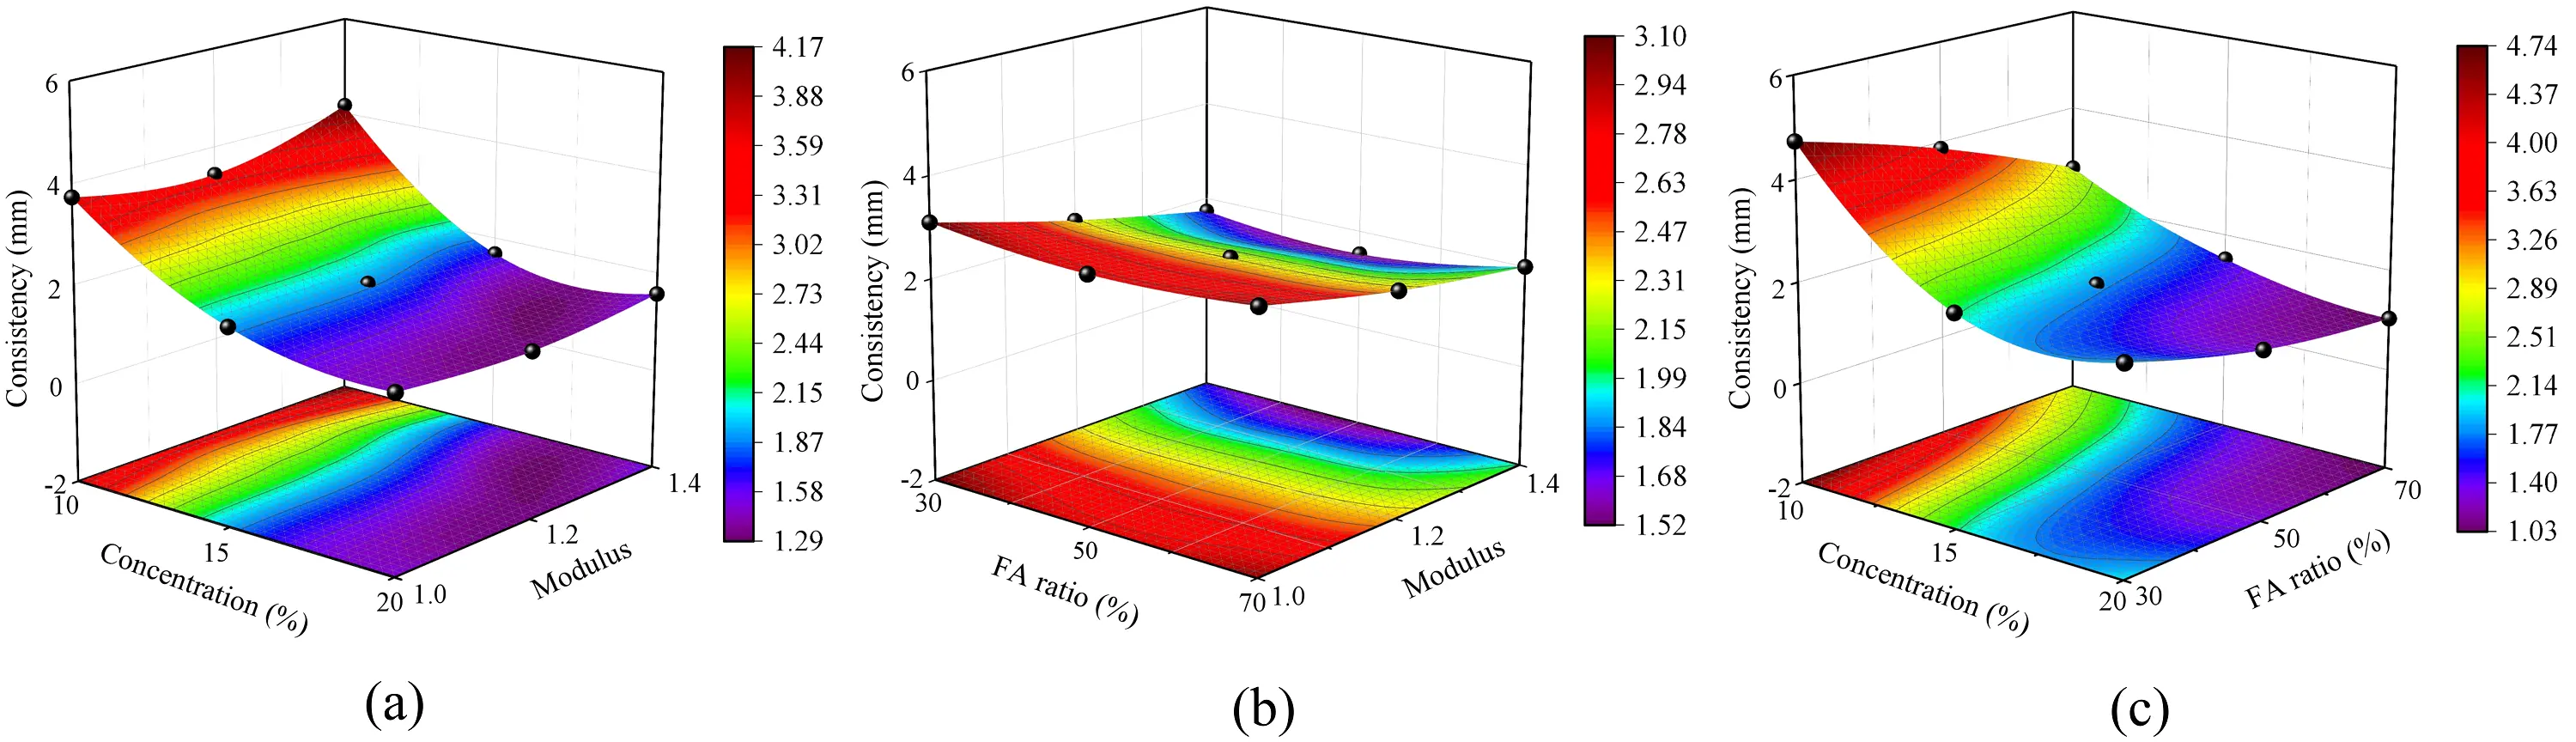
Figure 10. Sensitivity analysis of mortar consistency. (a) Effect of concentration and modulus on consistency; (b) Effect of FA ratio and modulus on consistency; (c) Effect of concentration and FA ratio on consistency. FA: fly ash.
3.2 Slump
According to Figure 11, under the same water-to-binder ratio, the slump of SWSSGM increases with the addition of FA, while an increase in GBFS content leads to a decrease in slump. Furthermore, the slump shows an initial increase followed by stabilization at varying concentrations of alkaline solution. The response graph for the various factors affecting slump is presented in Figure 12. It is evident that the overall trend of slump is the opposite to that of consistency. As the concentration of the alkaline solution increases from 10% to 15% and then to 20%, the slump increases rapidly at first and then more slowly, with an overall increase of 27.74%. Meanwhile, the slump increases by 91.89% as the FA content rises from 30% to 70%.
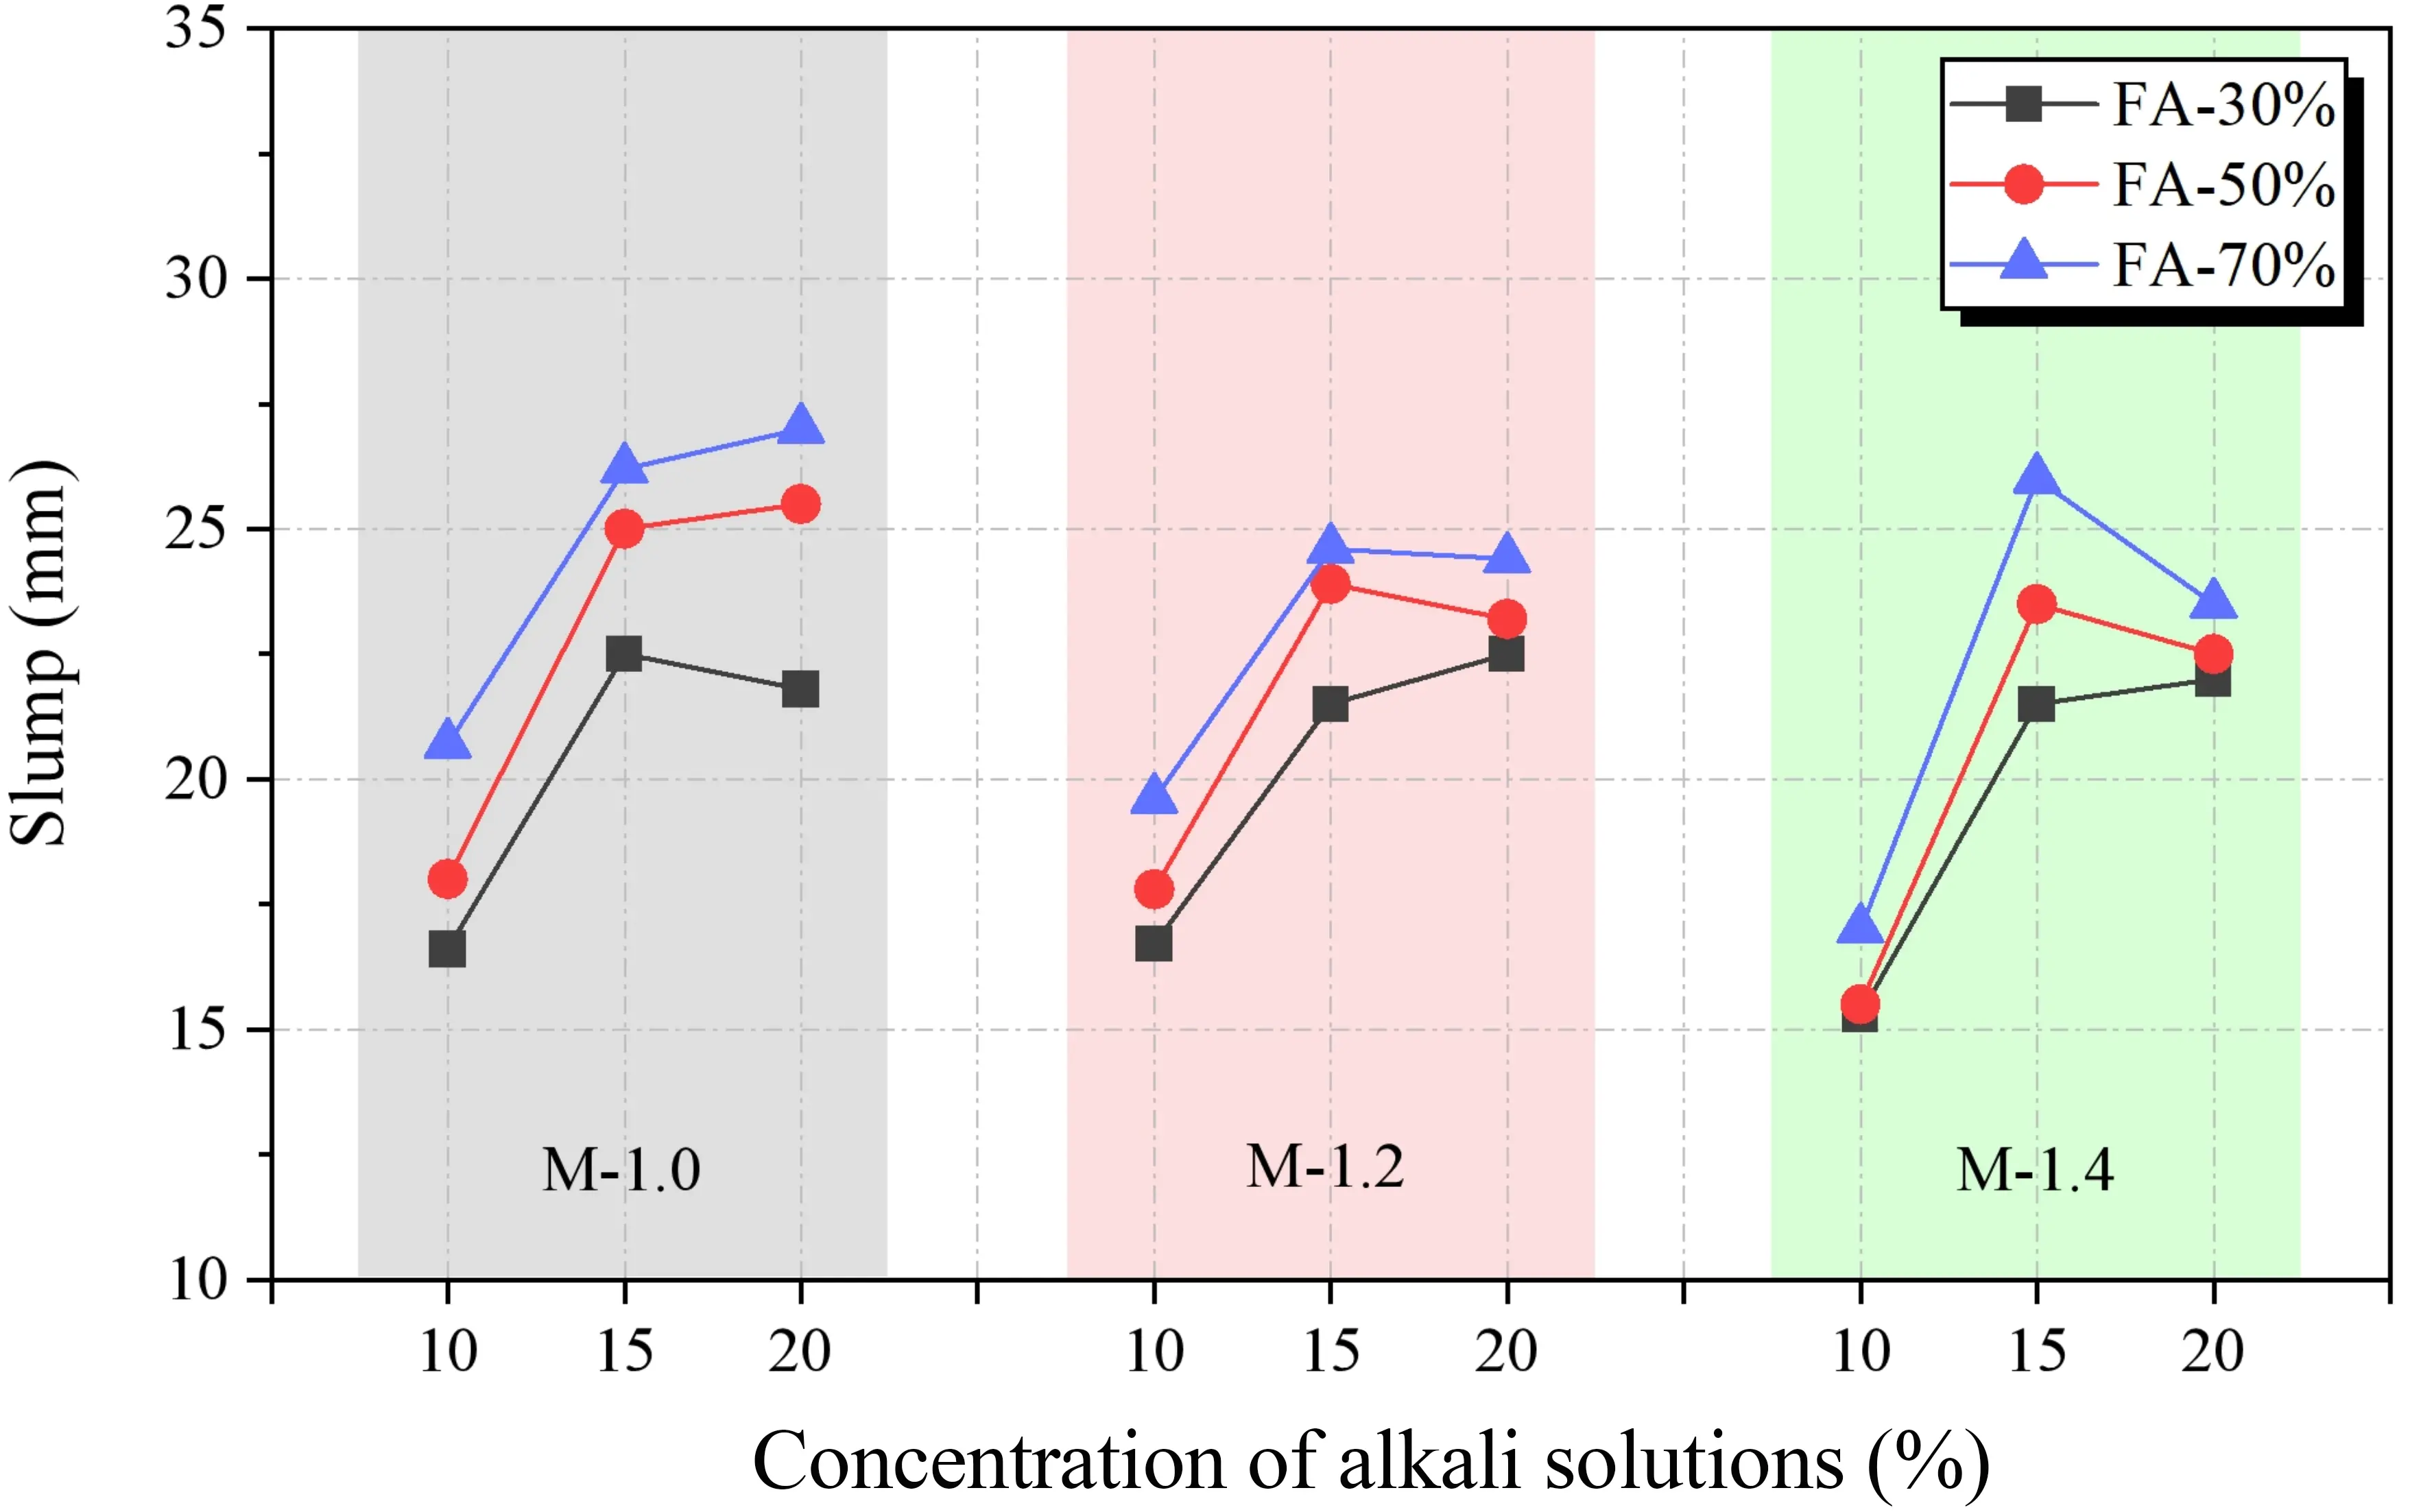
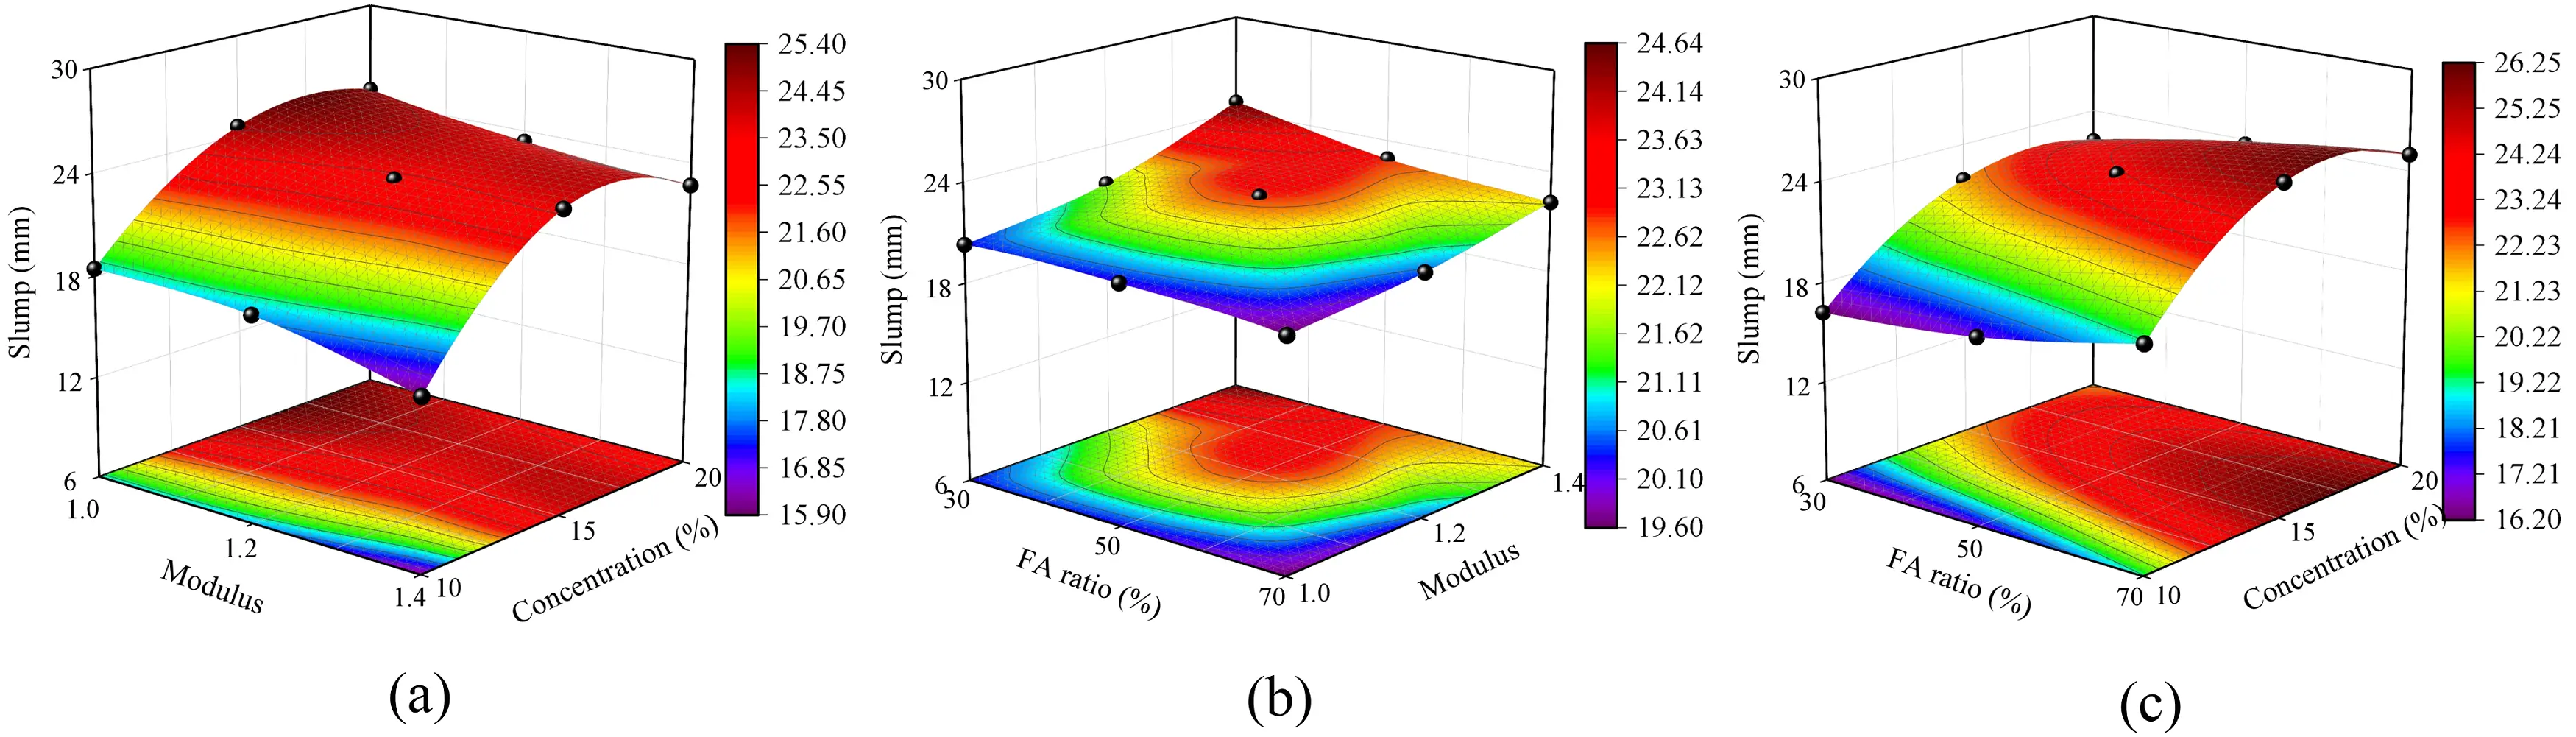
Figure 12. Slump sensitivity analysis. (a) Effect of concentration and modulus on slump; (b) Effect of FA ratio and modulus on slump; (c) Effect of concentration and FA ratio on slump. FA: fly ash.
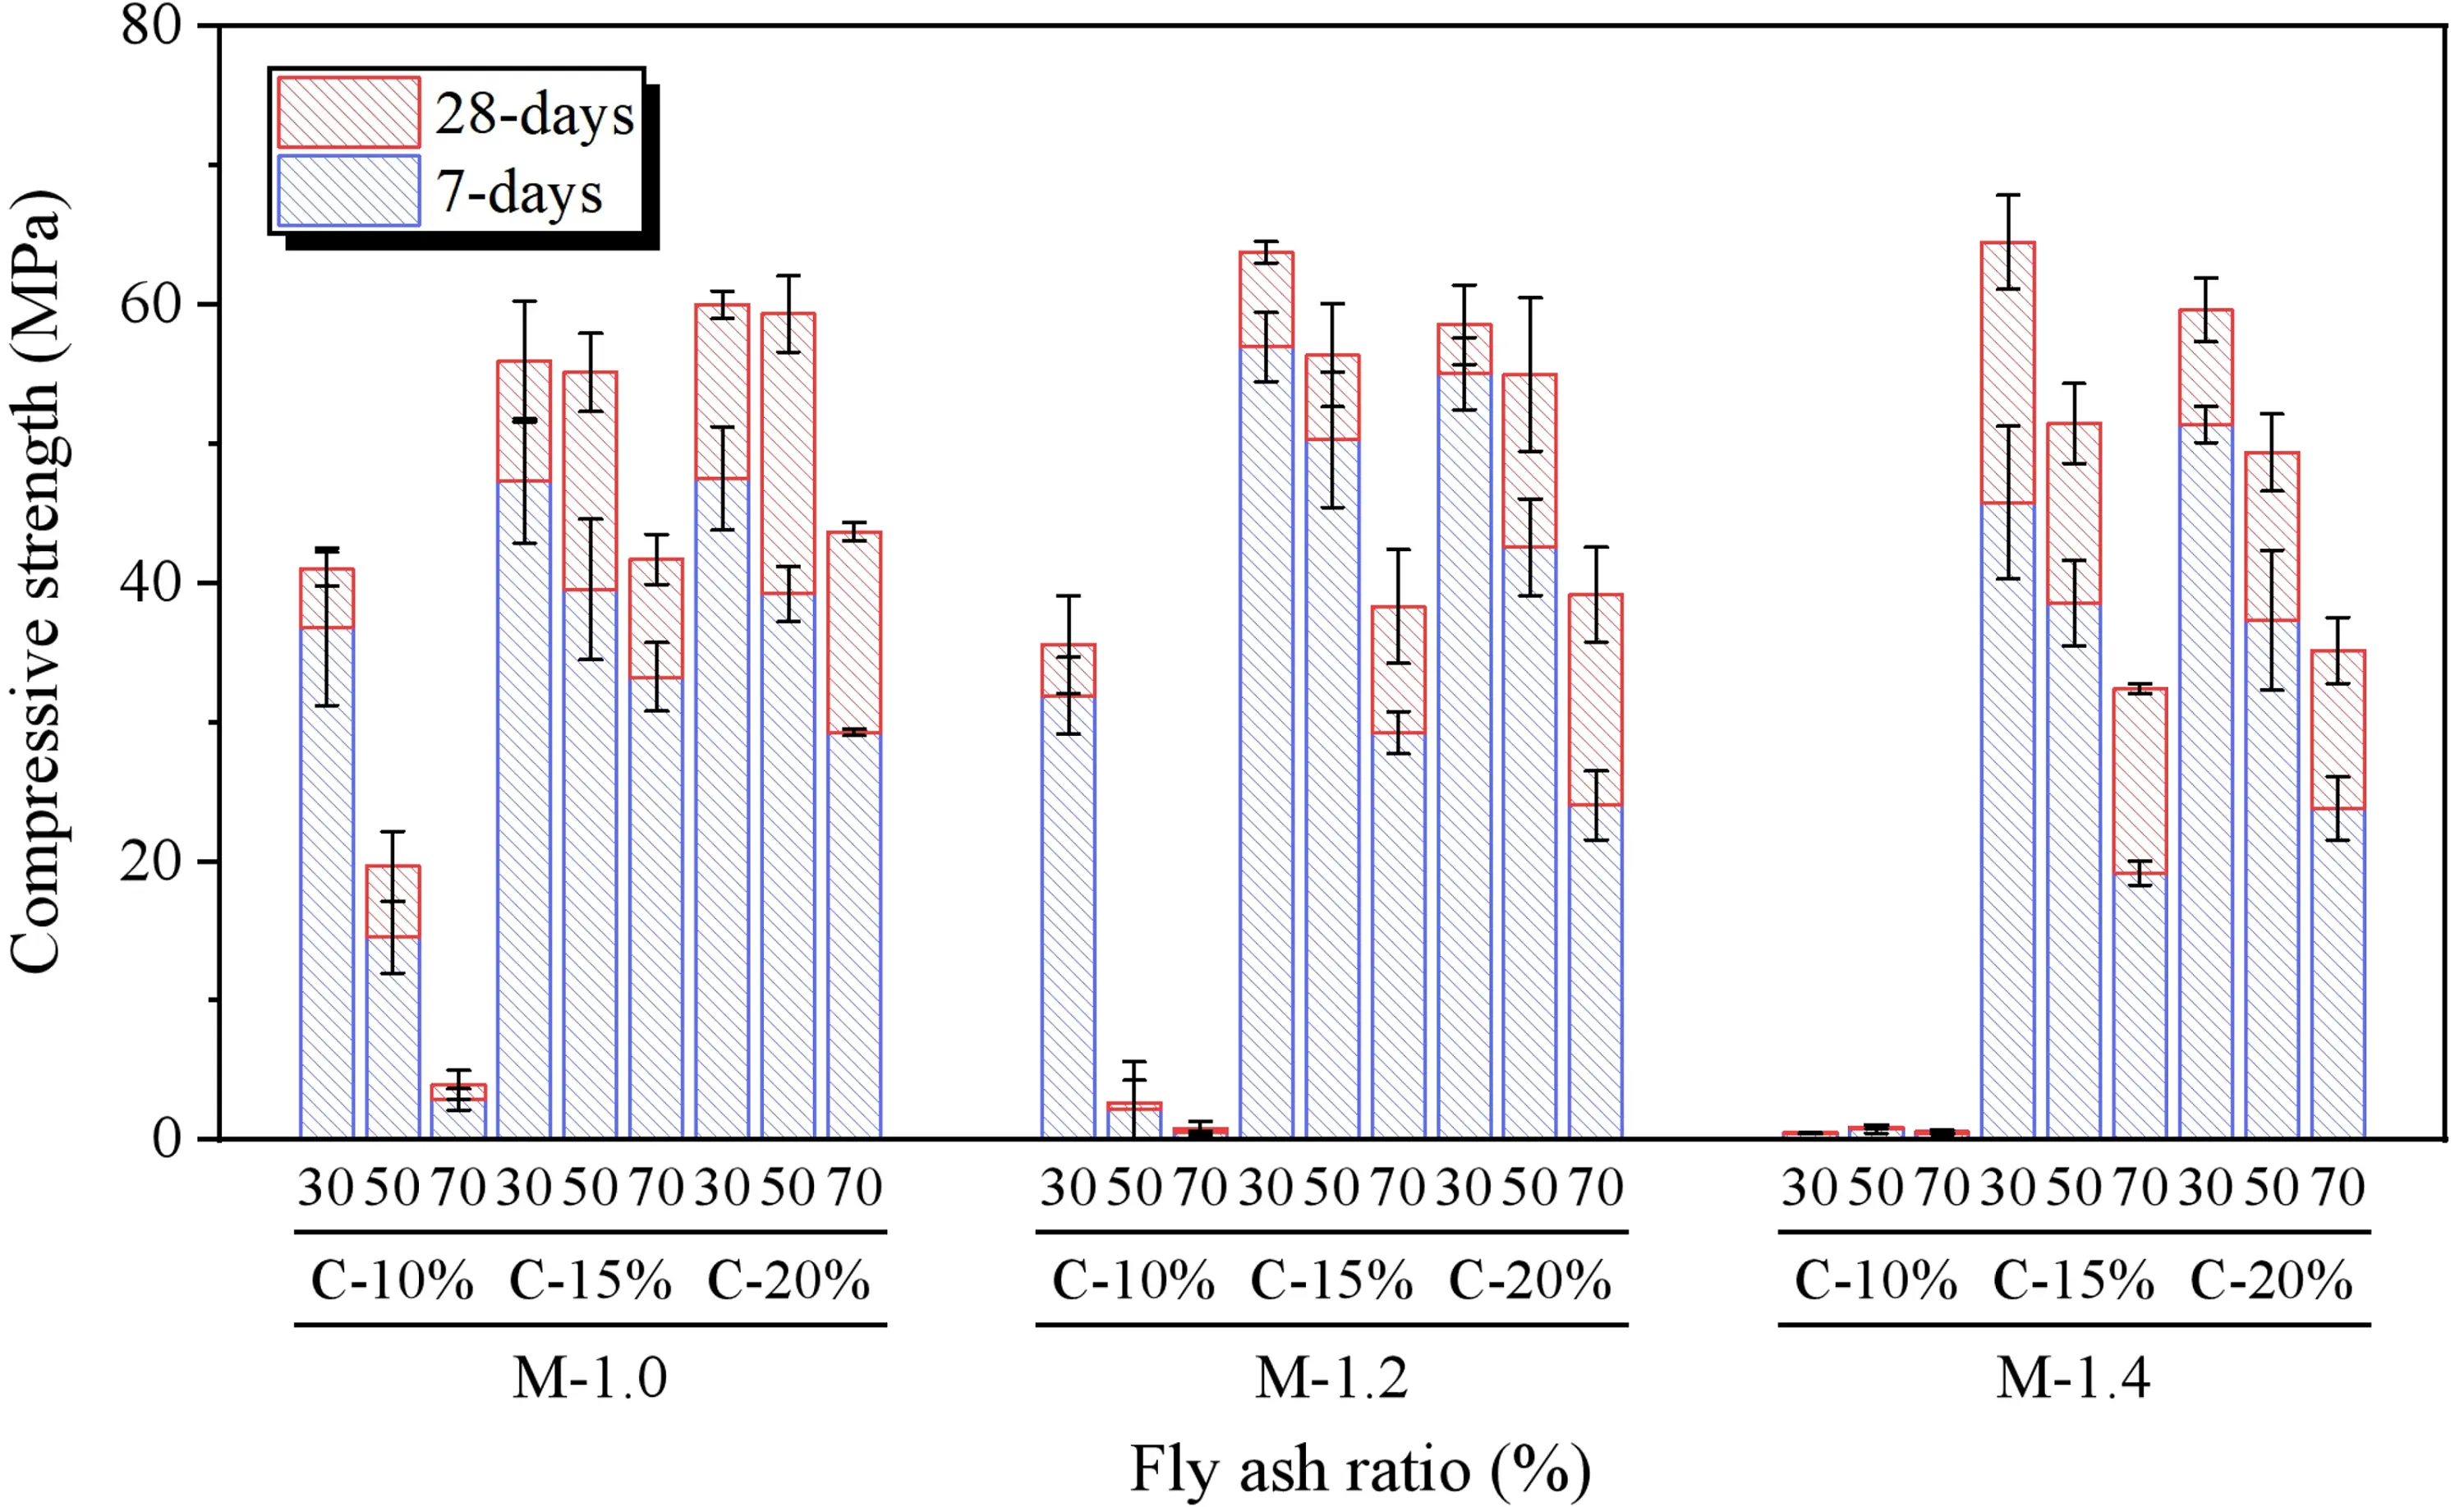
3.3 Compressive strength
The results of the compressive strength tests for SWSSGM are shown in Figure 13. When the alkali concentration is 10%, the compressive strength of the paste decreases by 96.95% as the alkali modulus changes from 1.0 to 1.4. In contrast, at alkali concentrations of 15% and 20%, the compressive strength initially increases and then decreases as the alkali modulus of the geopolymer agent increases, peaking at an alkali modulus of 1.2. Additionally, the compressive strength at all ages reaches its maximum at an alkali concentration of 15%. Further increases in alkali concentration lead to minimal changes or a decrease in strength, likely due to the optimal alkali concentration of 15% providing sufficient reaction for the silicoaluminate within the system. Beyond this point, increasing alkali concentration raises the pH of the reaction mixture, leading to a drop in strength[44]. Furthermore, as the FA content rises from 30% to 70%, compressive strength decreases by 48.27%. This decline occurs because the increase in FA reduces the GBFS content, and GBFS, with its higher CaO content, can form amorphous Ca-Al-Si gels, significantly enhancing the strength of the geopolymer[45]. In summary, the optimal compressive strength is observed when the geopolymer alkali modulus is 1.2, alkali concentration is 15%, and FA content is 30%.
To explore the enhancement patterns of compressive strength in SWSSGM, a comparison was made between the compressive strengths of the paste after 7 days and 28 days of curing, as shown in Figure 14. Overall, the compressive strength for SWSSGM remains within the range of 0.7-0.8 at both 7 days and 28 days. From Figure 14b, it can be observed that the specimens with 30% FA exhibit a 7d/28d ratio significantly greater than 70%. This indicates that the inclusion of GBFS enhances the early strength development of the concrete. The primary reason for this is the fine particle size of GBFS, which increases the reactive surface area and accelerates the reaction process of FA, consequently improving the rate of strength gain[46]. Furthermore, an increase in the proportion of FA leads to a notable enhancement in the strength of the mortar, with an average increase in strength enhancement ratio of 15.29%. This finding is consistent with previous studies[47], primarily due to the faster reaction rate of GBFS compared to FA. Figure 14c indicates that an increase in alkali concentration positively influences the strength of the paste, resulting in an average strength enhancement of 7.5%. This effect occurs because a higher alkaline environment provides better conditions for reactions, allowing FA and GBFS to react more effectively in a concentrated alkaline solution. However, as shown in Figure 14a, variations in alkali modulus do not demonstrate a clear influence on paste strength, indicating that further research is needed to analyze this phenomenon.
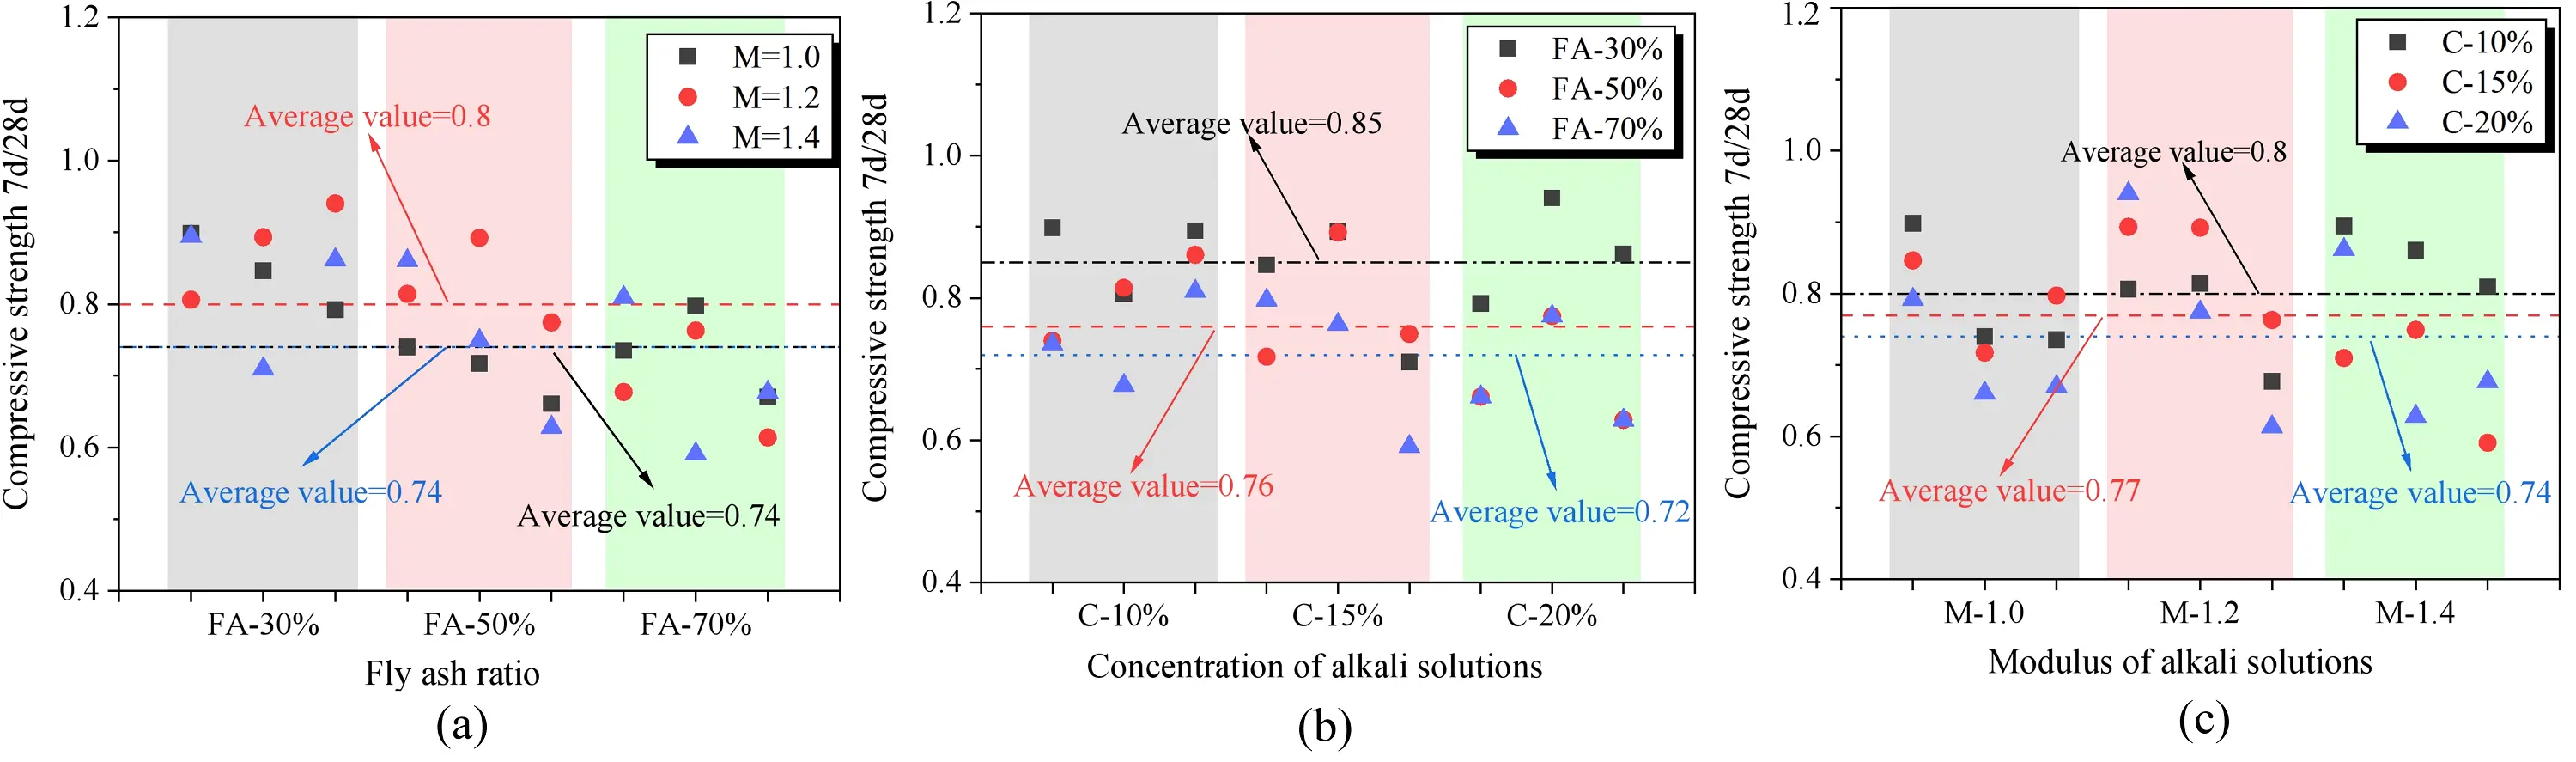
Figure 14. Mortar compressive strength enhancement comparison. (a) Effect of modulus on compressive strength enhancement of mortar; (b) Effect of FA ratio on compressive strength enhancement of mortar; (c) Effect of alkali solubility on compressive strength enhancement of mortar. FA: fly ash.
3.4 Flexural strength
The results of the flexural strength tests for SWSSGM are presented in Figure 15. Similar to the compressive strength results, when the alkali concentration is 10%, the flexural strength decreases by 78.35% as the alkali modulus of the alkaline activator increases. However, at alkali concentrations of 15% and 20%, the flexural strength peaks at an alkali modulus of 1.2. The increase in FA content corresponds to a decrease in flexural strength, with an average reduction of 33.86% observed as the FA proportion rises from 30%
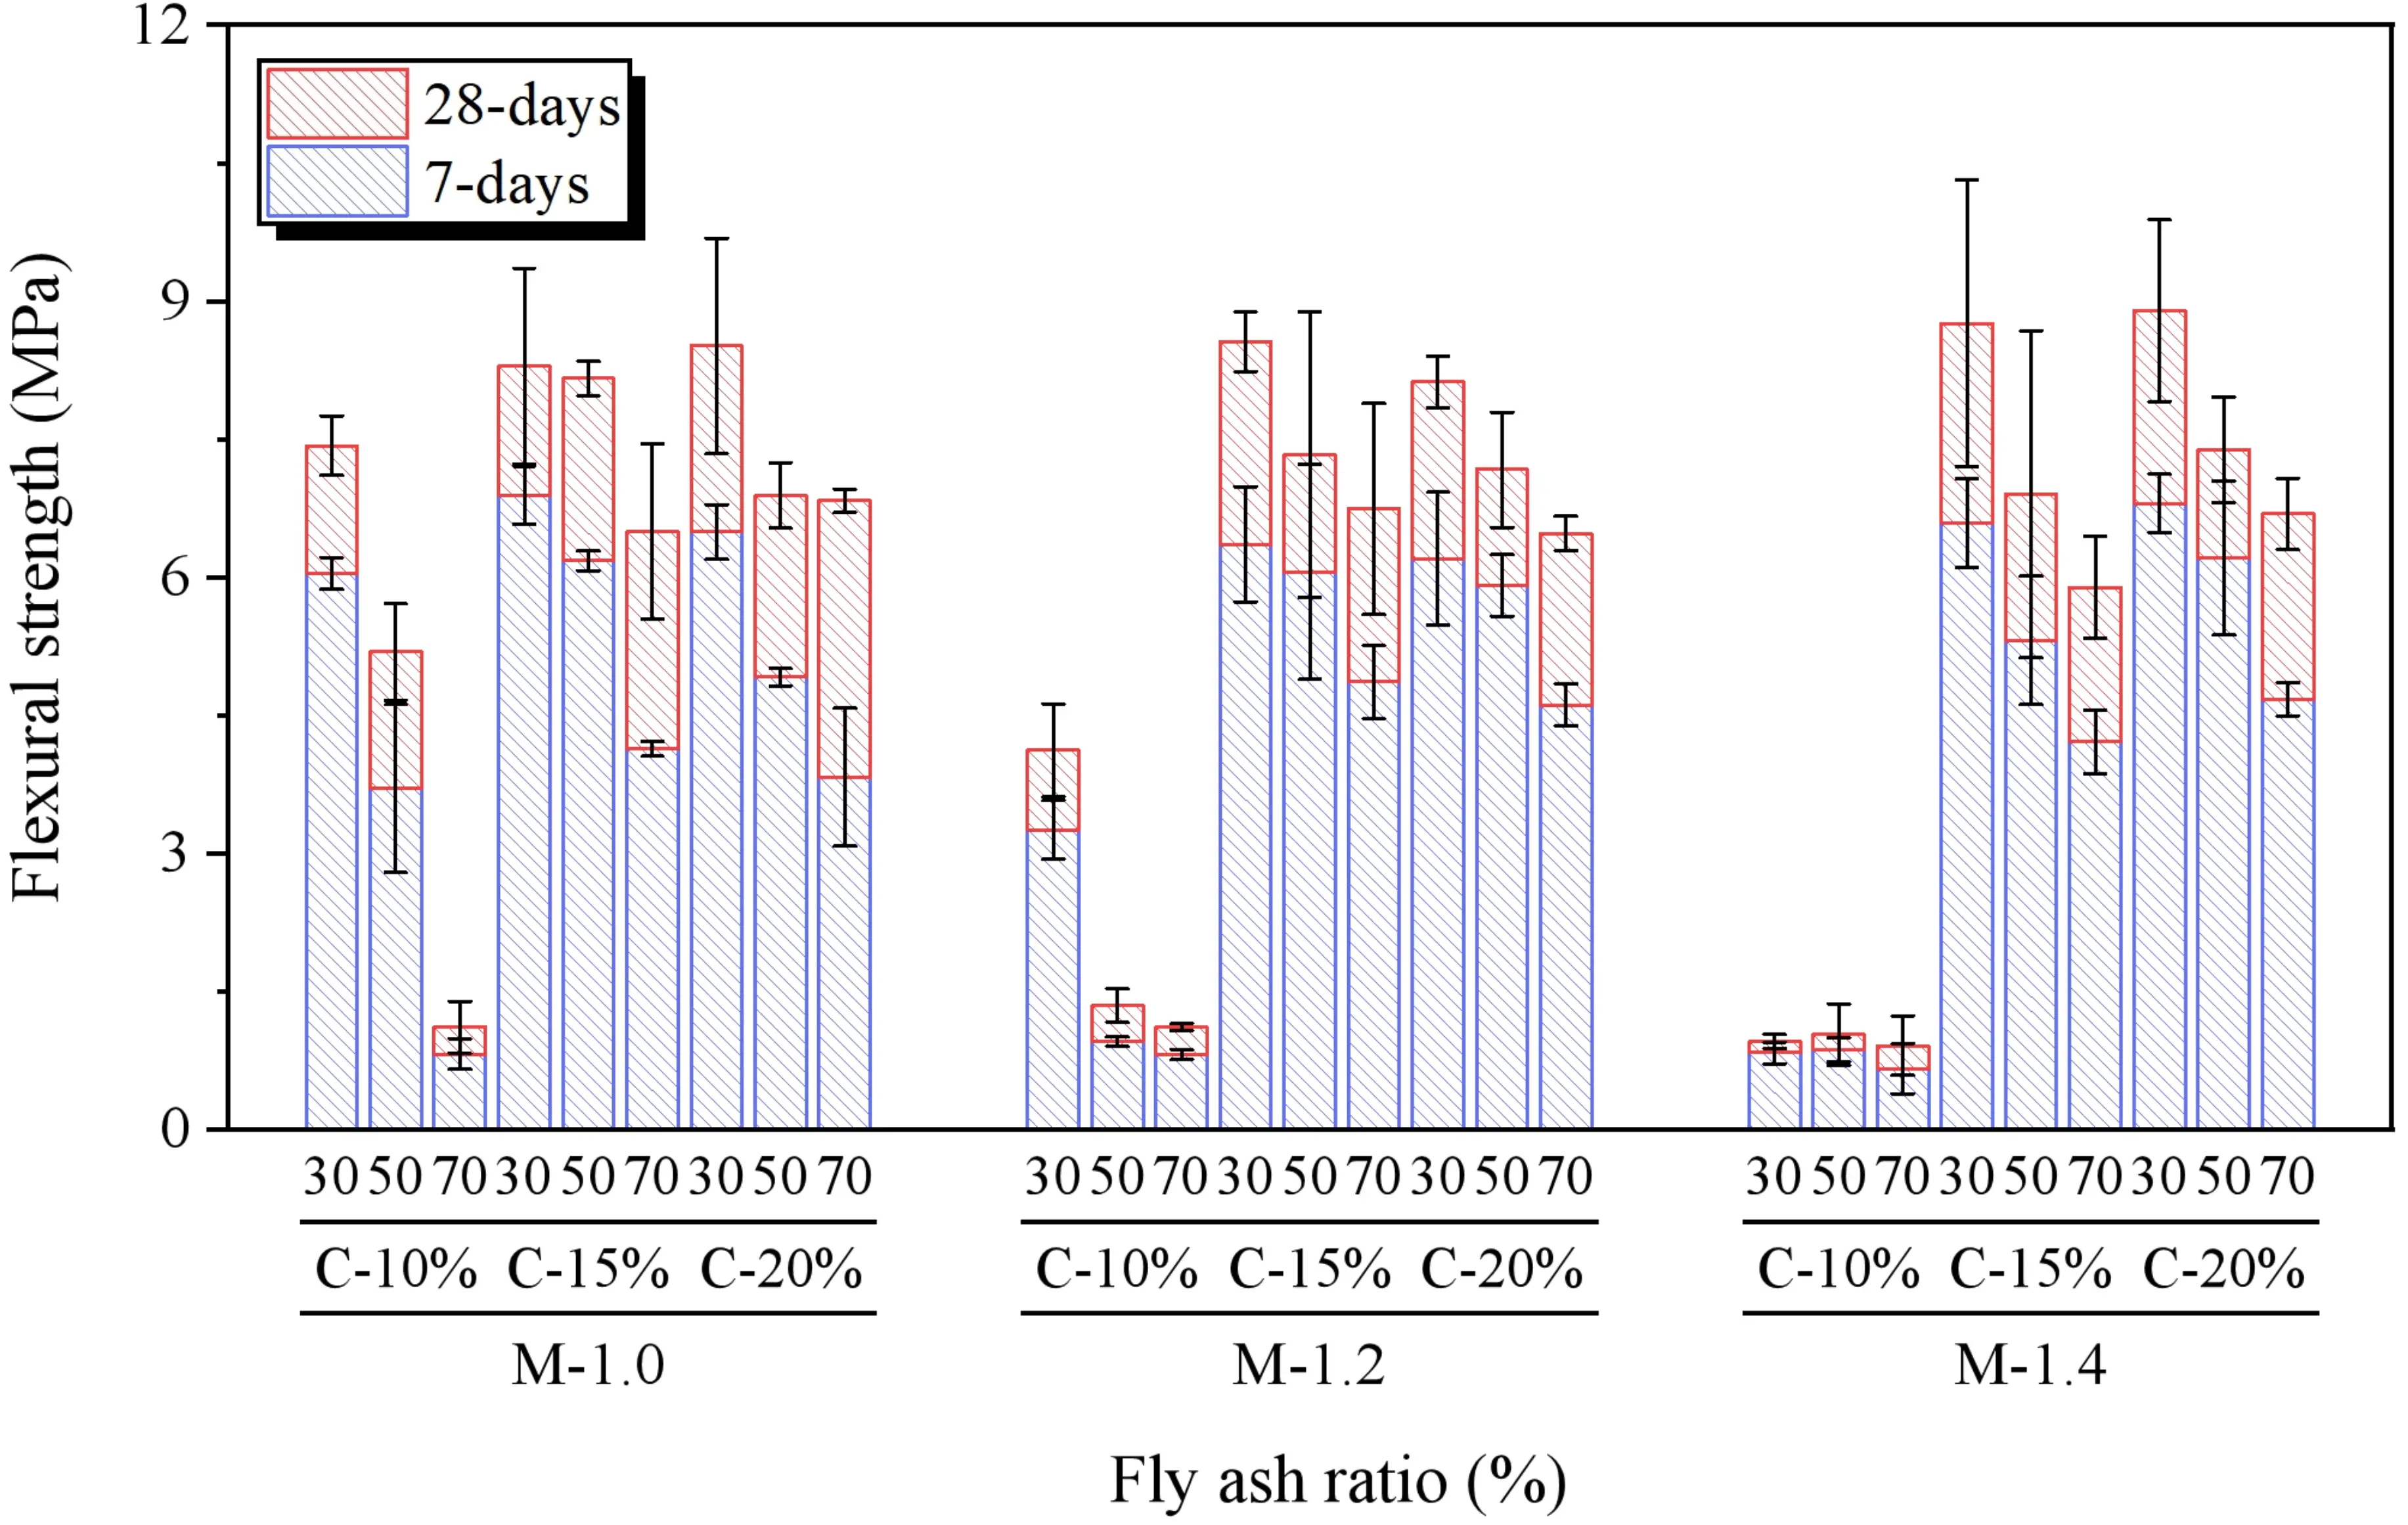
The fracture surfaces after flexural testing are shown in Figure 16. As the FA content increases, the porosity within the specimen’s cross-section significantly increases, and the material’s color lightens. Concurrently, both flexural and compressive strengths decrease notably. This phenomenon is attributed to the characteristics of FA, which has higher porosity and lower particle density compared to GBFS, resulting in a relatively sparse silicoaluminate gel formation during hydration, creating more pores at the microscopic level[48]. Additionally, at a geopolymer alkali modulus of 1.0 and 1.2, flexural strength peaks at an alkali concentration of 15%, while at a alkali modulus of 1.4, the maximum flexural strength occurs at an alkali concentration of 20%. Comprehensive analysis indicates that the best flexural strength for SWSSGM is achieved when the alkali modulus is 1.2, alkali concentration is 15%, and FA content is 30%.
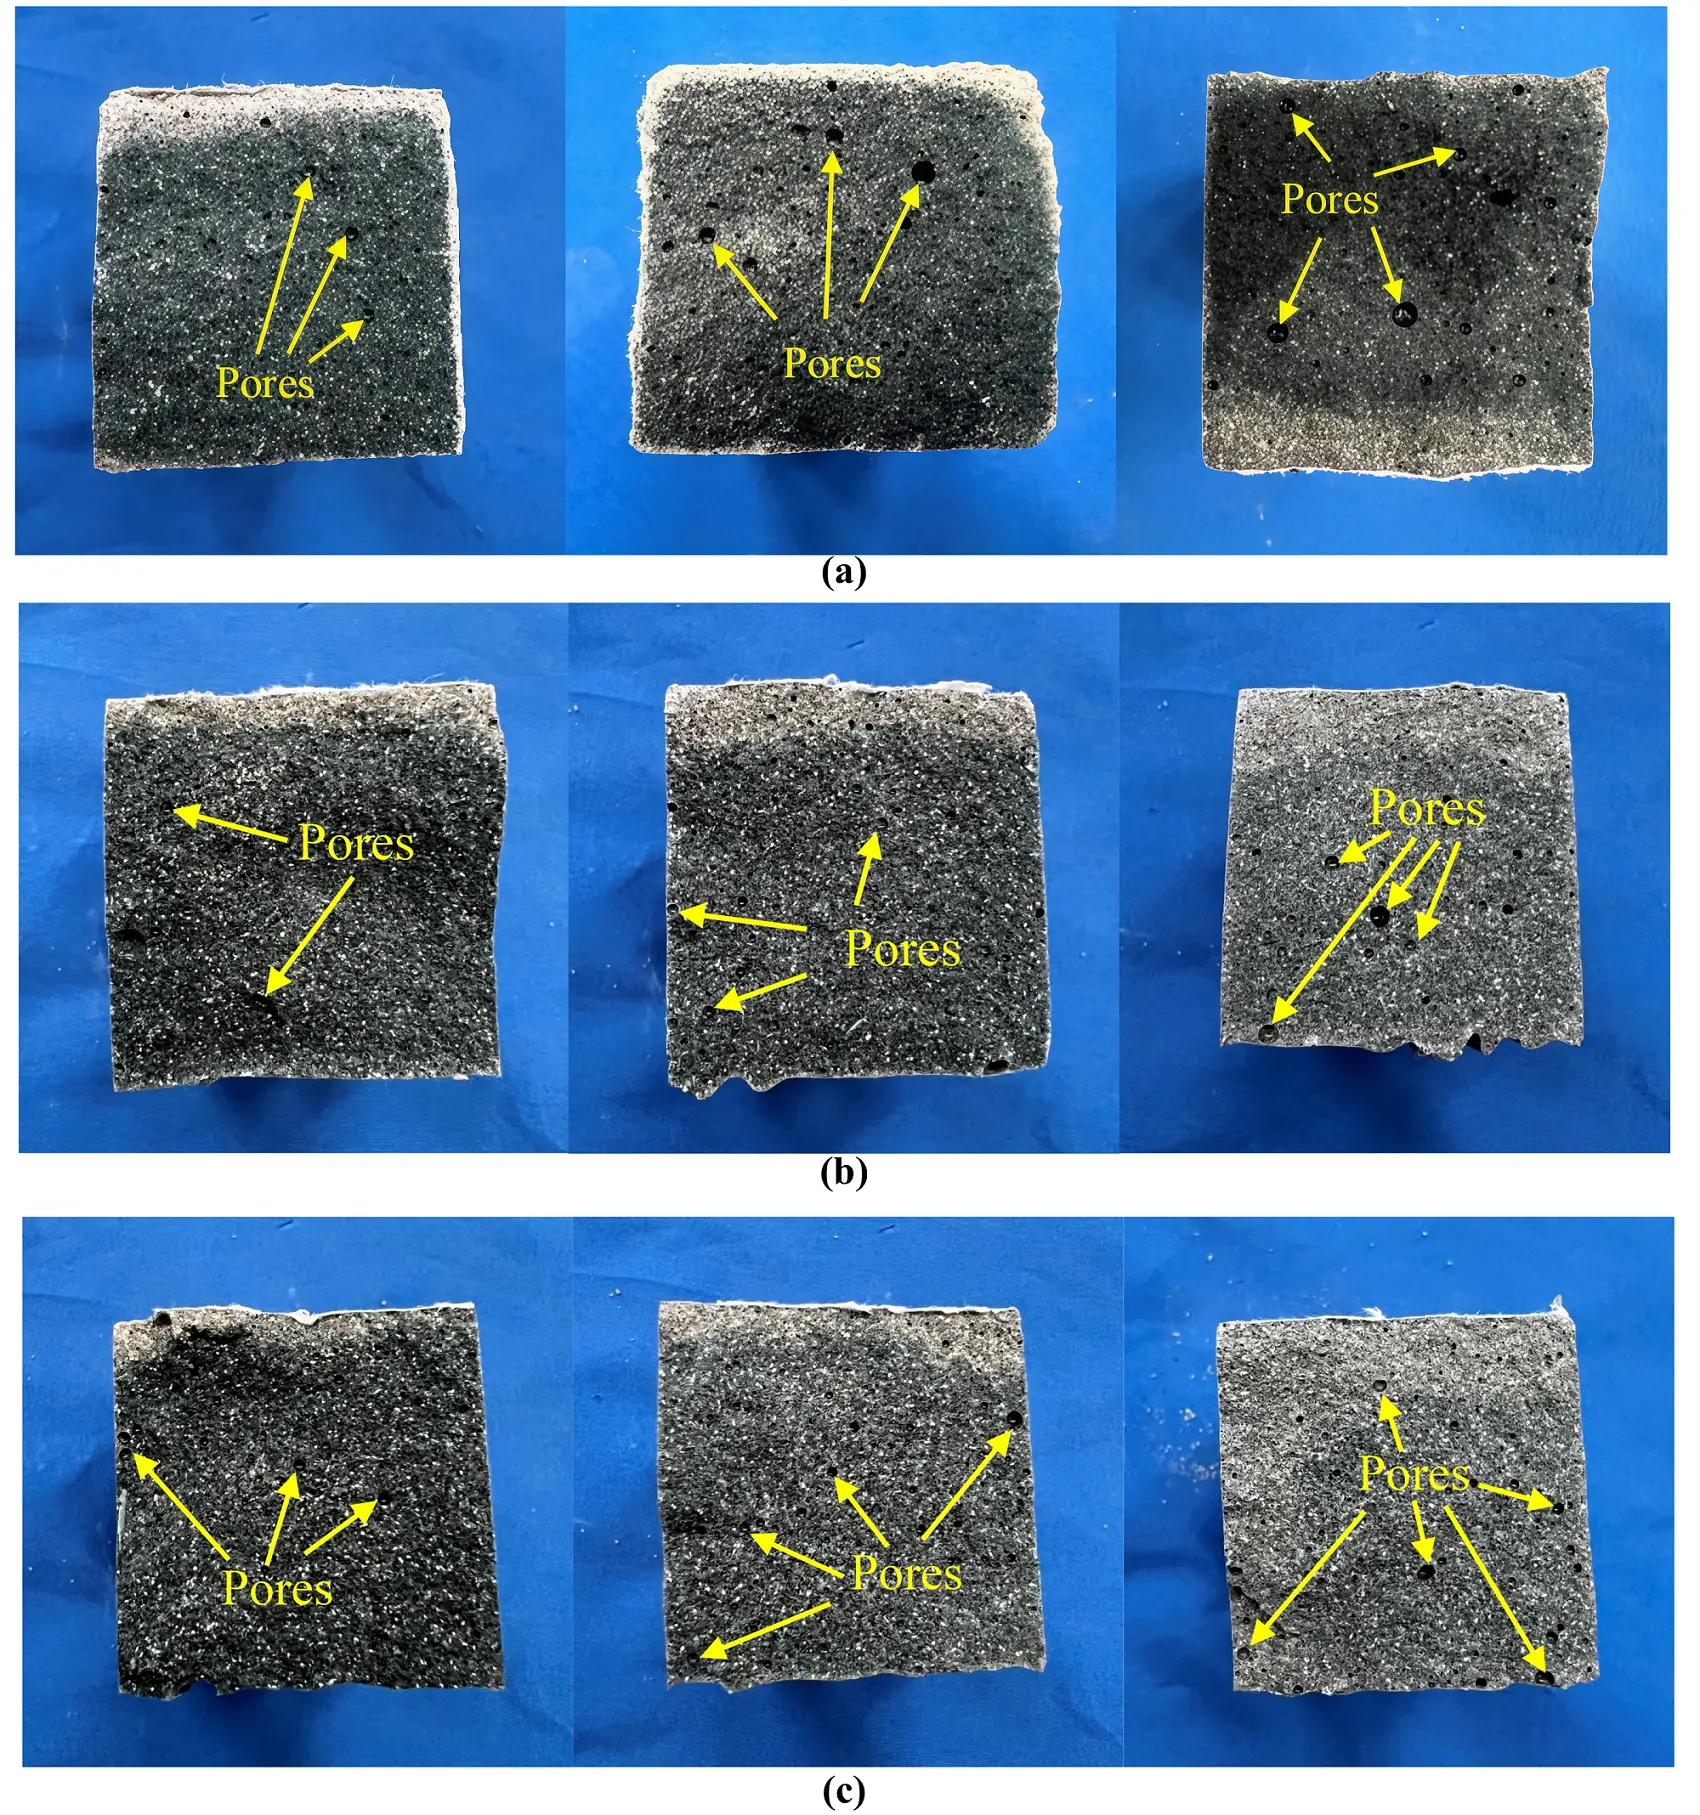
Figure 16. Cross-sectional damage patterns. (a) Module 1.0 and Concentration 15%; (b) Module 1.2 and Concentration 15%; (c) Module 1.4 and Concentration 15%.
The comparison of flexural strength across different curing ages is illustrated in Figure 17. Overall, the flexural strength of SWSSGM after 7 days and 28 days closely resembles the compressive strength, remaining in the range of 0.7-0.8. The figure indicates that as the proportion of FA increases, the average flexural strength of the paste rises by 13.75%. Additionally, an increase in alkali concentration leads to a slight enhancement in flexural strength, with an average increase of 3.9%. However, similar to compressive strength, changes in alkali modulus do not exhibit a clear influence on the enhancement of flexural strength.
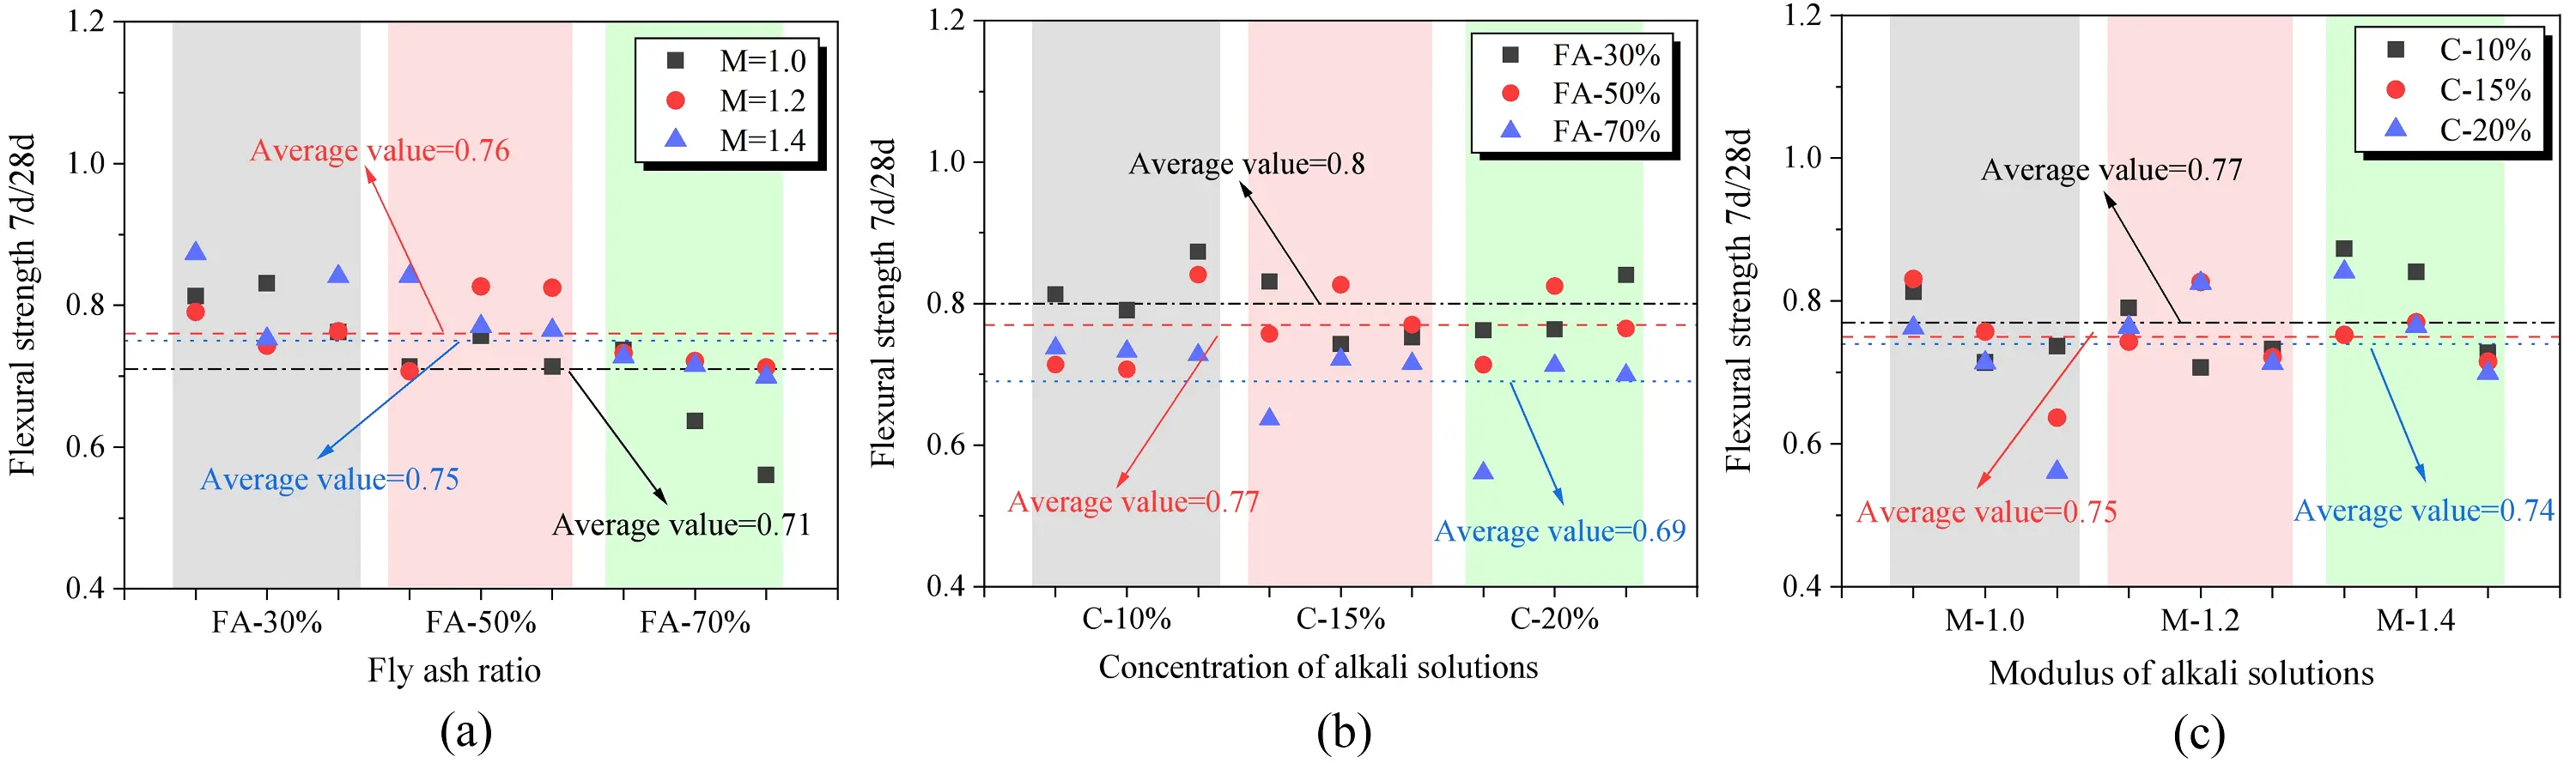
Figure 17. Mortar flexural strength enhancement comparison. (a) Effect of modulus on flexrual strength enhancement of mortar; (b) Effect of FA ratio on flexrual strength enhancement of mortar; (c) Effect of alkali solubility on flexural strength enhancement of mortar. FA: fly ash.
3.5 SEM and XRD analyses
3.5.1 SEM analysis
After 28 days of curing in an alkaline solution with an alkali modulus of 1.2 and a concentration of 15%, SEM analysis was conducted on SWSSGM samples with 30% and 70% FA content. The results presented in Figure 18 show that an increase in FA content is associated with a higher number of attached FA particles within the mortar. Additionally, small amounts of unhydrated spherical FA particles are embedded in the gel matrix, resulting in a greater number of honeycomb-like pores. Conversely, increasing the GBFS content reduces the gap width between FA particles, increases the formation of network-like gels on their surfaces, and densifies the internal structure of the mortar. This phenomenon can be explained by the increased GBFS content, which increases the production of calcium-aluminosilicate hydrate (C-A-S-H) gels during the cementitious reaction. This promotes the aggregation of FA particles, resulting in a denser structure. C-A-S-H gel, the primary product of activated GBFS, exhibits a denser microstructure, fewer pores, and greater structural integrity compared to the sodium-aluminosilicate hydrate (N-A-S-H) gels formed by activated FA. In conclusion, a higher GBFS content leads to a denser microstructure, enhanced formation of C-A-S-H gels, and a general increase in the strength of the mortar. This microscopic densification directly explains why specimens with 30% FA achieved significantly higher compressive strengths. The reduction in honeycomb-like pores minimizes the internal stress concentration when under load.
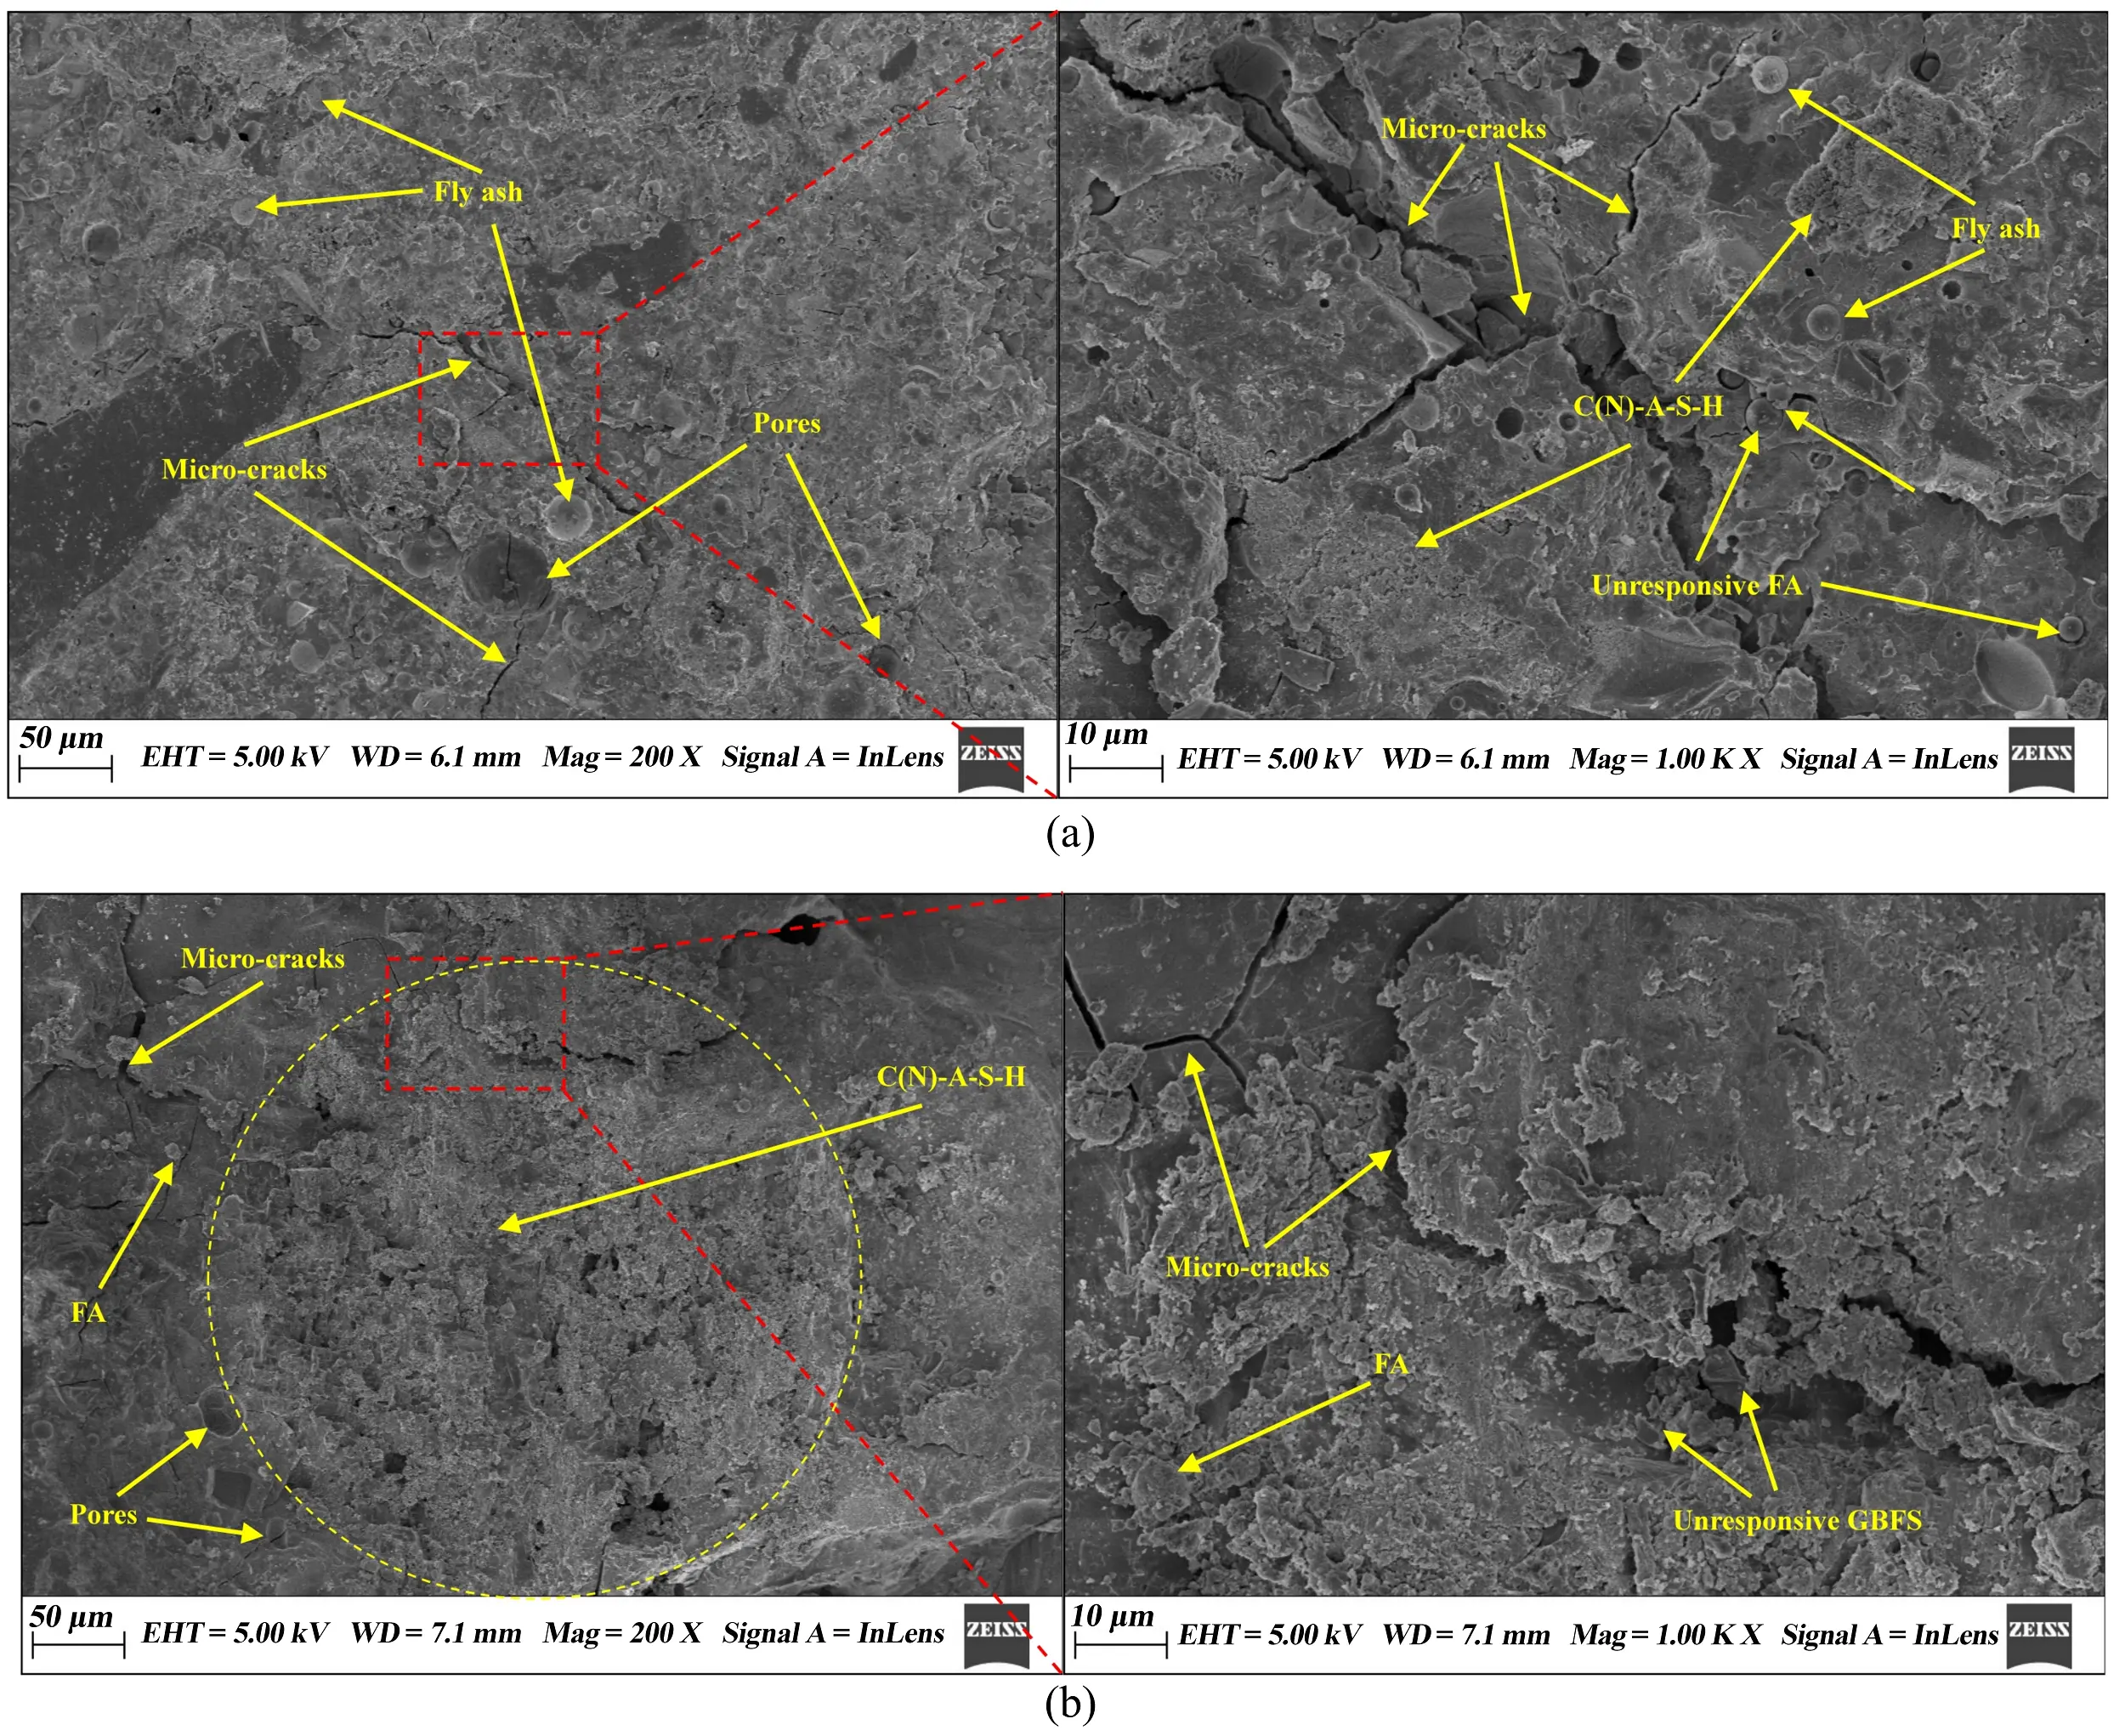
Figure 18. Result of SEM. (a) Mouduls-1.2, concentration-15% and FA ratio-70%; (b) Mouduls-1.2, concentration-15% and FA ratio-30%. SEM: scanning electron microscopy; FA: fly ash; EHT: electron high tension; WD: working distance; Mag: magnification.
3.5.2 XRD analysis
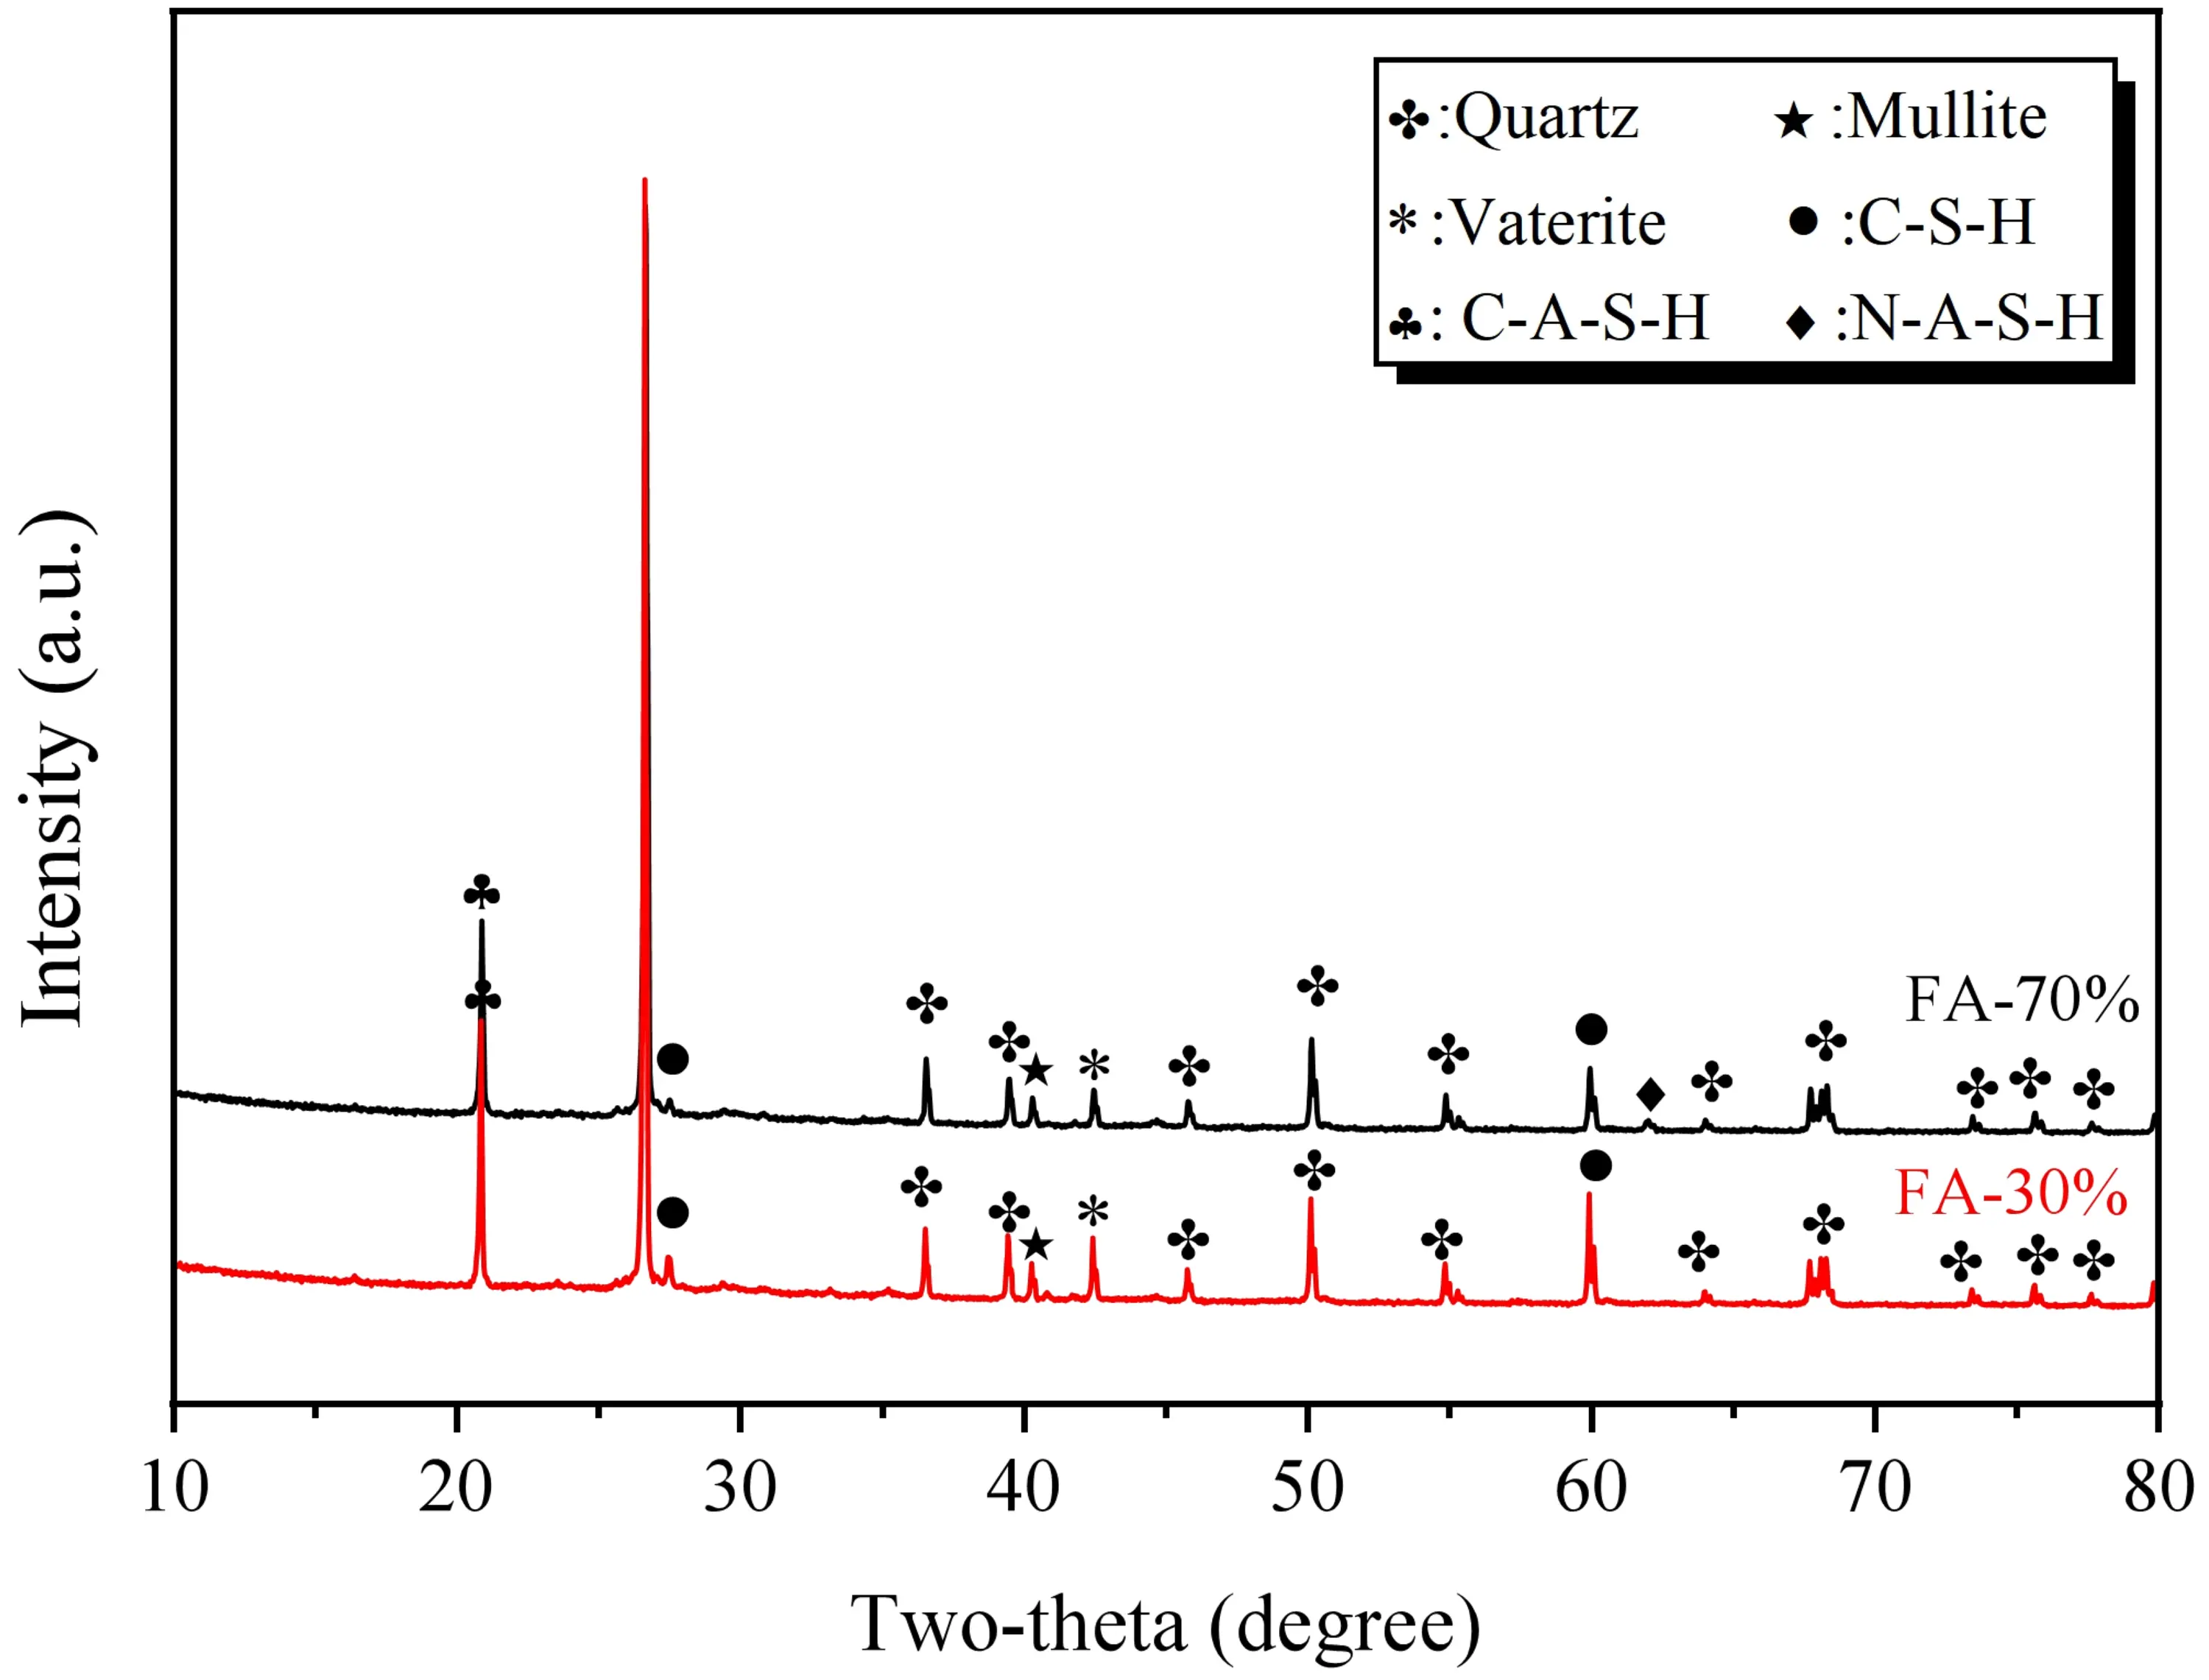
After 28 days of curing under conditions where the alkaline solution has an alkali modulus of 1.2 and a concentration of 15%, XRD tests were conducted on SWSSGM powders containing 30% and 70% FA. The results are presented in Figure 19. The analysis reveals that the primary crystalline phases include quartz (SiO2) and vaterite (CaCO3), with the prominent quartz peaks primarily originating from the sea sand aggregate. In addition to these minerals, characteristic diffraction peaks labeled as C-S-H, C-A-S-H, and N-A-S-H gels were also observed in the spectra. It is noteworthy that while these gels are predominantly amorphous, weak diffraction peaks appearing at specific angles indicate the presence of short-range ordered structures or the formation of semi-crystalline secondary phases within the gel matrix. The results indicate that the samples with a 30% FA ratio (i.e., high GBFS ratio) exhibit higher diffraction intensities associated with C-S-H and C-A-S-H, as well as increased amounts of vaterite. This can be attributed to the high calcium content introduced by the GBFS, which promotes the formation of calcium-based gels. Conversely, in the samples with 70% FA, microcrystalline features related to N-A-S-H gels are more pronounced. The higher diffraction intensities of C-(A)-S-H gels in
4. Prediction Models
A multiple linear regression analysis was conducted to evaluate the effects of alkali modulus, alkali concentration, and FA content on various properties. Polynomial regression fitting was performed using the experimental measurements Y and the independent variables x, y, and z (representing alkali modulus, alkali concentration, and FA proportion, respectively). The regression model is presented below:
where x denotes the alkali modulus, y the alkali concentration, and z the FA content.
The regression equations for slump flow(Y1), consistency (Y2), flexural strength (Y3), and compressive strength (Y4) are as follows.
The established regression models were analyzed, and the results are summarized in Table 8. Additionally, the parameters were normalized, as shown in Figure 20. All models exhibited high coefficients of determination (R2 > 0.92) and low Standard Errors (S), with all significance levels (P-values) being less than 0.001. This indicates that the models possess high predictive accuracy and statistical significance. It should be noted that the above model is an empirical model fitted based on the parameters of this study and is intended solely to predict performance variations under the experimental conditions described herein.
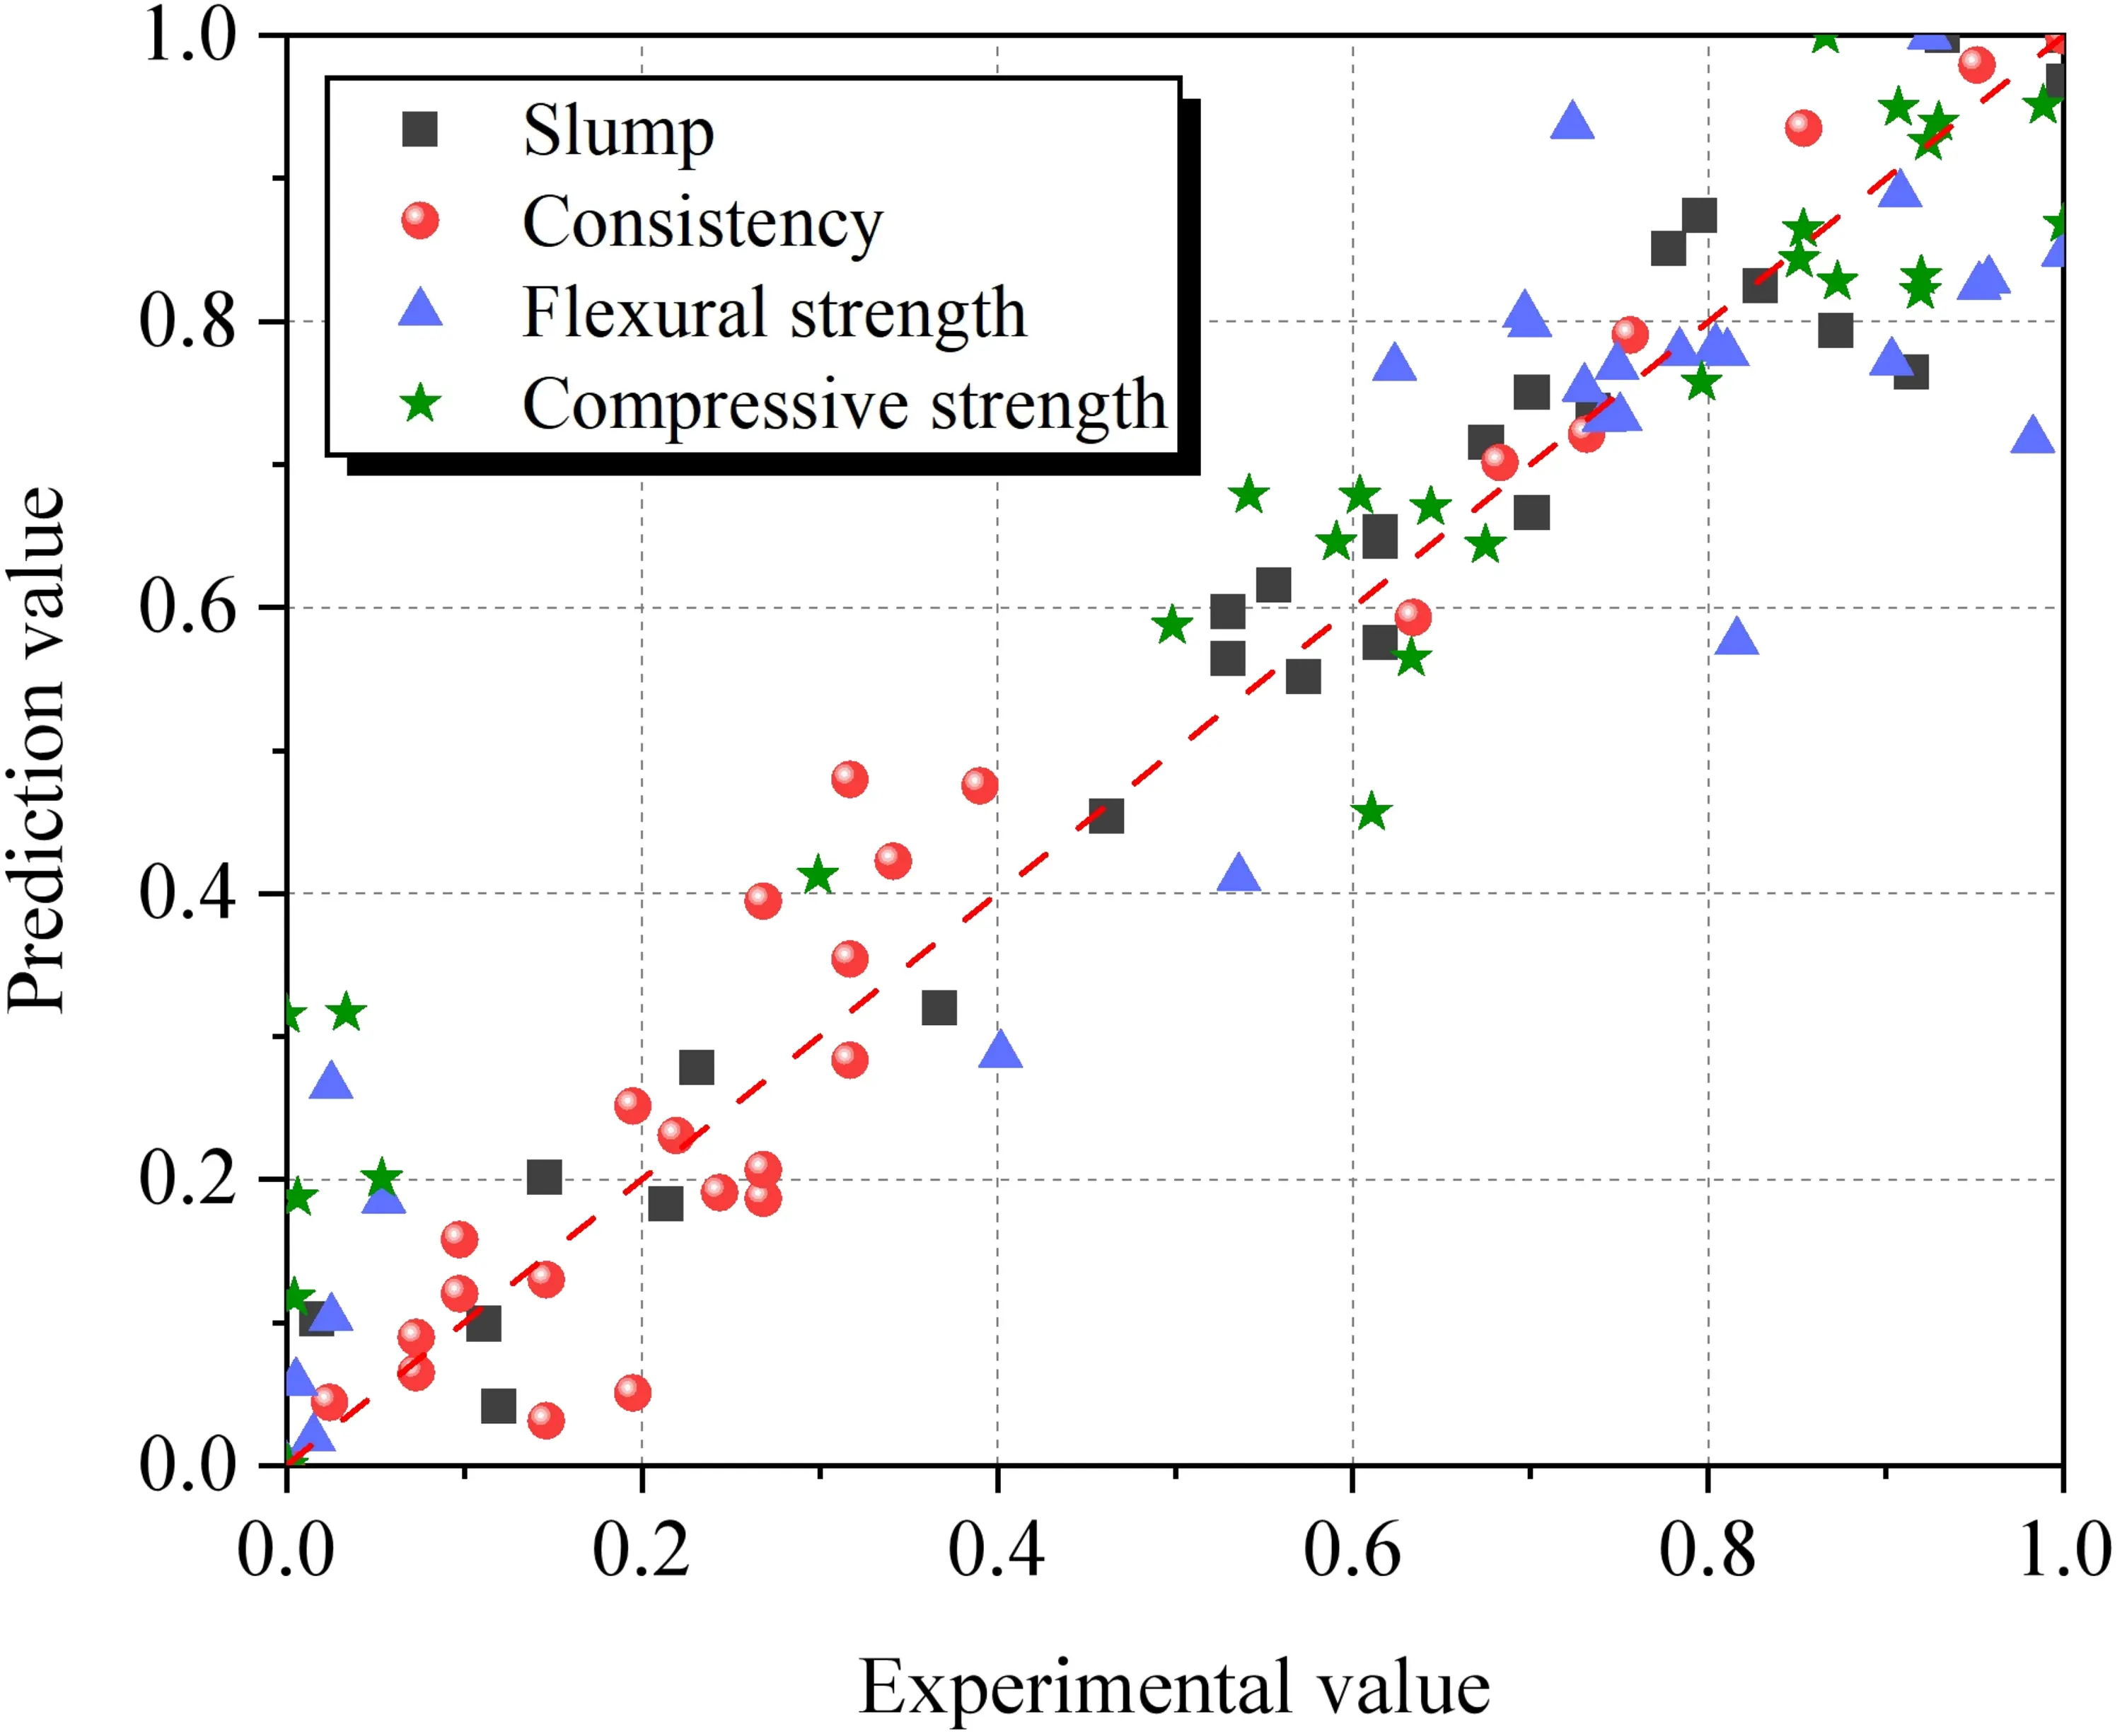
Table 8. Multiple linear regression analysis.
| Parameter | S | R2 | R2 (Adj.) | P-value |
| Slump (Y1) | 0.8382 | 0.95 | 0.94 | < 0.001 |
| Consistency (Y2) | 0.3282 | 0.94 | 0.93 | < 0.001 |
| Compressive strength (Y3) | 7.3816 | 0.92 | 0.89 | < 0.001 |
| Flexural strength (Y4) | 0.8805 | 0.92 | 0.90 | < 0.001 |
P < 0.05 indicates statistical significance.
From a physical perspective, the coefficients reflect the dominant influence of alkali concentration (y) on strength development. The negative quadratic terms for y in Y3 and Y4 reveal a “threshold effect”, suggesting that excessive alkalinity may hinder the formation of a dense geopolymeric matrix. Moreover, the positive interaction terms (e.g., yz) indicate a synergistic effect, where higher alkalinity enhances the dissolution and activation of FA particles.
5. Environmental and Economic Evaluation
Based on the earlier analysis of SWSSGM’s performance, this study compares mix designs that incorporate FA and GBFS with ordinary Portland cement mortar (OPM) as the control group. The SWSSGM utilizes seawater and sea sand, while the OPM uses river sand and fresh water. Using LCA, the study evaluates environmental impacts and costs. The OPM mix design was adapted from Standard
Table 9. SWSSGM and OPM fit ratio.
| Type | FA | GBFS | Cement | NaOH | Glass water | Sea sand | River sand | Seawater | Fresh water | Compressive strength |
| GM40 | 184 | 429 | 22 | 111 | 1,224 | 220 | 35.56 | |||
| GM50 | 462 | 198 | 42 | 161 | 1,319 | 193 | 41.67 | |||
| GM60 | 353 | 353 | 49 | 256 | 1,410 | 148 | 54.95 | |||
| M30 | 622 | 1,243 | 335 | 30 | ||||||
| M40 | 686 | 1,405 | 351 | 40 | ||||||
| M50 | 754 | 1,507 | 338 | 50 |
SWSSGM: geopolymer fly ash-slag seawater-sea sand mortar; OPM: ordinary Portland cement mortar; GBFS: granulated blast furnace slag; FA: fly ash.
Table 10. Carbon emission factors and cost indices of raw materials.
| Type | CO2 emission (kg/t) | Energy consumption (MJ/t) | Cost (USD/t) |
| Cement | 704[56] | 4,730[57] | 110[57] |
| FA | 27[51] | 3.12[58] | 40[51] |
| GBFS | 19[59] | 3.12[58] | 36.8[59] |
| NaOH | 70[56] | 2,800[60] | 148[60] |
| Na2SiO3 (solution) | 823[56] | 5,370[61] | 264[60] |
| Sea sand | 2.5[57] | 14[57] | 8[57] |
| River sand | 20[57] | 110[57] | 25[57] |
| Seawater | 0.3[57] | 100[57] | 0[57] |
| Fresh water | 0.3[57] | 100[57] | 40[57] |
GBFS: granulated blast furnace slag; FA: fly ash.
5.1 Carbon emissions
As shown in Table 11 and Figure 21, SWSSGM achieves a significant reduction in carbon emissions compared to OPM, with an overall decrease of approximately 67.55%. The SWSSGM mix designed for C30 strength showed the best performance, emitting only 109.14 kg CO2/m3, substantially lower than OPM. In OPM, over 94% of carbon emissions stem from cement production, with roughly one-third attributed to fuel combustion and the remainder to process-related emissions[50]. In contrast, SWSSGM utilizes FA and GBFS, both industrial by-products, reducing carbon emissions to about 10% of the total. However, the alkali activator, specifically water glass, contributes over 83% of SWSSGM’s carbon footprint due to its energy-intensive manufacturing process. Future efforts to optimize activator composition or develop low-carbon production methods for water glass could further reduce SWSSGM’s carbon emissions.
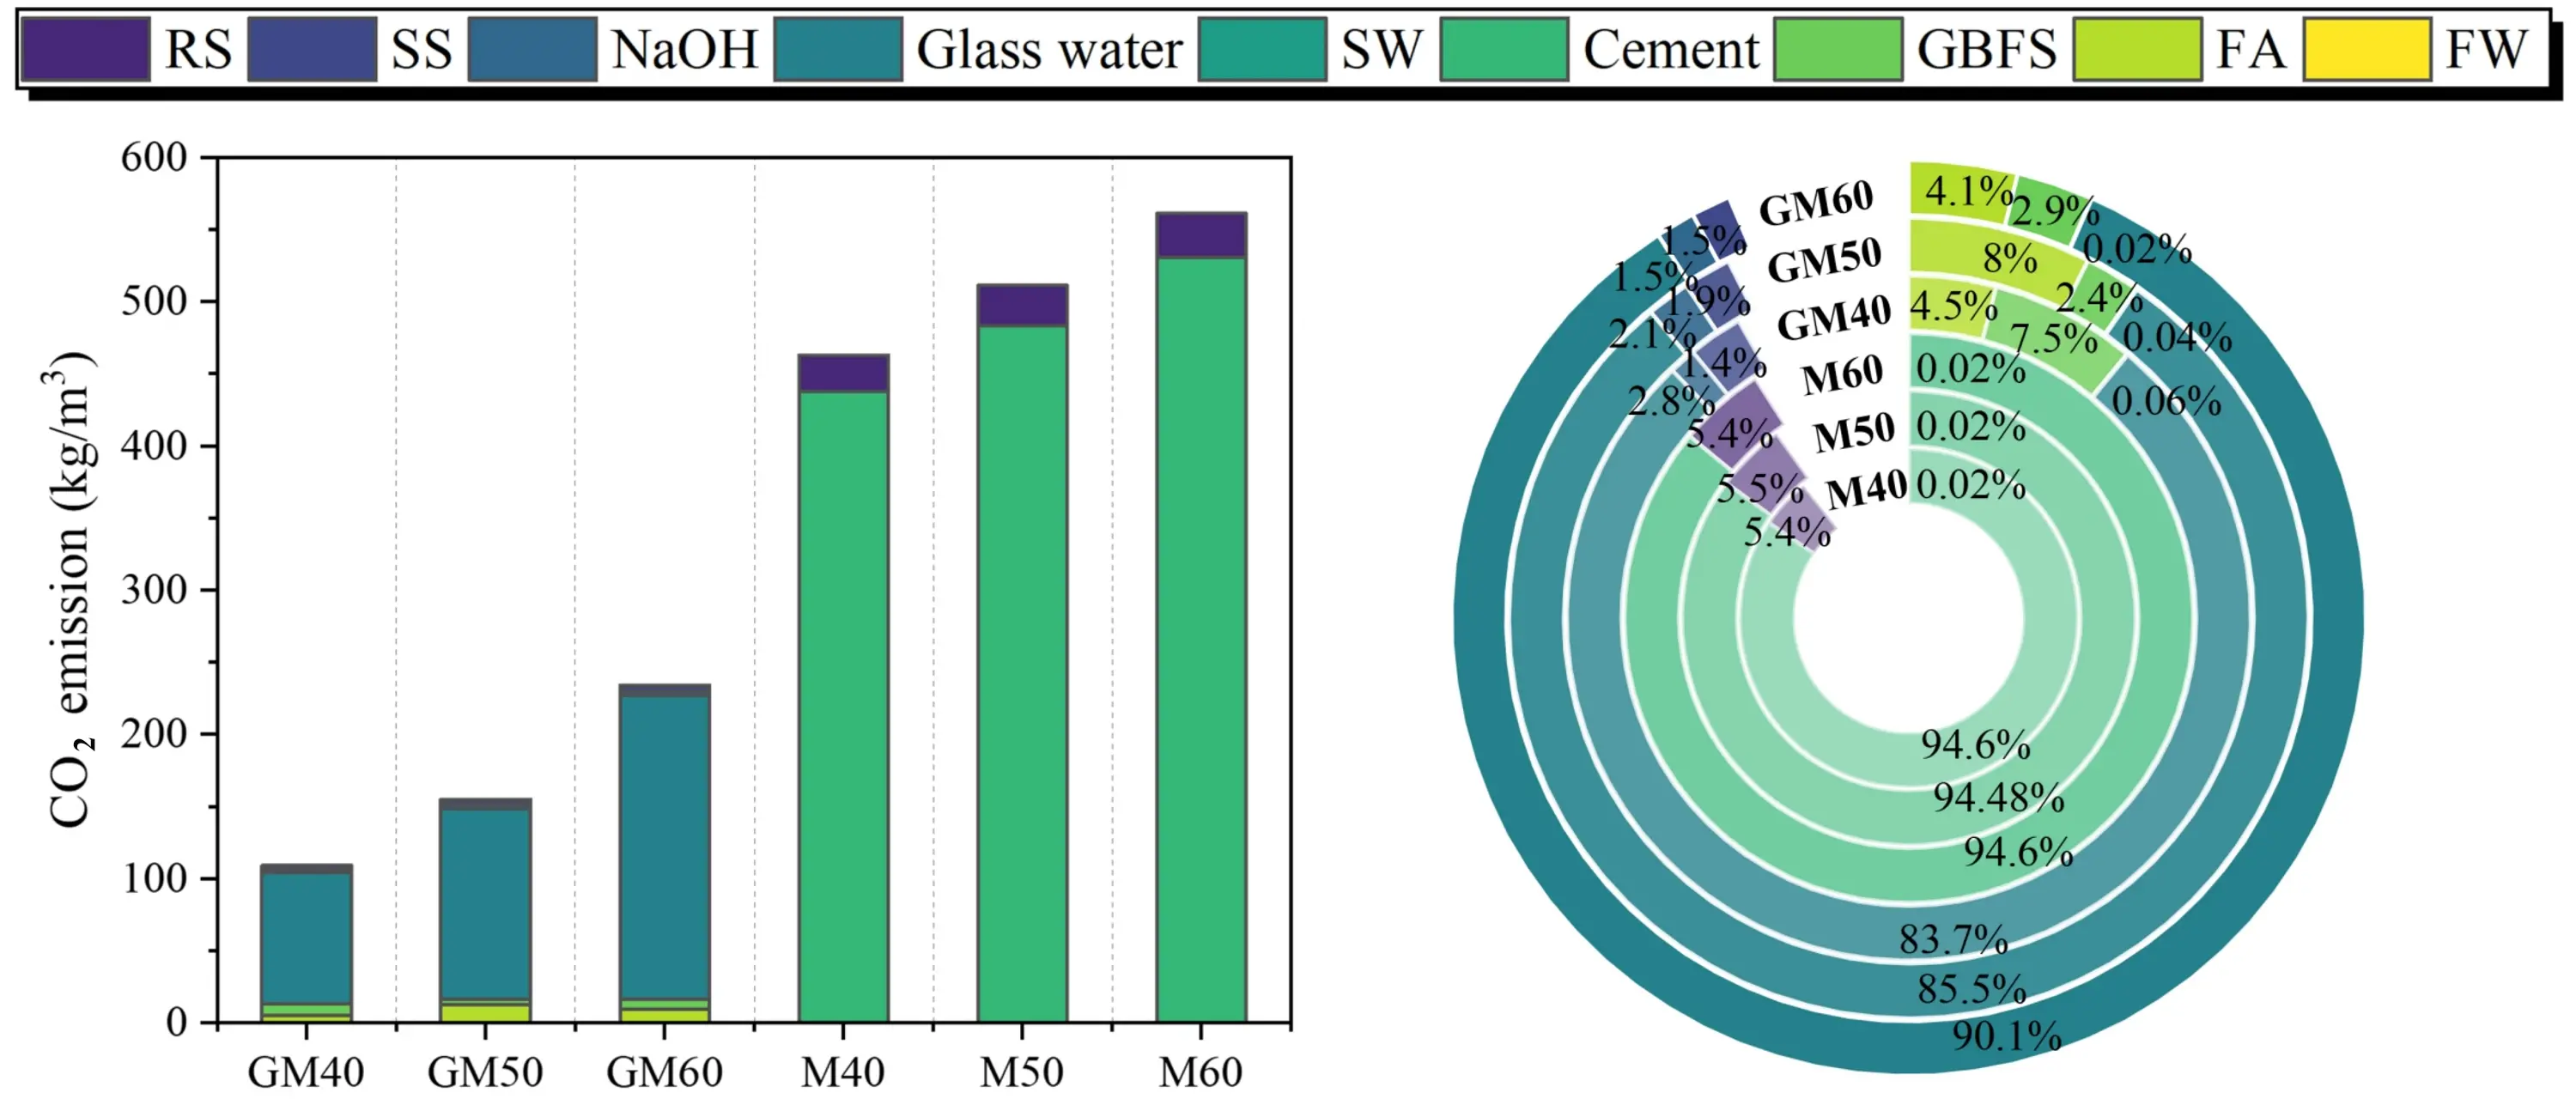
Figure 21. Carbon emission analysis result. GBFS: granulated blast furnace slag; FA: fly ash; RS: river sand; SS: sea sand; SW: sea water; FW: fresh water.
Table 11. Results of the analysis of indicators.
| Type | Carbon emission (kg/m3) | Energy consumption (MJ/ m3) | Cost (USD/m3) | ||||
| Value | Avg. | Value | Avg. | Value | Avg. | ||
| SWSSGM | GM40 | 109.14 | 166.03 | 698.72 | 1,089.79 | 65.50 | 87.92 |
| GM50 | 155.03 | 1,022.00 | 85.04 | ||||
| GM60 | 233.93 | 1,548.66 | 113.23 | ||||
| OPM | M40 | 462.85 | 511.69 | 3,112.29 | 3,437.57 | 112.90 | 123.89 |
| M50 | 511.15 | 3,434.43 | 124.63 | ||||
| M60 | 561.06 | 3,765.99 | 134.14 | ||||
SWSSGM: geopolymer fly ash-slag seawater-sea sand mortar; OPM: ordinary Portland cement mortar.
5.2 Energy consumption
According to Table 11 and Figure 22, OPM has an energy consumption of approximately 3,437.57 MJ/m3, with over 94% of this attributed to cement production. In comparison, SWSSGM achieves a significant reduction in energy use, lowering consumption by an average of 1,089.79 MJ/m3, or about 68.30%. Most of SWSSGM’s energy usage (94%) is concentrated in the production of the alkali activator. Furthermore, incorporating sea sand in SWSSGM, instead of river sand as in OPM, reduces sand-related energy consumption by 87.87%. Even when accounting for the energy required to process FA (830 MJ/t[51]) and GBFS (1,590 MJ/t[51]), SWSSGM’s energy consumption is still about 45% lower than that of OPM. Future advancements in the activator production process could further reduce SWSSGM’s energy consumption.
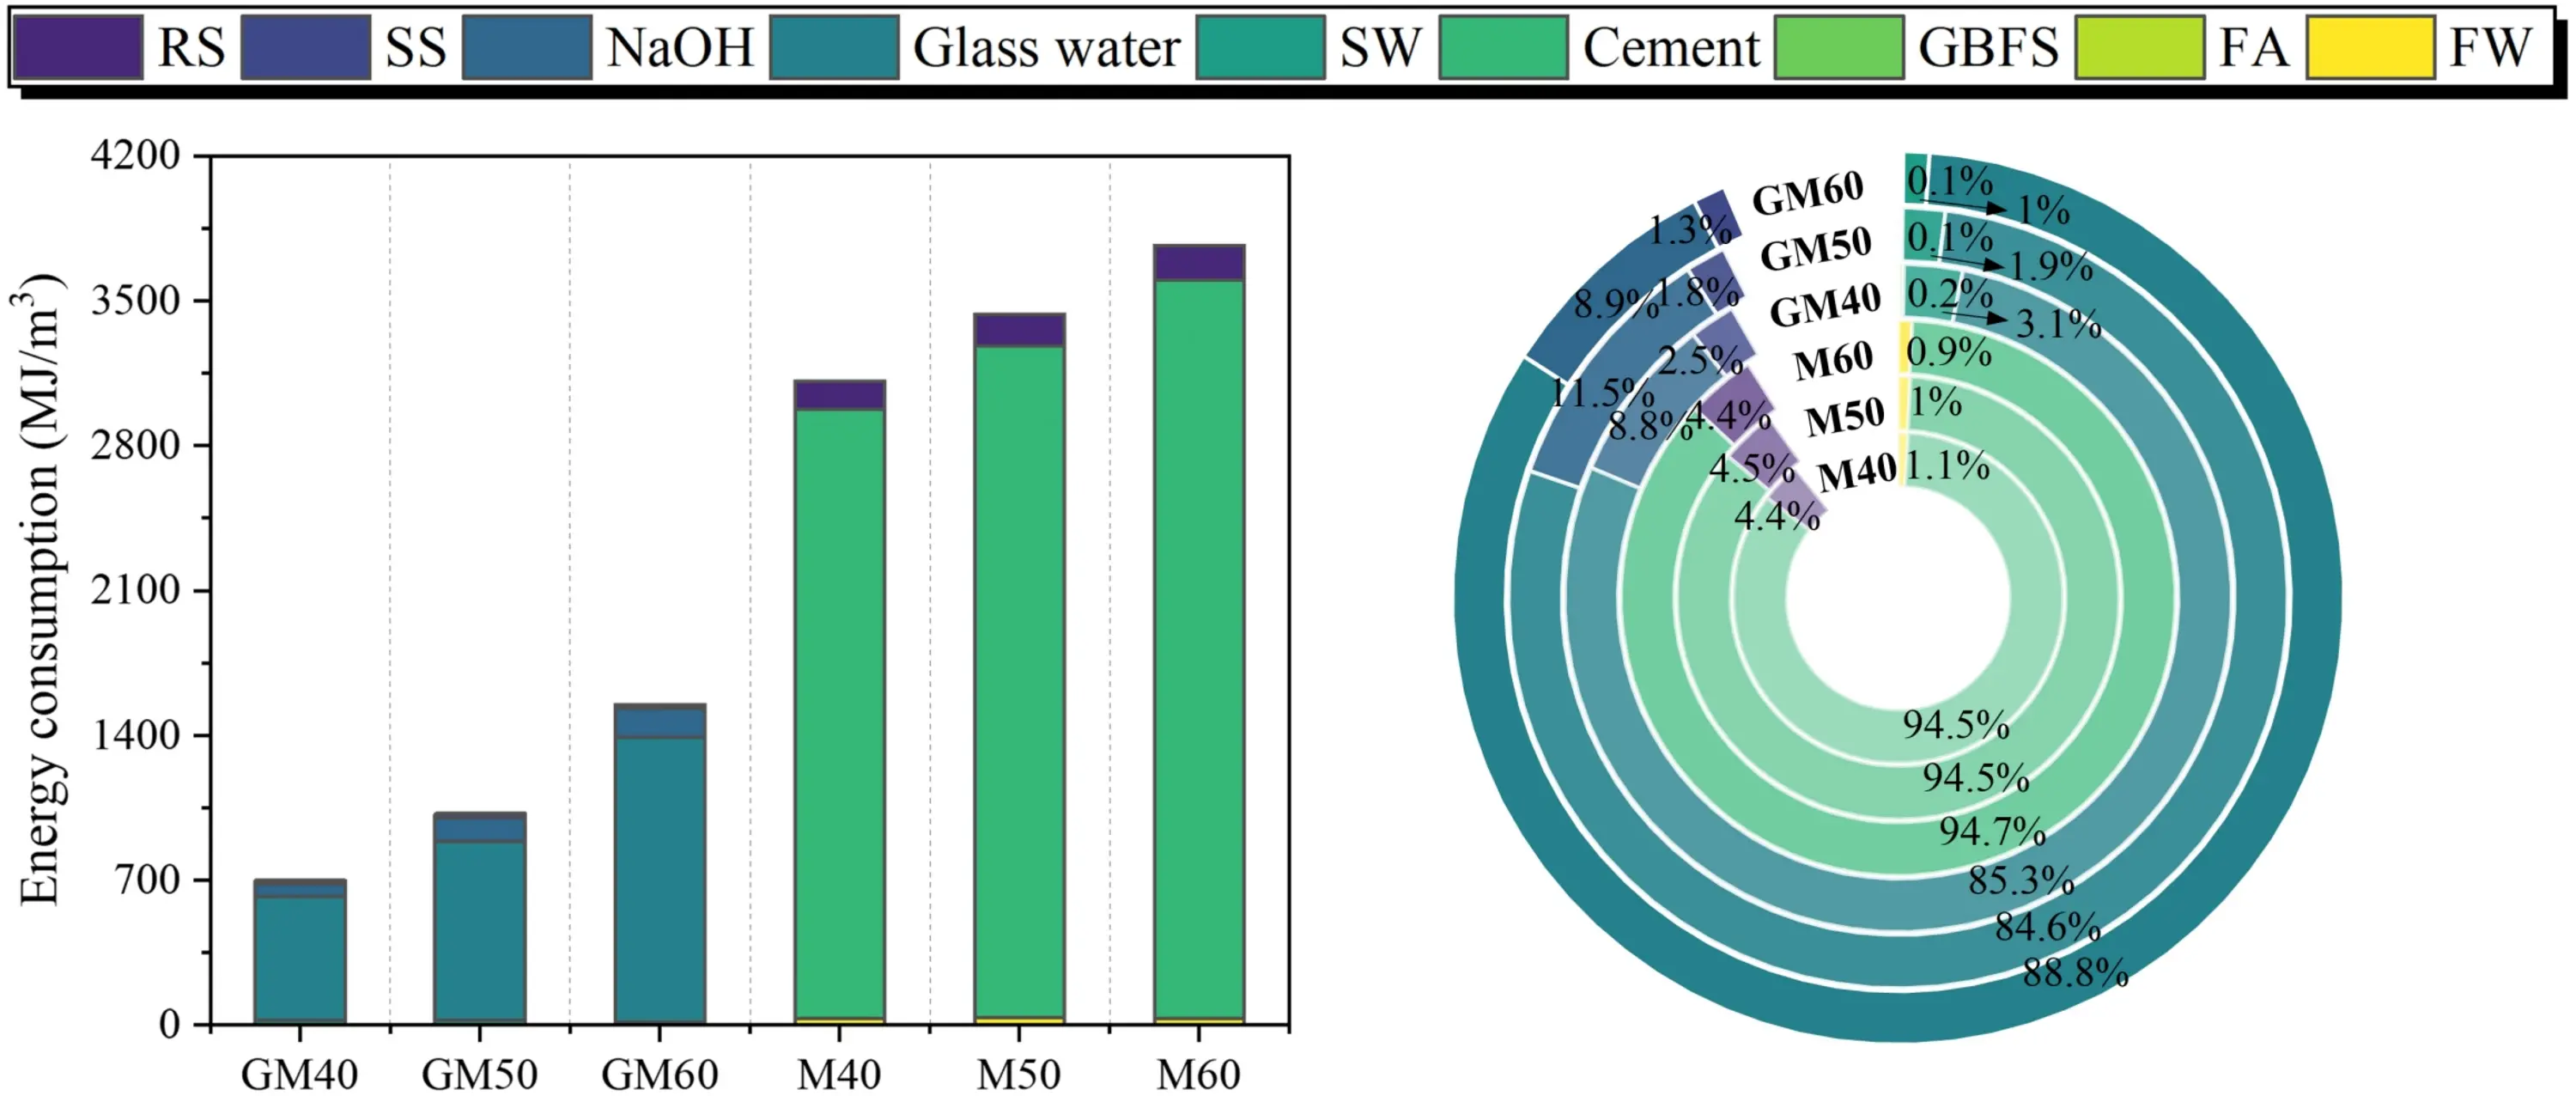
Figure 22. Energy consumption analysis result. GBFS: granulated blast furnace slag; FA: fly ash; RS: river sand; SS: sea sand; SW: sea water; FW: fresh water.
5.3 Cost comparison
As shown in Table 11 and Figure 23, SWSSGM reduces overall costs by approximately 29.03% compared to OPM. The SWSSGM mix designed for C30 strength is the most economical, costing around $65.5 per cubic meter—a savings of 41.98% compared to OPM. For OPM, cement accounts for approximately 61% of the total cost, whereas in SWSSGM, the costs are primarily driven by binders
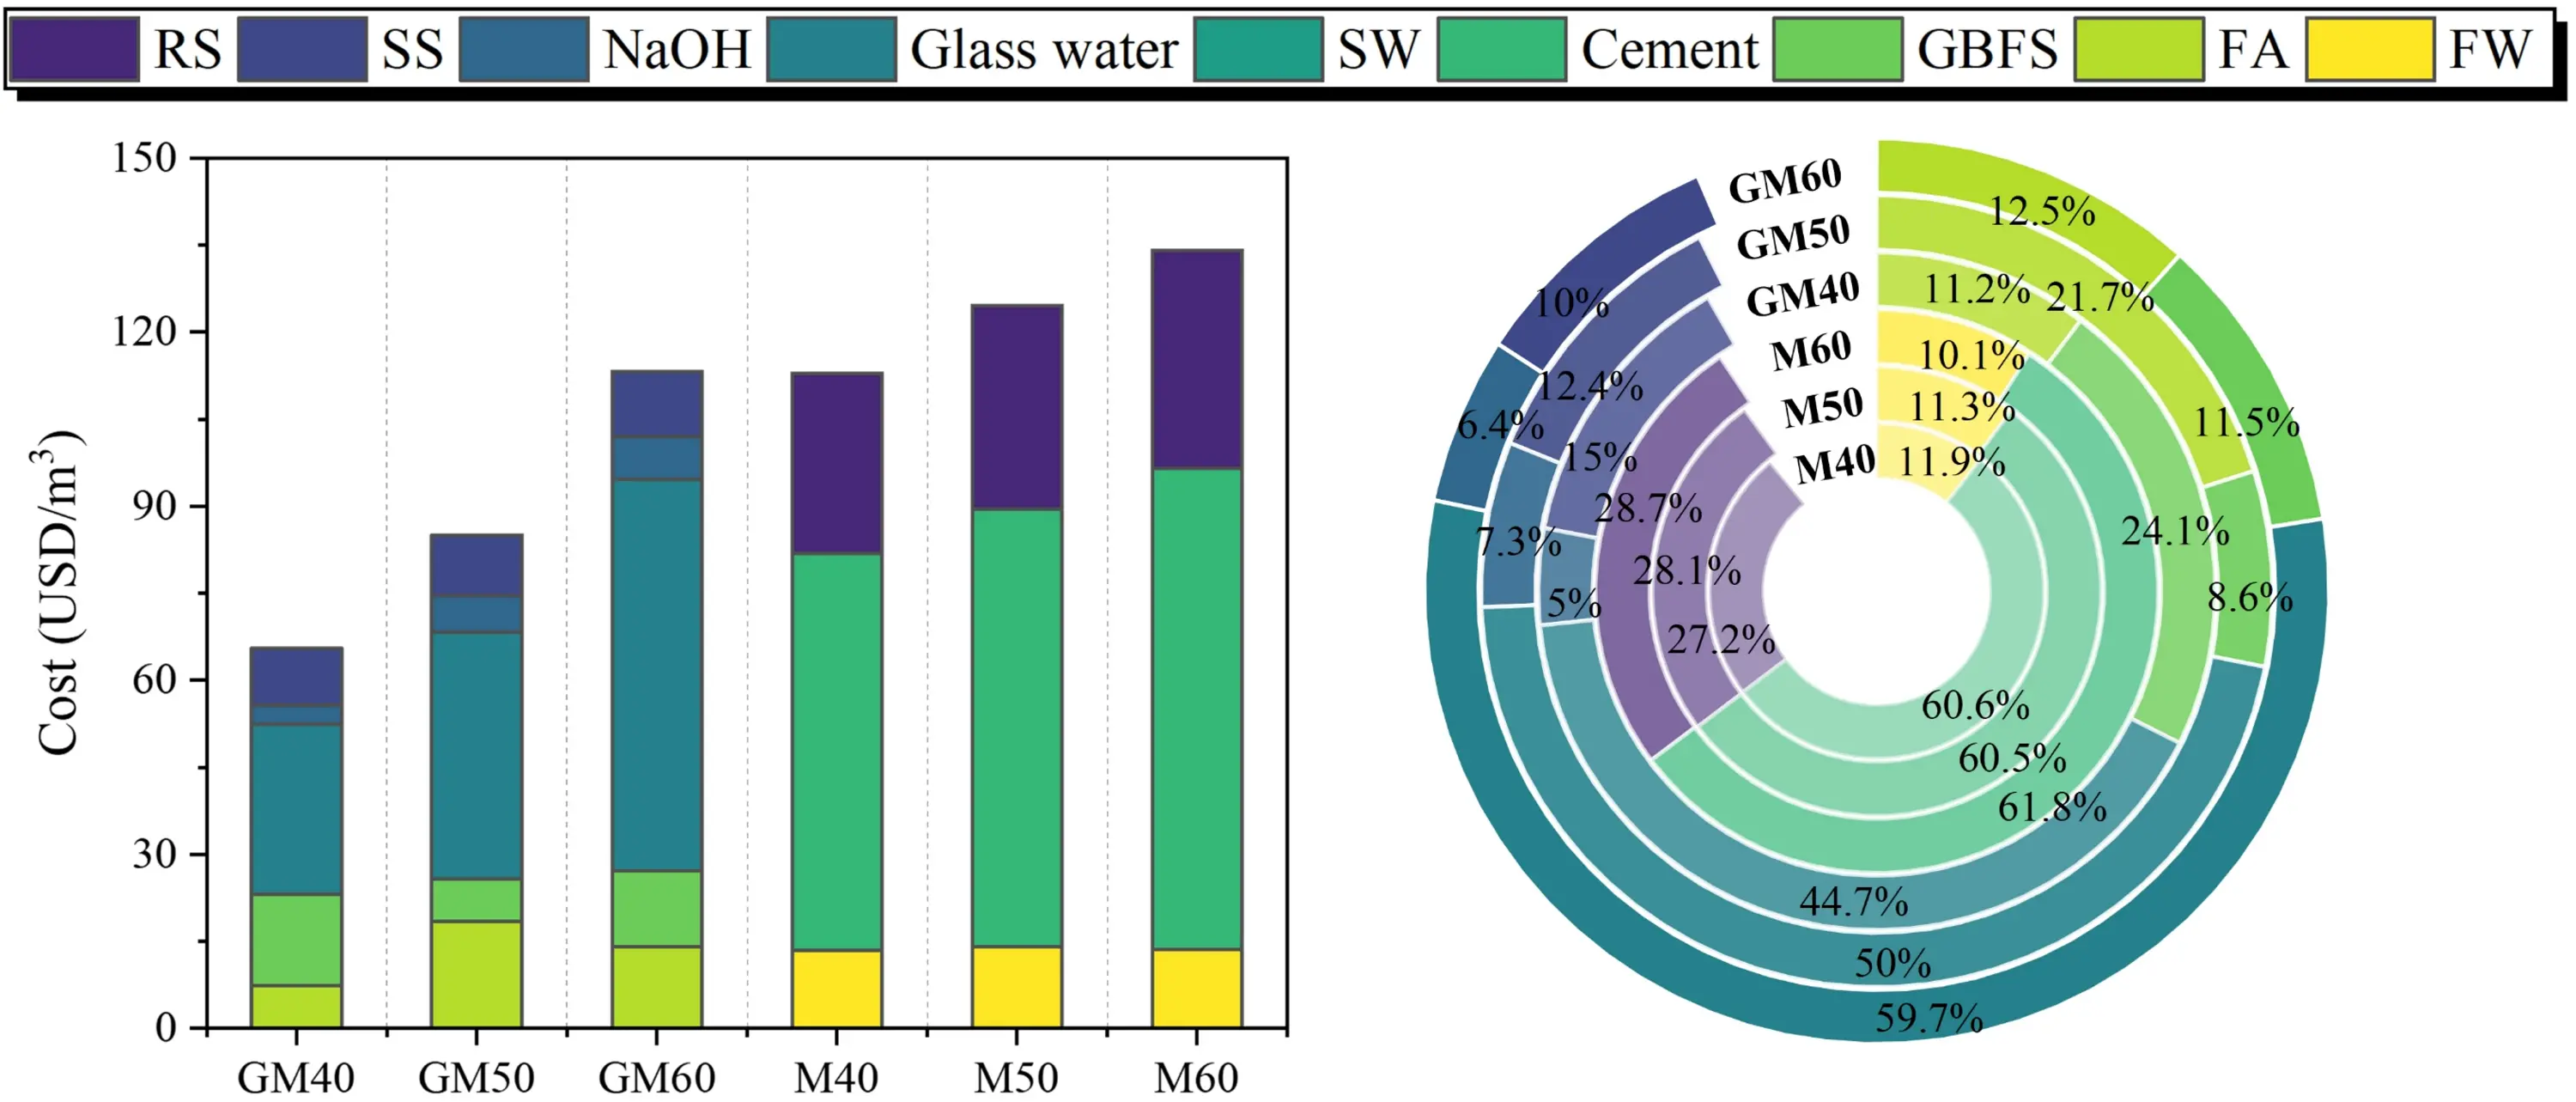
Figure 23. Cost analysis results. GBFS: granulated blast furnace slag; FA: fly ash; RS: river sand; SS: sea sand; SW: sea water; FW: fresh water.
5.4 Multi-criteria analysis
This study evaluates SWSSGM and OPM across three dimensions: environmental impact, energy use, and cost, using a normalization approach where higher values (closer to “1”) represent poorer performance. Results are shown in Table 12.
Table 12. Results of the normalized analysis of the indicators.
| Type | Carbon emission (kg/m3) | Energy consumption (MJ/ m3) | Cost (USD/m3) | ||||
| Value | Avg. | Value | Avg. | Value | Avg. | ||
| SWSSGM | GM40 | 0.19 | 0.3 | 0.19 | 0.29 | 0.49 | 0.66 |
| GM50 | 0.28 | 0.27 | 0.63 | ||||
| GM60 | 0.42 | 0.41 | 0.84 | ||||
| OPM | M40 | 0.82 | 0.91 | 0.83 | 0.91 | 0.84 | 0.92 |
| M50 | 0.91 | 0.91 | 0.93 | ||||
| M60 | 1 | 1 | 1 | ||||
SWSSGM: geopolymer fly ash-slag seawater-sea sand mortar; OPM: ordinary Portland cement mortar.
As shown in Figure 24, SWSSGM demonstrates significantly lower normalized values for carbon emissions (0.30) and energy use (0.29), compared to OPM’s higher mean values (0.91 for both indicators). The GM40 mix achieved the best results, with normalized values of 0.19 for both emissions and energy use, representing an 81% reduction compared to OPM’s maximum value of 1.00. Cement accounts for 94% of OPM’s emissions, while SWSSGM’s emissions from binder materials represent only 10% of its total carbon footprint. Additionally, SWSSGM reduces energy consumption by 87.87% compared to OPM. This major reduction is primarily due to the incorporation of waste-based binder materials and the efficient use of natural resources such as seawater and sea sand, which reduces the demand for high-energy resources. In terms of cost, the normalized mean value for SWSSGM is 0.66, which is 29.8% lower than OPM’s 0.92. Among the studied mixes, the GM40 mix had the lowest cost (0.49), saving 41.7% compared to the corresponding OPM mix (M40: 0.84).
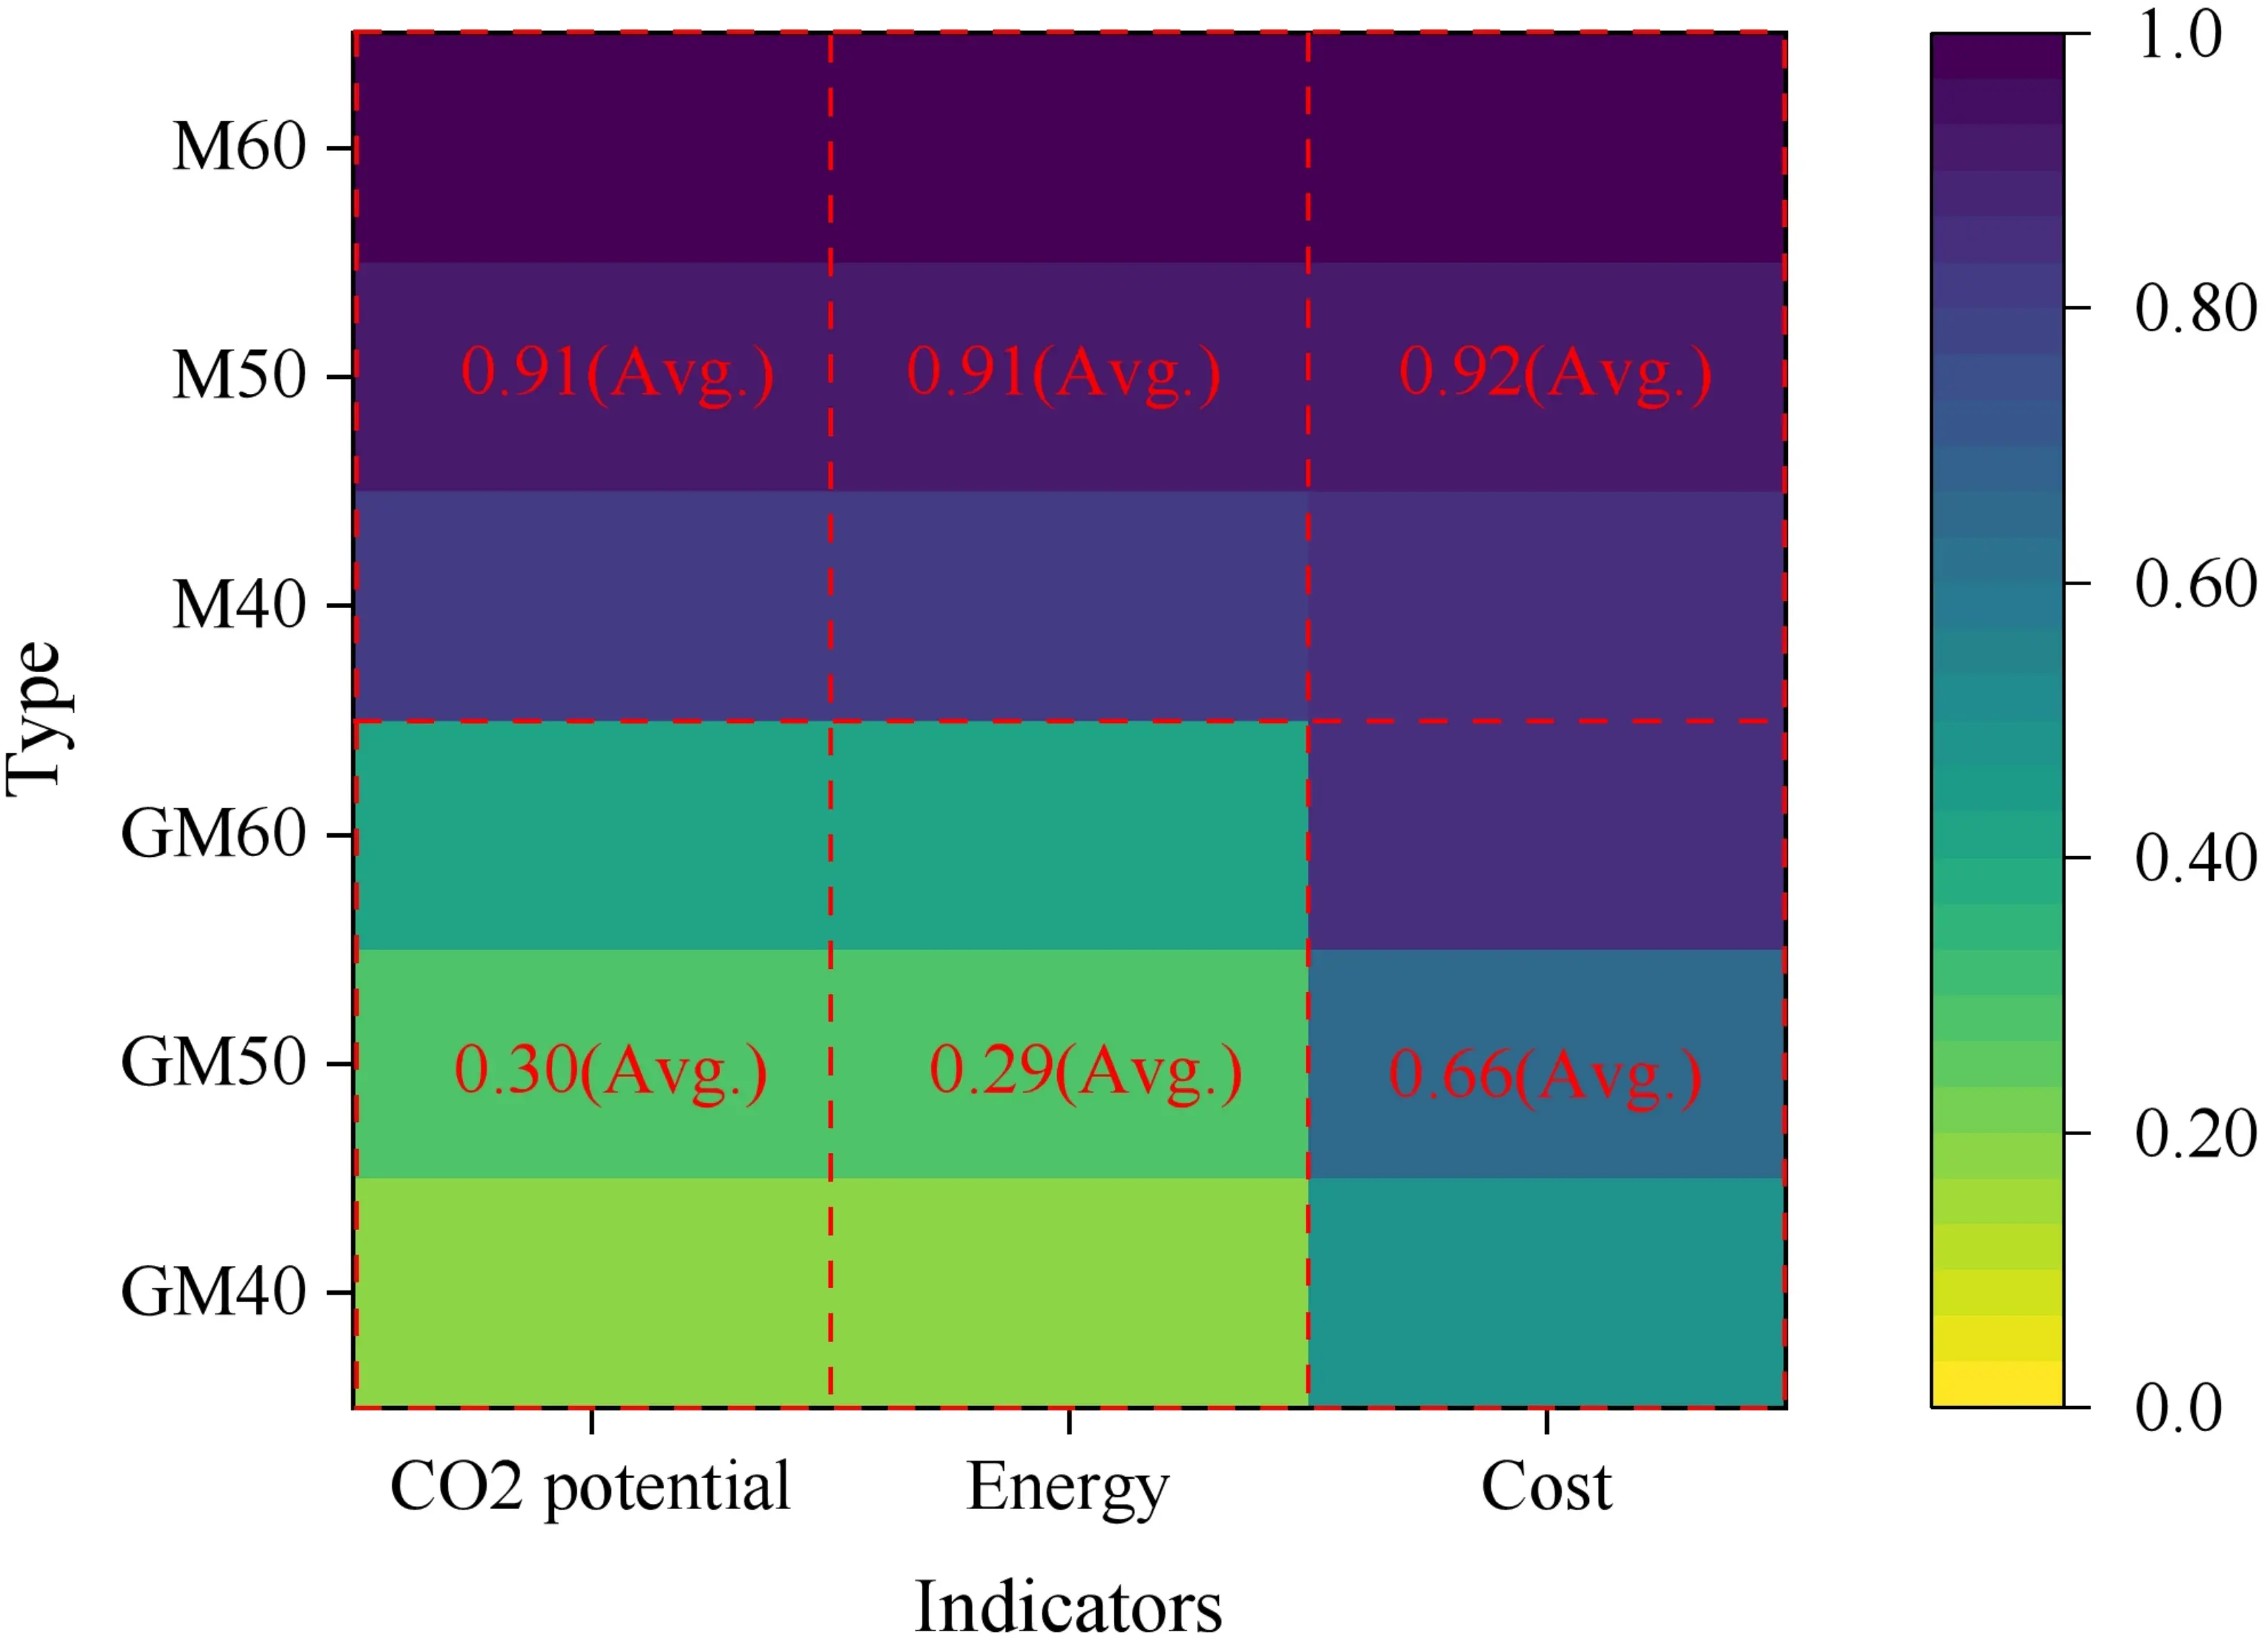
To further validate the reliability of the LCA results, a brief sensitivity analysis was conducted. Given that the alkali activator accounts for over 83% of carbon emissions and 94% of energy consumption, its impact factor was adjusted by ± 10%. The analysis reveals that a 10% reduction in the environmental intensity of the activator would result in an approximately 8.3% decrease in the total carbon emissions of SWSSGM. This significant sensitivity underscores the crucial role of the alkali activator in the sustainability of the geopolymer system, reinforcing the conclusion that optimizing the production of the activator is the most effective strategy for achieving further environmental improvements.
Taking all three indicators into account, the SWSSGM achieved a weighted average score of 2.05, significantly higher than the OPM’s 0.35. Among these, GM40 ranked first with 2.62 points, followed closely by GM50 and GM60, while all OPM intensity levels scored below 0.5 points. Therefore, by meeting strength requirements, SWSSGM can significantly reduce carbon emissions and energy consumption at the material production stage (cradle-to-gate) while also optimizing project costs, aligning with the trends of green construction.
6. Conclusions
This study investigated the influence of alkali modulus, alkali concentration, and FA content on the performance of geopolymer
(1) Increasing the proportion of FA or the concentration of the alkaline solution enhances the workability of the paste. Specifically, a rise in FA content leads to a 41.26% reduction in consistency, while the slump increases by 91.89%. The most significant improvement in workability occurs when the alkaline solution concentration is raised from 10% to 15%. However, further increasing the concentration to 20% results in a more gradual change.
(2) FA adversely affects the mechanical properties of the paste, with an increase in its content from 30% to 70% resulting in a decrease in compressive and flexural strengths by 48.27% and 33.86%, respectively. The optimal mechanical performance is achieved with a FA content of 30% (and 70% GBFS), an alkali concentration of 15%, and an alkali modulus of 1.2. In addition, the increase in alkali concentration slightly enhances the strength growth rate, while the increase in FA content leads to an increase of 15.29% in compressive strength and 13.75% in flexural strength growth rates, respectively.
(3) XRD and SEM analysis revealed that increasing the FA content led to a higher number of micro-pores in SWSSGM. This was caused by the accumulation of unreacted FA particles and an increase in N-A-S-H gel formation. In contrast, increasing the GBFS content produced more C-A-S-H gel, which reduced the gaps between FA particles and formed denser gel structures around them.
(4) The quadratic polynomial regression models established through multiple linear regression analysis demonstrated excellent fitting performance, effectively explaining and predicting the variation patterns of each dependent variable. Their coefficients of determination (R2) were 0.94, 0.95, 0.92, and 0.92, respectively. It should be noted that these empirical models possess specific validity within the experimental scope and material properties of this study.
(5) Based on the cradle-to-gate LCA and multi-criteria evaluation, SWSSGM outperforms OPM in terms of carbon emissions, energy consumption, and cost. It reduces carbon emissions by approximately 67.55%, decreases energy consumption by 68.30%, and lowers costs by 29.03%. Furthermore, SWSSGM achieves these advantages while meeting strength requirements, demonstrating exceptional low-carbon, energy-efficient, and cost-effective performance.
Acknowledgements
The authors would like to express their gratitude to the laboratory technicians at the School of Civil Engineering, Fujian University of Technology, for their support during the experimental phase of this research.
Authors contribution
Chen H: Conceptualization, methodology, investigation, data curation, writing-original draft.
Liu X: Supervision, resources, project administration, writing-review & editing, funding acquisition.
Deng WQ: Formal analysis, validation, visualization.
Ge FW: Investigation, software.
Liu XH: Validation, data curation.
Conflicts of interest
Xiang Liu is a Youth Editorial Board Member of Journal of Building Design and Environment. The other authors declare no conflicts of interest.
Ethical approval
Not applicable.
Consent to participate
Not applicable.
Consent for publication
Not applicable.
Availability of data and materials
All data and models generated and used to support the findings of this study are available from the corresponding author upon reasonable request.
Funding
This work was supported by the Natural Science Foundation of Fujian Province (No. 2025J01371 and No. 2023J05191) and the Research Start-up Fund Project of Fujian University of Technology (No. GY-Z220229 and No. GY-Z220228).
Copyright
© The Author(s) 2026.
References
-
1. Miller SA, Horvath A, Monteiro PJM. Impacts of booming concrete production on water resources worldwide. Nat Sustain. 2018;1(1):69-76.[DOI]
-
2. Maddalena R, Roberts JJ, Hamilton A. Can Portland cement be replaced by low-carbon alternative materials? A study on the thermal properties and carbon emissions of innovative cements. J Clean Prod. 2018;186:933-942.[DOI]
-
3. Yang KH, Song JK, Song KI. Assessment of CO2 reduction of alkali-activated concrete. J Clean Prod. 2013;39:265-272.[DOI]
-
4. Xi X, Zheng Y, Zhuo J, Zhang P, Golewski GL, Du C. Influence of water glass modulus and alkali content on the properties of alkali-activated thermally activated recycled cement. Constr Build Mater. 2024;452:138867.[DOI]
-
5. Sasui S, Kim G, van Riessen A, Lim C, Eu H, Park J, et al. Effects of Na2SiO3/NaOH ratio in alkali activator on the microstructure, strength and chloride ingress in fly ash and GGBS based alkali activated concrete. J Build Eng. 2024;98:111255.[DOI]
-
6. Younis A, Ebead U, Suraneni P, Nanni A. Fresh and hardened properties of seawater-mixed concrete. Constr Build Mater. 2018;190:276-286.[DOI]
-
7. Pan D, Yaseen SA, Chen K, Niu D, Ying Leung CK, Li Z. Study of the influence of seawater and sea sand on the mechanical and microstructural properties of concrete. J Build Eng. 2021;42:103006.[DOI]
-
8. Lu Z, Zhao C, Zhao J, Shi C, Xie J. Bond durability of FRP bars and seawater-sea sand-geopolymer concrete: Coupled effects of seawater immersion and sustained load. Constr Build Mater. 2023;400:132667.[DOI]
-
9. Xu Q, Ji T, Yang Z, Ye Y. Preliminary investigation of artificial reef concrete with sulphoaluminate cement, marine sand and sea water. Constr Build Mater. 2019;211:837-846.[DOI]
-
10. Kazemi H, Yekrangnia M, Shakiba M, Bazli M, Vatani Oskouei A. Bond-slip behaviour between GFRP/steel bars and seawater concrete after exposure to environmental conditions. Eng Struct. 2022;268:114796.[DOI]
-
11. Yang S, Xu J, Zang C, Li R, Yang Q, Sun S. Mechanical properties of alkali-activated slag concrete mixed by seawater and sea sand. Constr Build Mater. 2019;196:395-410.[DOI]
-
12. Xiao J, Zhang Q, Zhang P, Shen L, Qiang C. Mechanical behavior of concrete using seawater and sea-sand with recycled coarse aggregates. Struct Concr. 2019;20(5):1631-1643.[DOI]
-
13. Zhang Q, Xiao J, Liao Q, Duan Z. Structural behavior of seawater sea-sand concrete shear wall reinforced with GFRP bars. Eng Struct. 2019;189:458-470.[DOI]
-
14. Zhang Q, Xiao J, Zhang P, Zhang K. Mechanical behaviour of seawater sea-sand recycled coarse aggregate concrete columns under axial compressive loading. Constr Build Mater. 2019;229:117050.[DOI]
-
15. Vafaei D, Hassanli R, Ma X, Duan J, Zhuge Y. Sorptivity and mechanical properties of fiber-reinforced concrete made with seawater and dredged sea-sand. Constr Build Mater. 2021;270:121436.[DOI]
-
16. Wang J, Liu E, Li L. Multiscale investigations on hydration mechanisms in seawater OPC paste. Constr Build Mater. 2018;191:891-903.[DOI]
-
17. Zhang D, Jiang J, Zhang Z, Fang L, Weng Y, Chen L, et al. Comparative analysis of sulfate resistance between seawater sea sand concrete and freshwater desalted sea sand concrete under different exposure environments. Constr Build Mater. 2024;416:135146.[DOI]
-
18. Guo S, Liu J, Liu Z, Ma M, Quan J, Shi C, et al. Influence of the multiple element ions contained in seawater and sea sand on the freeze-thaw resistance of cementitious materials. J Build Eng. 2024;94:109902.[DOI]
-
19. Zhang Q, Ji T, Yang Z, Wang C, Wu H. Influence of different activators on microstructure and strength of alkali-activated nickel slag cementitious materials. Constr Build Mater. 2020;235:117449.[DOI]
-
20. Wan H, Wei H, Liu G, Gao L, Liu Z, Zhou K. Nano-silica modified alkali activated multi-solid waste concrete: Mechanisms of hydration and seawater corrosion. Constr Build Mater. 2025;492:142884.[DOI]
-
21. Sarkar M, Maiti M, Malik MA, Xu S. Evaluation of the crack-healing performance and durability of bacteria integrated alkali-activated fly ash composites. J Build Eng. 2022;54:104642.[DOI]
-
22. Lv W, Sun Z, Su Z. Study of seawater mixed one-part alkali activated GGBFS-fly ash. Cem Concr Compos. 2020;106:103484.[DOI]
-
23. Guo X, Pan X. Effects of steel slag on mechanical properties and mechanism of fly ash-based geopolymer. J Mater Civ Eng. 2020;32(2):04019348.[DOI]
-
24. Si R, Dai Q, Guo S, Wang J. Mechanical property, nanopore structure and drying shrinkage of metakaolin-based geopolymer with waste glass powder. J Clean Prod. 2020;242:118502.[DOI]
-
25. Cao R, Jia Z, Zhang S, Chen C, Gao Y, Zhang Y. Effect of low-calcium and high-magnesium ferronickel slag on the microstructure and micromechanical properties of alkali-activated blended ground granulated blast furnace slag. Constr Build Mater. 2023;406:133421.[DOI]
-
26. Lee WKW, van Deventer JSJ. The effect of ionic contaminants on the early-age properties of alkali-activated fly ash-based cements. Cem Concr Res. 2002;32(4):577-584.[DOI]
-
27. Lyu X, Robinson N, Elchalakani M, Johns ML, Dong M, Nie S. Sea sand seawater geopolymer concrete. J Build Eng. 2022;50:104141.[DOI]
-
28. Yang Z, Zhan X, Zhu H, Zhang B, Feng P, Li H, et al. Performance-based alkali-activated seawater sea-sand concrete: Mixture optimization for mechanical, environmental, and economical objectives. Constr Build Mater. 2023;409:134156.[DOI]
-
29. Xu D, An G, Chen Y, Liu Z, Liu X. Experiment on compressive properties and microscopic analysis of sea sand geopolymer-based recycled concrete. Materials. 2023;17(1):28.[DOI]
-
30. Chen H, Liu X, Zhang W, Huang J. Mechanical properties of seawater and sea-sand geopolymer concrete using response surface methodology. Case Stud Constr Mater. 2025;23:e05577.[DOI]
-
31. Dai M, Ou H, Kuang P, Lu Z, Yuan B, Xie J. Study on the mechanical property and durability of alkali-activated seawater and sea sand recycled aggregate concrete. J Build Eng. 2024;98:111157.[DOI]
-
32. Dou J, Zhang J, Yu H, Ma H, Pan J, Zhang Z. Investigation on the dynamic mechanical properties and mesoscopic damage mechanism of alkali-activated seawater and sea sand concrete in marine corrosive environments. Constr Build Mater. 2024;456:139256.[DOI]
-
33. Li YL, Zhao XL, Raman RS, Al-Saadi S. Thermal and mechanical properties of alkali-activated slag paste, mortar and concrete utilising seawater and sea sand. Constr Build Mater. 2018;159:704-724.[DOI]
-
34. Yang Z, Zhan X, Zhu H, Zhang B, Li R, Dong Z, et al. Eco-sustainable design of seawater sea-sand slag-based geopolymer mortars incorporating ternary solid waste. Constr Build Mater. 2024;431:136512.[DOI]
-
35. Yang Z, Li R, Zhu H, Zhang B, Dong Z, Zhan X, et al. Synthesis of eco-sustainable seawater sea-sand geopolymer mortars from ternary solid waste: Influence of microstructure evolution on mechanical performance. Sustain Mater Technol. 2024;41:e01056.[DOI]
-
36. Zhang B, Zhu H, Cao R, Ding J, Chen X. Feasibility of using geopolymers to investigate the bond behavior of FRP bars in seawater sea-sand concrete. Constr Build Mater. 2021;282:122636.[DOI]
-
37. Cui Y, Qu S, Tekle BH, Ai W, Liu M, Xu N, et al. Experimental and finite element study of bond behavior between seawater sea-sand alkali activated concrete and FRP bars. Constr Build Mater. 2024;424:135919.[DOI]
-
38. JGJ 206-2010. Technical code for application of sea sand concrete [Internet]. Beijing: MOHURD; 2010. Available from: https://www.codeofchina.com/standard/JGJ206-2010.html
-
39. ASTM D1141-98. Standard practice for preparation of substitute ocean water [Internet]. West Conshohocken: ASTM; 2021. Available from: https://store.astm.org/d1141-98r21.html
-
40. GB/T 17671-2021. Test method of cement mortar strength (ISO method) [Internet]. Beijing: SAMR, SAC; 2021. Available from: https://www.codeofchina.com/standard/GBT17671-2021.html
-
41. GB/T 1346-2011. Test methods for water requirement of normal consistency, setting time and soundness of the portland cement [Internet]. Beijing: AQSIQ, SAC; 2011. Available from: https://www.codeofchina.com/standard/GBT1346-2011.html
-
42. GB/T 2419-2005. Test method for fluidity of cement mortar [Internet]. Beijing: SAC; 2005. Available from: https://www.codeofchina.com
-
43. Uppalapati S, Vandewalle L, Cizer Ö. Autogenous shrinkage of slag-fly ash blends activated with hybrid sodium silicate and sodium sulfate at different curing temperatures. Constr Build Mater. 2020;265:121276.[DOI]
-
44. Zhu C, Wan Y, Wang L, Ye Y, Yu H, Yang J. Strength characteristics and microstructure analysis of alkali-activated slag–fly ash cementitious material. Materials. 2022;15(17):6169.[DOI]
-
45. Dassekpo JBM, Zha X, Zhan J, Ning J. The effects of the sequential addition of synthesis parameters on the performance of alkali activated fly ash mortar. Results Phys. 2017;7:1506-1512.[DOI]
-
46. Teng S, Lim TYD, Sabet Divsholi B. Durability and mechanical properties of high strength concrete incorporating ultra fine ground granulated blast-furnace slag. Constr Build Mater. 2013;40:875-881.[DOI]
-
47. Mohamed OA, Najm O, Zuaiter HA. Setting time, sulfuric acid resistance, and strength development of alkali-activated mortar with slag & fly ash binders. Results Eng. 2024;21:101711.[DOI]
-
48. Ismail I, Bernal SA, Provis JL, San Nicolas R, Hamdan S, van Deventer JSJ. Modification of phase evolution in alkali-activated blast furnace slag by the incorporation of fly ash. Cem Concr Compos. 2014;45:125-135.[DOI]
-
49. JGJ 55-2011. Specification for mix proportion design of ordinary concrete [Internet]. Beijing: Ministry of Housing and Urban-Rural Construction of the People’s Republic of China; 2011. Available from: https://www.codeofchina.com/standard/JGJ55-2011.html
-
50. Izumi Y, Iizuka A, Ho HJ. Calculation of greenhouse gas emissions for a carbon recycling system using mineral carbon capture and utilization technology in the cement industry. J Clean Prod. 2021;312:127618.[DOI]
-
51. Mahjoubi S, Barhemat R, Meng W, Bao Y. Ai-guided auto-discovery of low-carbon cost-effective ultra-high performance concrete (UHPC). Resour Conserv Recycl. 2023;189:106741.[DOI]
-
52. Lao JC, Huang BT, Xu LY, Khan M, Fang Y, Dai JG. Seawater sea-sand engineered geopolymer composites (EGC) with high strength and high ductility. Cem Concr Compos. 2023;138:104998.[DOI]
-
53. Yang S, Wang J, Dong K, Zhang X, Sun Z. A predictive solution for fracture modeling of alkali-activated slag and fly ash blended sea sand concrete after exposure to elevated temperature. Constr Build Mater. 2022;329:127111.[DOI]
-
54. Yang Z, Lu F, Zhan X, Zhu H, Zhang B, Chen Z, et al. Mechanical properties and mesoscopic damage characteristics of basalt fibre-reinforced seawater sea-sand slag-based geopolymer concrete. J Build Eng. 2024;84:108688.[DOI]
-
55. Zhang B, Zhu H, Shah KW, Dong Z, Wu J. Performance evaluation and microstructure characterization of seawater and coral/sea sand alkali-activated mortars. Constr Build Mater. 2020;259:120403.[DOI]
-
56. Wałach D, Mach A. Effect of concrete mix composition on greenhouse gas emissions over the full life cycle of a structure. Energies. 2023;16(7):3229.[DOI]
-
57. Wu X, He J, Tian J, Tan X, Hu S, Zheng Y, et al. Shear behaviors of engineered cementitious composites to seawater sea-sand concrete (ECC-to-SSSC) interfaces cast using 3D-printed pre-grooving formwork: Mechanical properties, characterization, and life-cycle assessment. J Build Eng. 2023;78:107636.[DOI]
-
58. Chen C, Habert G, Bouzidi Y, Jullien A. Environmental impact of cement production: Detail of the different processes and cement plant variability evaluation. J Clean Prod. 2010;18(5):478-485.[DOI]
-
59. Zhu X, Jamal AS, Zhang M, Liu B, Shi J. Energy consumption, carbon emissions and cost analysis of accelerated curing: A case study of hybrid alkali-activated cement. Renew Sustain Energy Rev. 2025;210:115206.[DOI]
-
60. He M, Yang Z, Li N, Zhu X, Fu B, Ou Z. Strength, microstructure, CO2 emission and economic analyses of low concentration phosphoric acid-activated fly ash geopolymer. Constr Build Mater. 2023;374:130920.[DOI]
-
61. Xiong G, Cundy A, Guo X. Utilization of corn cob ash (CCA) to prepare geopolymer grout: Reaction mechanism, crack repair effectiveness and life cycle assessment. J Clean Prod. 2024;476:143741.[DOI]
Copyright
© The Author(s) 2026. This is an Open Access article licensed under a Creative Commons Attribution 4.0 International License (https://creativecommons.org/licenses/by/4.0/), which permits unrestricted use, sharing, adaptation, distribution and reproduction in any medium or format, for any purpose, even commercially, as long as you give appropriate credit to the original author(s) and the source, provide a link to the Creative Commons license, and indicate if changes were made.
Publisher’s Note
Science Exploration remains a neutral stance on jurisdictional claims in published
maps
and institutional affiliations. The views expressed in this article are solely those
of
the author(s) and do not reflect the opinions of the Editors or the publisher.
Share And Cite


Science Exploration Style
Chen H, Liu X, Deng WQ, Ge FW, Liu XH. Performance and lifecycle assessment of fly ash-slag geopolymer mortar using seawater and sea sand. J Build Des Environ. 2026;4:2025134. https://doi.org/10.70401/jbde.2026.0027
Tips
Copy completed.
Submit a Manuscript
Author Instructions
Cite this Article
Article Metrics
0
View
0
Download
Cited
Article Updates

- Abstract
- Keywords
- 1. Introduction
- 2. Materials and Experimental Methods
- 3. Results and Discussion
- 4. Prediction Models
- 5. Environmental and Economic Evaluation
- 6. Conclusions
- Acknowledgements
- Authors contribution
- Conflicts of interest
- Ethical approval
- Consent to participate
- Consent for publication
- Availability of data and materials
- Funding
- Copyright
Science Exploration Style
Chen H, Liu X, Deng WQ, Ge FW, Liu XH. Performance and lifecycle assessment of fly ash-slag geopolymer mortar using seawater and sea sand. J Build Des Environ. 2026;4:2025134. https://doi.org/10.70401/jbde.2026.0027
copy
Share Link
copy