Rheological rejuvenation and structural build-up of 3D printed manufactured sand concrete via secondary mixing protocol
Wenxuan Zhu
1
,
Chao Liu
1,2,3

,
Yu Zhang
4
,
Chao Zhu
1
,
Tilin Wang
1
,
Yifei Wang
1
,
Huawei Liu
1,*
*Correspondence to:
Huawei Liu, School of Civil Engineering, Xi’an University of Architecture and Technology, Xi’an 710055, Shaanxi, China.
E-mail: liuhuawei@xauat.edu.cn
J Build Des Environ. 2026;4:2025141. 10.70401/jbde.2026.0029
Received: December 18, 2025Accepted: February 06, 2026Published: February 10, 2026
This article belongs to the Special lssue Advances in Low-Carbon Emission-Reduction Materials for Sustainable Buildings
This manuscript is made available in its unedited form to allow early access to the
reported findings. Further editing will be completed before final publication. As such,
the content may include errors, and standard legal disclaimers are applicable.
Abstract
The application of sustainable manufactured sand (MS) in 3D printed concrete is currently severely restricted by the “pumpability-buildability” conflict, primarily characterized by the high internal friction and angularity of MS particles. To overcome this bottleneck, this study proposes a novel process-oriented strategy: a secondary mixing protocol featuring a static resting period and delayed superplasticizer addition. This approach is explicitly designed to induce a “rheological rejuvenation” effect in stiff MS mixtures. Quantitative results demonstrate that this protocol reduces the static yield stress of high-volume MS ink (T-3) by approximately 39% (from 1,516 Pa to 924 Pa) and significantly diminishes thixotropic hysteresis, thereby successfully reopening the effective printing window to approximately 65 min. Although increasing MS content accelerates the structural build-up rate, the optimized 3D printed manufactured sand concrete (T-3) achieves a 28-day compressive strength of 61 MPa, representing a 15% enhancement over the river sand reference group (T-0). These findings confirm that the secondary mixing protocol is a robust solution capable of unlocking the potential of high-volume MS in sustainable digital construction.
Keywords
3D printed concrete, manufactured sand, secondary mixing, rheological rejuvenation, mechanical anisotropy
1. Introduction
The advent of 3D printed concrete (3DPC) has ushered in a new era for the construction industry[1,2], offering unprecedented geometrical freedom, formwork-free fabrication, and automated efficiency[3-5]. However, the widespread application of this technology is strictly governed by the rheological performance of the cementitious ink[6-9]. The material must satisfy a paradoxical set of requirements: low viscosity and dynamic yield stress for smooth pumping and extrusion, yet high static yield stress and structural buildability to sustain the weight of subsequent layers immediately after deposition[10-12]. This delicate “pumpability-buildability” balance is particularly difficult to maintain when transitioning from river sand to sustainable manufactured sand (MS).
With the global depletion of natural river sand resources and increasing environmental regulations, the utilization of MS in 3DPC has become an imperative trend[13-15]. Unlike the rounded particles of river sand, MS is characterized by angular textures, rough surfaces, and a significant content of stone powder and microfines. While these features can enhance the mechanical interlocking and strength of the hardened matrix, they pose severe challenges to the fresh state behavior of 3DPC inks[16-19]. The high specific surface area and angularity of MS particles significantly increase internal friction and water demand, leading to rapid rheological deterioration, excessive pumping pressure, and a shortened open time[20]. Consequently, preparing 3D printed manufactured sand concrete (3DPMSC) that maintains stable extrudability without sacrificing buildability remains a critical technical bottleneck. To rigorously evaluate this performance trade-off, this study defines specific quantitative criteria for the “effective printing window”. Buildability is governed by a lower bound of static yield stress (τstatic ≥ 600 Pa), representing the gravitational limit required to support subsequent layers. Conversely, pumpability is constrained by an empirical flowability range of 185-190 mm and a positive thixotropic hysteresis area (S > 0), where S≈0 signifies the limit of rheological reversibility due to geometric jamming.
To address these rheological challenges, current research primarily focuses on optimizing binder compositions (e.g., ternary blends) or incorporating chemical admixtures such as nanoclay and viscosity-modifying agents[21,22]. Although effective, relying solely on complex formulations often incurs high costs or compromises early-age strength. A more process-oriented approach, known as “secondary mixing” or “double mixing”[23-25], has demonstrated potential in conventional concrete, particularly for recycled aggregate concrete, by improving the dispersion of moisture and strengthening the interfacial transition zone (ITZ)[26,27]. However, existing research on 3DPMSC largely focuses on complex chemical formulations, which often incur high costs. In contrast,
To address this gap, this study employs a secondary mixing protocol designed to induce a “rheological rejuvenation” effect in 3DPMSC. Distinct from conventional single-stage mixing, this approach innovatively incorporates a static resting period coupled with the gradient addition of polycarboxylate superplasticizer (PCE). By systematically investigating the evolution of static yield stress, plastic viscosity, and thixotropy under varying binder-sand ratios and mixing regimes, this research aims to elucidate the mechanism by which secondary mixing unlocks the potential of high-volume MS in 3D printing, offering a robust solution for sustainable digital construction.
2. Preparation of 3DPMSC by Secondary Mixing
Preliminary experiments indicated that 3DPMSC prepared using conventional single-stage mixing is subject to severe rheological deterioration. This challenge is primarily attributed to the interfacial water film (IWF) effect[28] induced by the high content of stone powder and fine particles (D50 = 36 μm) inherent in the MS. To address this, a secondary mixing protocol was adopted in this study. This approach is designed to disrupt the early-age flocculated structures of fine particles and release entrapped water, thereby achieving “rheological rejuvenation” of 3DPMSC. The protocol comprises the following three stages:
Stage I: Pre-wetting and initial mixing
All mixing water, fine aggregates, and the major portion of the PCE (0.50% by binder mass) were first mixed for 1 minute to
Stage II: Static resting (Maturation)
The mixture was allowed to rest in a controlled environment at 25 ± 1 °C for 10 minutes. This duration was strategically selected to align with the “dormant period” onset of the cement hydration kinetics. This stage is critical for allowing the paste to safely bypass the “acceleration period”[30] of cement hydration (specifically, the initial 15 minutes, when C3A reacts to form hexagonal
Stage III: Secondary mixing and rejuvenation
The remaining minor portion of PCE (0.06% by binder mass) and the full dosage of hydroxypropyl methyl cellulose (HPMC) were added, followed by a final mixing duration of 2 minutes. This specific duration was determined based on preliminary rheological tests. Extending the mixing time beyond 2 minutes yielded negligible improvements in rheological performance but increased the risk of moisture loss and air entrainment. This stage is pivotal for rheological regulation. The delayed addition of this supplementary PCE dosage promotes competitive adsorption[31], which disintegrates the early flocculated structures formed during the resting period and releases entrapped water, thereby significantly reducing the static yield stress. Simultaneously, the incorporation of HPMC facilitates the construction of a three-dimensional network, moderately increasing the plastic viscosity[32]. The synergistic interaction of these two mechanisms restores the fluidity of the paste while ensuring shape retention capabilities immediately after extrusion.
3. Materials and Methods
3.1 Raw materials and proportion
The cementitious binder utilized in this study was P.O 42.5 Ordinary Portland Cement, produced by Qilianshan Cement Co., Ltd. The cement possesses a specific surface area of 349 m2/kg and exhibits a well-graded particle size distribution. Its particle size distribution curve and microscopic morphology are presented in Figure 1 and Figure 2, respectively. For the fine aggregate,
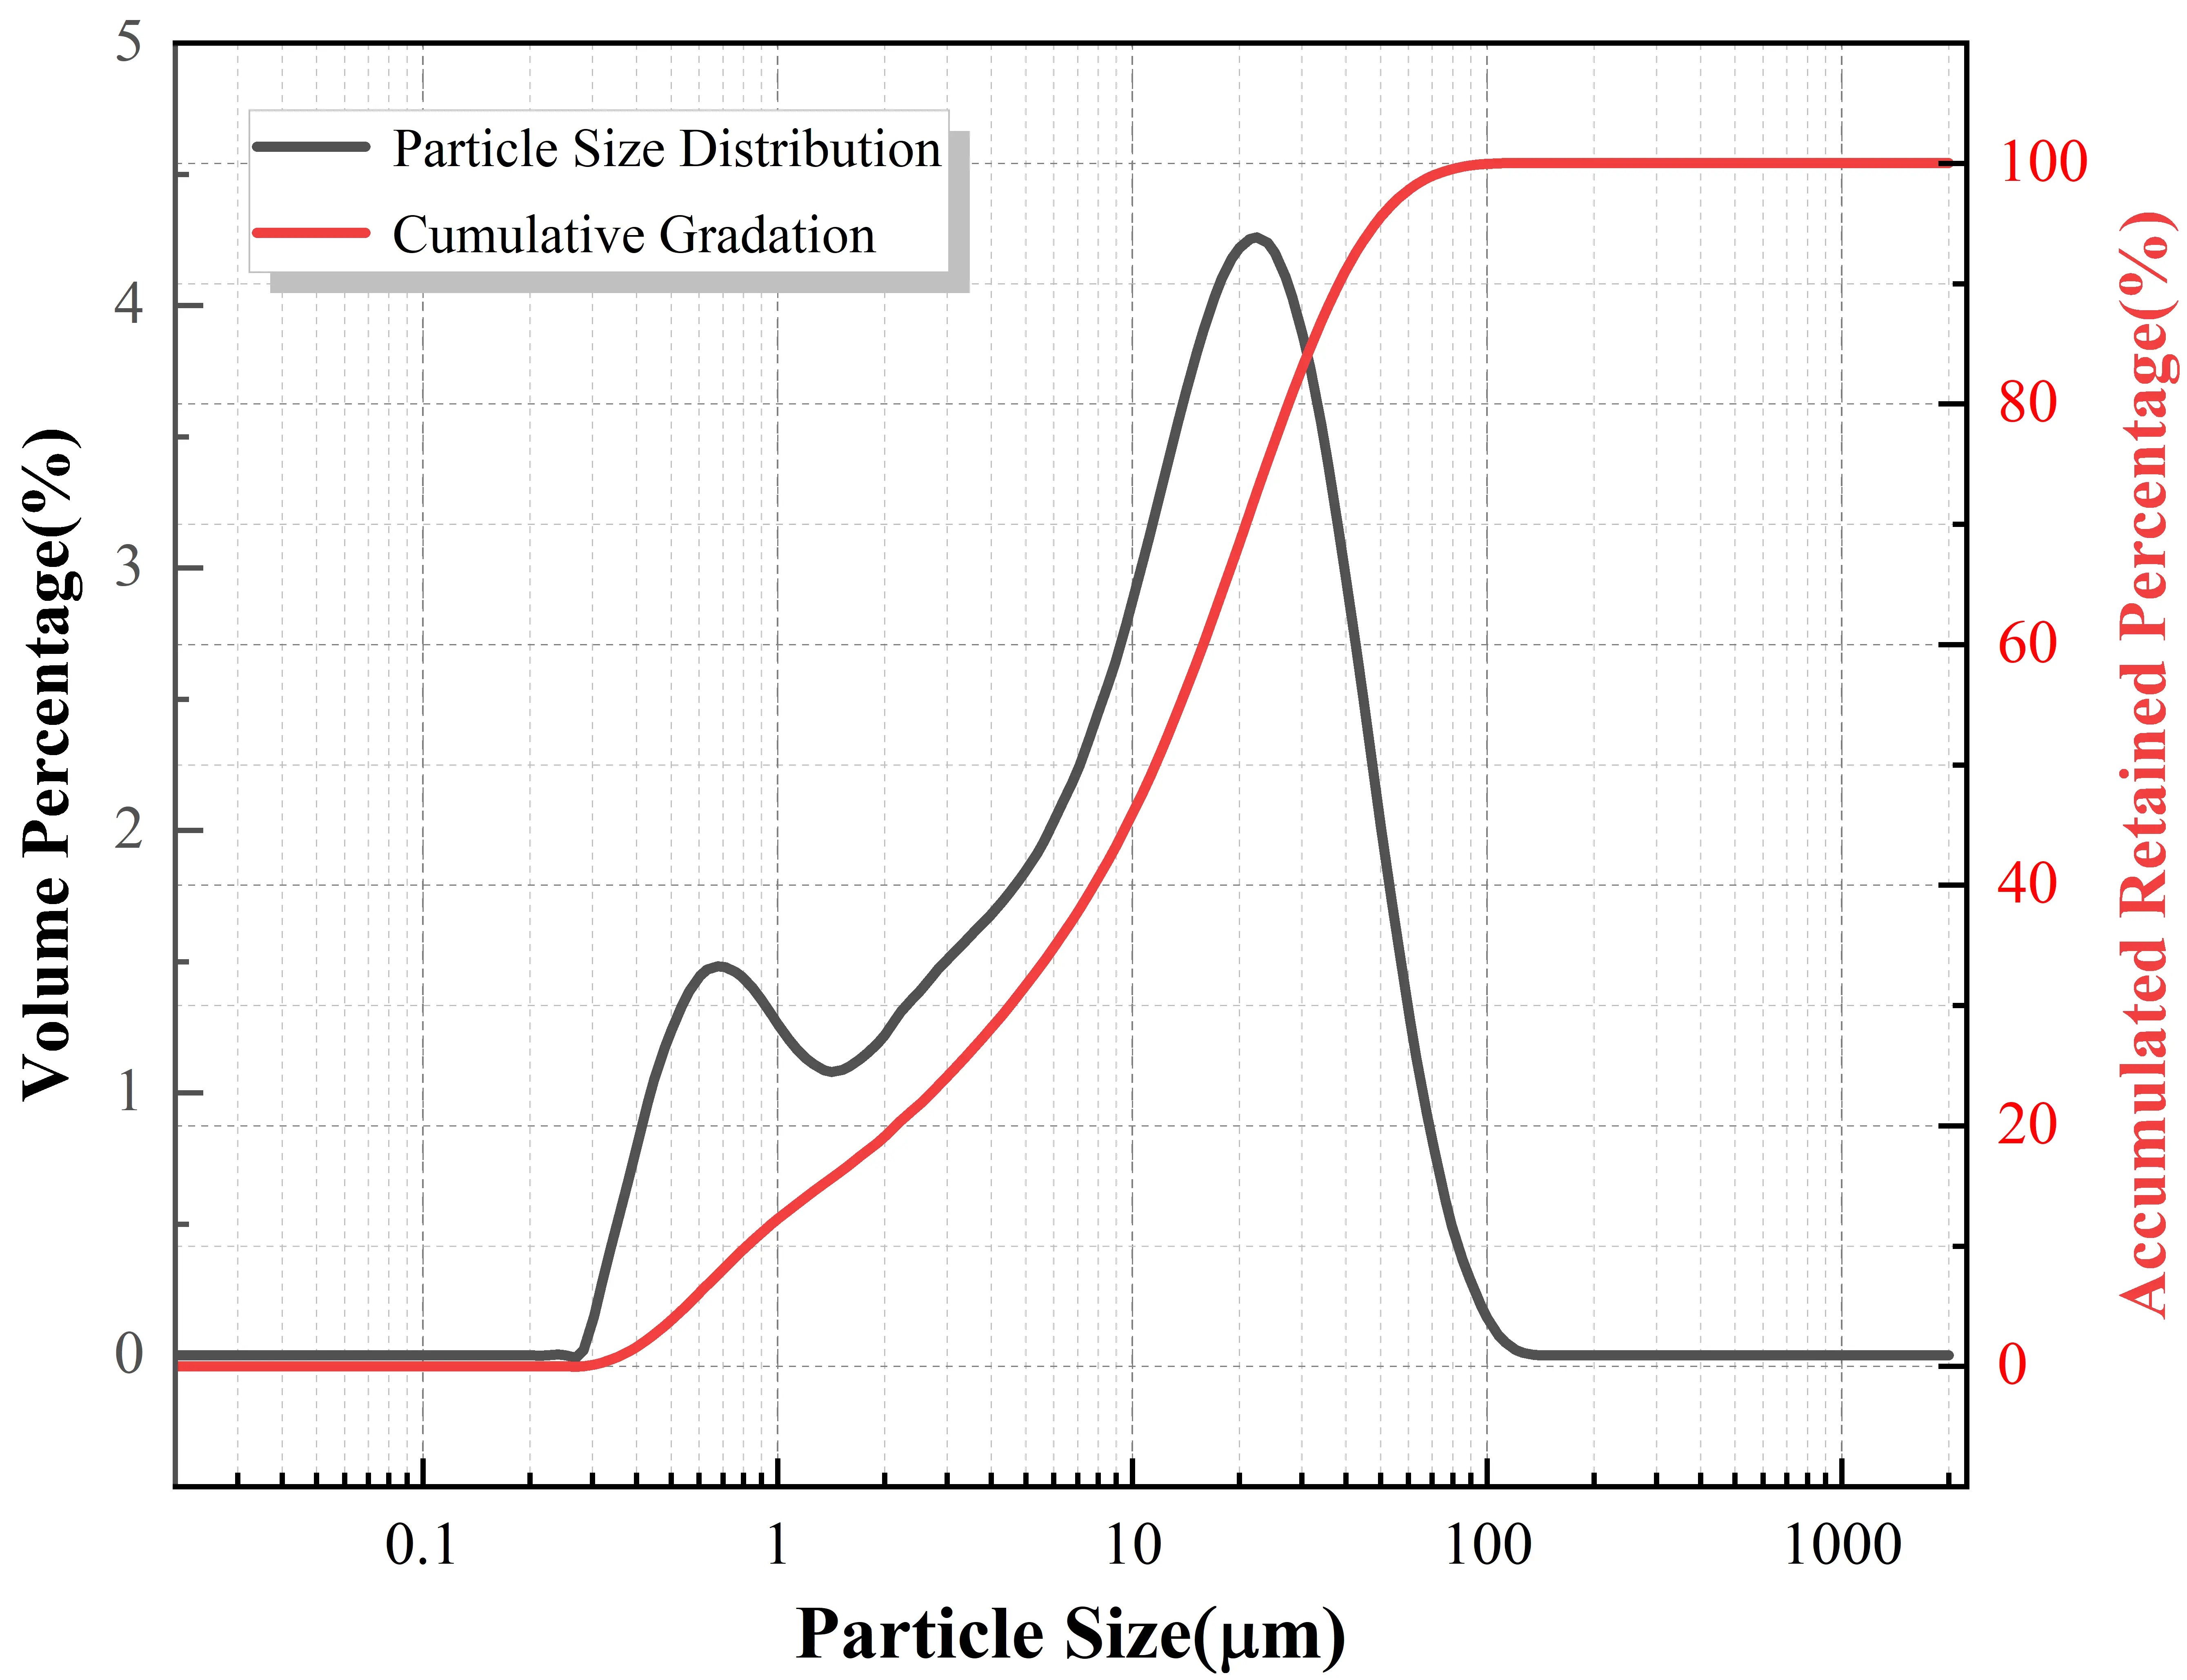
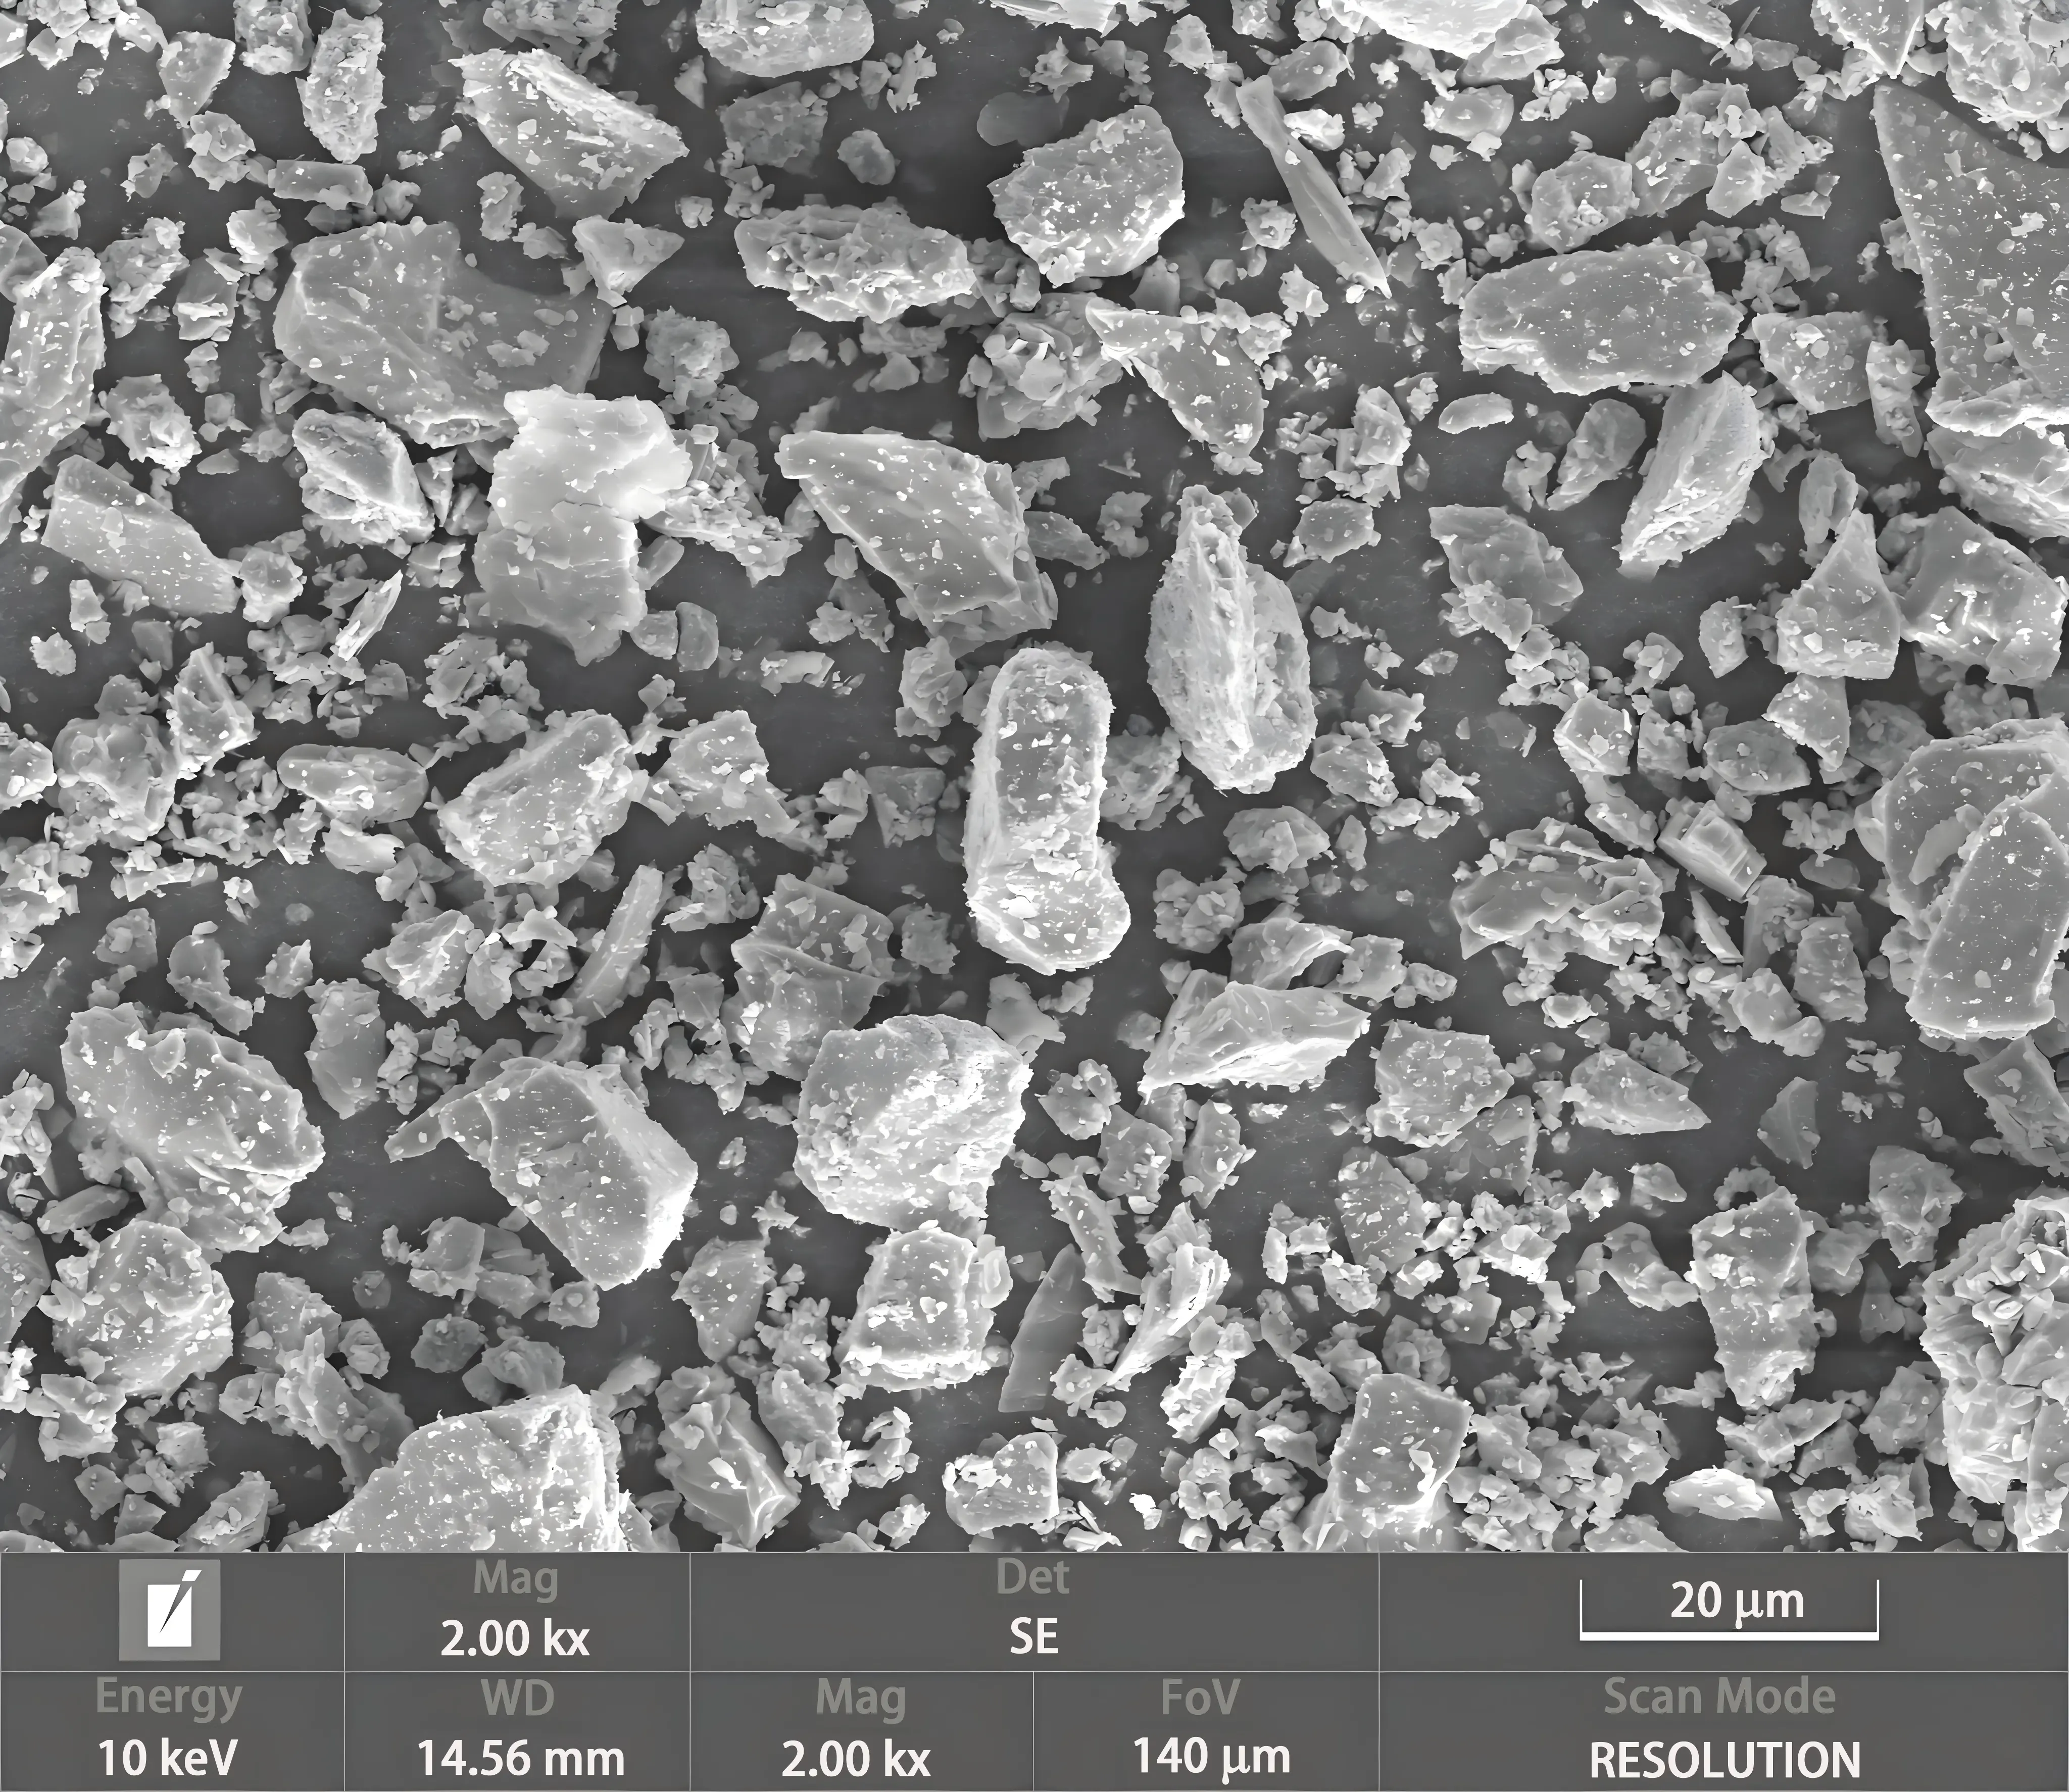
Figure 2. Microscopic morphology (SEM) of P·O 42.5 cement particles. SEM: scanning electron microscopy.
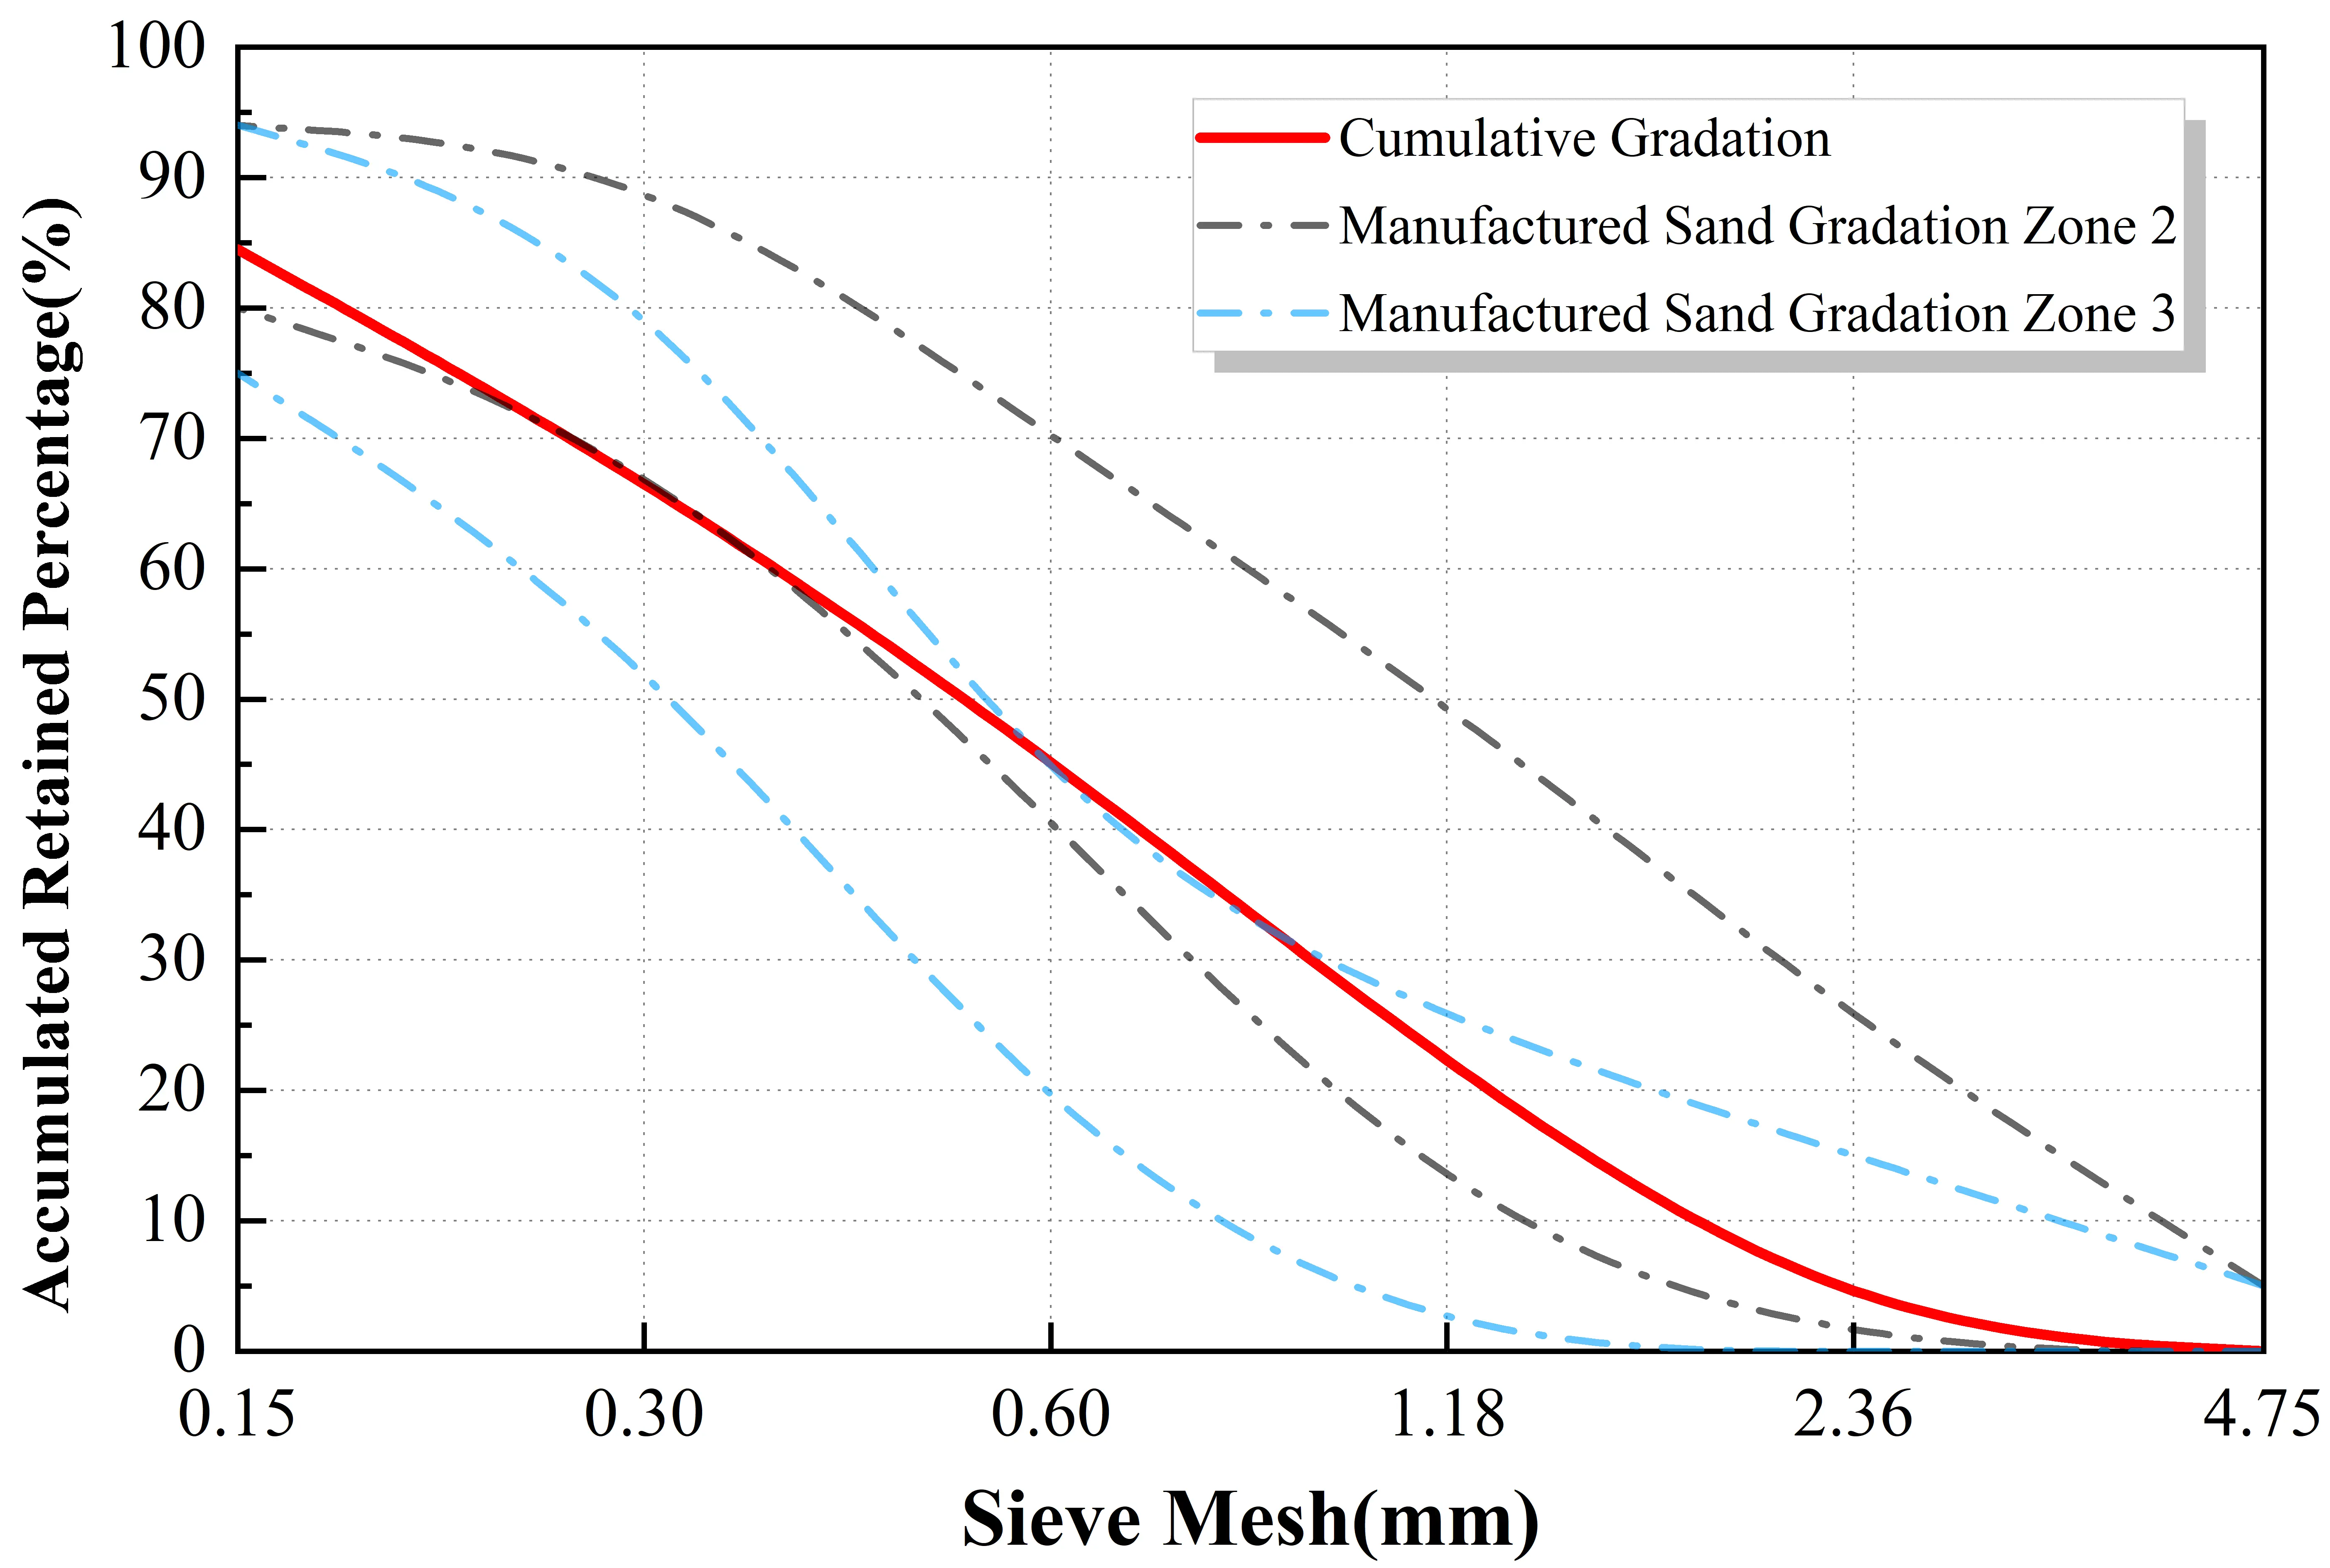
Table 1. Chemical composition of fine aggregate/wt%.
| Type | Al2O3 | CaO | K2O | MgO | Na2O | SiO2 | Fe2O3 |
| Tuff | 15.66 | 5.16 | 2.68 | 3.15 | 1.50 | 50.45 | 7.30 |
Table 2. Basic technical indicators of fine aggregate.
| Serial number | Detection content | Tuff sand |
| 1 | Apparent Density (kg/m3) | 2,740 |
| 2 | Loose Bulk Density (kg/m3) | 1,610 |
| 3 | Compacted Bulk Density (kg/m3) | 1,690 |
| 4 | Void Ratio/% | 41 |
| 5 | Fineness Modulus | 3.71 |
| 6 | MB | 3.5 |
| Stone Powder Content/% | 9.0 | |
| 7 | Crushing Index/% | 26.60 |
| 8 | Saturated Surface-Dry Water Absorption Rate/% | 1.25 |
MB: methylene blue.
Table 3. Performance indicators of PCE.
| Project | Water reduction rate/% | Bleeding rate/% | Gas content/% | Setting time difference/(min) | Compressive strength ratio/% | |
| 7d | 28d | |||||
| Test result | 30.3 | 15.3 | 2.5 | 108 | 184 | 159 |
PCE: polycarboxylate superplasticizer.
3.2 Mix proportion design
To elucidate the influence of MS content, PCE dosage, and static resting time on rheological performance, the rheological behavior, printability, and mechanical properties of 3DPMSC were systematically evaluated. The detailed mixture proportions formulated for this investigation are presented in Table 4.
Table 4. 3DPMSC mix proportion design.
| Group number | W/B | B/S | P·O (kg/m3) | MS (kg/m3) | SP/% | PCE/% | HPMC/‰ | W (kg/m3) | |
| First stirring | Second stirring | ||||||||
| T-0 | 0.3 | 1:1.0 | 871.20 | 871.20 | 9.0 | 0.50 | 0.06 | 0.45 | 261.36 |
| T-1 | 1:1.1 | 831.60 | 910.80 | 249.48 | |||||
| T-2 | 1:1.2 | 792.00 | 950.40 | 237.60 | |||||
| T-3 | 1:1.3 | 762.30 | 980.10 | 228.69 | |||||
3DPMSC: 3D printed manufactured sand concrete; W/B: water-binder Ratio; B/S: binder-sand ratio; P·O: ordinary Portland cement; SP: superplasticizer; MS: manufactured sand; PCE: polycarboxylate superplasticizer; HPMC: hydroxypropyl methyl cellulose.
3.3 Test process and methods
3.3.1 Rheological testing
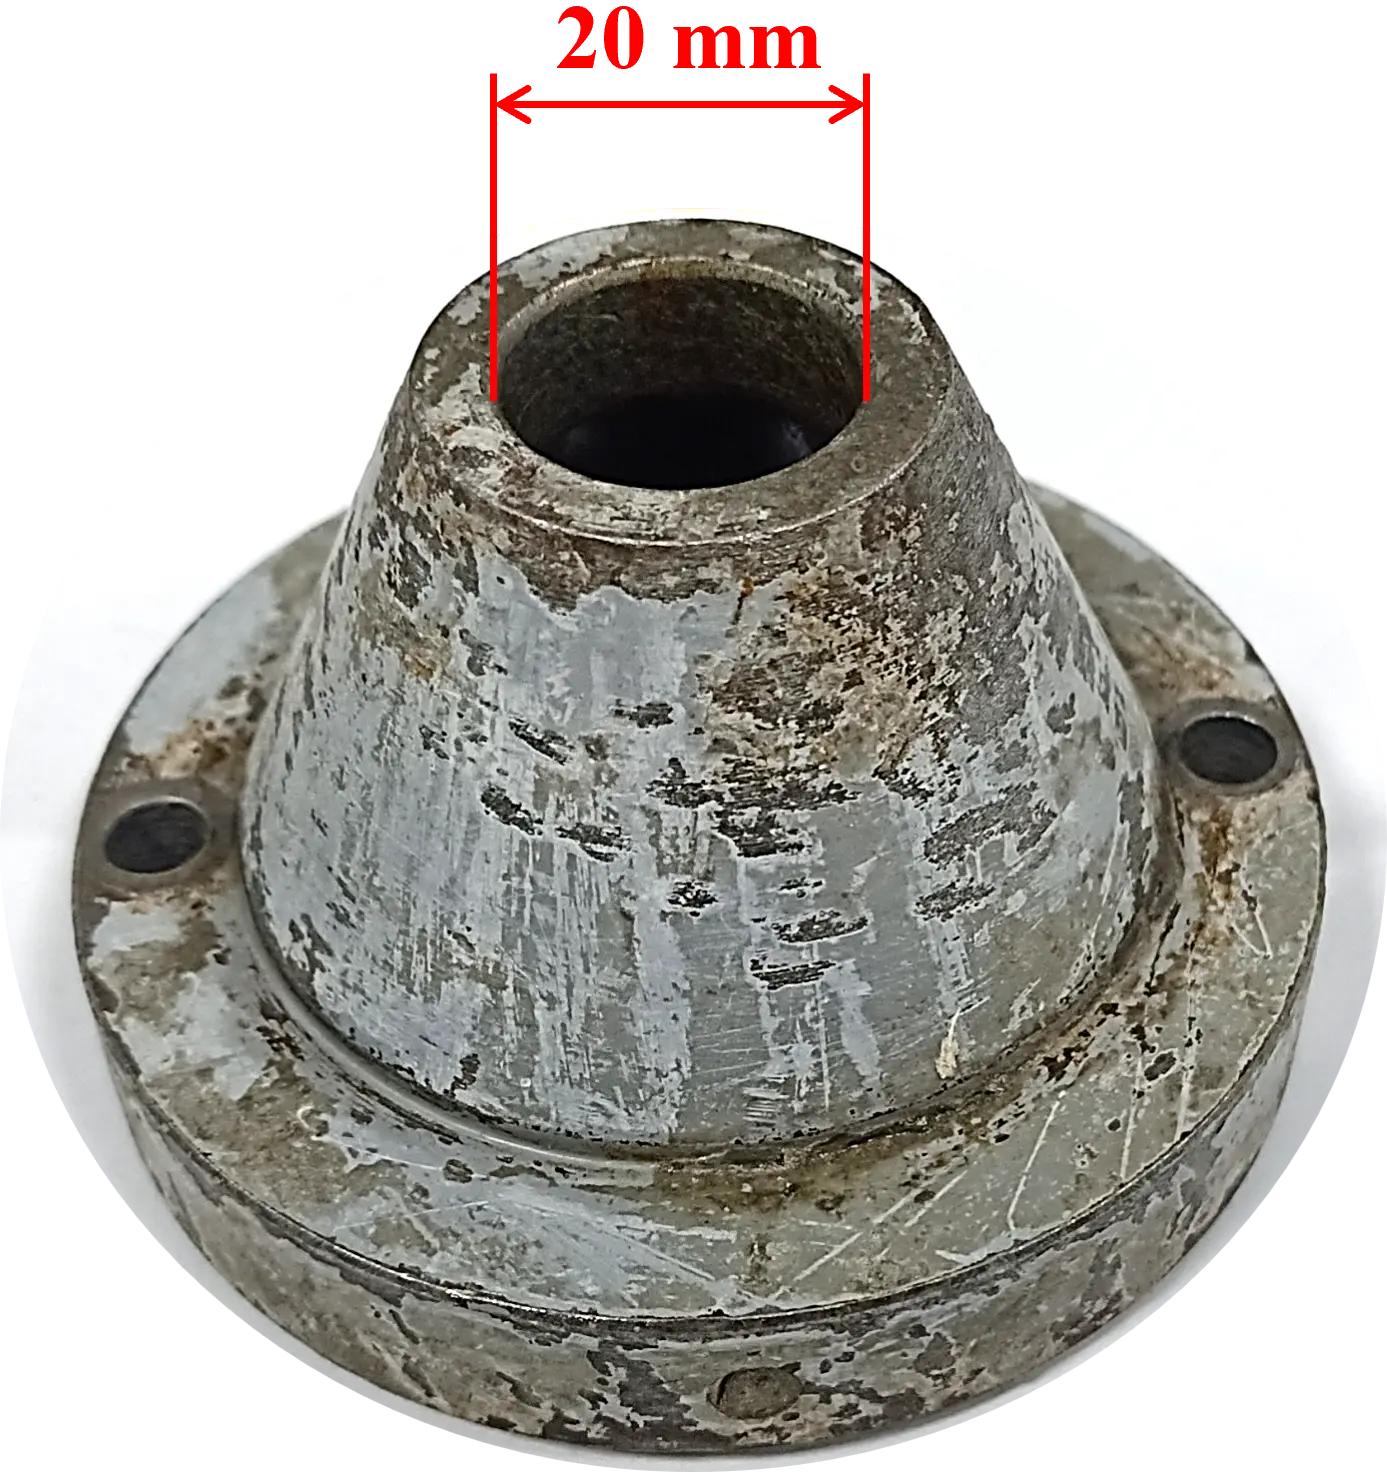
The rheological characterization of the 3DPMSC was conducted to evaluate key parameters, including yield stress, plastic viscosity, and thixotropy. All testing protocols strictly adhered to the ASTM C1749-17a standard (Standard Guide for Measurement of the Rheological Properties of Hydraulic Cementitious Paste Using a Rotational Rheometer). Data acquisition was performed using an RSX SST concrete rheometer (Figure 4), and the subsequent analysis was executed via the Rheo 3000 V2.3 software. Considering that the maximum particle size of the aggregates in 3DPMSC was less than 4.75 mm, a coaxial vane geometry (Figure 4) was utilized. The specific vane dimensions were 20 mm in height and 5 mm in width.
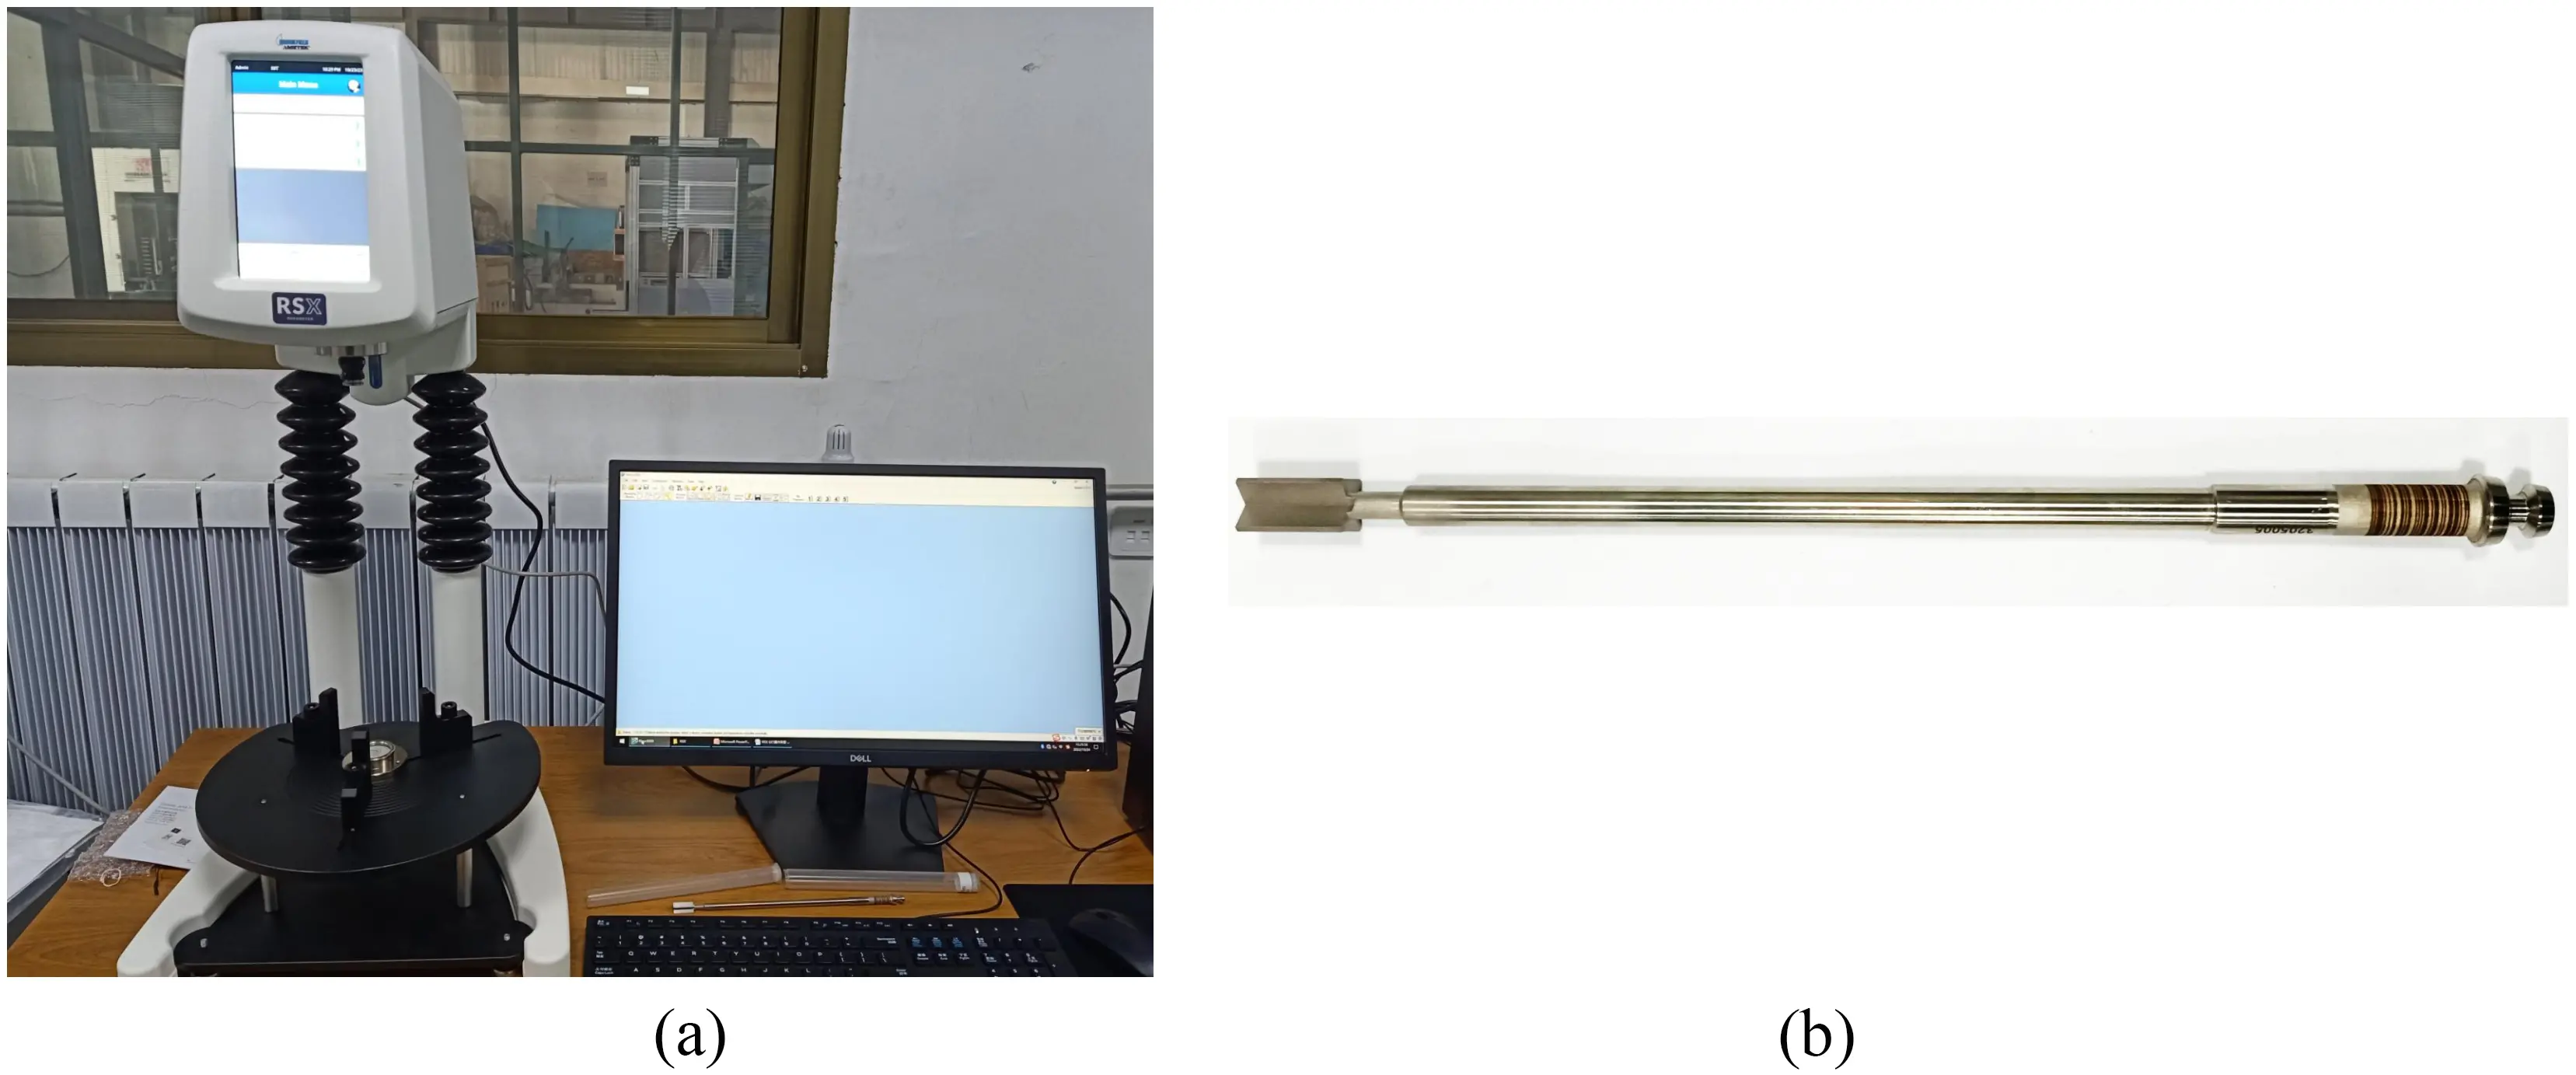
Figure 4. (a) RSX SST Concrete rheometer; (b) Coaxial four-paddle rotor (VT-20-10).
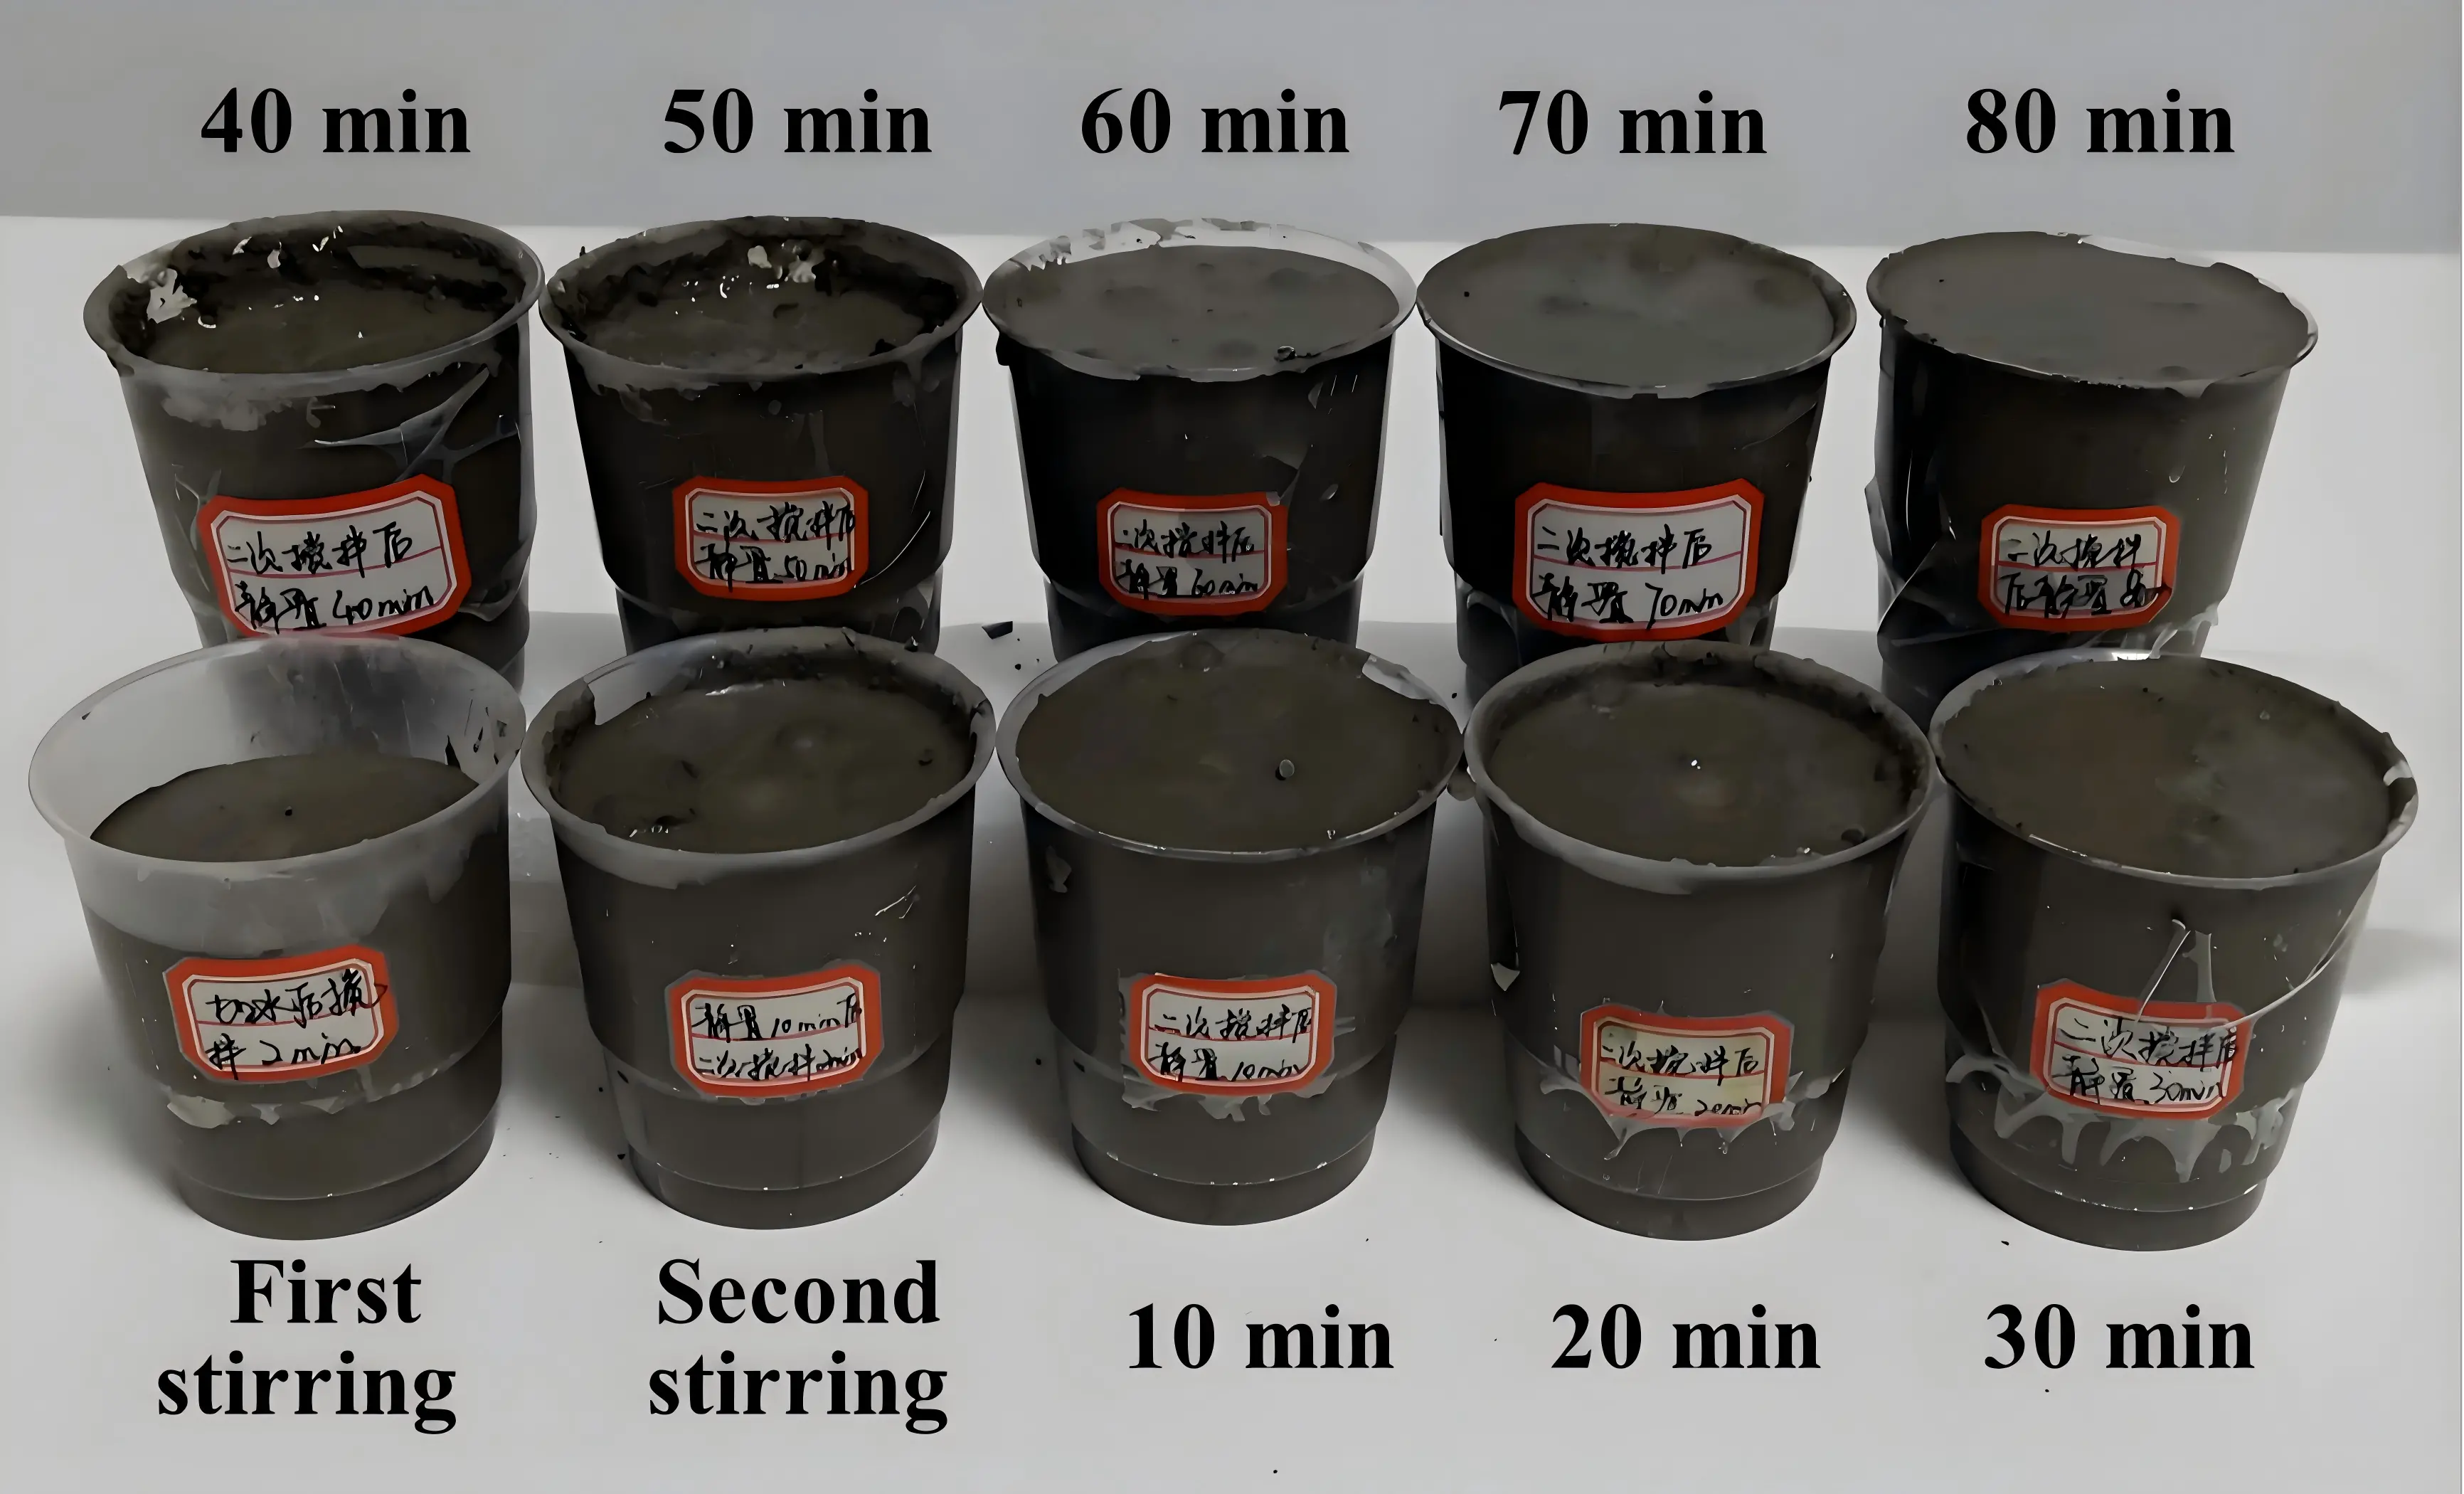
Sample Preparation: The preparation of 3DPMSC specimens strictly followed the procedures described in Section 2. Immediately after mixing, equal masses of the fresh paste were weighed and transferred into 10 separate testing containers. To investigate the
Rheological Testing Protocol: The rheological testing protocol, depicted in Figure 6, consisted of four distinct stages. The specific steps and their objectives are detailed as follows:
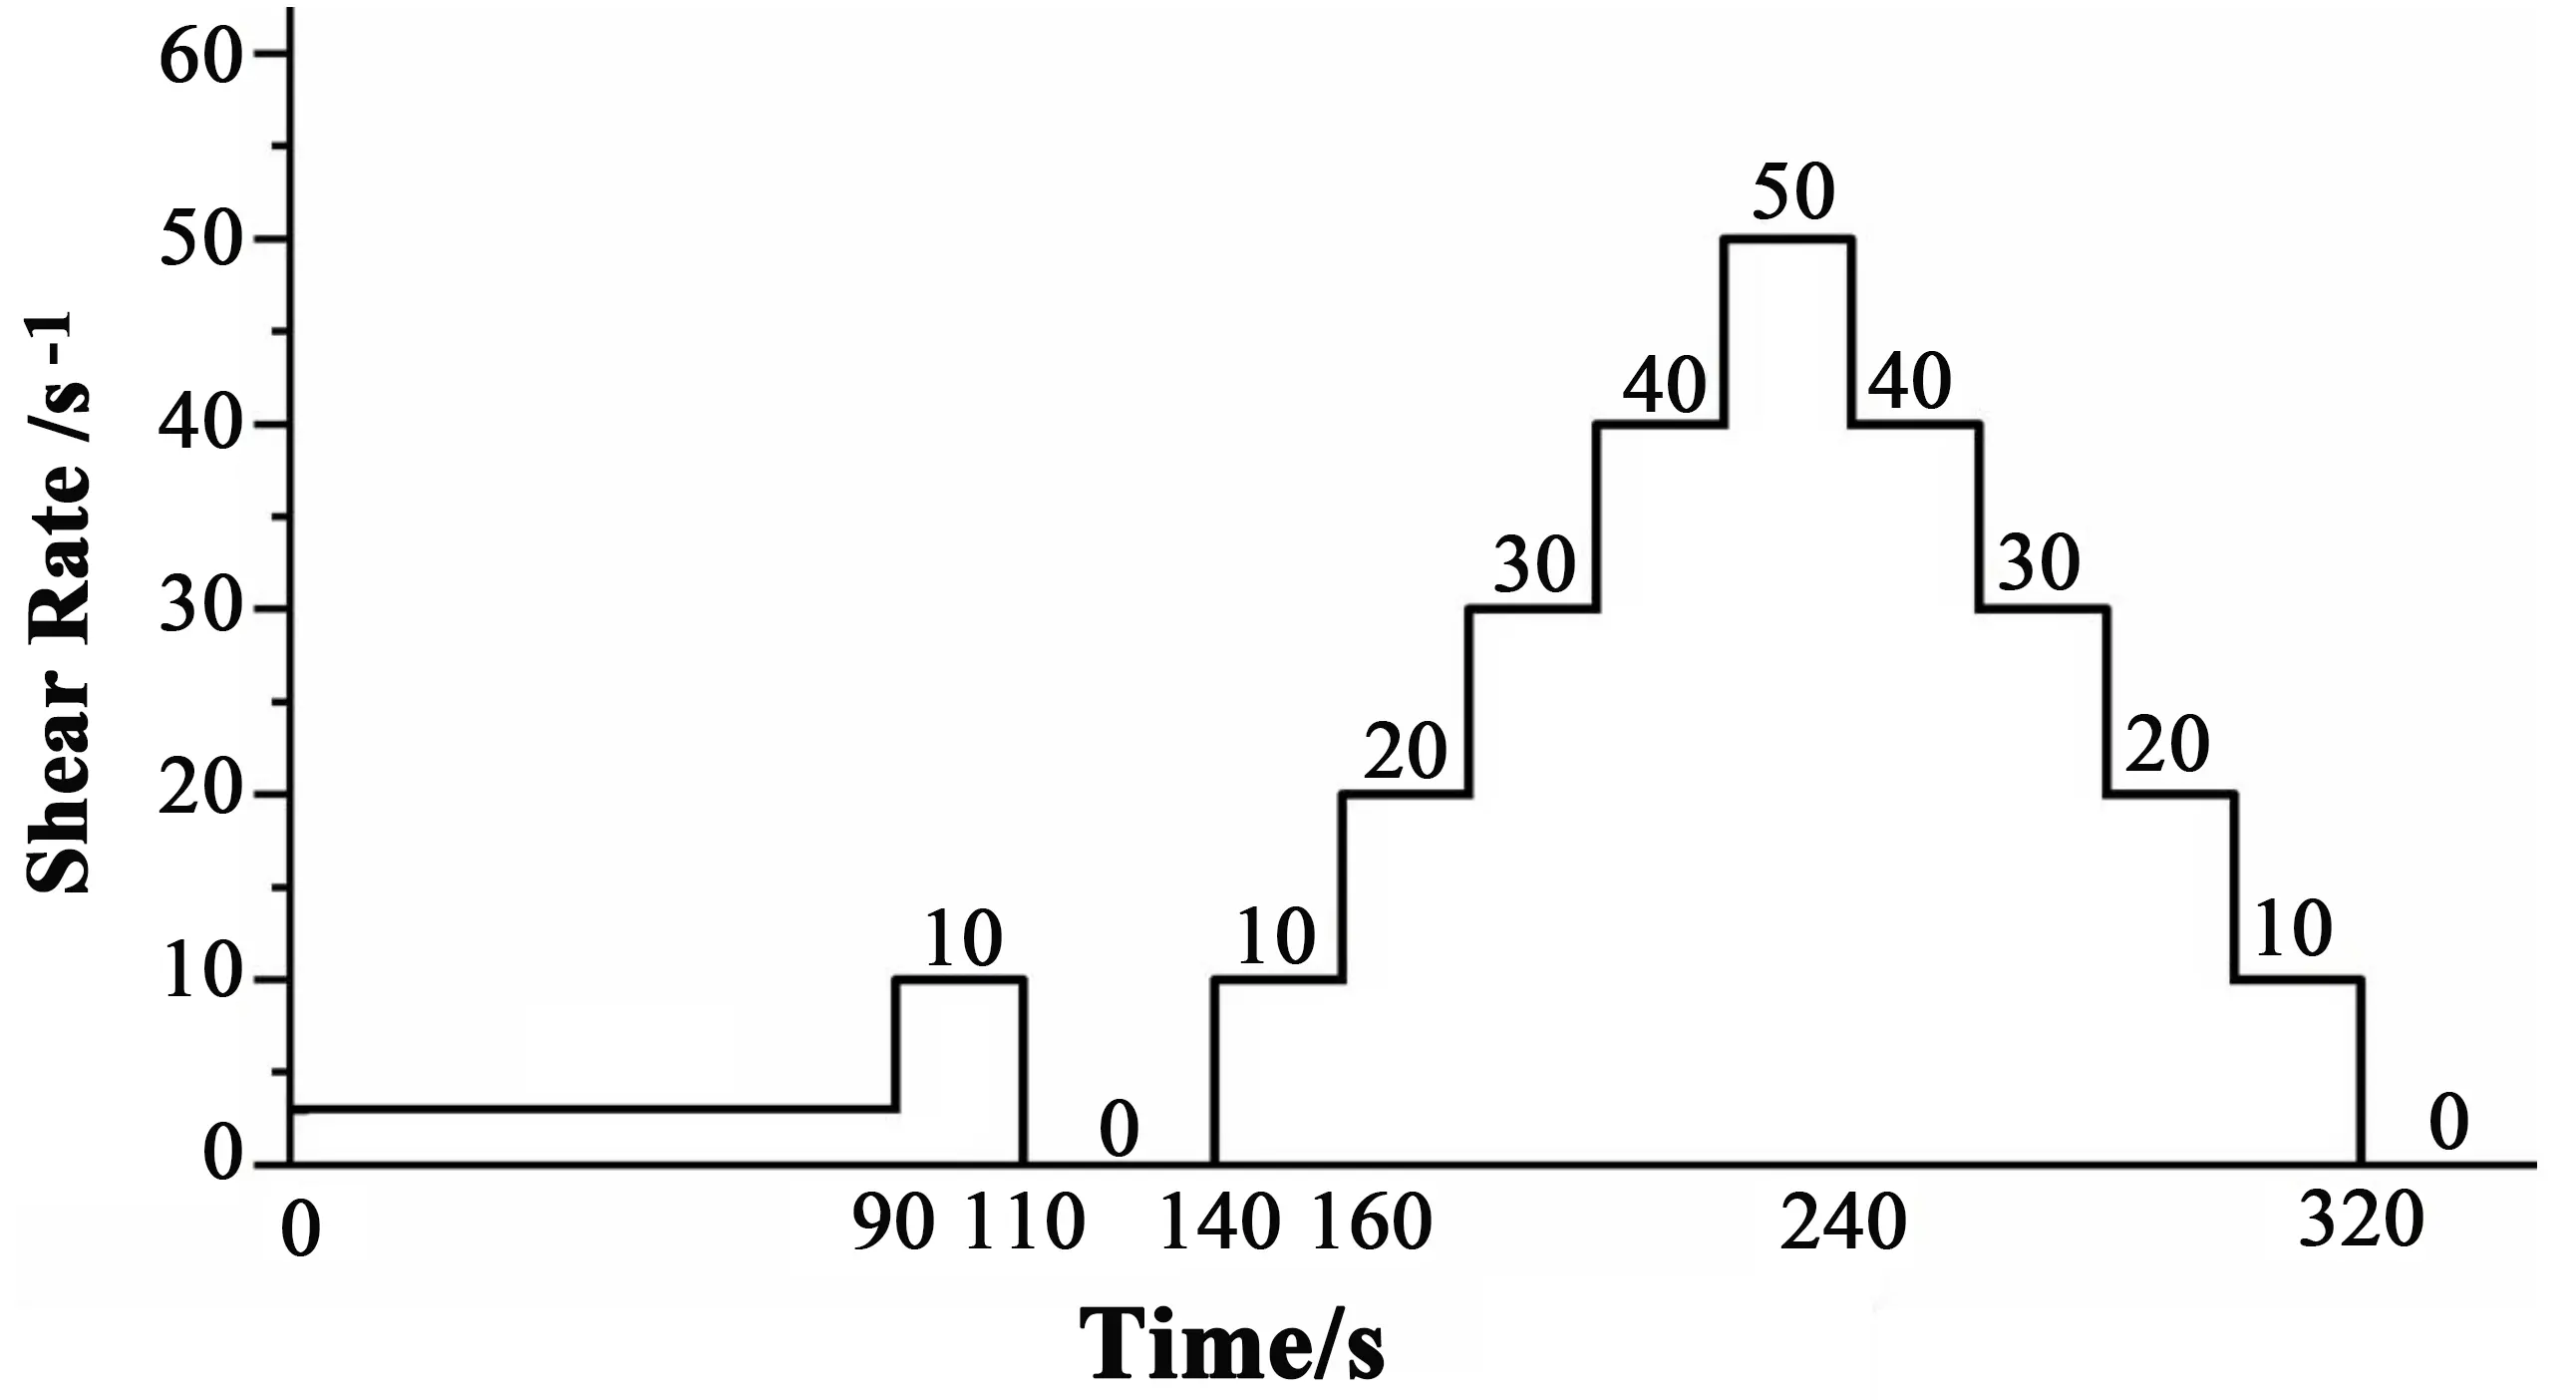
Stage I (Static yield stress measurement): A constant low shear rate of 0.05 s-1 was applied for 100 s to determine the static yield stress.
Stage II (Pre-shearing): The shear rate was increased to 10 s-1 and maintained for 20 s. This step aimed to eliminate any shear history effects induced during sample loading and to ensure the paste fully filled the gap between the vane and the container wall.
Stage III (Resting): The shear rate was reduced to 0 s-1 and held for 30 s to allow the paste system to return to a stable state prior to the main measurement.
Stage IV (Thixotropy and plastic viscosity measurement): A stepwise shear rate sweep was employed, where the shear rate was ramped up from 0 s-1 to 50 s-1 and subsequently ramped down to 0 s-1 with the same increment. The holding duration for each shear step was set to 20 s. Data obtained from this stage were utilized to analyze the thixotropy of the material. In this study, the
3.3.2 3D Printing system and specimen preparation
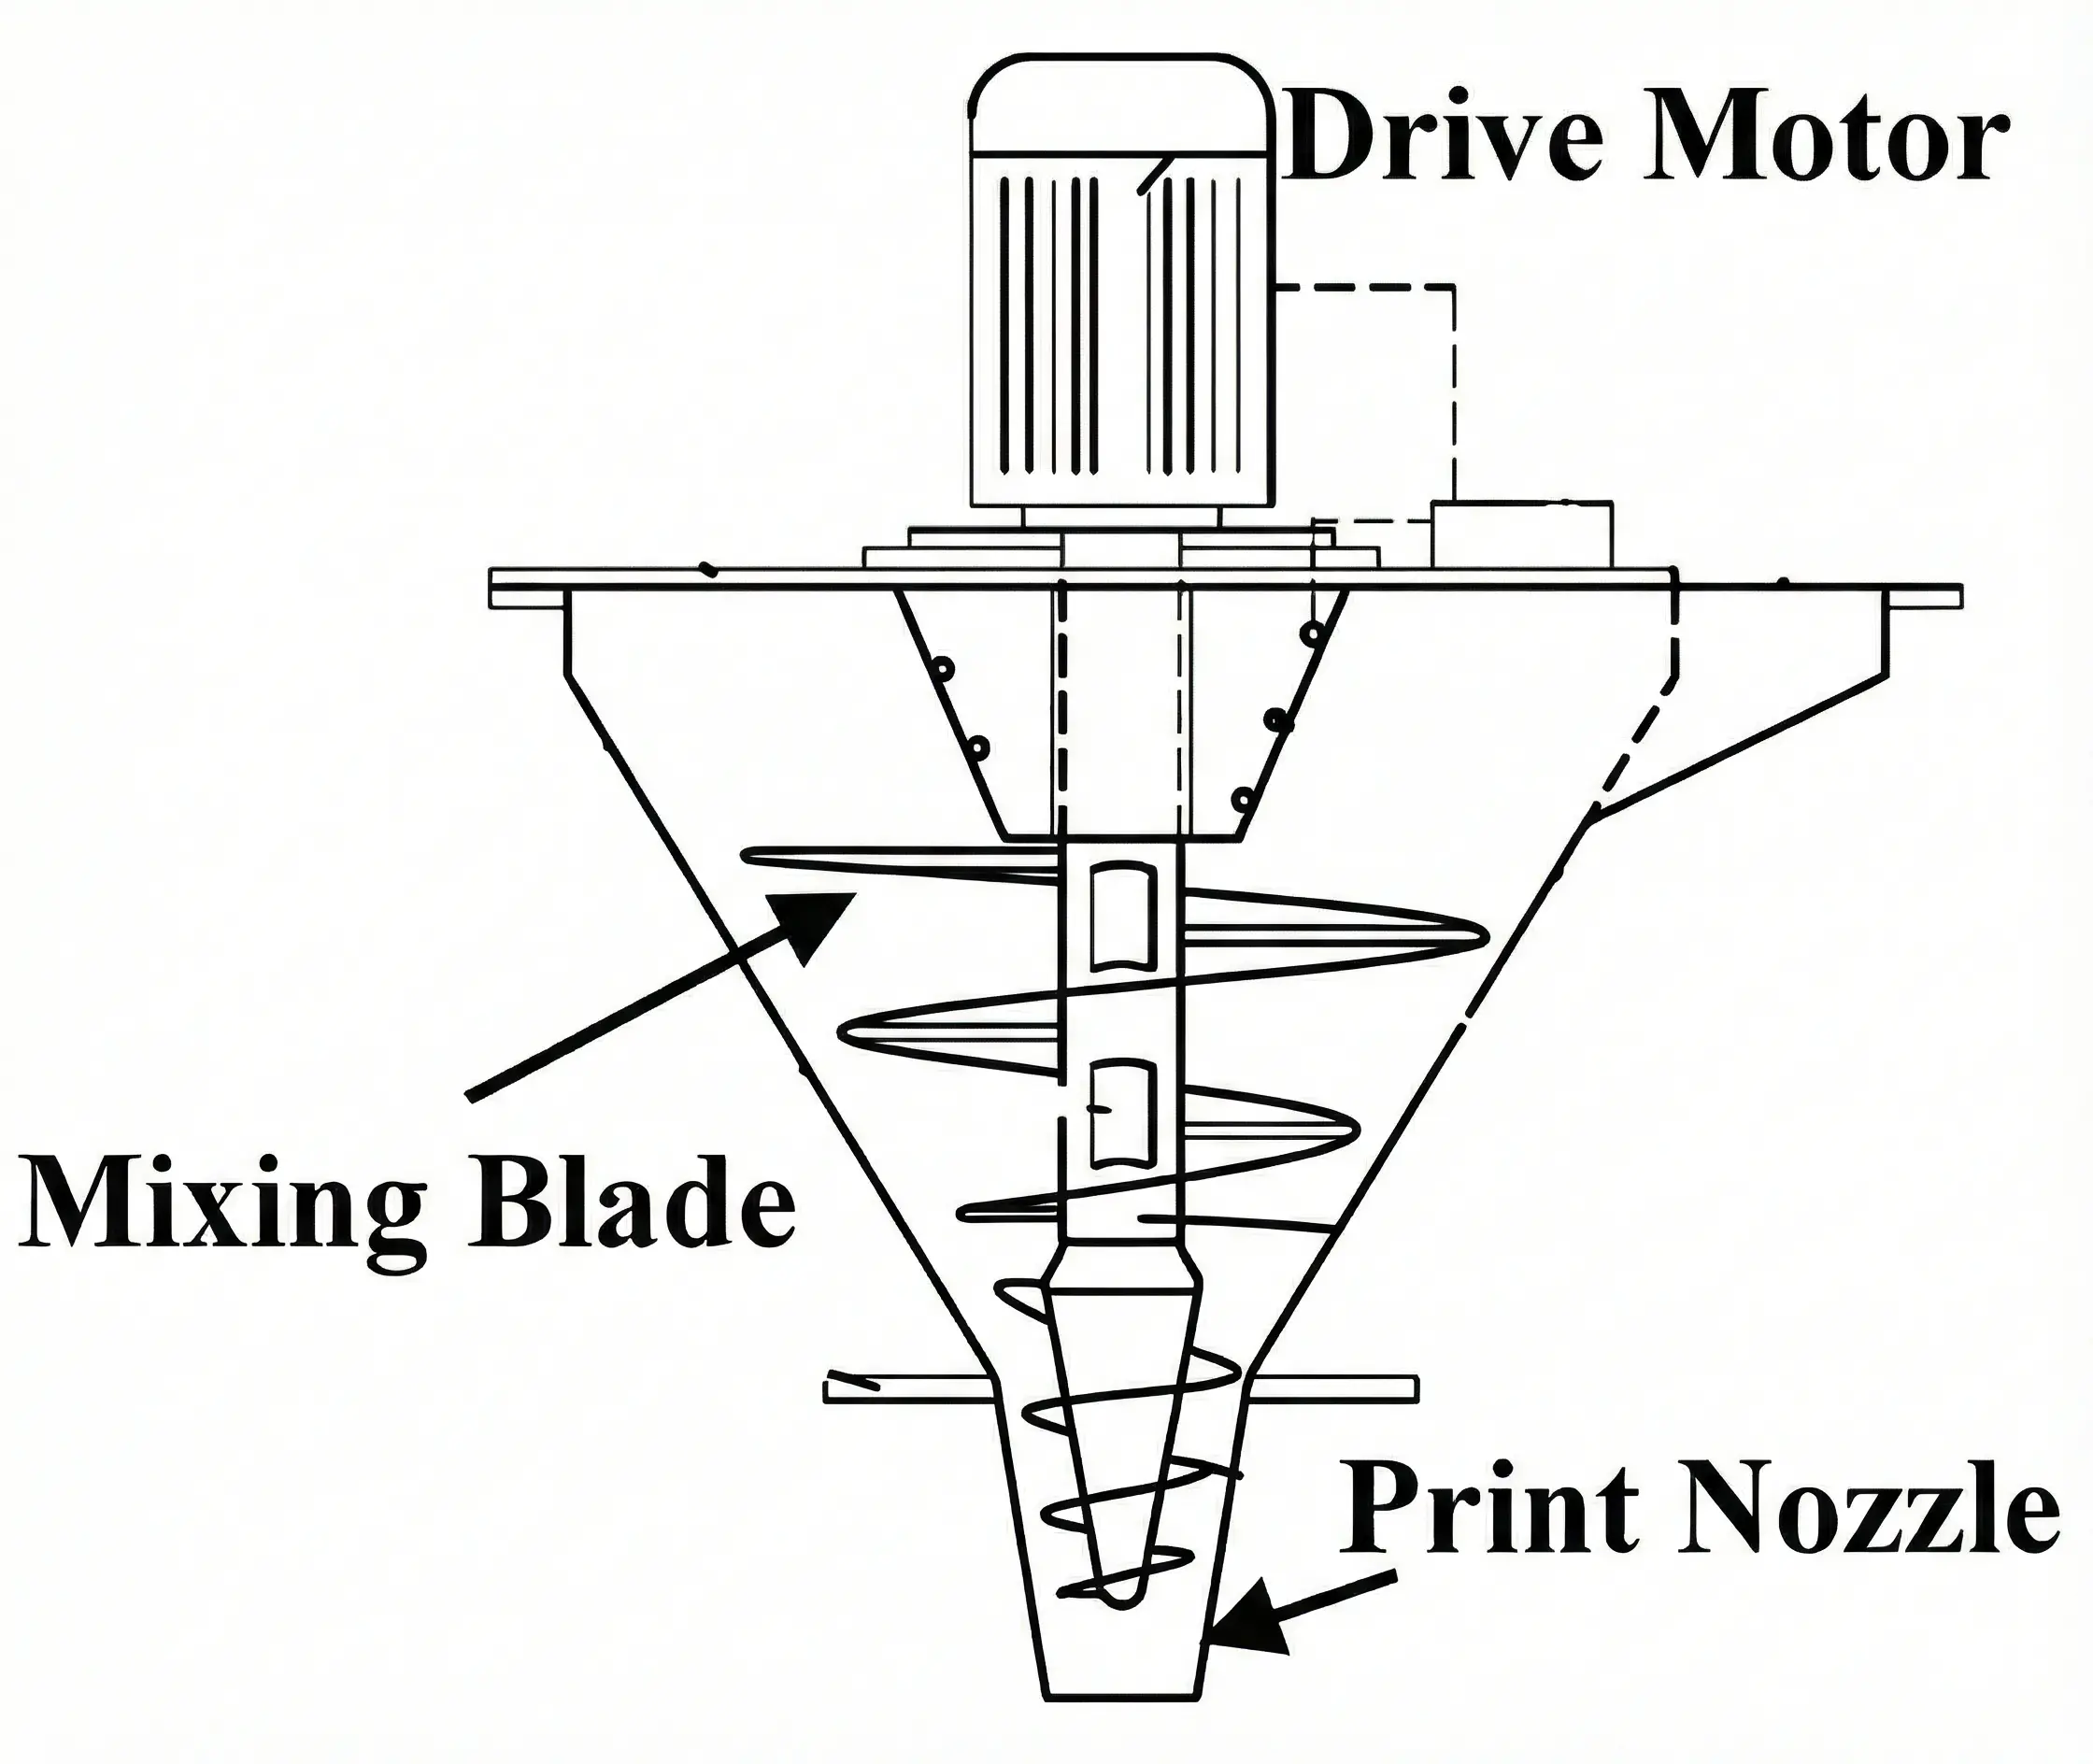
A gantry-style concrete 3D printing system (Figure 7) was employed in this study. The system primarily comprises three modules: a numerical control execution module, a servo drive module, and a material supply module. The main steel gantry structure measures 2.45 m (length) × 1.25 m (width) × 2.80 m (height), providing an effective working area of 1,600 mm × 1,600 mm on the printing platform. Material extrusion is achieved via a screw extrusion mechanism. As shown in Figure 8, the hopper is equipped with internal conical mixing blades. Driven by an electric motor, these blades rotate to propel the concrete toward the nozzle. The motion system utilizes conveyor belts to drive the hopper and nozzle assembly, enabling synchronized movement along the X, Y, and Z axes for layer-by-layer deposition. Considering the characteristics of 3DPMSC, a circular nozzle with a diameter of 20 mm was selected
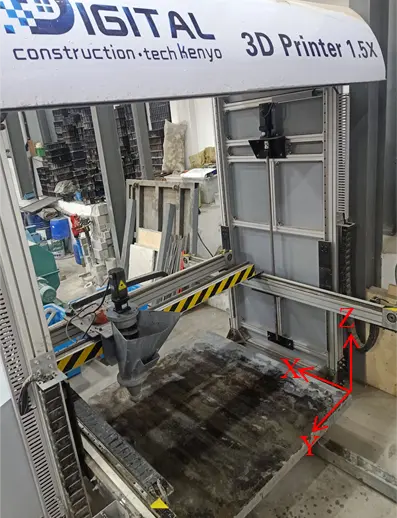
Preliminary trials have demonstrated that, with the employed 3D printing system, 3DPMSC exhibits optimal printability when the flowability falls within the range of 185-190 mm. Within this range, the material ensures smooth extrusion without blockage while maintaining sufficient shape retention under its own weight with minimal deformation. For the fabrication of mechanical test specimens, filaments with dimensions of 1,000 (length) ×120 (width) × (110-120) (height) mm were printed by stacking three layers. Subsequently, cubic specimens (100 × 100 × 100 mm) and prismatic specimens (100 × 100 × 400 mm) were saw-cut from the printed filaments. The cutting process was performed one day prior to the designated testing age to ensure dimensional precision.
3.3.3 Mechanical property testing
The compressive strength and flexural strength were evaluated in accordance with the Chinese National Standard GB/T 50081
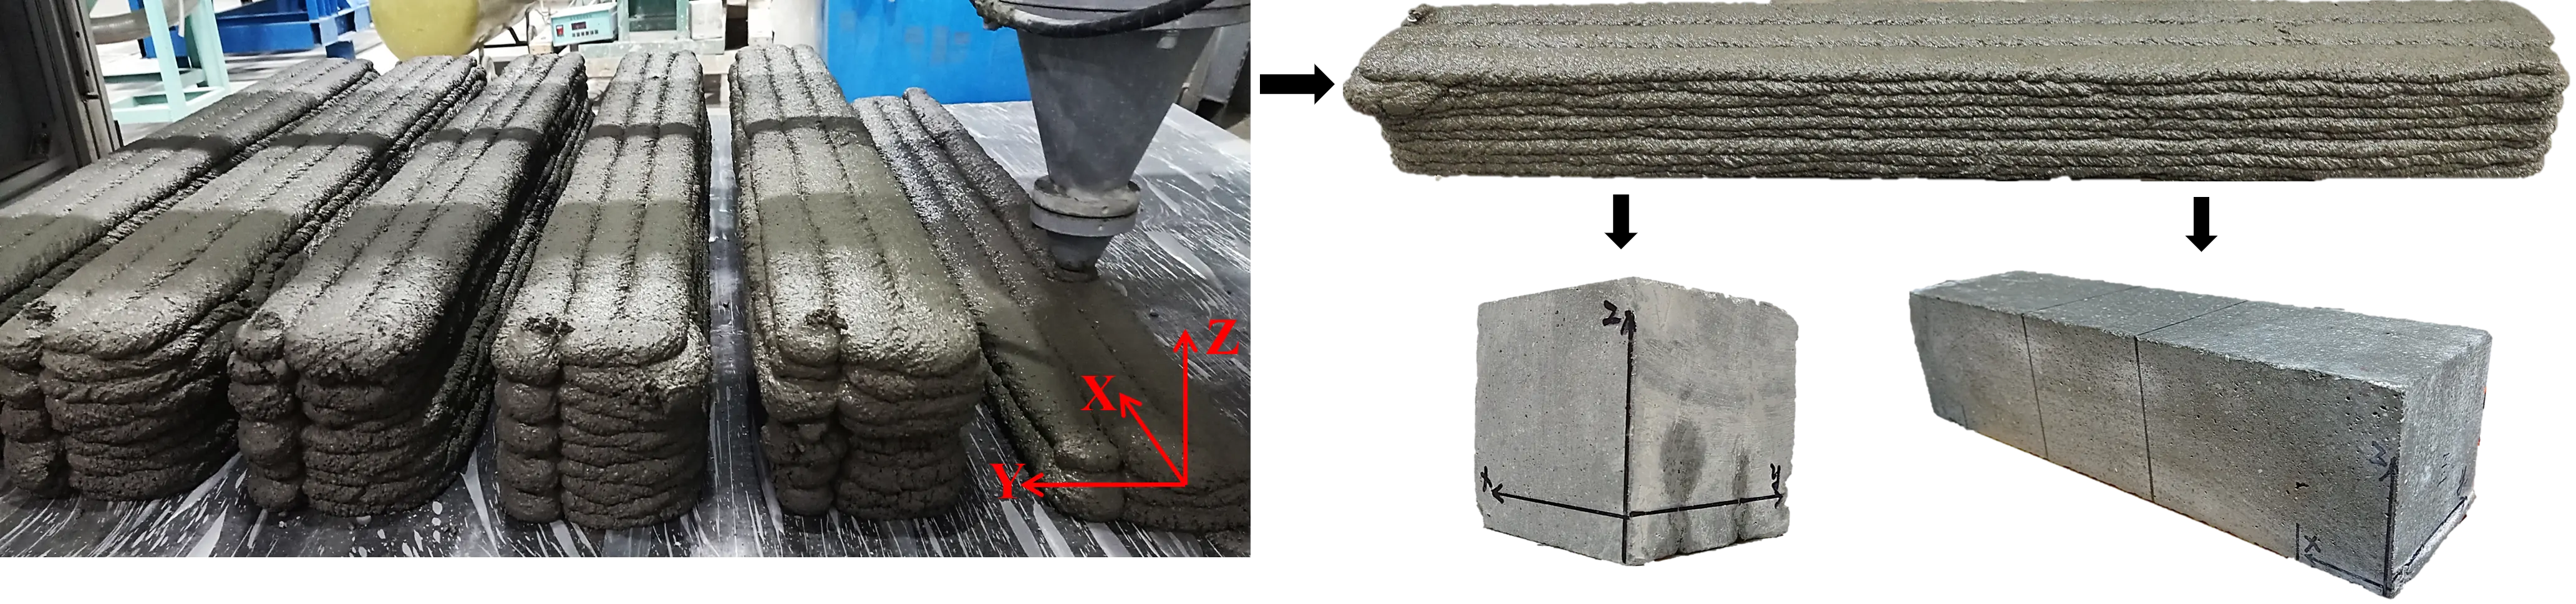
Figure 10. The size of test specimen (mm): Compression test piece and bending test piece.
Additionally, mold-cast specimens of identical dimensions were prepared as a reference group for comparison. To ensure comparable densification, the cast specimens were consolidated on a vibrating table for 60 seconds. Subsequently, both the printed and cast specimens were cured in a standard curing room at 20 ± 2 °C and > 95% relative humidity until the testing age, strictly adhering to GB/T 50081 standards to eliminate strength deviations caused by environmental factors.
4. Results and Discussion
4.1 Effect of binder-to-sand ratio on rheological properties of 3DPMSC (After secondary mixing)
Figure 11 illustrates the time-dependent evolution of shear stress under a constant low shear rate, where the peak value represents the static yield stress. A distinct positive correlation was observed between MS content and static yield stress. The reference group, T-0, exhibited the lowest yield stress of 341.83 Pa. As the MS replacement level increased, the peak stress rose significantly, with the T-3 group ultimately reaching 924.34 Pa, approximately 2.7 times that of the T-0 group. This substantial enhancement is attributed to the mechanical interlocking effect of the angular tuff sand particles. Unlike river sand, the irregular shapes and rough surfaces of MS particles increase the internal friction angle, forming a rigid granular skeleton that resists the onset of flow. From the perspective of printability, the high static yield stress of T-3 is highly favorable for supporting the self-weight of deposited layers and preventing plastic collapse immediately after extrusion.
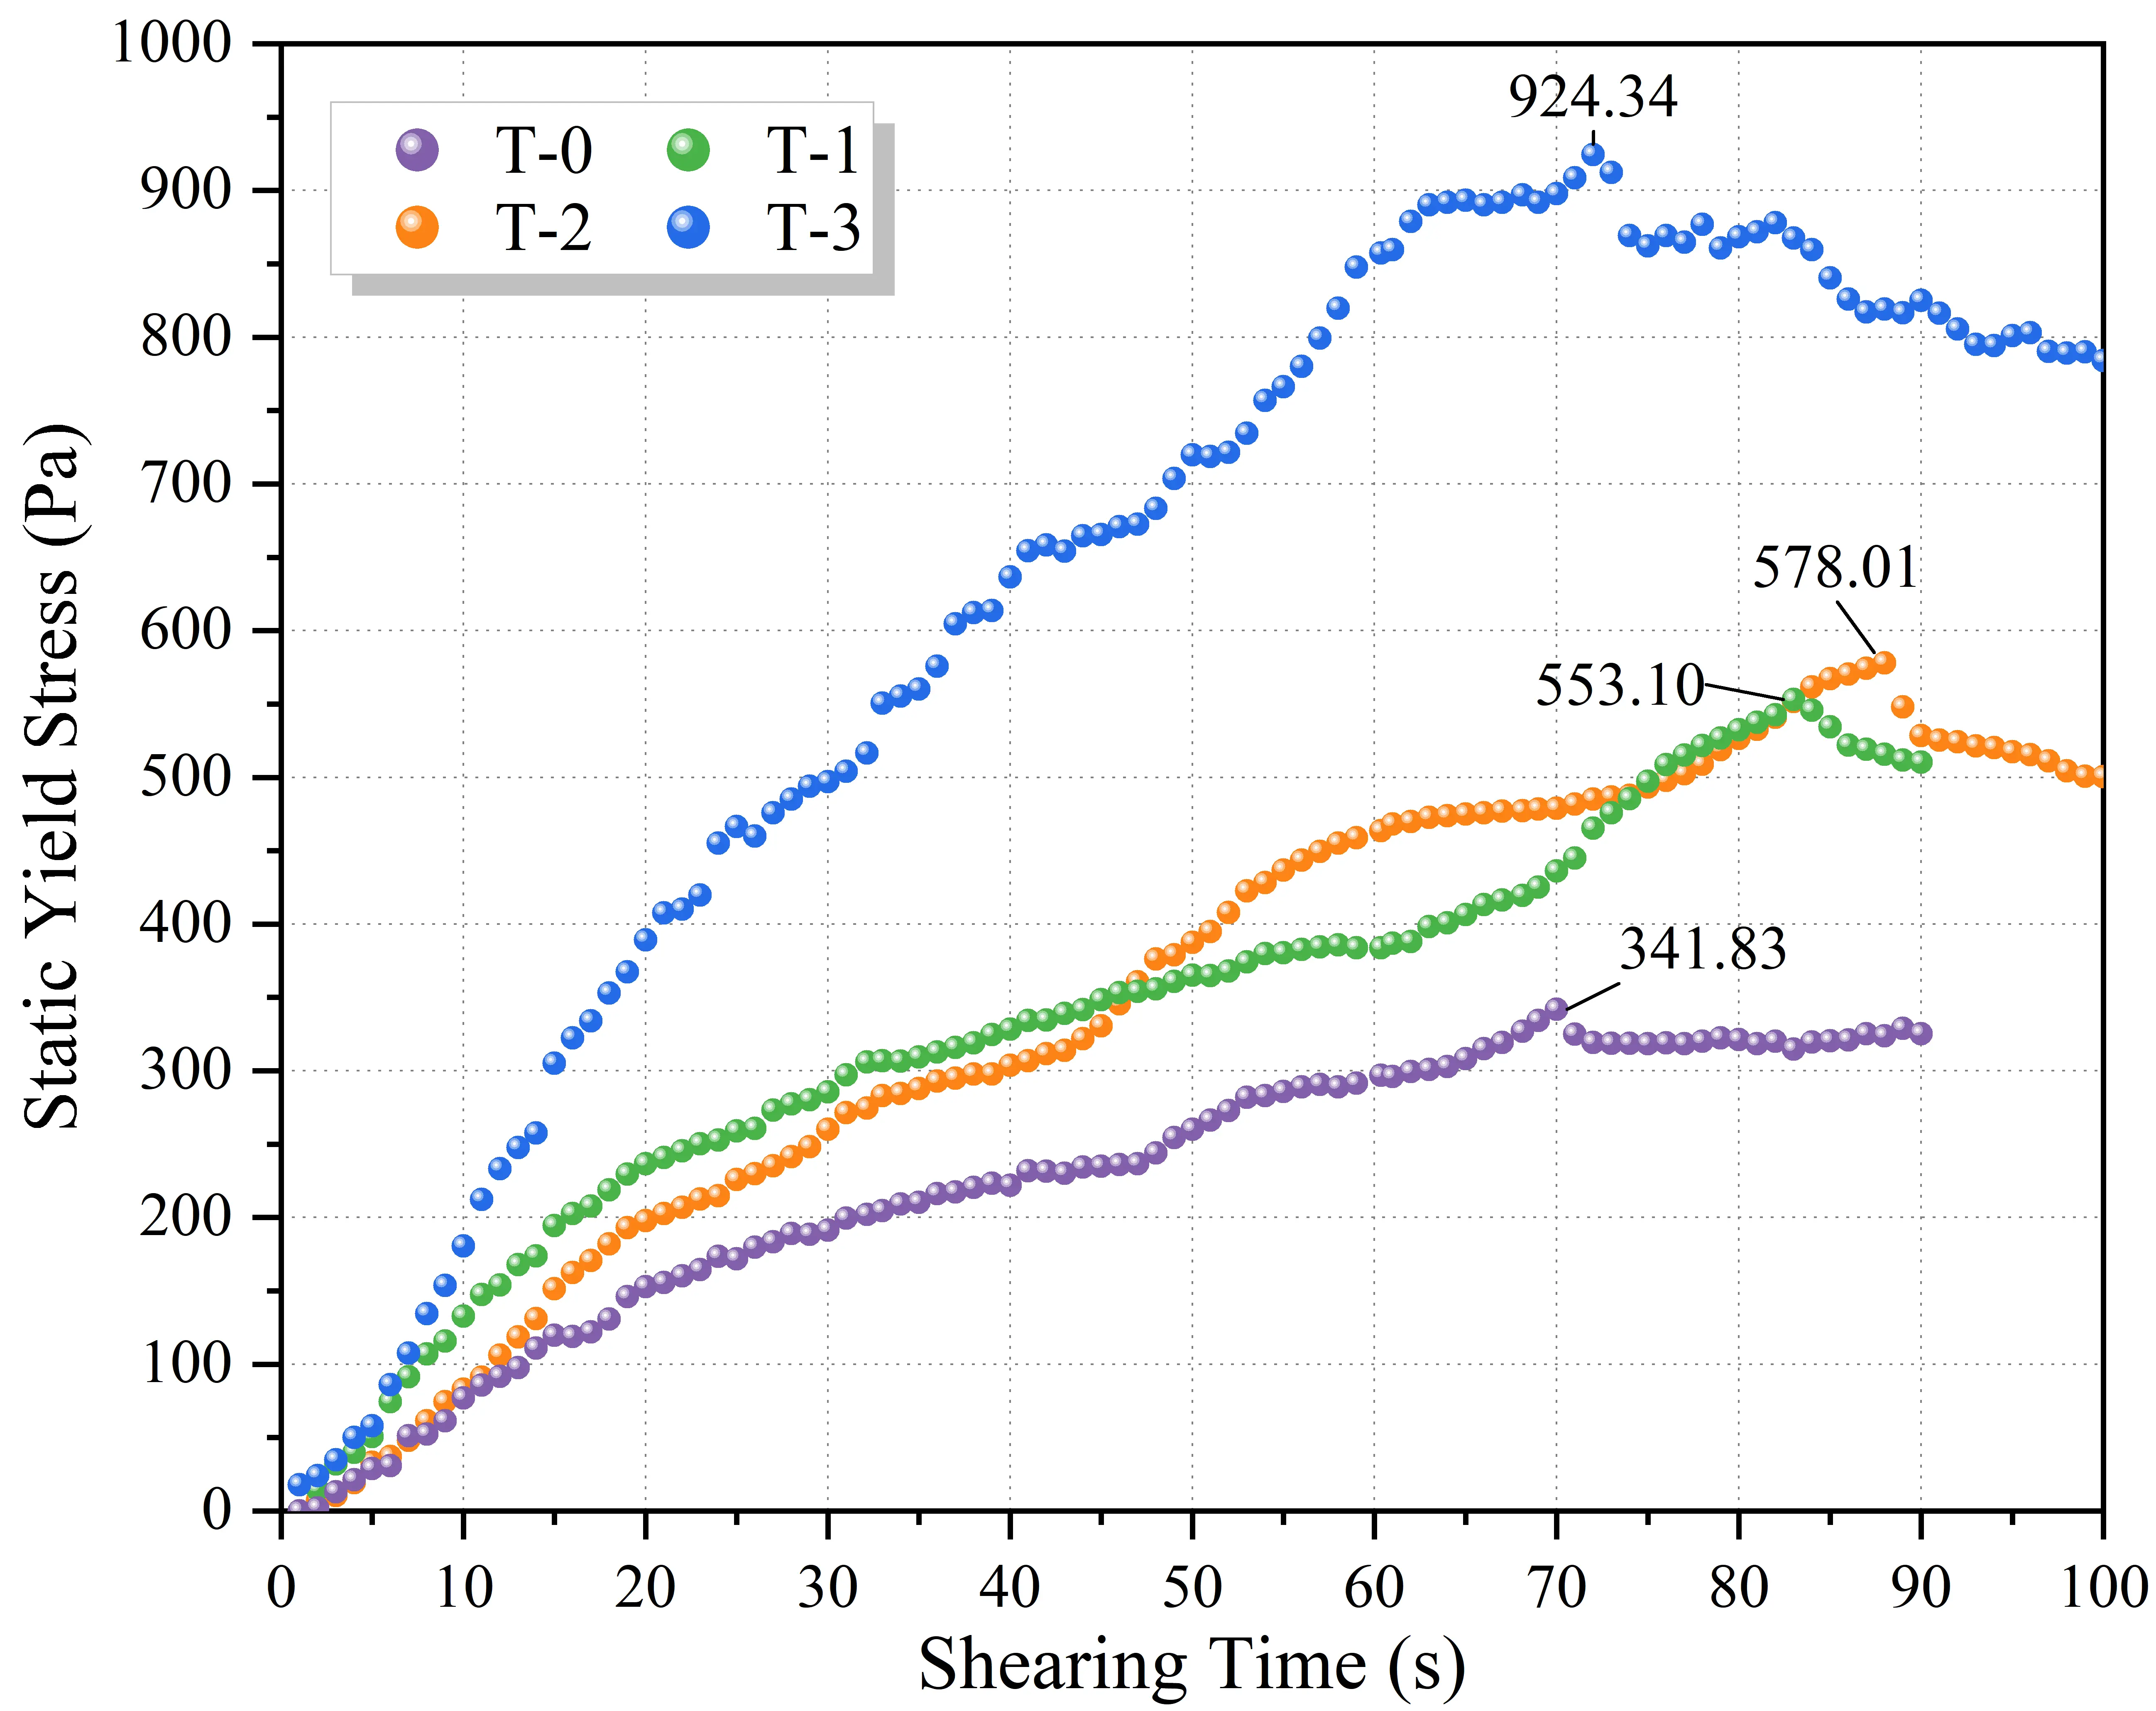
The thixotropic behavior of 3DPMSC was quantified via the hysteresis loop area (S) presented in Figure 12, which exhibited a declining trend with increasing MS content. The T-0 group displayed the largest hysteresis loop (ST-0 = 4,766.42 Pa/s), indicating the strongest capacity for structural rebuilding following shear failure. However, this value significantly decreased to 1,920.67 Pa/s in the T-3 group, representing a reduction of approximately 59.7%. Mechanistically, thixotropy in cementitious materials originates from the reversible breakdown and rebuilding of flocculation structures (colloidal interactions) within the paste. To quantify the geometric constraints on this behavior, the Paste Volume Fraction (Vpaste) was calculated based on the mix proportions and aggregate density. As the binder-to-sand ratio decreased from 1:1.0 (T-0) to 1:1.3 (T-3), Vpaste declined from 68.2% to 64.2%. This 4.0% reduction in the suspending medium volume has a magnified impact on the rheology. A lower Vpast implies a reduced density of colloidal C-S-H bridges per unit volume, directly limiting the total energy that can be stored and dissipated during the structural rebuilding process. Furthermore, the increased volume fraction of rigid MS particles (Vagg = 35.8% for T-3) acts as inert inclusions that physically obstruct the rapid reconnection of the flocculation network, resulting in the observed 59.7% reduction in the hysteresis loop area. Therefore, the loss of thixotropy is governed by the dual effect of reduced colloidal paste volume and the geometric crowding of angular aggregates. Despite the reduced thixotropy, the significantly elevated static yield stress of the T-3 group is sufficient to compensate, ensuring adequate shape retention of 3DPMSC immediately upon extrusion.
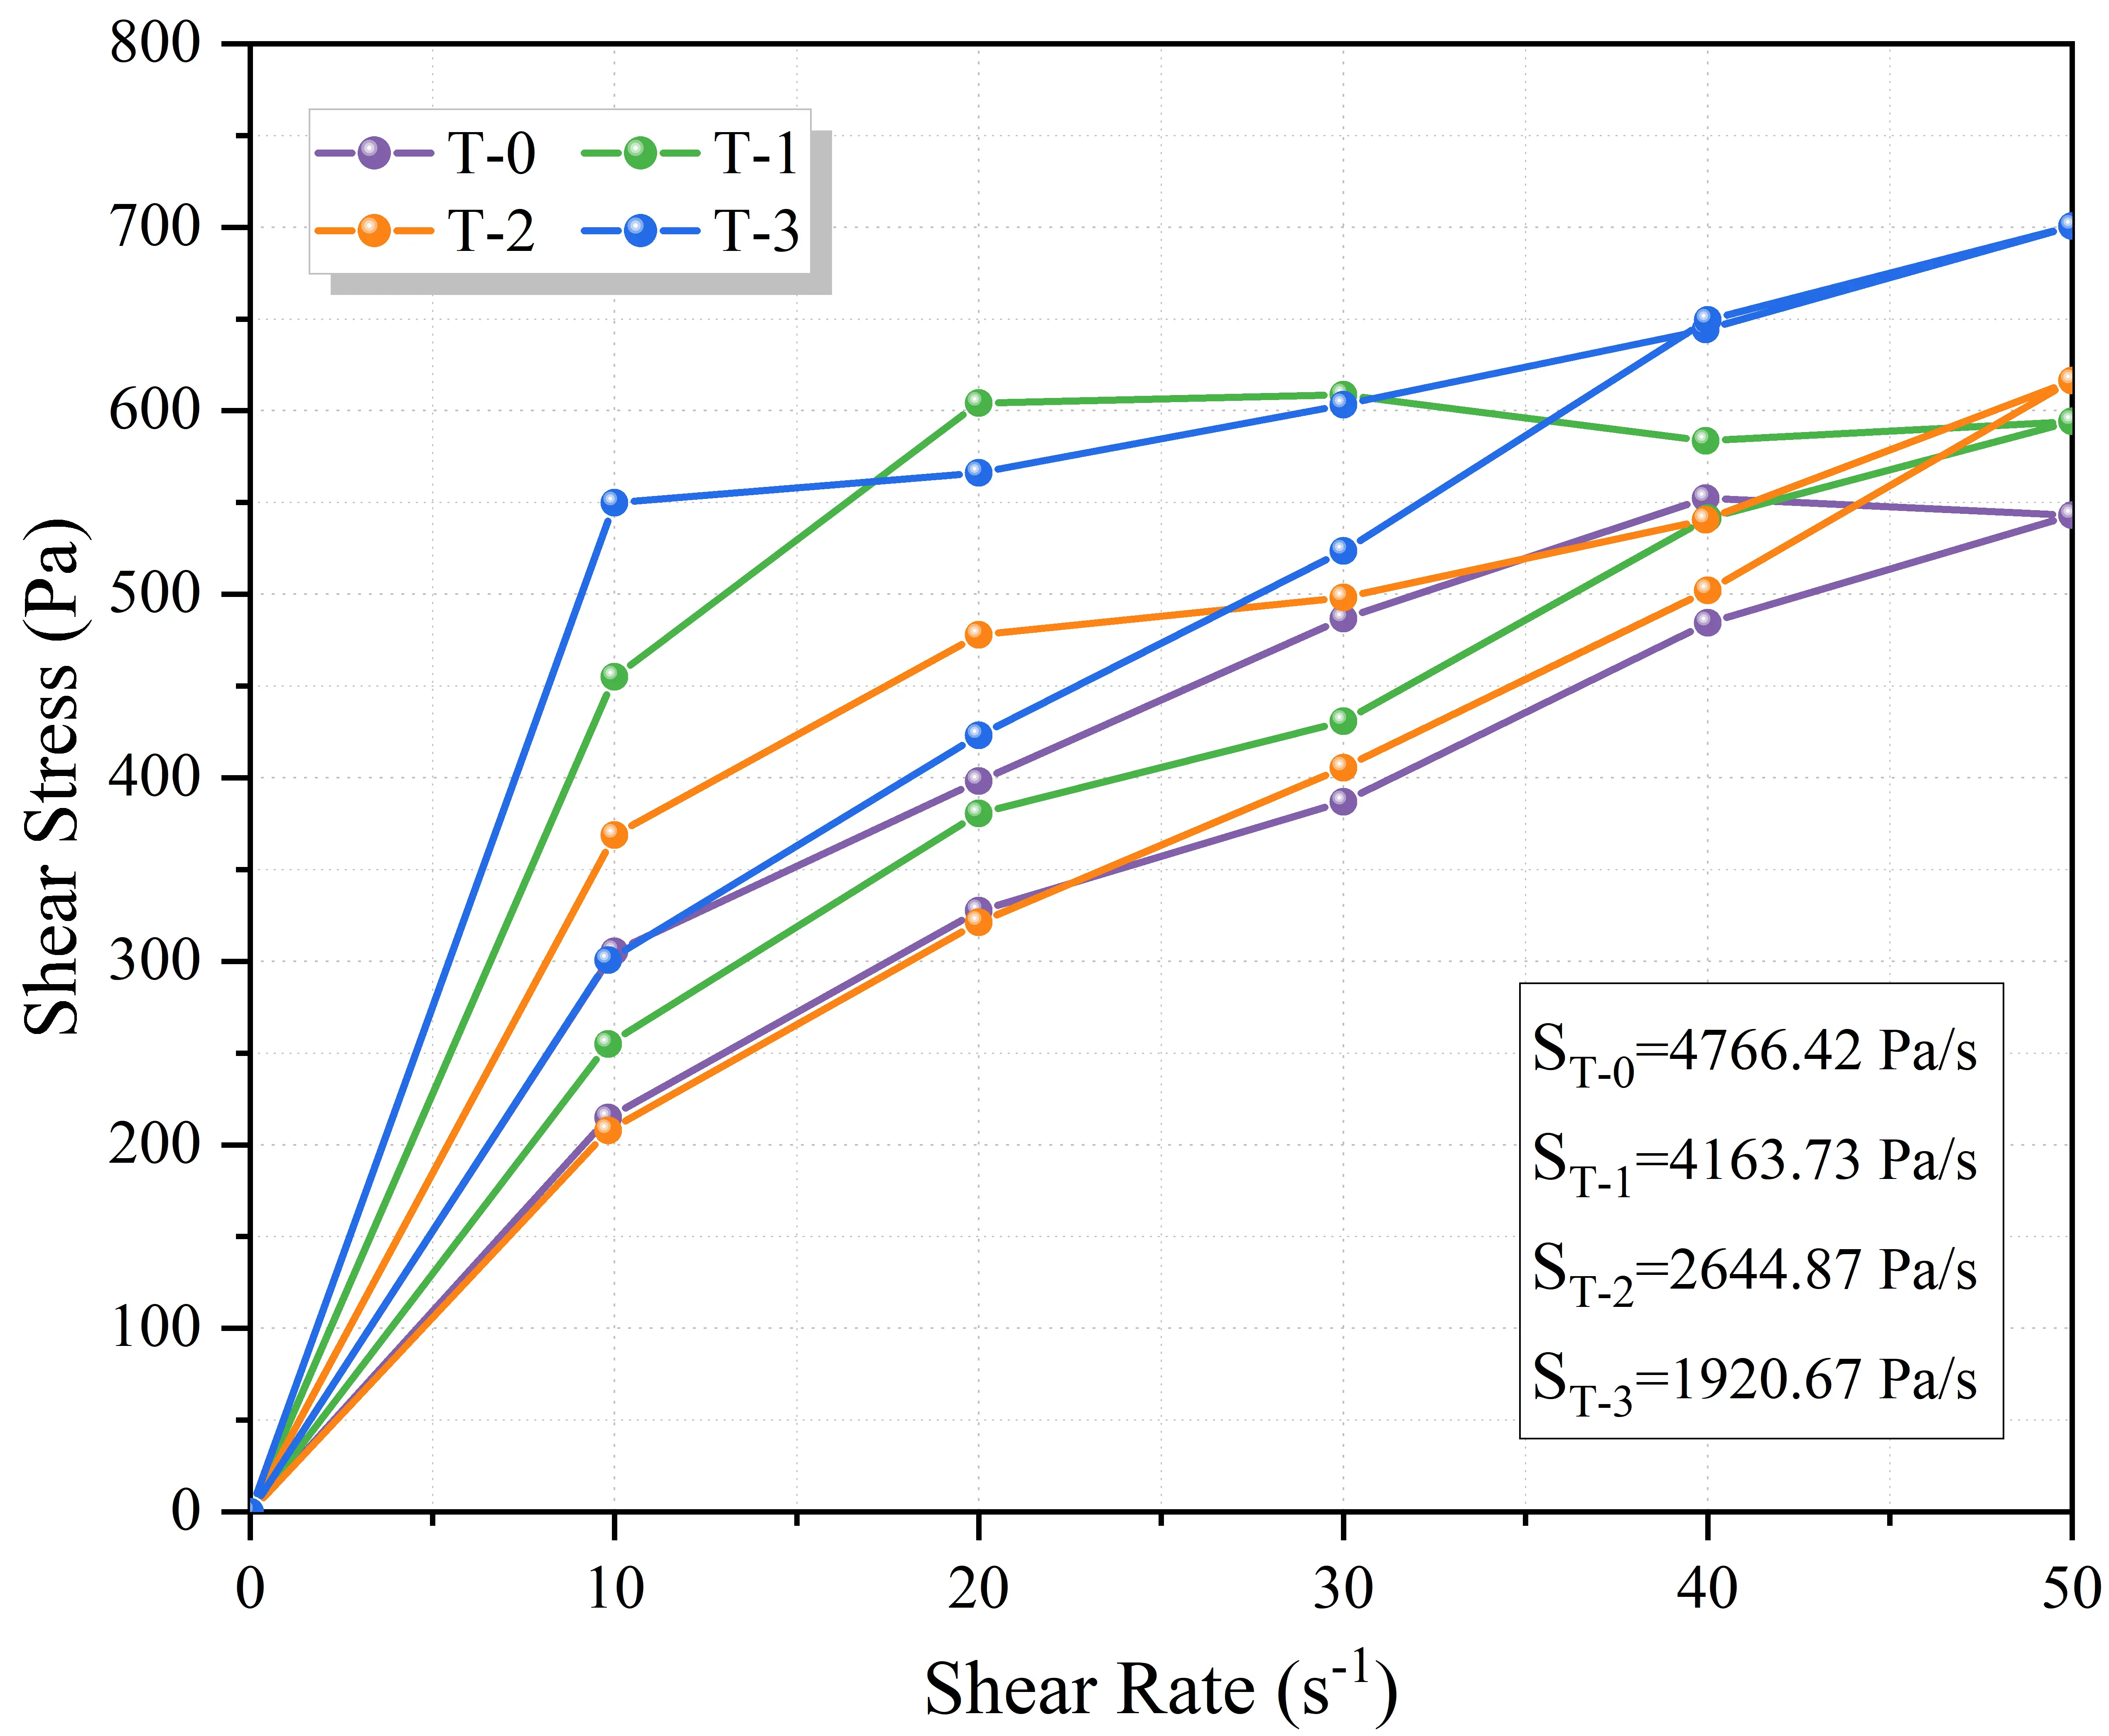
To evaluate the pumpability of the mixtures, the shear stress versus shear rate curves were fitted using the H-B model, as illustrated in Figure 13 and Table 5. All mixtures exhibited high correlation coefficients (R2 = 0.999) and flow indices (n) generally below 1.0, confirming typical shear-thinning (pseudoplastic) behavior, which facilitates smooth extrusion at high shear rates. Notably, despite the substantial increase in solid aggregate fraction, the plastic viscosity (η) for all groups remained stable within a narrow range of 11.30 to 12.15 Pa·s. This counterintuitive phenomenon underscores the effectiveness of the secondary mixing strategy. The addition of PCE in the second stage effectively dispersed cement particles via steric hindrance, releasing free water initially entrapped within the flocculation structures. This lubricating effect successfully counteracted the increased frictional resistance induced by the higher sand content. From an engineering perspective, such rheological stability implies that the utilization of MS can be maximized to enhance cost-effectiveness without necessitating significant adjustments to pumping pressure, thereby ensuring the consistency of the printing process.
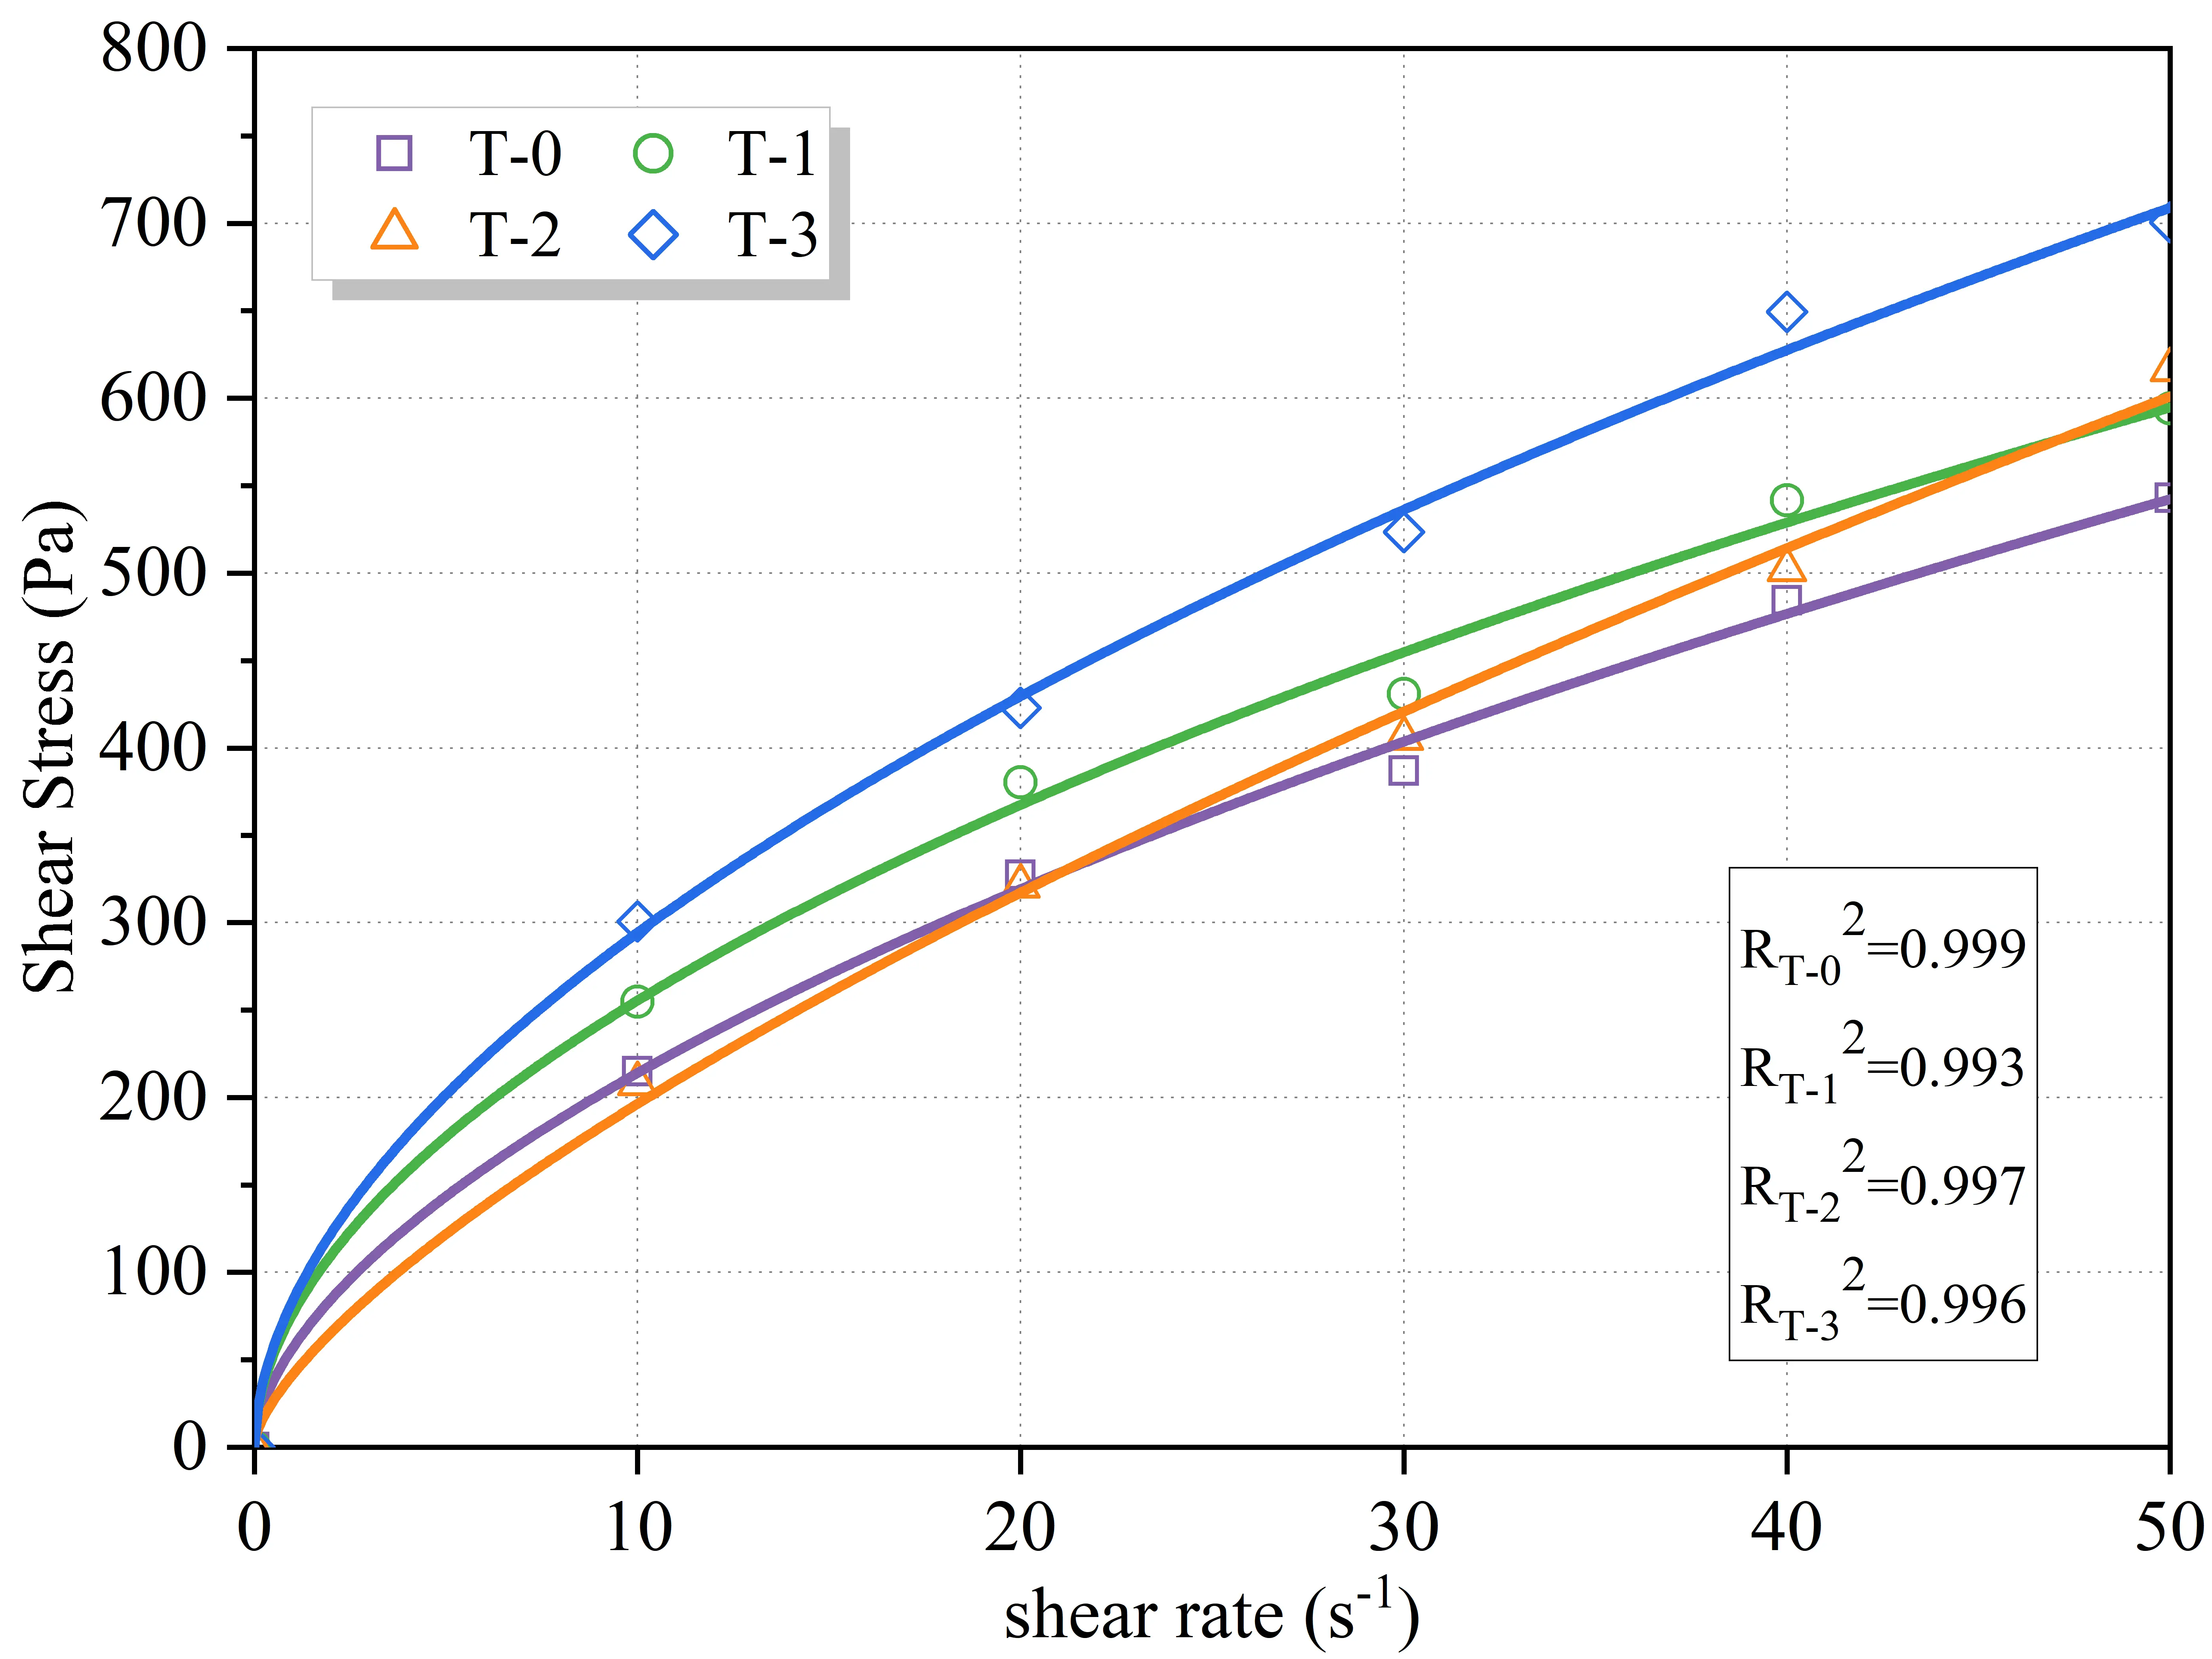
Table 5. Fitting results of the H-B rheological model.
| Group | Fitting Function | Plastic Viscosity η/(Pa·s) |
| T-0 | τ = 67.35 + 28.27 × ẏ0.73 | 11.30 |
| T-1 | τ = 94.03 + 32.57 × ẏ0.71 | 12.15 |
| T-2 | τ = 58.45 + 25.29 × ẏ0.77 | 11.91 |
| T-3 | τ= 190.95 + 10.78 × ẏ1.01 | 11.32 |
H-B: Herschel-Bulkley.
4.2 Effect of secondary mixing on rheological properties
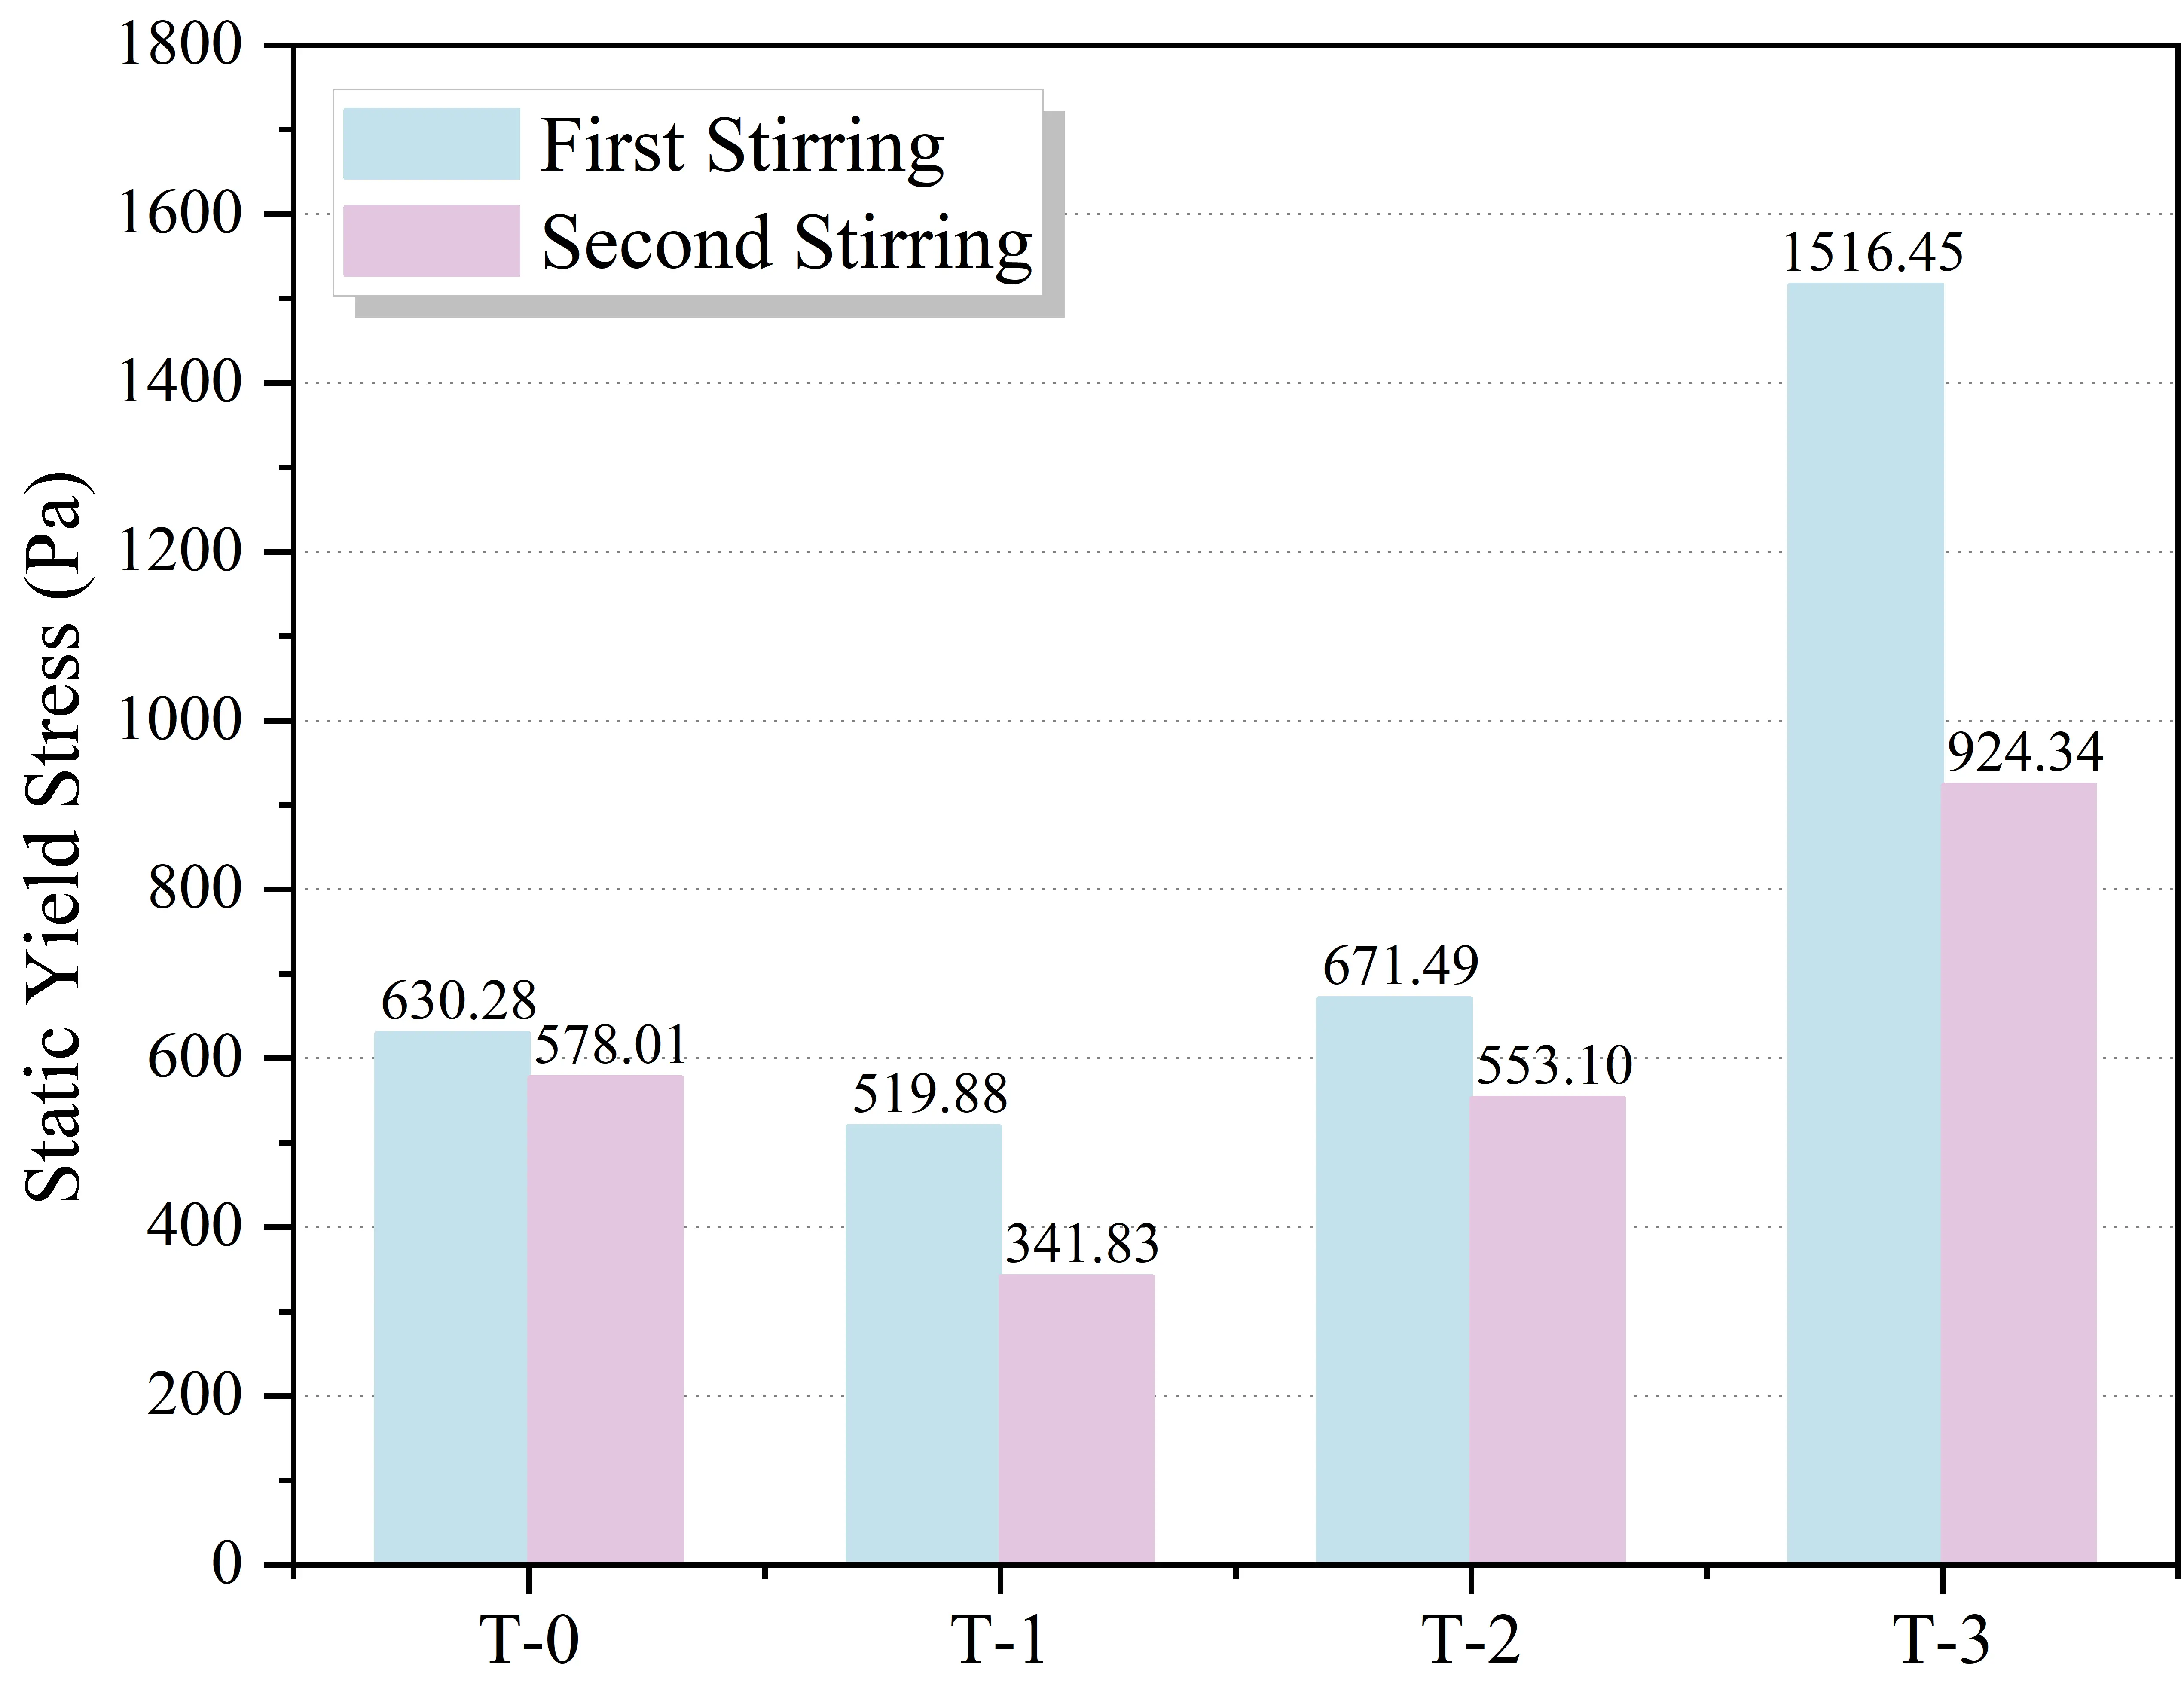
Figure 14 illustrates the evolution of static yield stress before and after the secondary mixing process. A universal reduction in yield stress was observed across all mixtures, indicating a significant replasticization effect. This phenomenon is particularly critical for the high-sand mixture, T-3. Initially, the T-3 group exhibited an excessively high yield stress of 1,516.45 Pa, posing severe risks of pumping blockage and discontinuous extrusion. However, following secondary mixing, the yield stress decreased by approximately 39% to 924.34 Pa. This reduction mechanism can be attributed to the breakdown of early flocculation structures and the optimization of PCE adsorption kinetics. During the initial mixing and resting period, the rapid hydration of C3A consumes a significant amount of water to form ettringite. In conventional mixing, PCE molecules added at this stage are prone to being intercalated within these rapidly growing organo-mineral phases, rendering them ineffective for dispersion. By employing the delayed addition strategy, PCE is introduced after the initial formation of the hydrate shell. This ensures that the polymer side chains adsorb onto the surface of the hydrates rather than being engulfed, thereby maximizing the steric hindrance effect and effectively thickening the IWF around the particles. Unlike river sand, the high angularity of MS creates a rigid granular skeleton that forms physical “cages”, entrapping free water within the voids of clustered particles. The secondary high-shear mixing provides sufficient energy to mechanically dismantle these interlocking cages and the flocculated structures formed by microfines. This process liberates the physically entrapped water, transforming it from a “bound” state back into a continuous liquid phase, which significantly lubricates the mixture without altering the actual water-to-binder ratio. Effectively, secondary mixing resets the rheological state, transforming the stiff, unworkable material back into a pumpable paste while maintaining a sufficient yield stress (≈900 Pa) to ensure shape retention immediately after extrusion.
The thixotropic loop area, representing the energy dissipated to break down the internal microstructure, is presented in Figure 15. In alignment with the yield stress results, secondary mixing induced a significant contraction in the loop area for all groups. Specifically, the reference group T-0 decreased from 9,218.94 Pa/s to 4,766.42 Pa/s, while the T-3 group dropped from 3,217.18 Pa/s to
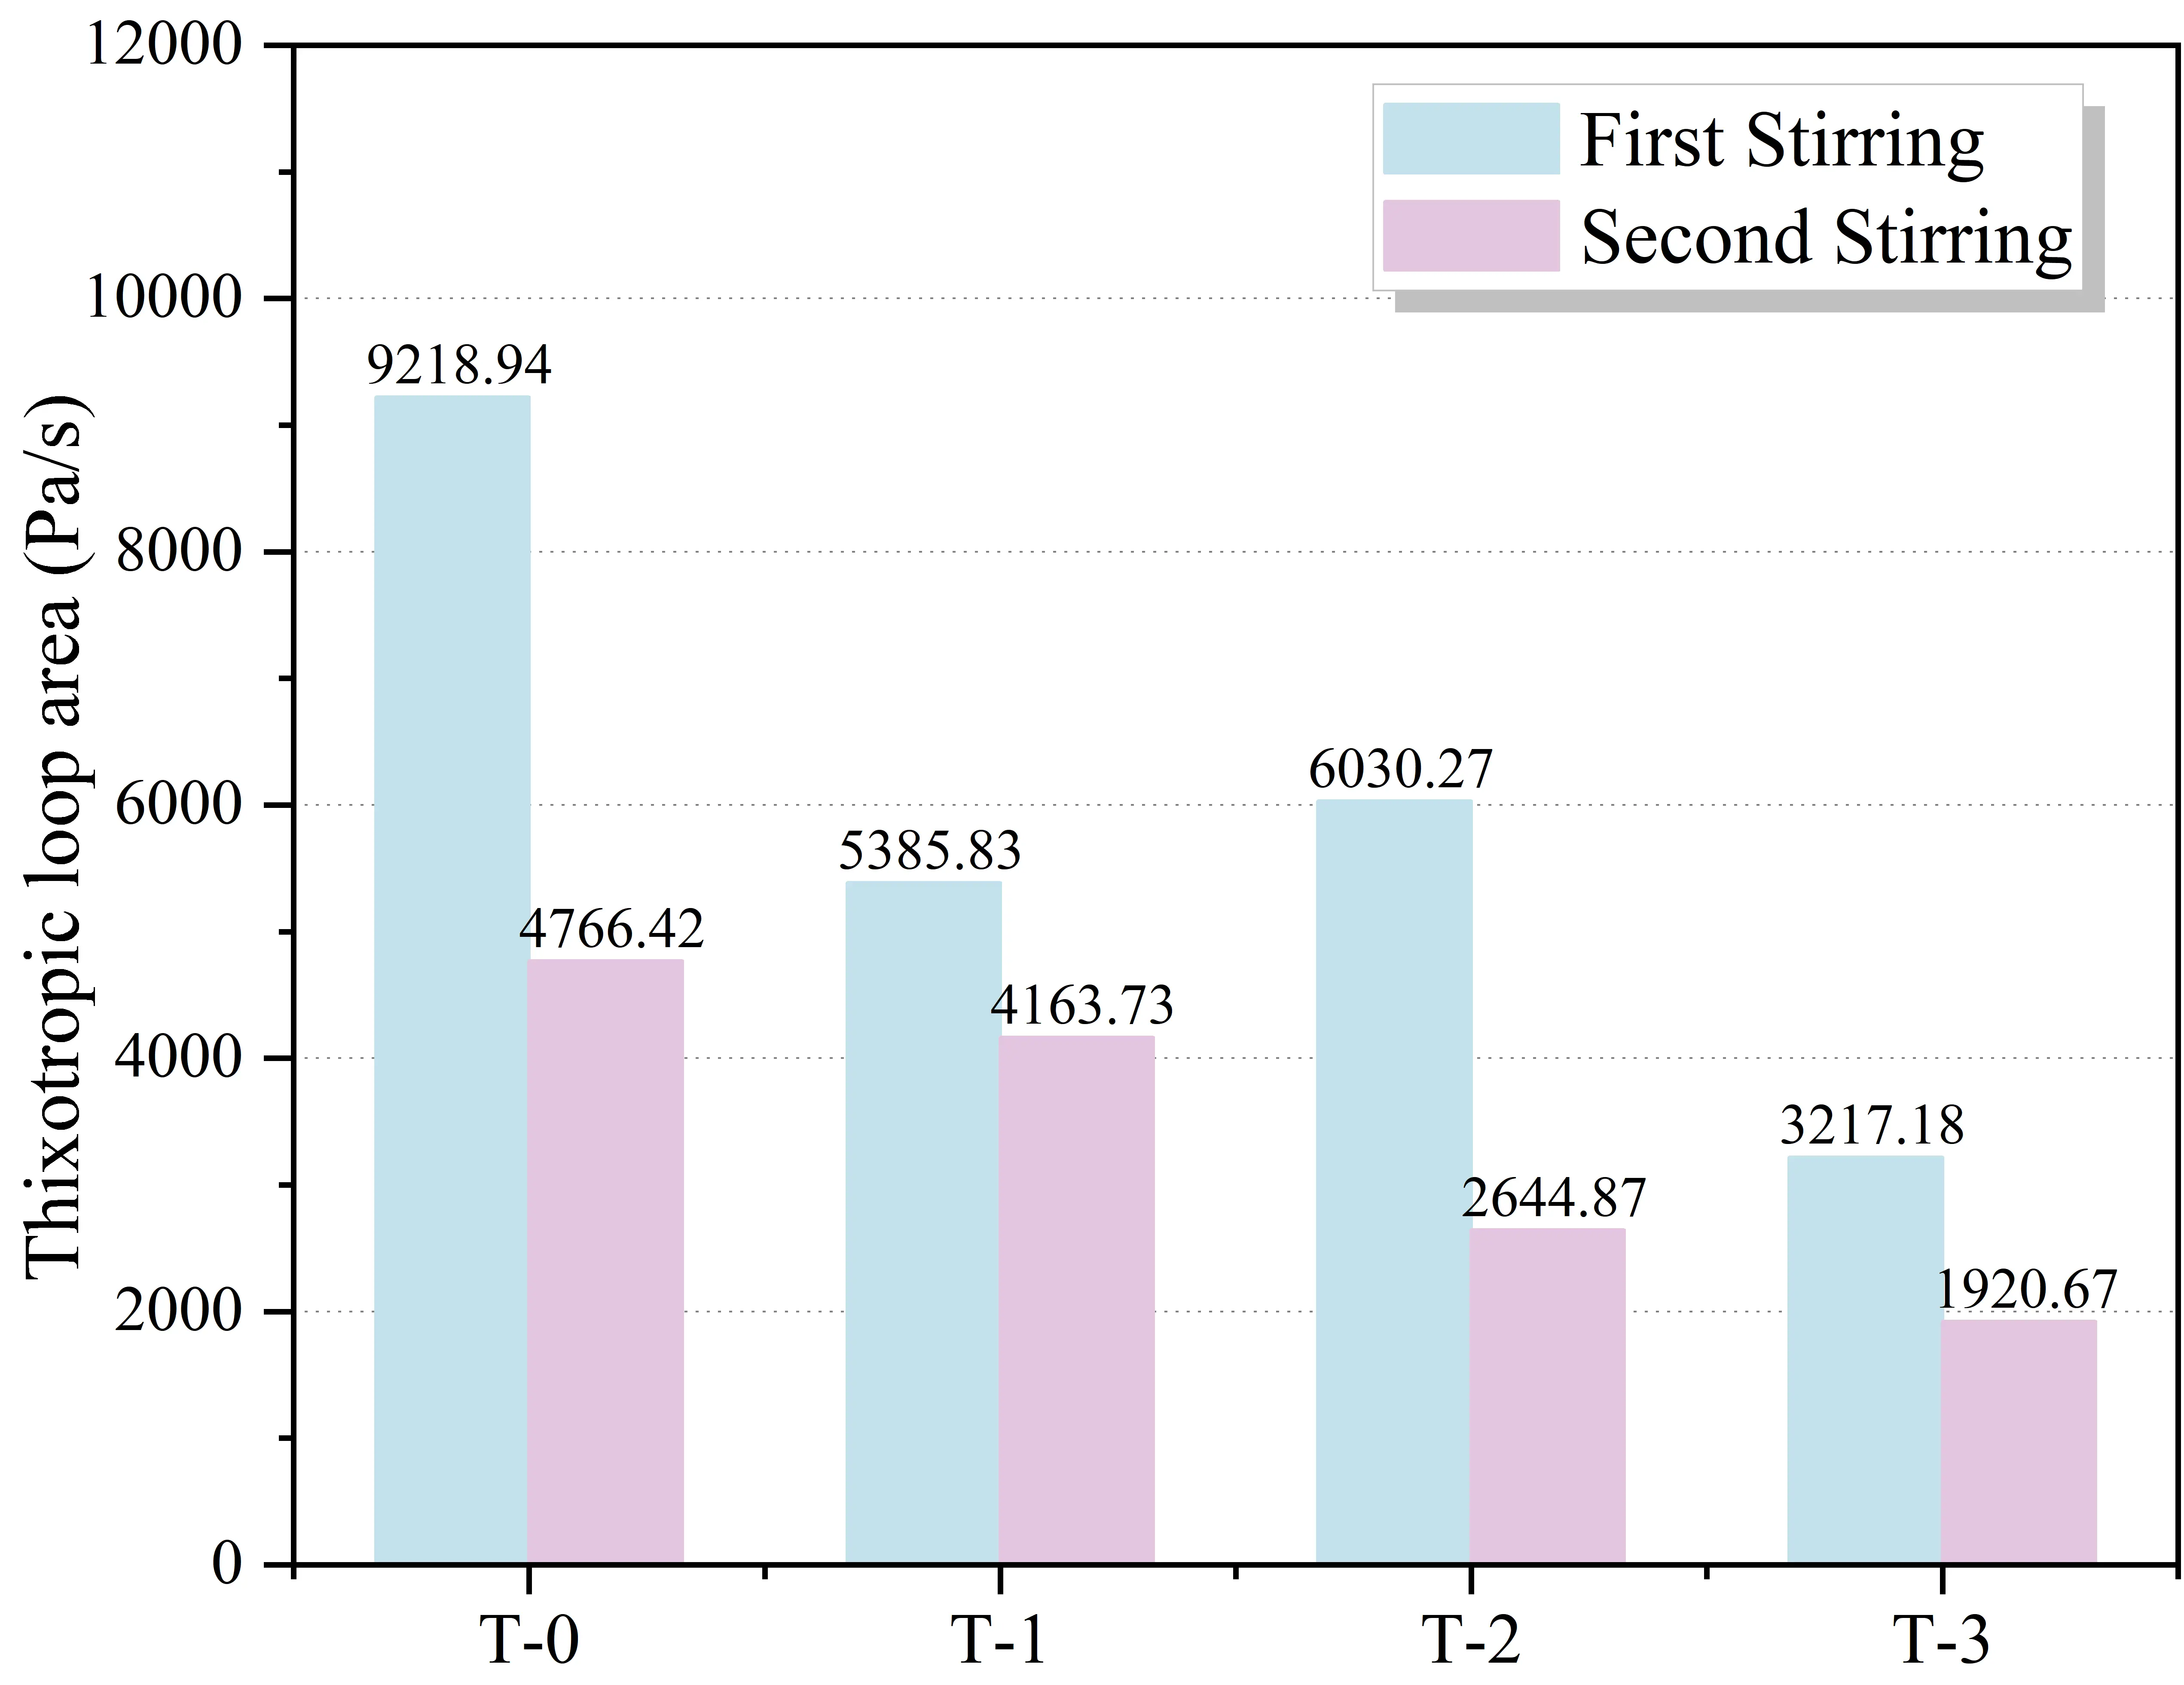
Collectively, the data in Figure 14 and Figure 15 validate the necessity of the secondary mixing protocol, especially for mixtures with high MS content. Although increasing the sand ratio (from T-0 to T-3) inherently increases material rigidity, secondary mixing provides a controllable rheological window. It enables the utilization of stiff mix designs (T-3) to achieve superior buildability by temporarily lowering viscosity during the pumping stage. Once deposited, the thixotropic nature of the material ensures a rapid recovery of yield stress, thus successfully reconciling the inherent conflict between pumpability and buildability.
4.3 Effect of resting time on rheological properties of 3DPMSC
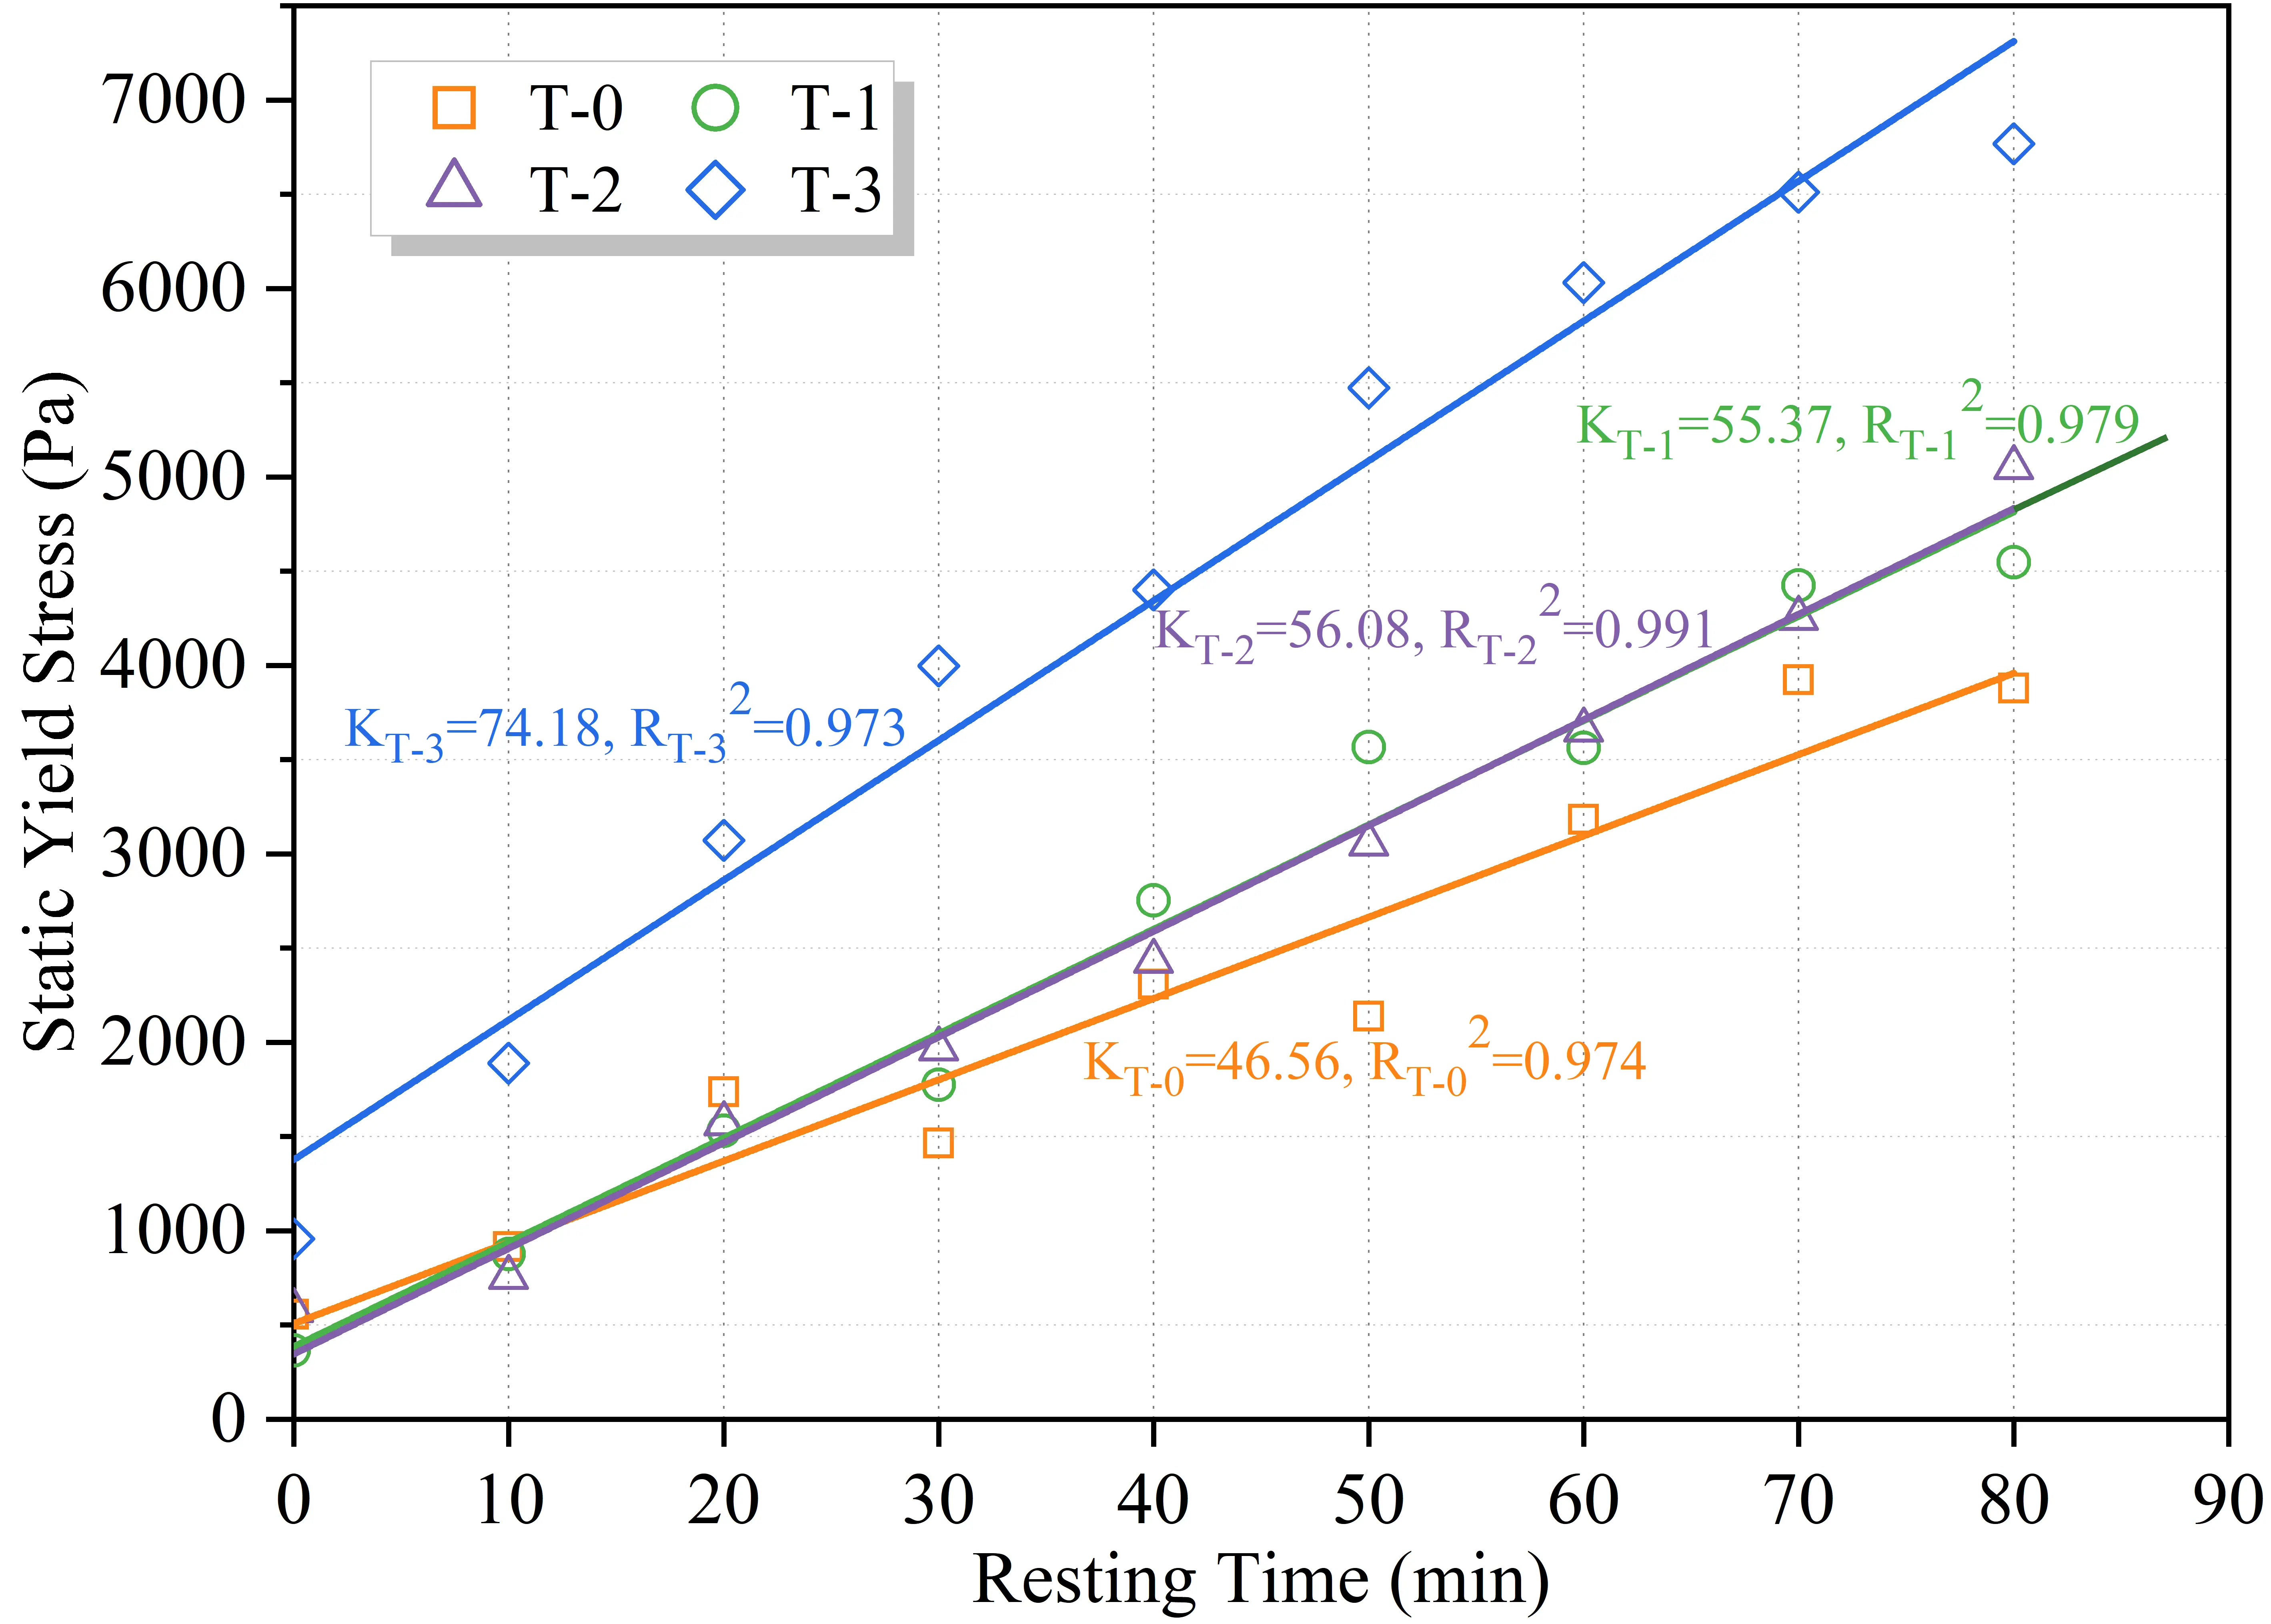
Figure 16 quantitatively characterizes the structural build-up of 3DPMSC over a resting period of 0 to 80 minutes. A linear increase in static yield stress was observed for all mixtures, indicating a continuous stiffening process driven by colloidal flocculation and early hydration. Defining the rate of this structural evolution as the structural build-up rate (Astruct), represented by the slope (K) of the fitted lines, a distinct positive correlation exists between MS content and Astruct. The T-3 group exhibited the highest build-up rate, with a slope of KT-3 = 74.18 Pa/min, which is approximately 1.6 times that of the reference group T-0 (KT-0 = 46.56 Pa/min). This accelerated hardening in high-sand mixtures is attributed to the high specific surface area and angular geometry of the tuff sand, which increase inter-particle friction and provide abundant nucleation sites for hydration products[39,40]. From a printability standpoint, the rapid strength gain of the T-3 group is highly favorable for vertical buildability, ensuring that bottom layers can support the increasing weight of subsequent layers without plastic collapse. However, the excessive growth rate of T-3 implies potential limitations on the open time, necessitating continuous printing without prolonged interruptions to avoid pump blockage.
As illustrated in Figure 17, the thixotropic loop area of all groups decreased linearly with resting time, further confirming the strengthening of the internal microstructure. This phenomenon indicates a transition from a reversible thixotropic fluid to an irreversible rigid solid. With the extension of resting time, the consumption of free water and the formation of permanent C-S-H bridges diminish the material’s capacity to break down and flow under shear. This decay rate is pivotal for determining the open time of 3DPMSC. The T-3 group displayed the most rapid loss of thixotropy, characterized by a steep negative slope of KT-3 = -118.51. Notably, at 80 min, the loop area of T-3 approached zero, signaling a complete loss of extrudability. In contrast, the T-0 group maintained a slower decay rate (KT-0 = -26.81). This suggests that while the inclusion of MS enhances structural stability, it significantly narrows the effective printing window.
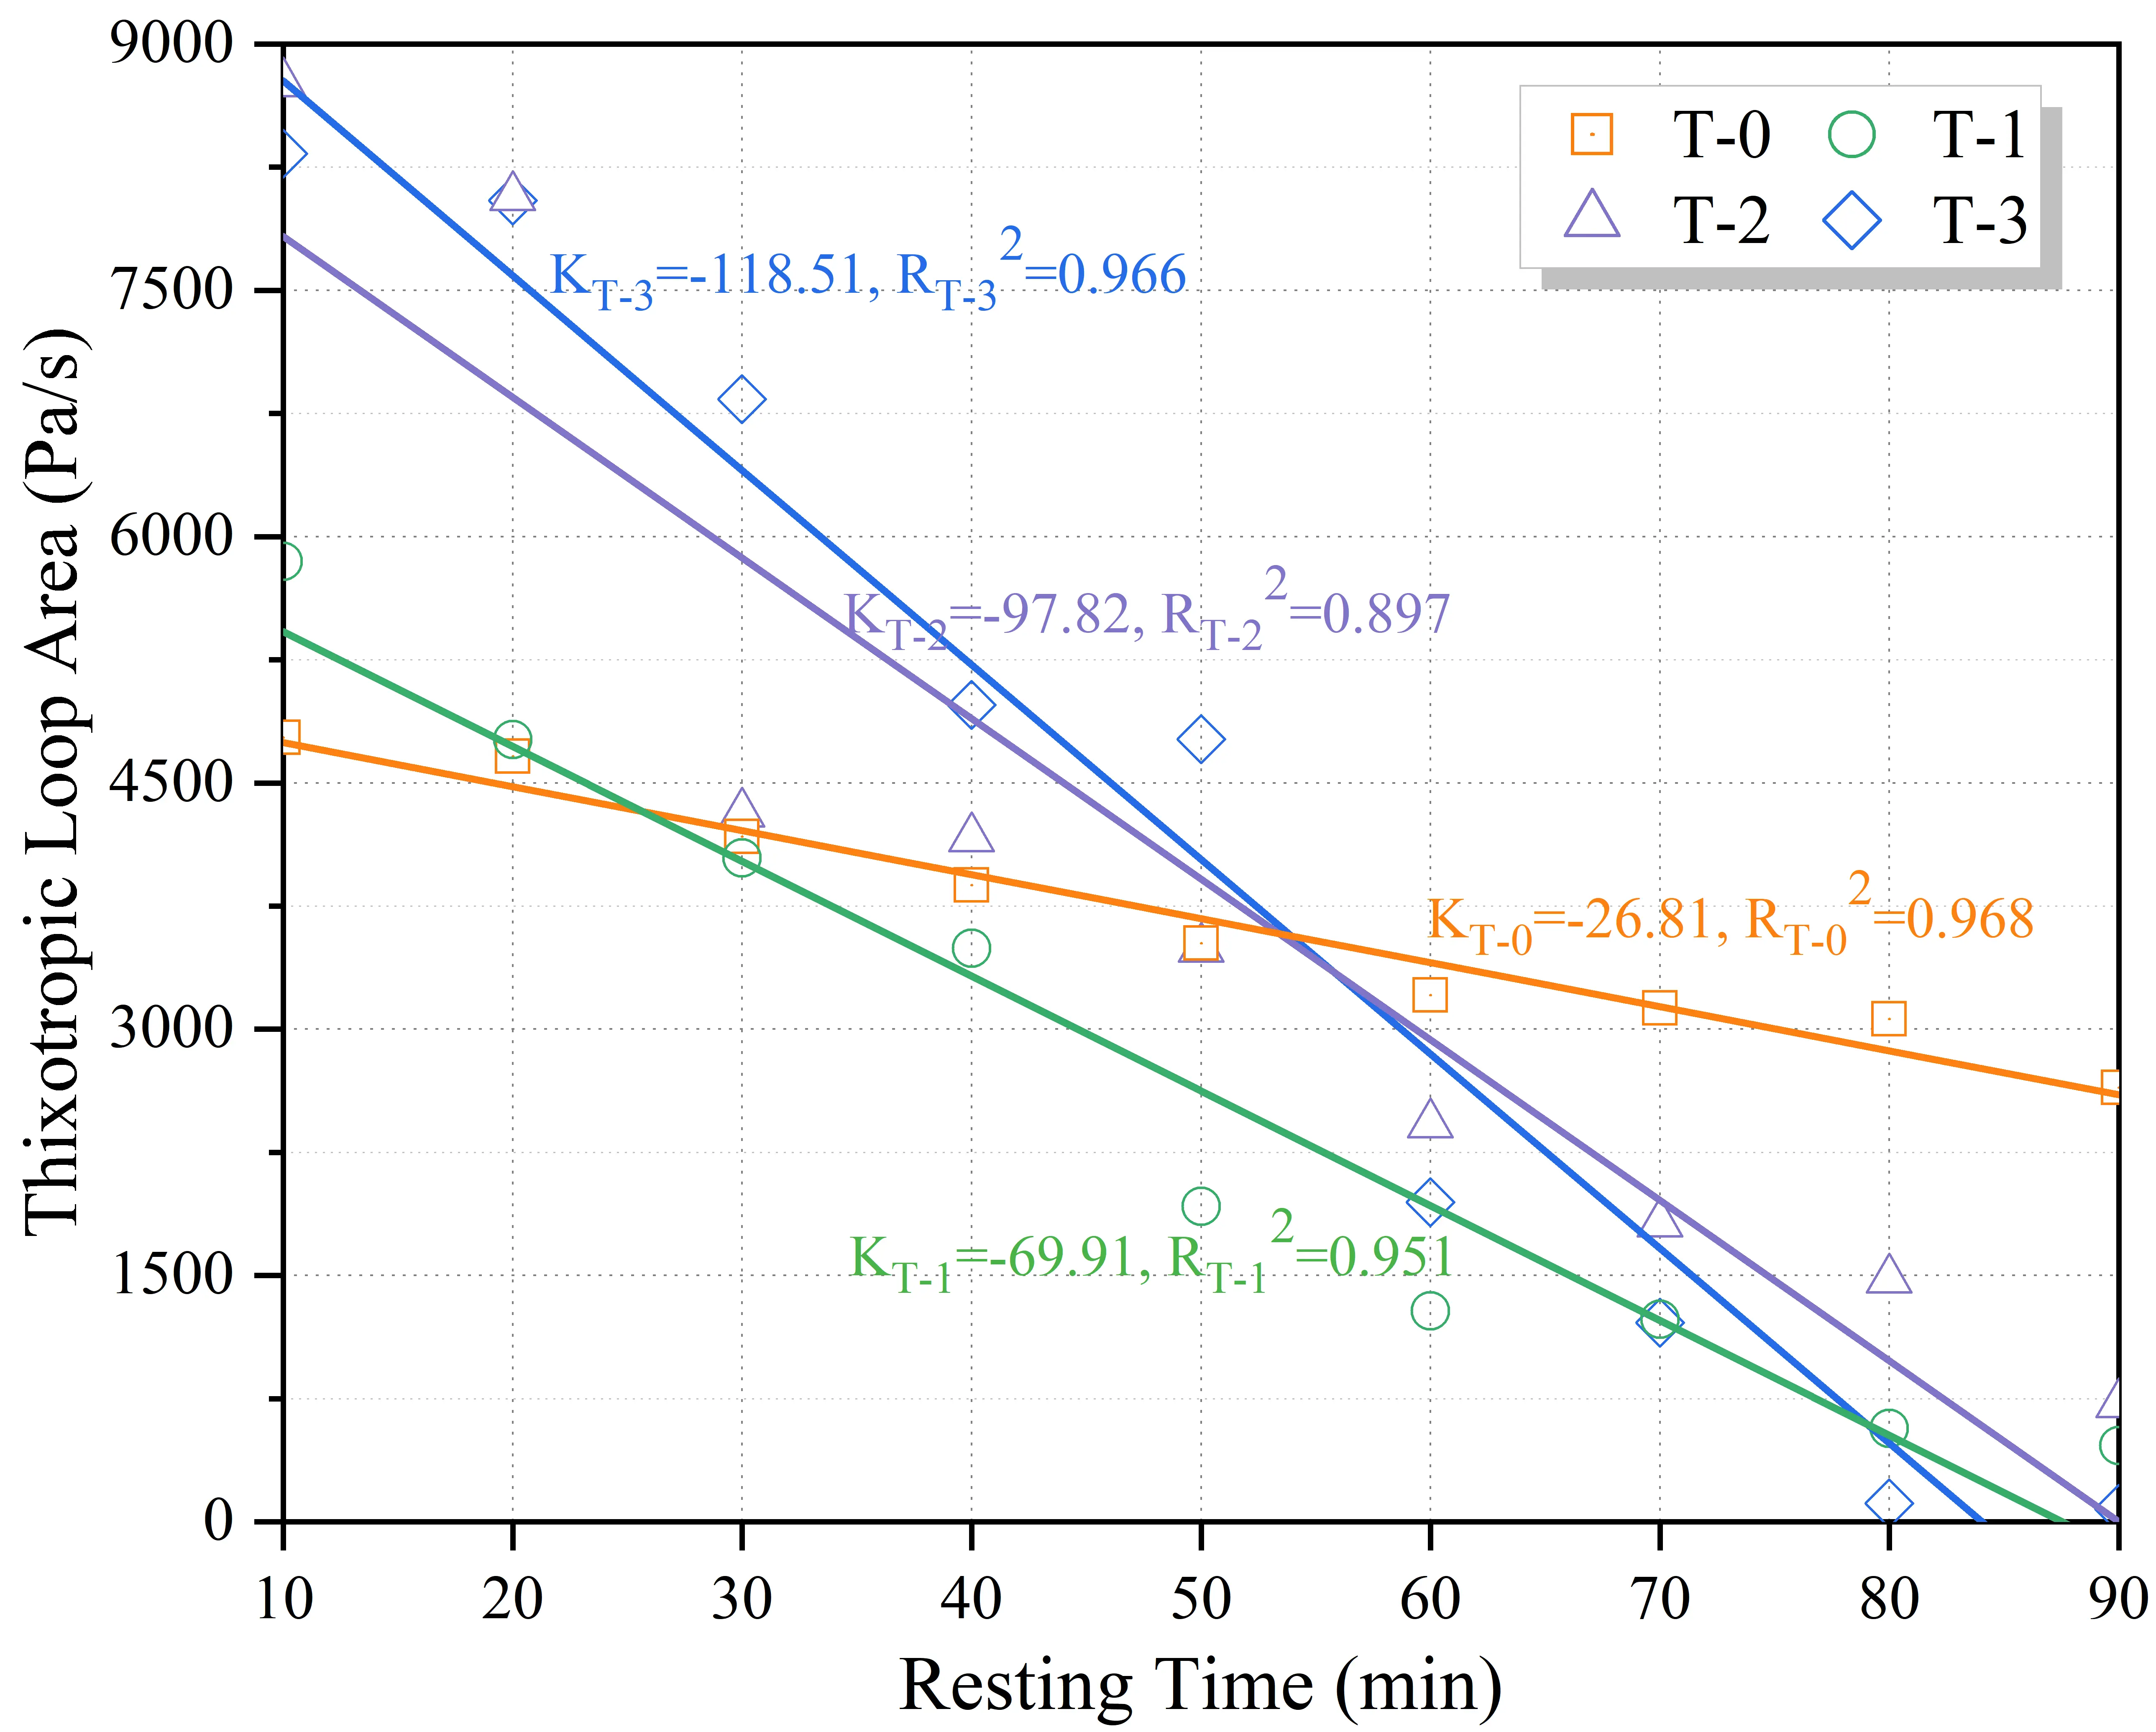
The intersection of structural build-up (Figure 16) and thixotropic decay (Figure 17) defines the operational boundaries of the 3DPMSC. For the optimal mixture T-3, although the high build-up rate (K = 74.18) guarantees excellent shape retention, the rapid depletion of thixotropic energy (K = -118.51) imposes strict temporal constraints on the printing process. Based on the linear extrapolation in Figure 17, the workable window for T-3 is restricted to approximately 60-70 min, after which the material becomes too stiff for continuous extrusion or effective bonding with new layers. Consequently, for engineering applications utilizing large volumes of MS, it is advisable to control the printing duration within this timeframe or employ retarding admixtures to extend the open time. Furthermore, while high-MS mixtures achieve sufficient strength immediately after deposition to support subsequent layers, this rapid stiffening poses challenges to interlayer bonding. If the interlayer interval time is excessive, a “cold joint” effect may occur[41,42]. Therefore, based on the results from Figure 16 and Figure 17, it is recommended that the printing path be optimized to minimize the interlayer interval time for high-MS 3DPC, ensuring a balance between structural stability and interfacial bond quality.
4.4 Mechanical properties of 3DPMSC
Figure 18 presents the 28-day compressive strength of printed specimens loaded in different directions (X, Y, Z), compared with
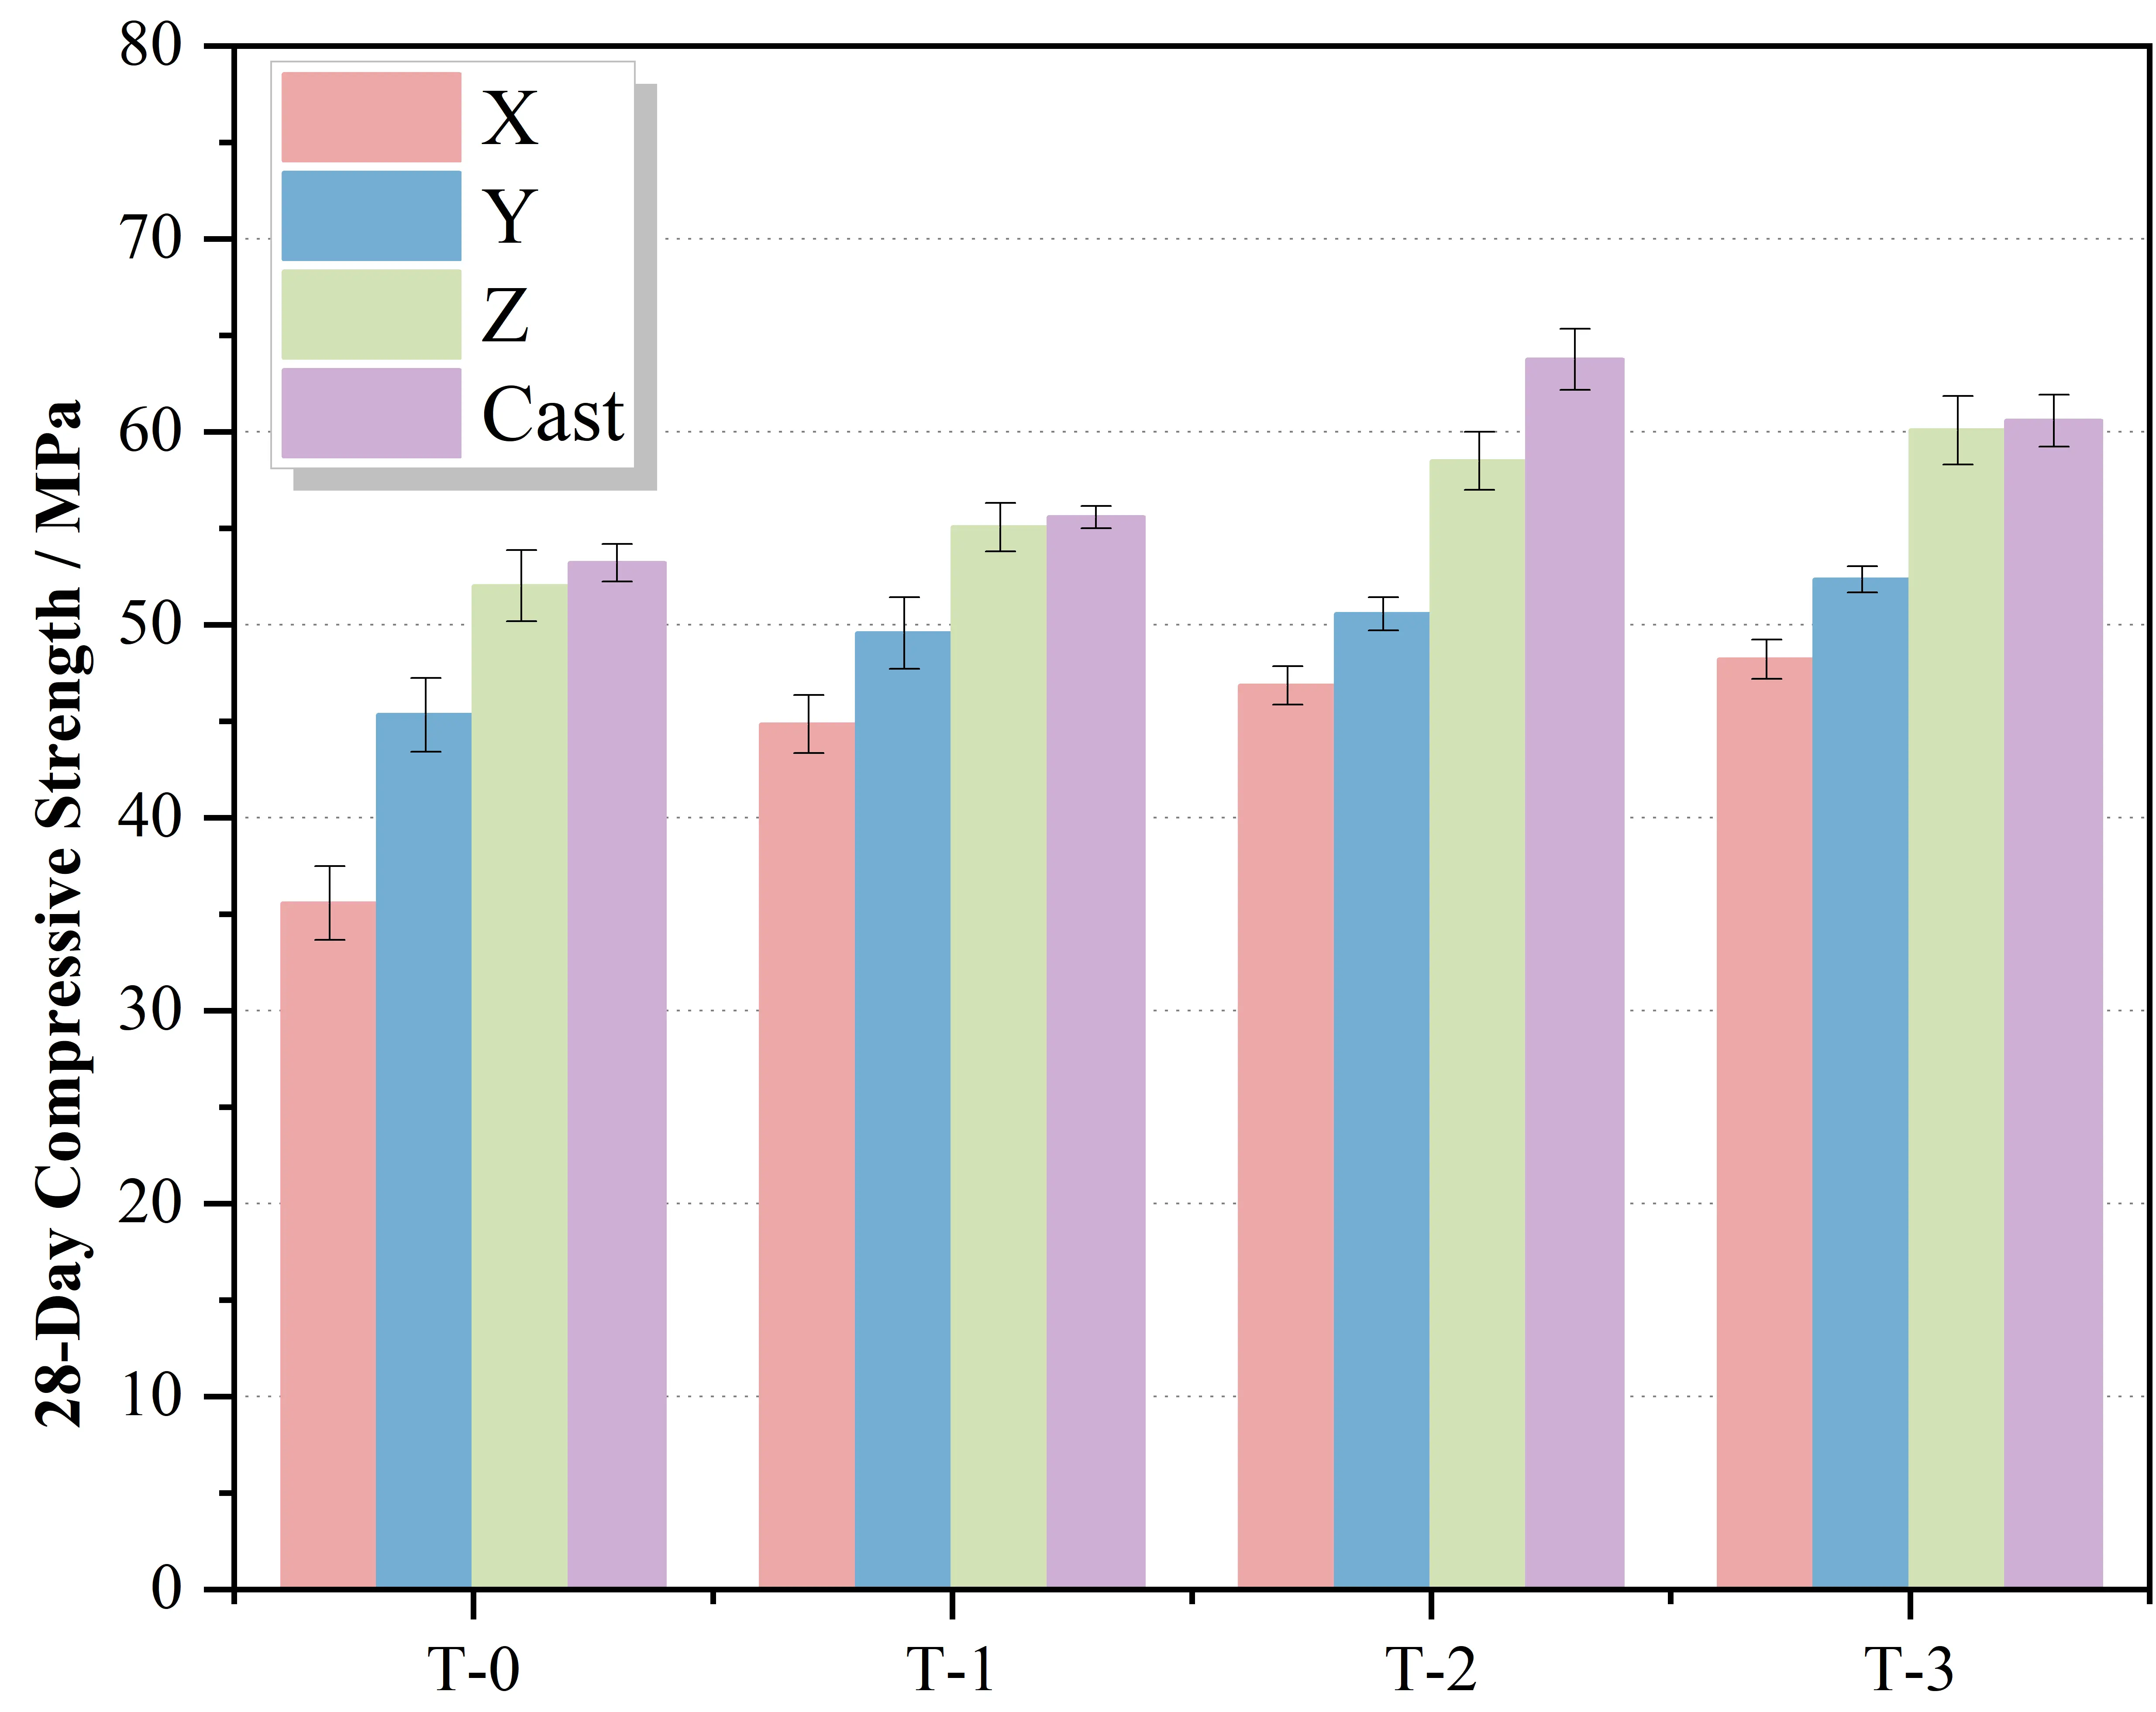
Figure 18. Compressive performance of 3DPMSC. 3DPMSC: 3D printed manufactured sand concrete.
The flexural strength results in Figure 19 reveal the significant influence of printing direction on tensile performance. While the
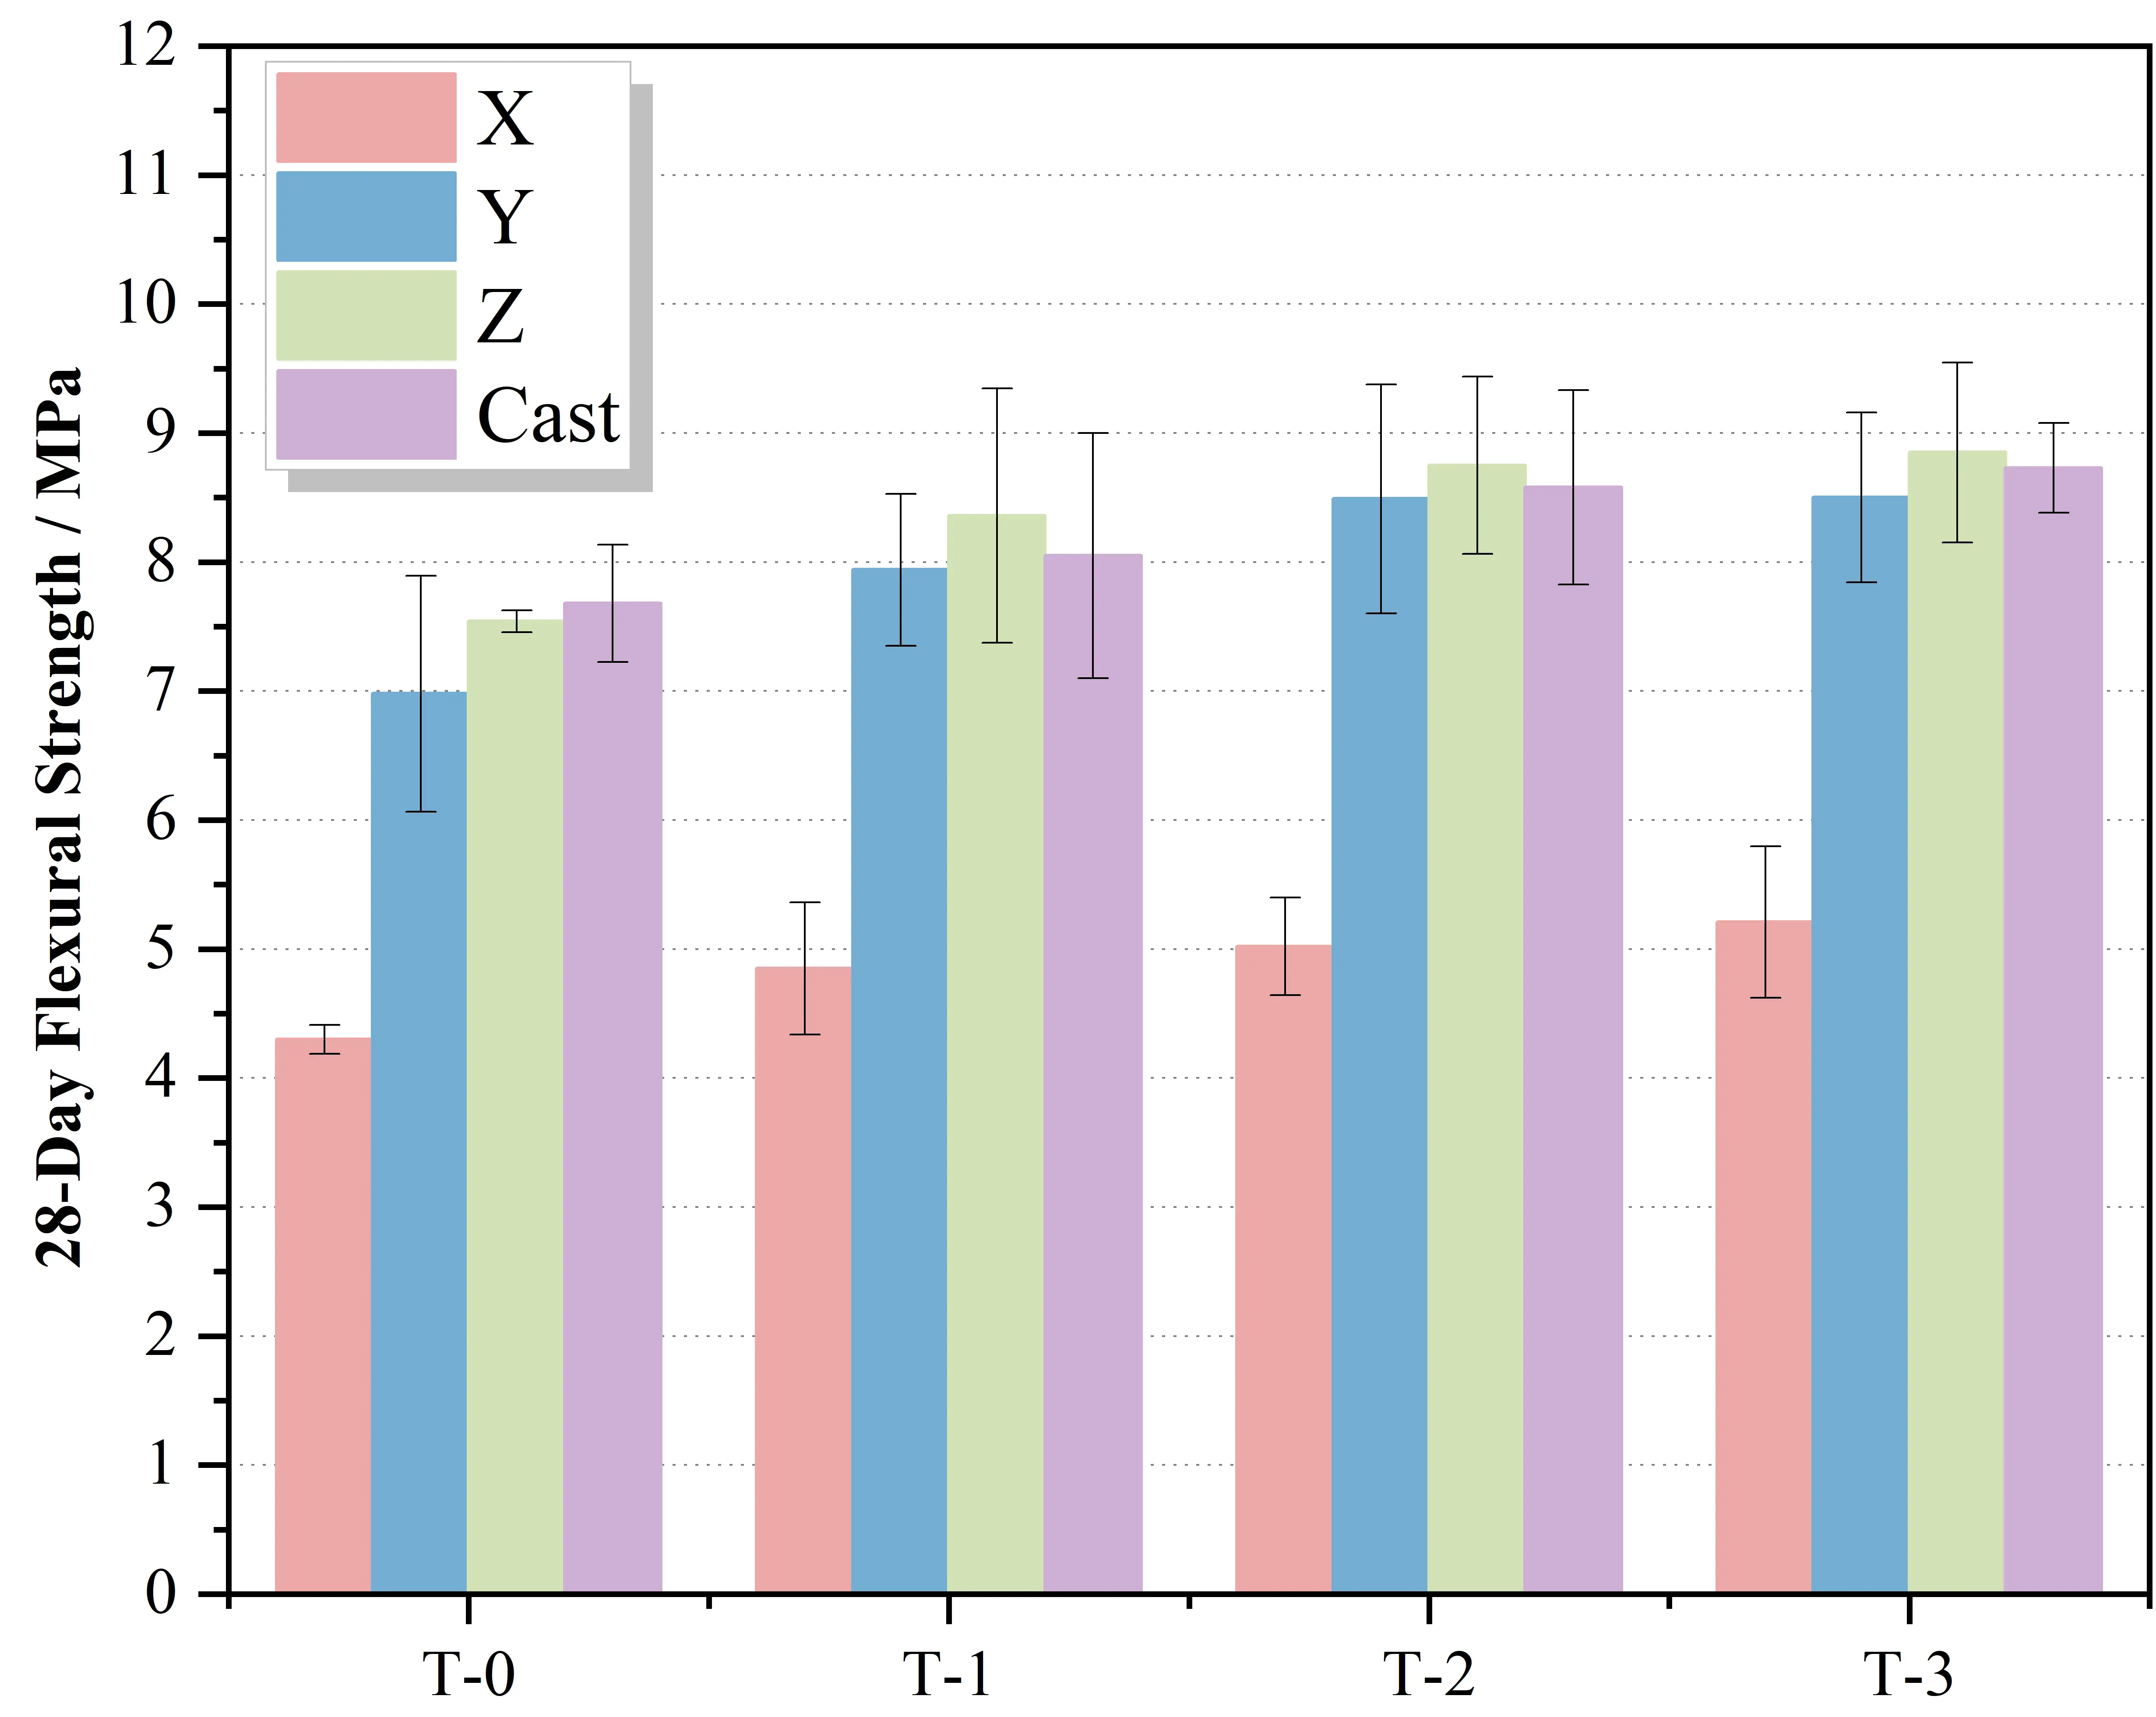
Figure 19. Flexural performance of 3DPMSC. 3DPMSC: 3D printed manufactured sand concrete.
Mechanical anisotropy is an inherent characteristic of the layer-by-layer deposition process. As observed in Figure 18 and Figure 19, the X-direction consistently exhibited the lowest strength. In compression, this is due to the separation between filament tracks caused by lateral expansion effects; in flexure, it represents direct tensile failure at the layer interface. Nevertheless, the T-3 mixture demonstrated robust performance, meeting structural application requirements in all directions. The results indicate that the secondary mixing process effectively homogenized the mixture, ensuring sufficient paste availability to wet the interfaces even with high MS content. This overcomes the negative impact of aggregate angularity on flowability and mitigates the risk of cold joints typically associated with fast-setting materials.
4.5 Kinetic modeling of rheological evolution and open time prediction
To quantitatively describe the competition between the structural build-up required for buildability and the thixotropic decay limiting extrudability, a semi-empirical kinetic model was established. Unlike simple linear regression, this model decouples the rheological contribution of the cementitious paste from the geometric hindrance effect induced by the MS skeleton.
4.5.1 Model establishment based on skeleton amplification effect
The time-dependent evolution of static yield stress (τstatic) and thixotropic loop area (S) after secondary mixing can be regarded as a superposition of the colloidal flocculation of the paste matrix and the physical friction of the aggregate skeleton. Drawing on the “Rule of mixtures” and the concept of geometric influence factors in composite mechanics[43], we propose a kinetic model that incorporates a morphological amplification factor.
The evolution equations are expressed as follows:
where t is the resting time (min); τ0 and S0 are the initial values. Aeff and Keff represent the effective Astruct and thixotropic decay rate, respectively. Considering the reference group T-0 (Rb/s = 1.0) as the baseline matrix, the presence of angular MS particles amplifies these rates by increasing internal friction and water consumption. We introduce the normalized sand ratio increment Δr = Rb/s - 1.0 and define the rate functions as:
where Amatrix and Kmatrix are the intrinsic rates of the reference matrix (T-0). ξbuild is the Structural Build-up Amplification Factor, quantifying how MS particles accelerate rigidification through nucleation and interlocking. ξdecay is the Thixotropic Decay Sensitivity Factor, reflecting the acceleration of reversibility loss due to water absorption and geometric jamming by MS particles.
4.5.2 Parameter calibration and physical interpretation
Based on the experimental data from Section 4.3 (Figure 16 and Figure 17), the model parameters were calibrated. The baseline rates for T-0 were determined as Amatri = 46.56 Pa/min and Kmatrix = 26.81 Pa·s/min. By substituting the rates of the high-MS group T-3
I. For structural build-up: 74.18 = 46.56 · [1 + ξbuild · 0.3]
The value ξbuild≈1.98 indicates that the angular morphology of MS contributes significantly to static stability. The rigid skeleton formed by MS acts as a scaffold, amplifying the flocculation strength of the paste by nearly double per unit of sand ratio increment.
II. For thixotropic decay: 118.51 = 26.81 · [1 + ξdecay · 0.3]
Notably, ξdecay (11.40) is nearly an order of magnitude higher than ξbuild (1.98). This disparity reveals a critical mechanism: the inclusion of MS is far more detrimental to the “reversibility” of the material (thixotropy) than it is beneficial to the “rigidity” (yield stress). This phenomenon can be explained by the “Geometric Jamming” theory. The static yield stress relies on the contact network force chains, where the angularity of MS enhances the friction coefficient linearly, providing a stable skeleton for stacking. In contrast, thixotropic reversibility depends on the ability of particles to slide and rearrange under shear. For angular MS particles, the maintenance of flowability is strictly governed by the thickness of the IWF. As the resting time increases and free water is consumed by nucleation and stone powder absorption, the IWF thins. Once the film thickness falls below the critical height of the surface asperities of the tuff sand, the system undergoes an abrupt transition from a lubricated state to a “jammed” state[44]. The angular grains interlock geometrically, effectively permanently “locking” the microstructure. Unlike the soft flocculation of cement paste, which is reversible, this geometric jamming requires overcoming immense internal friction to re-initiate flow, resulting in a disproportionately rapid loss of extrudability compared to the gain in strength. The high specific surface area and microfines of MS rapidly consume the free water required for lubrication, causing the material to lose its extrudability much faster than it gains strength.
4.5.3 Validation and open time prediction
The calibrated model was used to predict the rheological evolution of intermediate groups (T-1, T-2). As shown in Figure 20, the predicted curves exhibit a high degree of agreement with the experimental data (R2 > 0.96), validating the universality of the proposed amplification factors for this material system.
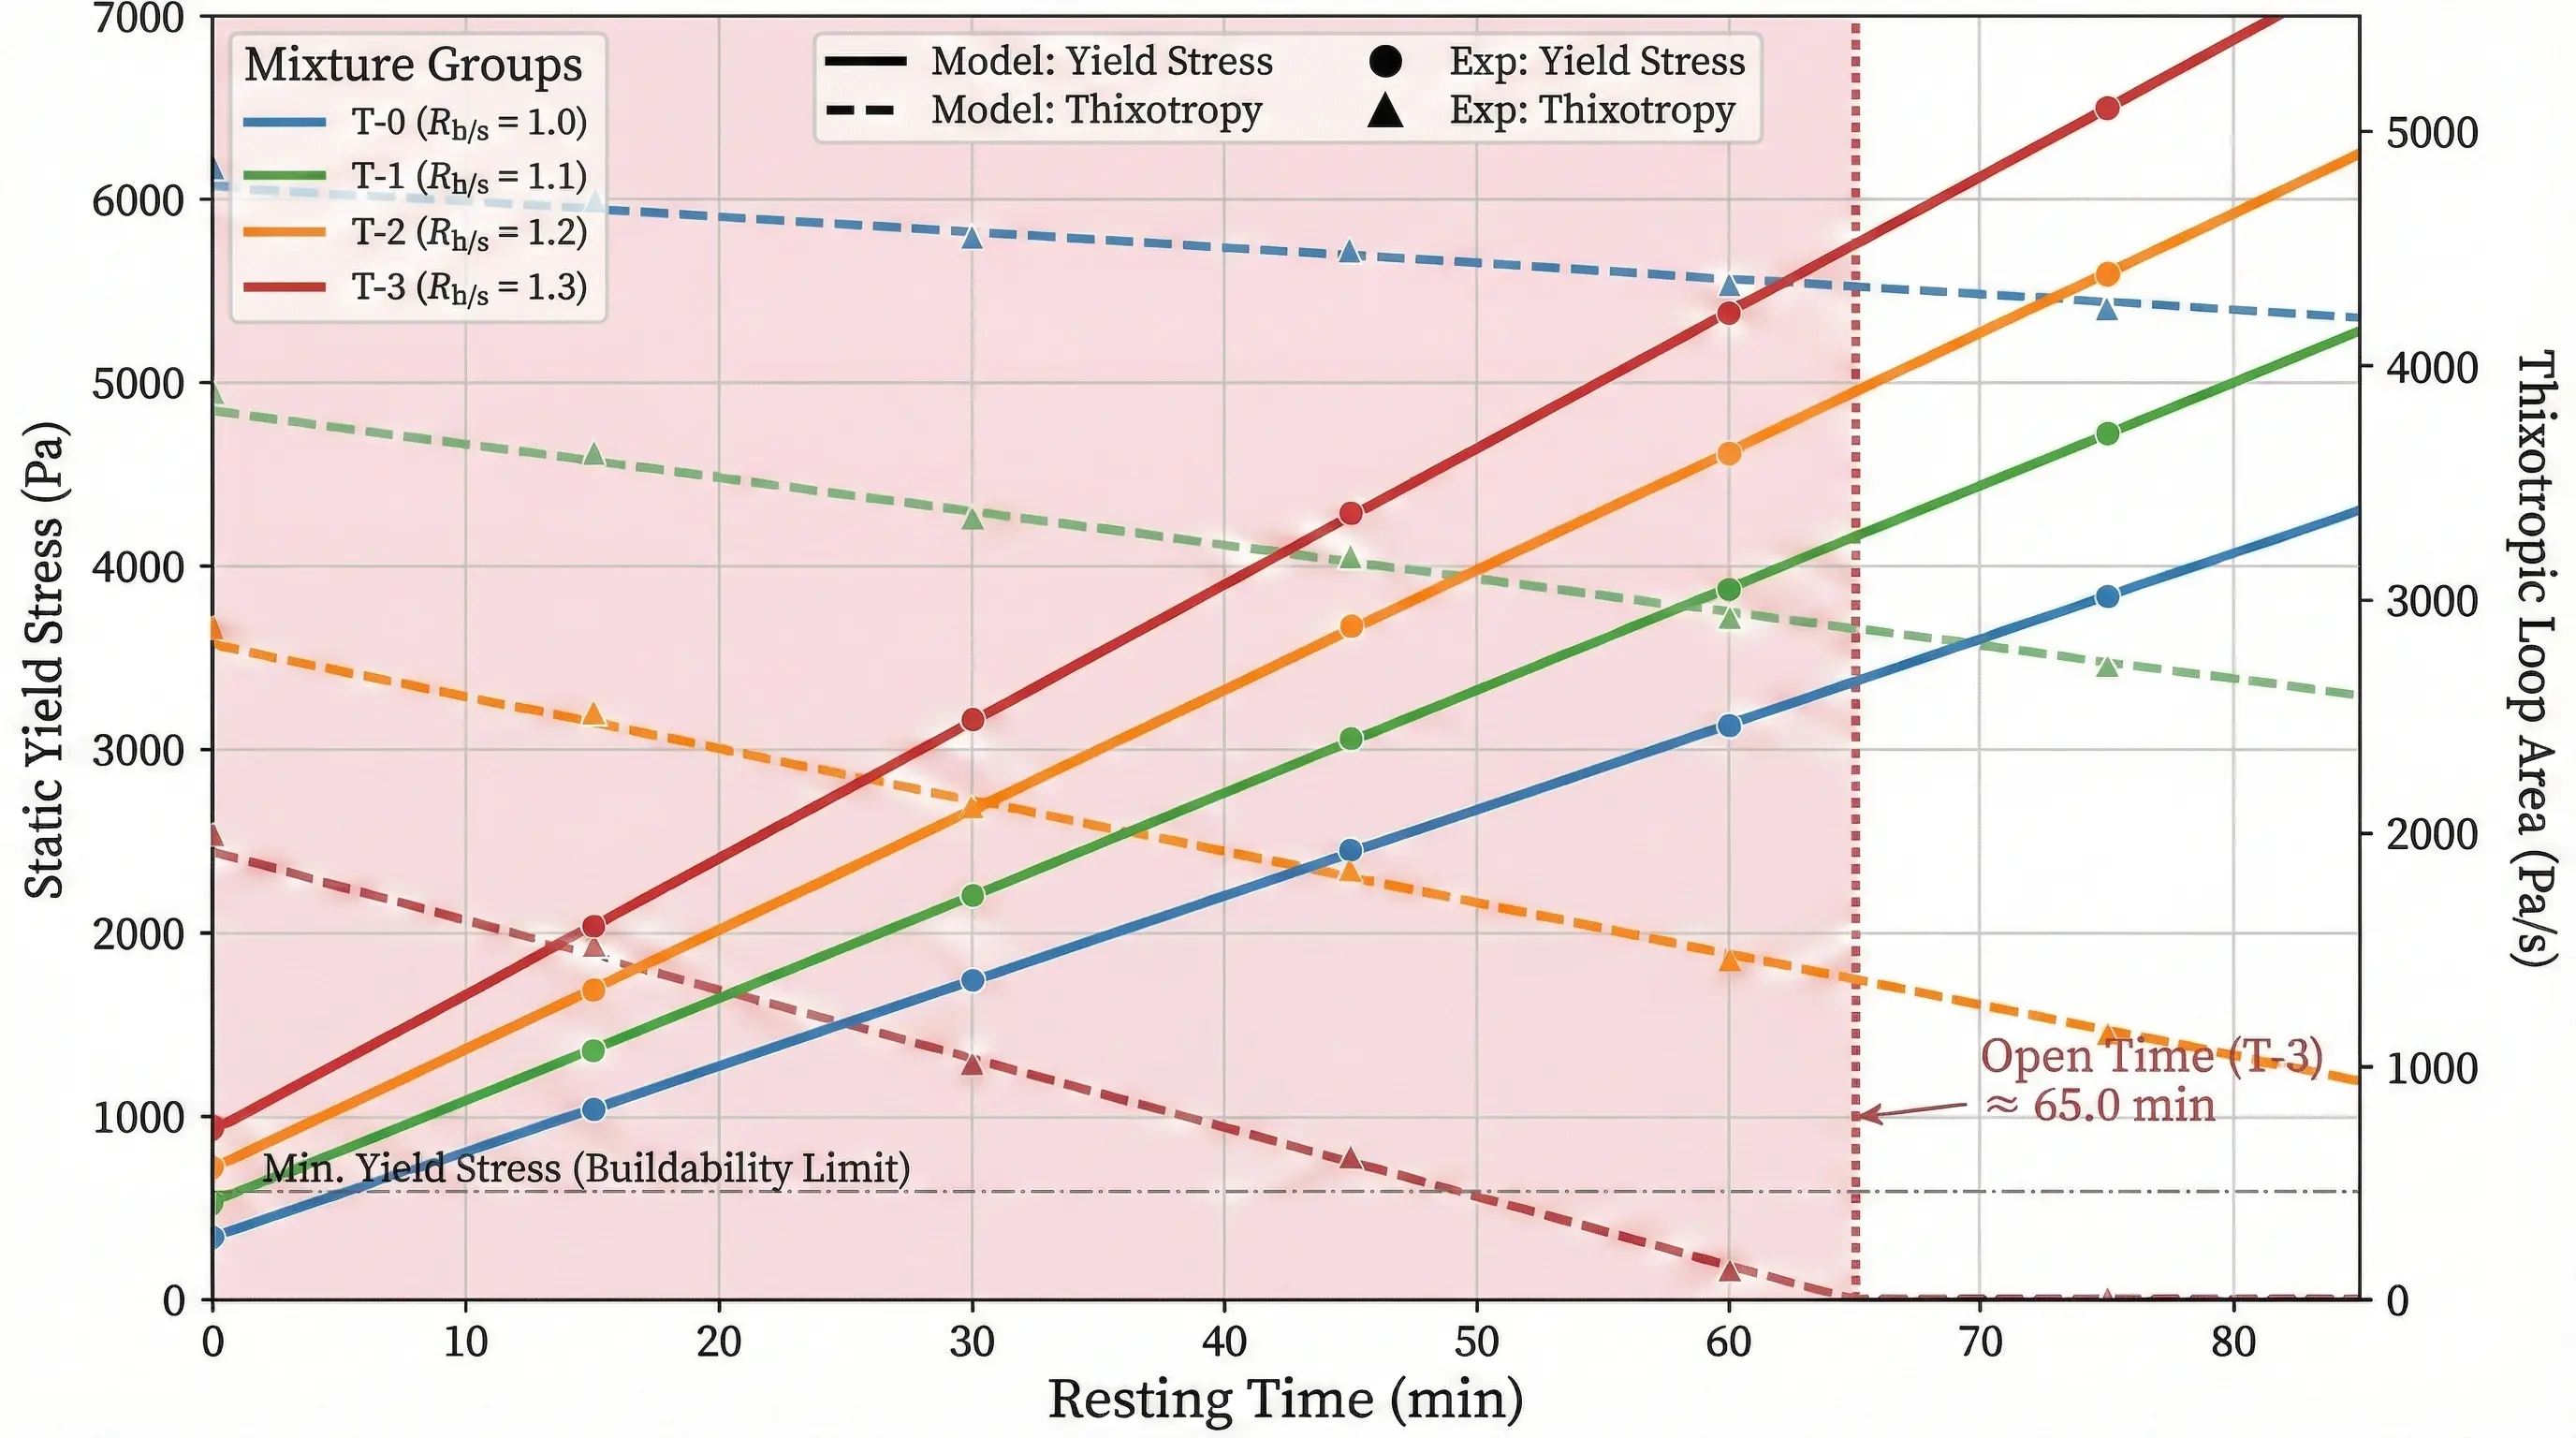
The effective printing window (topen) is defined by the intersection of two critical thresholds: Lower bound (buildability):
For the optimized mixture T-3, the model predicts an open time of 64.8 min. This theoretical value aligns precisely with the experimental observation, where the extrusion torque increased sharply at approximately 65 min. The model quantitatively confirms that while secondary mixing rejuvenates the initial state, the high sensitivity of thixotropic decay (ξdecay = 11.40) dictates that 3DPMSC operations must be strictly time-managed.
5. Conclusion
This study investigated the feasibility of utilizing high-volume MS in 3DPC via a secondary mixing protocol. Based on the systematic evaluation of rheological evolution, printability, and mechanical anisotropy, the following conclusions can be drawn:
(1) The secondary mixing protocol, characterized by a static resting period and delayed PCE addition, effectively disrupts early-age flocculation structures. This induces a “replasticization” effect, reducing the static yield stress of stiff MS mixtures by approximately 39% and minimizing thixotropic hysteresis, thus reconciling the inherent trade-off between pumpability and buildability.
(2) The inclusion of MS linearly accelerates the Astruct due to increased nucleation sites and inter-particle friction. While the optimized T-3 mixture exhibits superior shape retention, its effective open time is restricted to approximately 60-70 min, necessitating optimized printing paths to avoid cold joints.
(3) High-volume MS significantly enhances mechanical performance through morphological interlocking and micro-filler effects. The T-3 mixture achieved a 28-day compressive strength of 61 MPa, surpassing the river sand reference group by 15%.
(4) Although mechanical anisotropy persists with the X-direction being the weakest link, secondary mixing improves the homogeneity of the matrix at the interface. The interlayer flexural strength (X-direction) of the optimized T-3 group reached 5.2 MPa, representing a 21% increase compared to the reference group (T-0).
Authors contribution
Zhu W: Writing-original draft, visualization, formal analysis.
Liu C: Conceptualization.
Zhang Y: Methodology, funding acquisition.
Zhu C: Resources.
Wang T: Supervision.
Wang Y: Data Curation.
Liu H: Validation, project administration.
Conflicts of interest
Chao Liu is an Editorial Board Member of Journal of Building Design and Environment. Huawei Liu is a Youth Editorial Board Member of Journal of Building Design and Environment. The other authors declare no conflicts of interest.
Ethical approval
Not applicable.
Consent to participate
Not applicable.
Consent for publication
Not applicable.
Availability of data and materials
Data supporting the findings of this study are available from the corresponding author upon reasonable request.
Funding
The work was supported by the National Natural Science Foundation of China (Grant No. 52178251 and No. 62276207), the National Natural Science Foundation of China Youth Fund (Grant No. 52408289 and No. 52508304), Shaanxi Qinchuangyuan “Scientist + Engineer” Team Construction Project (Grant No. 2023KXJ-242), Shaanxi Provincial Natural Science Basic Research Program (Grant No. 2025JC-YBMS-550), and support from Shaanxi Provincial Education Department Youth Innovation Team Project (Grant No. 24JP095).
Copyright
© The Author(s) 2026.
References
-
1. Menna C, Mata-Falcón J, Bos FP, Vantyghem G, Ferrara L, Asprone D, et al. Opportunities and challenges for structural engineering of digitally fabricated concrete. Cem Concr Res. 2020;133:106079.[DOI]
-
2. Mohan MK, Rahul A, De Schutter G, Van Tittelboom K. Extrusion-based concrete 3D printing from a material perspective: A state-of-the-art review. Cem Concr Compos. 2021;115:103855.[DOI]
-
3. Marchment T, Sanjayan J. Mesh reinforcing method for 3D concrete printing. Autom Constr. 2020;109:102992.[DOI]
-
4. Bai M, Xiao J, Ding T, Yu K. Interfacial bond properties between 3D printed engineered cementitious composite (ECC) and post-cast concrete. Cem Concr Compos. 2025;157:105897.[DOI]
-
5. Wei X. Research on the Effect of recycled brick powder/aggregate on 3D printed concrete performance [dissertation]. Jiaozuo: Henan Polytechnic University; 2024. Chinese.[DOI]
-
6. Guo X, Yang J, Xiong G. Influence of supplementary cementitious materials on rheological properties of 3D printed fly ash based geopolymer. Cem Concr Compos. 2020;114:103820.[DOI]
-
7. Sun C, Xiang J, Xu M, He Y, Tong Z, Cui X. 3D extrusion free forming of geopolymer composites: Materials modification and processing optimization. J Clean Prod. 2020;258:120986.[DOI]
-
8. Si W, Carr L, Zia A, Khan M, McNally C. Advancing 3D printable concrete with nanoclays: Rheological and mechanical insights for construction applications. J Compos Sci. 2025;9(8):449.[DOI]
-
9. Pour AK, Farsangi EN, Yang TY, Li S, Hajirasouli A, Shirkhani A. 3D printing of conventional and geopolymer concretes: Advancements, challenges, future directions, and cost analysis. J Struct Des Constr Pract. 2025;30(4):03125003.[DOI]
-
10. Wolfs R. The status quo of 3D concrete printing: Are we there yet? RILEM Tech Lett. 2023;8:182-189.[DOI]
-
11. Song H, Li X. An overview on the rheology, mechanical properties, durability, 3D printing, and microstructural performance of nanomaterials in cementitious composites. Materials. 2021;14(11):2950.[DOI]
-
12. Kilic U, Soliman N, Omran A, Ozbulut OE. Effects of cellulose nanofibrils on rheological and mechanical properties of 3D printable cement composites. Cem Concr Compos. 2024;152:105617.[DOI]
-
13. Kolathayar S, Menon NVC, Sreekeshava KS. Civil engineering innovations for sustainable communities with net zero targets. Boca Raton: CRC Press; 2024.[DOI]
-
14. Batikha M, Jotangia R, Baaj MY, Mousleh I. 3D concrete printing for sustainable and economical construction: A comparative study. Autom Constr. 2022;134:104087.[DOI]
-
15. Zhu W, Zhu S, Li W, Zhang Y, Chen W, Zhang J, et al. A study on the printability of manufactured sand concrete. Constr Build Mater. 2023;409:134153.[DOI]
-
16. Liu Z, Wang J, Lu F. Review on the research and application status of manufactured sand and manufactured sand concrete. Commun Sci Technol Heilongjiang. 2017;40(2):20-21. Chinese.[DOI]
-
17. Zhou X, Liu J, Liu G. Study on the influence of manufactured sand particle shape on mortar rheological propertie. China Concr Cem Prod. 2020;5:1-5. Chinese.[DOI]
-
18. Bonavetti V, Donza H, Menéndez G, Cabrera O, Irassar EF. Limestone filler cement in low w/c concrete: A rational use of energy. Cem Concr Res. 2003;33(6):865-871.[DOI]
-
19. Poppe AM, De Schutter G. Cement hydration in the presence of high filler contents. Cem Concr Res. 2005;35(12):2290-2299.[DOI]
-
20. Ren Q, Tao Y, Jiao D, De Schutter G, Jiang Z. Rheological properties of concrete with manufactured sand: A multi-level prediction. Cem Concr Compos. 2022;133:104647.[DOI]
-
21. Tarhan Y, Tarhan İH, Şahin R. Comprehensive review of binder matrices in 3D printing construction: Rheological perspectives. Buildings. 2025;15(1):75.[DOI]
-
22. Rama Krishana AKR, Mallik MM, Maity D. Developing an appropriate concrete mix for 3D concrete printing. J Build Pathol Rehabil. 2024;9(2):104.[DOI]
-
23. Xiao J, Hou S, Duan Z, Zou S. Rheology of 3D printable concrete prepared by secondary mixing of ready-mix concrete. Cem Concr Compos. 2023;138:104958.[DOI]
-
24. Ramakrishnan S, Pasupathy K, Mechtcherine V, Sanjayan J. Printhead mixing of geopolymer and OPC slurries for hybrid alkali-activated cement in 3D concrete printing. Constr Build Mater. 2024;430:136439.[DOI]
-
25. Changez K, Aslam J, Bhutta MU, Butt SI. Hybrid additive strategies for sustainable 3D concrete printing: Balancing printability, early-stage strength, and eco-efficiency. J Archit Eng. 2026;32(1):04025046.[DOI]
-
26. Bai J, Ge C, Liang J, Xu J. Recycled aggregate: A solution to sustainable concrete. Materials. 2025;18(12):2706.[DOI]
-
27. Liu H, Tao Y, Zhu C, Liu C, Wang Y, Yun J, et al. 3D printed concrete with recycled coarse aggregate: Freeze–thaw resistance assessment and damage mechanisms. Cem Concr Compos. 2026;200:108095.[DOI]
-
28. Zhang C, Wang J, Zhang X, Hou J, Huang J, Feng S, et al. Influence of limestone powder on water film thickness and plastic viscosity of UHPC. Case Stud Constr Mater. 2024;20:e03036.[DOI]
-
29. Zhao Y, Guo Y, Sun Y, Zhou X, Min Z, Lin Q, et al. Mechanical and microstructural properties of glass powder-modified recycled brick-concrete aggregate concrete. Case Stud Constr Mater. 2025;22:e04720.[DOI]
-
30. Eltayeb I, Khalid HR, Adekunle SK, Bagneid S, Abdulqader M, Hanif A, et al. Physicochemical properties of cement waste-derived portlandite-substituted limestone calcined clay cement (LC3) binders. J Sustain Cem-Based Mater. 2025;14(8):1517-1535.[DOI]
-
31. Umer M. Hydration kinetics and compressive strength of low carbon binders. 2024. Available from: https://urn.fi/URN:NBN:fi:aalto-202501221605
-
32. Chen W, Zhou Y, Yu Q, Zhan B, Li W, Xiong C, et al. Microscopic thickening mechanisms of hydroxypropyl methyl cellulose ether anti-washout admixture and its impact on cementitious material rheology and anti-dispersal performance. J Build Eng. 2024;89:109346.[DOI]
-
33. He J, Cheng C, Zhu X, Li X. Effect of silica fume on the rheological properties of cement paste with ultra-low water binder ratio. Materials. 2022;15(2):554.[DOI]
-
34. De Larrard F. Concrete mixture proportioning: A scientific approach. London: CRC Press; 1999.[DOI]
-
35. Du J, Guo P, Meng W. Effect of water-based nanoclay and ambient temperature on rheological properties of UHPC pastes. Constr Build Mater. 2023;370:130733.[DOI]
-
36. Glotz T, Petryna Y. Experimental characterization of anisotropic mechanical behaviour and failure mechanisms of hardened printed concrete. Materials. 2024;17(16):3931.[DOI]
-
37. Liu C, Zhang Y, Liu H, Wu Y, Yu S, He C, et al. Interlayer reinforced 3D printed concrete with recycled coarse aggregate: Shear properties and enhancement methods. Addit Manuf. 2024;94:104507.[DOI]
-
38. Liu C, Zhang Y, Liu H, Wu Y, Yu S, He C, et al. Interlayer reinforced 3D printed concrete with recycled coarse aggregate: Shear properties and enhancement methods. Addit Manuf. 2024;94:104507.[DOI]
-
39. Sun Y, Song S, Yu H, Ma H, Xu Y, Zu G, et al. Experimental study on the strength and durability of manufactured sand HPC in the Dalian Bay undersea immersed tube tunnel and its engineering application. Materials. 2024;17(20):5003.[DOI]
-
40. Zhu W. Research on Material Design, Preparation and regulation mechanism of 3D printed manufactured sand concrete [dissertation]. Lanzhou: Lanzhou University of Technology; 2024. Chinese.[DOI]
-
41. Glotz T, Rasehorn IJ, Petryna Y. Mechanical behavior of hardened printed concrete and the effect of cold joints: An experimental investigation. Materials. 2024;17(24):6304.[DOI]
-
42. Popli S, Valikhah F, Zandi Lak E, Das S. Mechanical and durability performance of 3D-printed concrete with coarse aggregates and cold joints. J Struct Des Constr Pract. 2025;30(4):04025081.[DOI]
-
43. Jones RM. Mechanics of composite materials. Boca Raton: CRC Press; 2018.[DOI]
-
44. Wyart M, Cates ME. Discontinuous shear thickening without inertia in dense non-brownian suspensions. Phys Rev Lett. 2014;112(9):098302.[DOI]
Copyright
© The Author(s) 2026. This is an Open Access article licensed under a Creative Commons Attribution 4.0 International License (https://creativecommons.org/licenses/by/4.0/), which permits unrestricted use, sharing, adaptation, distribution and reproduction in any medium or format, for any purpose, even commercially, as long as you give appropriate credit to the original author(s) and the source, provide a link to the Creative Commons license, and indicate if changes were made.
Publisher’s Note
Science Exploration remains a neutral stance on jurisdictional claims in published
maps
and institutional affiliations. The views expressed in this article are solely those
of
the author(s) and do not reflect the opinions of the Editors or the publisher.
Share And Cite


Science Exploration Style
Zhu W, Liu C, Zhang Y, Zhu C, Wang T, Wang Y, et al. Rheological rejuvenation and structural build-up of 3D printed manufactured sand concrete via secondary mixing protocol. J Build Des Environ. 2026;4:2025141. https://doi.org/10.70401/jbde.2026.0029
Tips
Copy completed.
Submit a Manuscript
Author Instructions
Cite this Article
Article Metrics
0
View
0
Download
Cited
Article Updates

- Abstract
- Keywords
- 1. Introduction
- 2. Preparation of 3DPMSC by Secondary Mixing
- 3. Materials and Methods
- 4. Results and Discussion
- 5. Conclusion
- Authors contribution
- Conflicts of interest
- Ethical approval
- Consent to participate
- Consent for publication
- Availability of data and materials
- Funding
- Copyright
Science Exploration Style
Zhu W, Liu C, Zhang Y, Zhu C, Wang T, Wang Y, et al. Rheological rejuvenation and structural build-up of 3D printed manufactured sand concrete via secondary mixing protocol. J Build Des Environ. 2026;4:2025141. https://doi.org/10.70401/jbde.2026.0029
copy
Share Link
copy