Interpretable model and explicit formula for 3D printed recycled aggregate concrete strength prediction
*Correspondence to:
Huawei Liu, School of Civil Engineering, Xi’an University of Architecture and Technology, Xi’an 710055, Shaanxi, China.
E-mail: liuhuawei@xauat.edu.cn
J Build Des Environ. 2026;4:2025140. 10.70401/jbde.2026.0035
Received: December 18, 2025Accepted: March 12, 2026Published: March 17, 2026
This article belongs to the Special lssue Advances in Low-Carbon Emission-Reduction Materials for Sustainable Buildings
This manuscript is made available in its unedited form to allow early access to the
reported findings. Further editing will be completed before final publication. As such,
the content may include errors, and standard legal disclaimers are applicable.
Abstract
The construction industry is undergoing a low-carbon and digital transformation. The application of recycled aggregates in 3D printed concrete has emerged accordingly, combining the advantages of solid waste recycling and automated manufacturing. However, the optimization of mix design and the prediction of mechanical properties for 3D printed recycled aggregate concrete (3DPRAC) face two main challenges, namely the micro defects inherent in recycled aggregates and the anisotropy caused by layered deposition. This study proposes a Gene Expression Programming (GEP)-based computational framework for the prediction of the splitting tensile strength (STS) of 3DPRAC. A dataset of 110 data points was generated, with layer height and loading direction as key printing parameters representing the anisotropic effect. GEP showed the best performance among models, with an R2 of 0.914 on the testing set. Furthermore, the GEP model provides explicit mathematical equations that delineate the contributions of individual input variables and reveal the nonlinear effects of fiber content and printing parameters on STS.
Keywords
3D concrete printing, gene expression programming, recycled aggregate, splitting tensile strength, explicit mathematical formula, anisotropy
1. Introduction
The introduction of recycled aggregates into 3D concrete printing advances sustainable and automated construction by making use of recycled materials and reducing the consumption of natural resources and waste during construction. However, this poses challenges in terms of the material itself as well as the process[1-3]. At the microscale, residual mortar adhering to the recycled aggregates’ surfaces increases porosity and weakens the interfacial transition zones. At the macroscale, the layer-by-layer deposition process creates numerous inter-layer interfaces, resulting in pronounced anisotropic behavior[4]. This makes the prediction of the splitting tensile strength (STS) of 3D printed recycled aggregate concrete (3DPRAC) challenging due to the difficulties involved in using conventional empirical or experimental methods.
Accurate prediction of the mechanical performance in 3D printed concrete requires materials that satisfy specific rheological criteria for printability[5]. Therefore, this study focuses on mixtures with validated printability to accurately predict their hardened mechanical properties. Nevertheless, conventional empirical models and isolated experimental approaches remain inadequate for accurate prediction, even within this rheologically qualified range. This inadequacy arises from the complex nonlinear coupling between material parameters, such as the water-to-binder (w/b) ratio and recycled aggregate replacement ratio (RCA-r), and process-related variables, including layer height and loading direction. Therefore, advanced data-driven approaches capable of capturing nonlinear relationships and providing interpretable predictions are essential to comprehensively evaluate the combined effects of material constituents and printing process parameters on the mechanical properties.
Data-driven computation is growing in popularity to tackle such intricacies while bypassing the prohibitive costs of iteratively executing physical experiments[6-11]. Techniques from the broader soft computing domain have proven to be effective for reducing experimental workload while achieving accurate results[12,13]. Specifically, algorithms such as Convolutional Neural Networks[14,15] and gene expression programming (GEP)[16,17] have been employed for modeling recycled aggregate concrete (RAC). Researchers have successfully deployed diverse models for STS prediction, including Artificial Neural Networks[16,18-23], Support Vector Machines[24], and ensemble methods such as random forest (RF)[25,26] and XGBoost[21,27]. Furthermore, recent works have pointed out the great importance of integrating automatic hyperparameter optimization for robust model development, as this mechanism eliminates manual tuning bias and accurately identifies globally optimal configurations[28,29].
Despite its immense potential, three critical limitations hinder the application of machine learning to the complex 3DPRAC system. First, current models exhibit notable insensitivity to printing process parameters. These models focus primarily on material composition mapping while neglecting the unique characteristics of 3D concrete printing. This oversight prevents the quantitative description of the significant anisotropy induced by variables such as layer height and loading direction. Second, existing studies lack generalization capability across diverse material systems, as they are typically confined to singular material domains. Consequently, these models fail to discern universal evolutionary patterns when confronted with heterogeneous datasets comprising RAC,
To address these challenges, this study develops a prediction model for the STS of 3DPRAC that integrates mixture proportions and printing process parameters. GEP is employed as the modeling technique due to its capability to automatically generate explicit mathematical expressions through symbolic regression, offering both transparency and direct applicability in engineering practice. The proposed model incorporates printing layer height and loading direction as key input variables, combined with feature engineering, to enhance interpretability and reveal the underlying mechanisms governing the mechanical behavior of 3DPRAC.
The rest of this paper is structured as follows (as depicted in Figure 1). Section 2 describes the dataset collection and preprocessing, and the GEP model development. Section 3 covers the model performance evaluation and the sensitivity analysis of key parameters. Finally, Section 4 concludes the study.
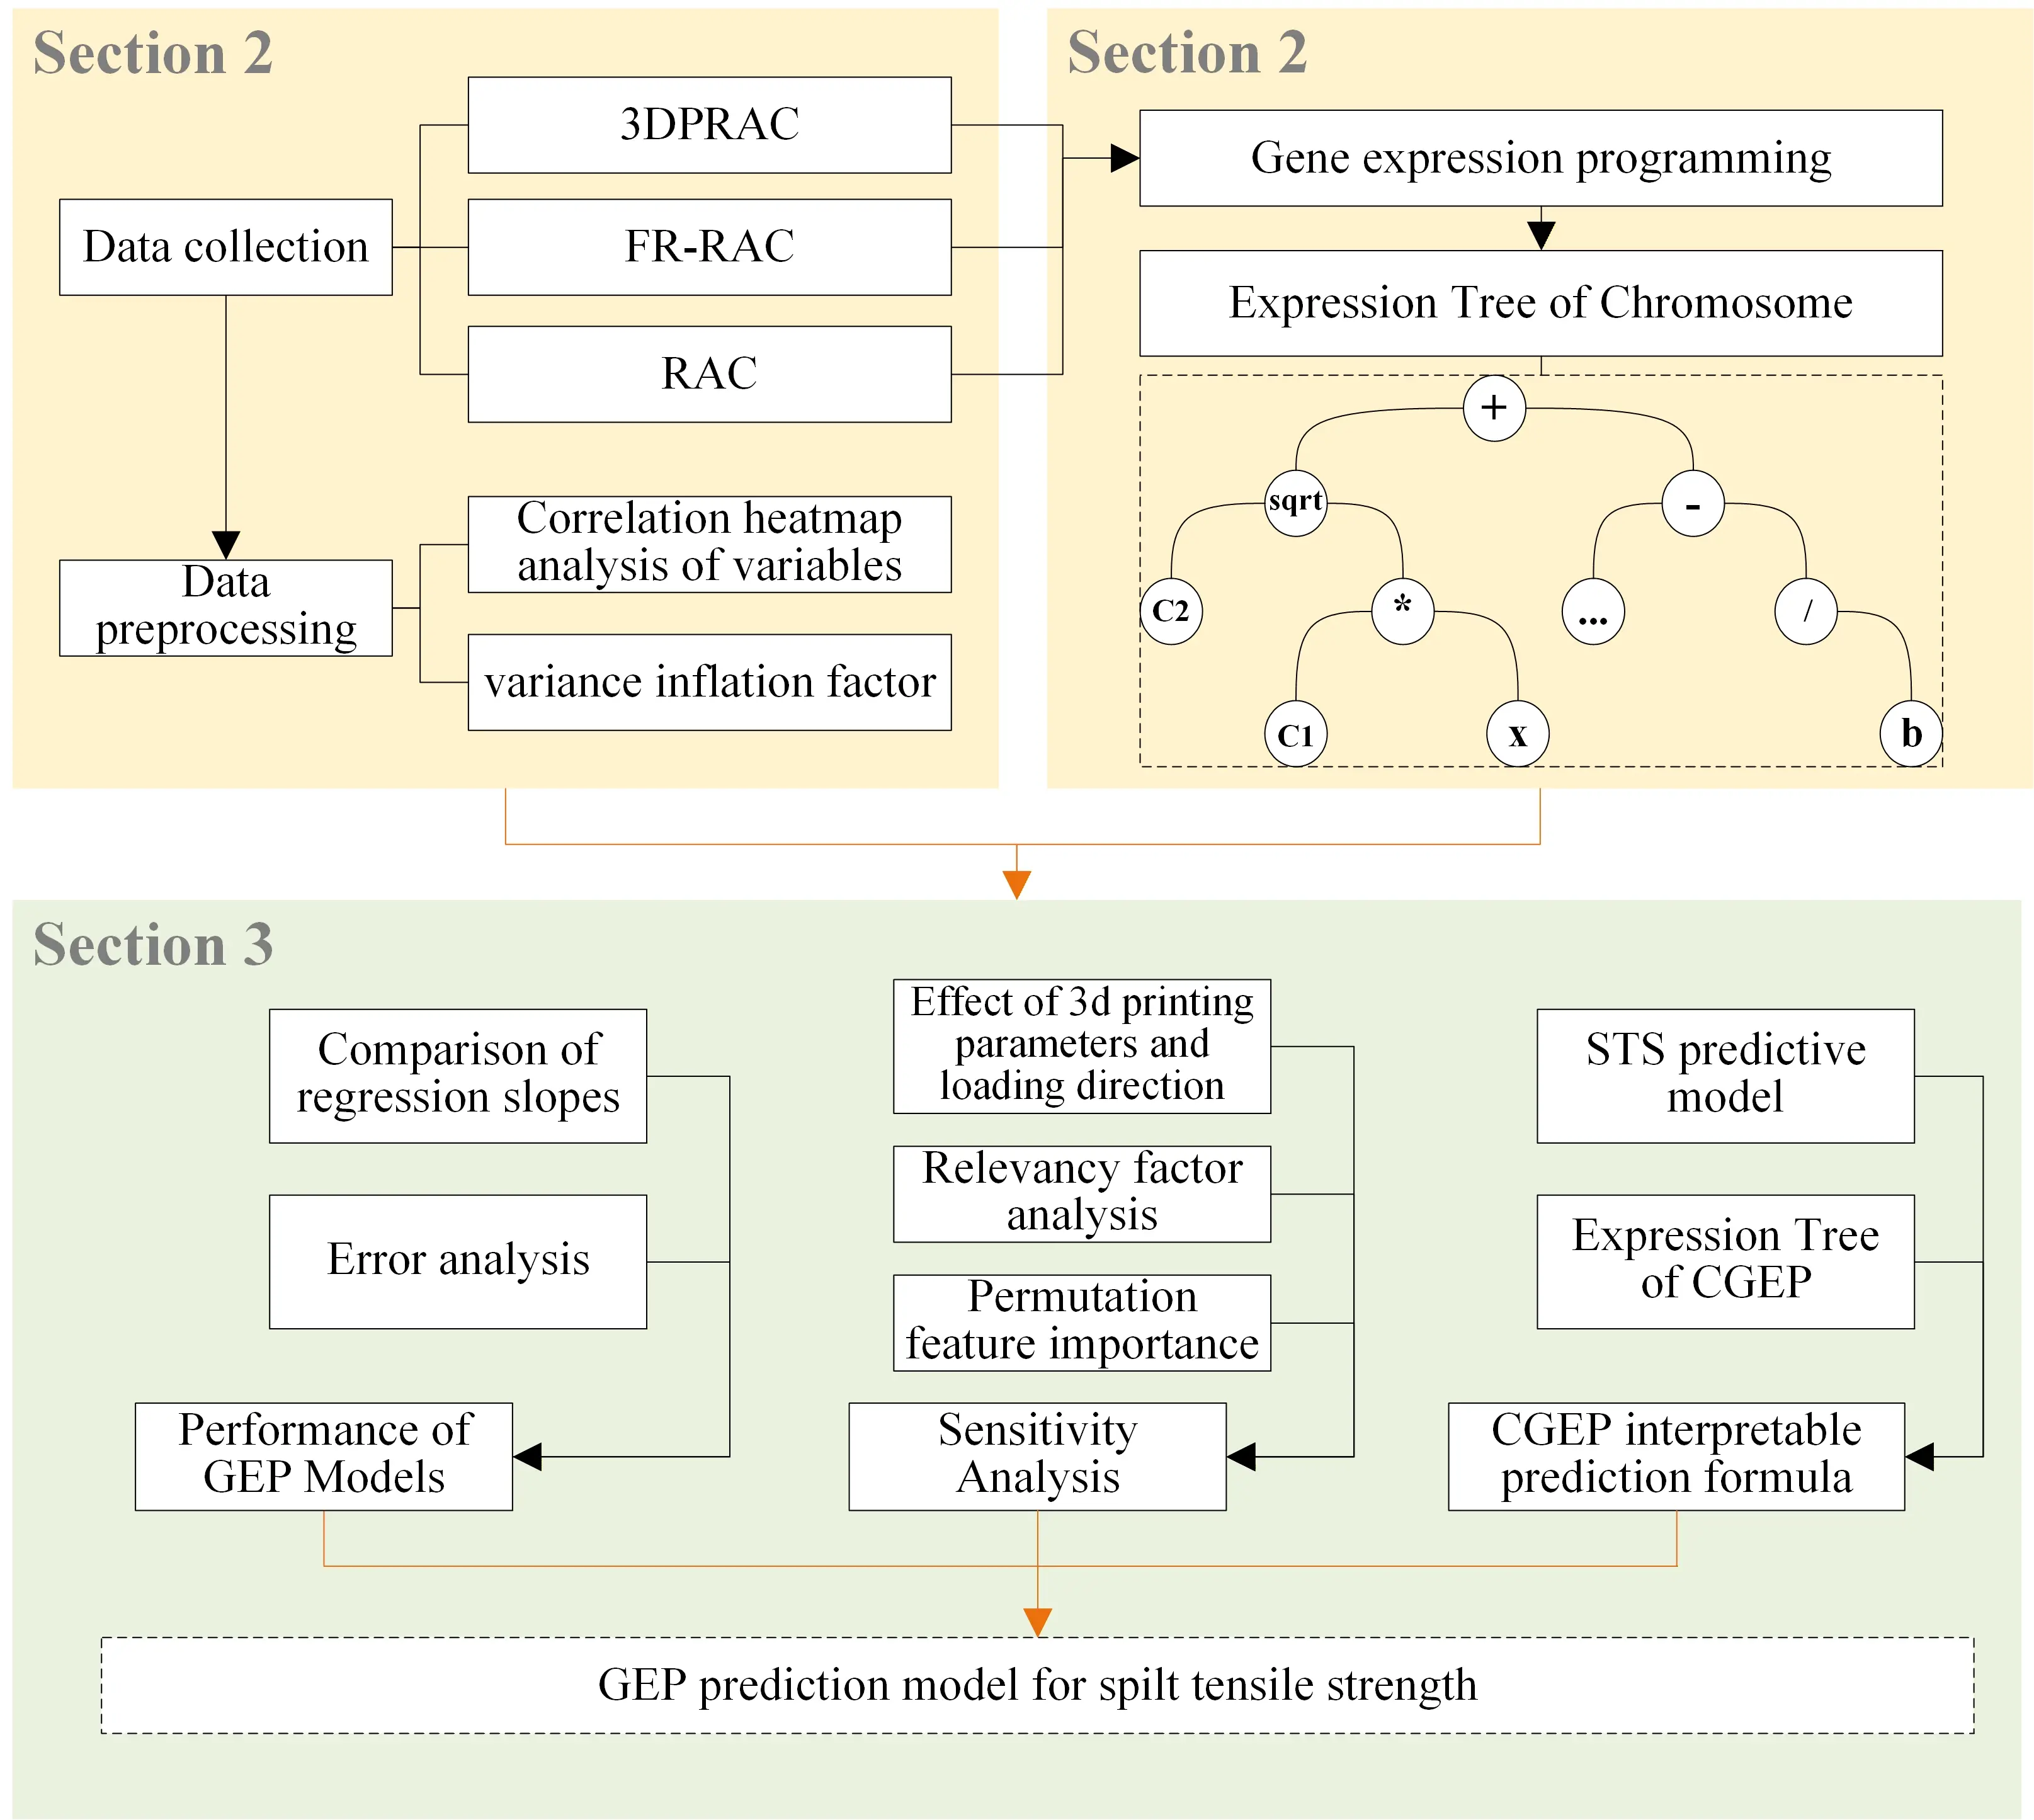
Figure 1. Organizational framework of the study. 3DPRAC: 3D printed recycled aggregate concrete; FR-RAC: fiber-reinforced recycled aggregate concrete; RAC: recycled aggregate concrete; STS: splitting tensile strength; GEP: gene expression programming; CGEP: chaotic gene expression programming.
2. Methodology
2.1 Data collection and description
This study aggregated a dataset of 110 data points from two sources[30-32]. The first database consists of data derived from
This section introduces a dataset construction method for STS prediction of multiple materials. This method differs from traditional methods that rely on learning individual parameter categories. RCA-r and fiber volume (FV) are set as continuous variables to predict global variable relationships, significantly improving the predictive robustness of small sample data models and reducing the risk of overfitting.
The dataset consists of six variables, as presented in Table 1. Load direction (LD) is a binary variable used to represent the anisotropic mechanical behavior of 3D printed concrete, where a value of 0 indicates loading parallel to the printing layer, while a value of 1 indicates loading perpendicular to the printing layer, thereby denoting the parallel and perpendicular loading directions. The average value of 0.35 indicates that approximately 35% of the samples were loaded perpendicular to the printing layer. This mirrors the distribution of the actual data, where RAC and FR-RAC are labeled LD = 0 (i.e., isotropic), while 3DPRAC specimens are classified according to their tested direction. The dataset was randomly sampled and divided into a 70% training set and a 30% testing set.
Table 1. Characteristics of dataset.
| Items | Unit | Notations | Mean | Min | Max | STD | kurtosis | Skewness |
| Water-to-binder ratio | - | w/b | 0.427 | 0.300 | 0.651 | 0.125 | -1.494 | 0.227 |
| RCA replacement ratio | % | RCA-r | 53.042 | 0.000 | 100.000 | 37.697 | -1.311 | -0.037 |
| Fiber volume | % | FV | 0.245 | 0.000 | 5.000 | 0.558 | 48.306 | 5.984 |
| Layer height | mm | LH | 5.890 | 0.000 | 18.000 | 8.486 | -1.469 | 0.747 |
| Loading Direction | - | LD | 0.350 | 0.000 | 1.000 | 0.470 | -1.620 | 0.650 |
| Age | d | Age | 16.400 | 3.000 | 28.000 | 10.200 | -1.250 | 0.150 |
| Splitting Tensile Strength | MPa | STS | 3.095 | 1.210 | 6.720 | 1.063 | 0.479 | 0.653 |
STD: standard deviation; RCA-r: recycled aggregate replacement ratio; FV: fiber volume; LH: layer height; LD: load direction; STS: splitting tensile strength;
2.2 Data preprocessing
2.2.1 Feature engineering
Data preprocessing and feature engineering constitute the cornerstone of predictive accuracy and interpretability in machine learning applications. A physics-informed variable processing strategy was formulated to leverage the capacity of GEP for extracting explicit mathematical expressions. Capturing of the underlying physical mechanisms governing materials and processes is achieved by converting discrete experimental descriptions into continuous input signals with distinct physical implications.
The continuous mapping of material parameters was realized by leveraging the decoupling strategy described in Section 2.1, taking RCA-r and FV as continuous numerical inputs. This yields a continuous physical response surface over a range of material systems, allowing for an analytical description of the nonlinear relationships between mixture proportions and mechanical strength.
LD is a variable reflecting the response differences of 3D printing materials to loading directions. When loads are applied parallel to the printing direction (LD = 0), the continuous material strength is primarily tested, whereas when applied perpendicular to the printing direction (LD = 1), the performance is related to interlayer properties. This assignment encodes a physical hypothesis where an LD value of 1 triggers interlayer weakening. Accordingly, the negative LD coefficient in the GEP-evolved formula captures the strength loss due to interlayer defects.
The dimension of time was introduced by making age a predictor variable, allowing for the learning of the decay rate of cement hydration using a logarithmic or exponential function. Finally, min-max normalization (Eq. (1)) was applied to scale all continuous features to the range [0, 1], reducing scale differences and allowing them to contribute equally during training, which accelerated convergence.
where Xmin and Xmax denote the minimum and maximum values of the feature X, respectively.
2.2.2 Statistical analysis of variables
Figure 2 shows a correlation heatmap to assess inter-variable dependencies and to evaluate the degree of multicollinearity. Cell color intensity indicates the strength of correlations between variables. Layer height (LH) demonstrated a strong positive correlation with LD (r = 0.90), while the w/b ratio showed a strong negative correlation with LH (r = -0.71). Most other absolute correlation coefficients remained below 0.3, thereby avoiding potential multicollinearity issues typically associated with strong correlations (|r| > 0.5). This overall low level of correlation suggested that this dataset had a reasonable level of independence and would not introduce bias into model training.
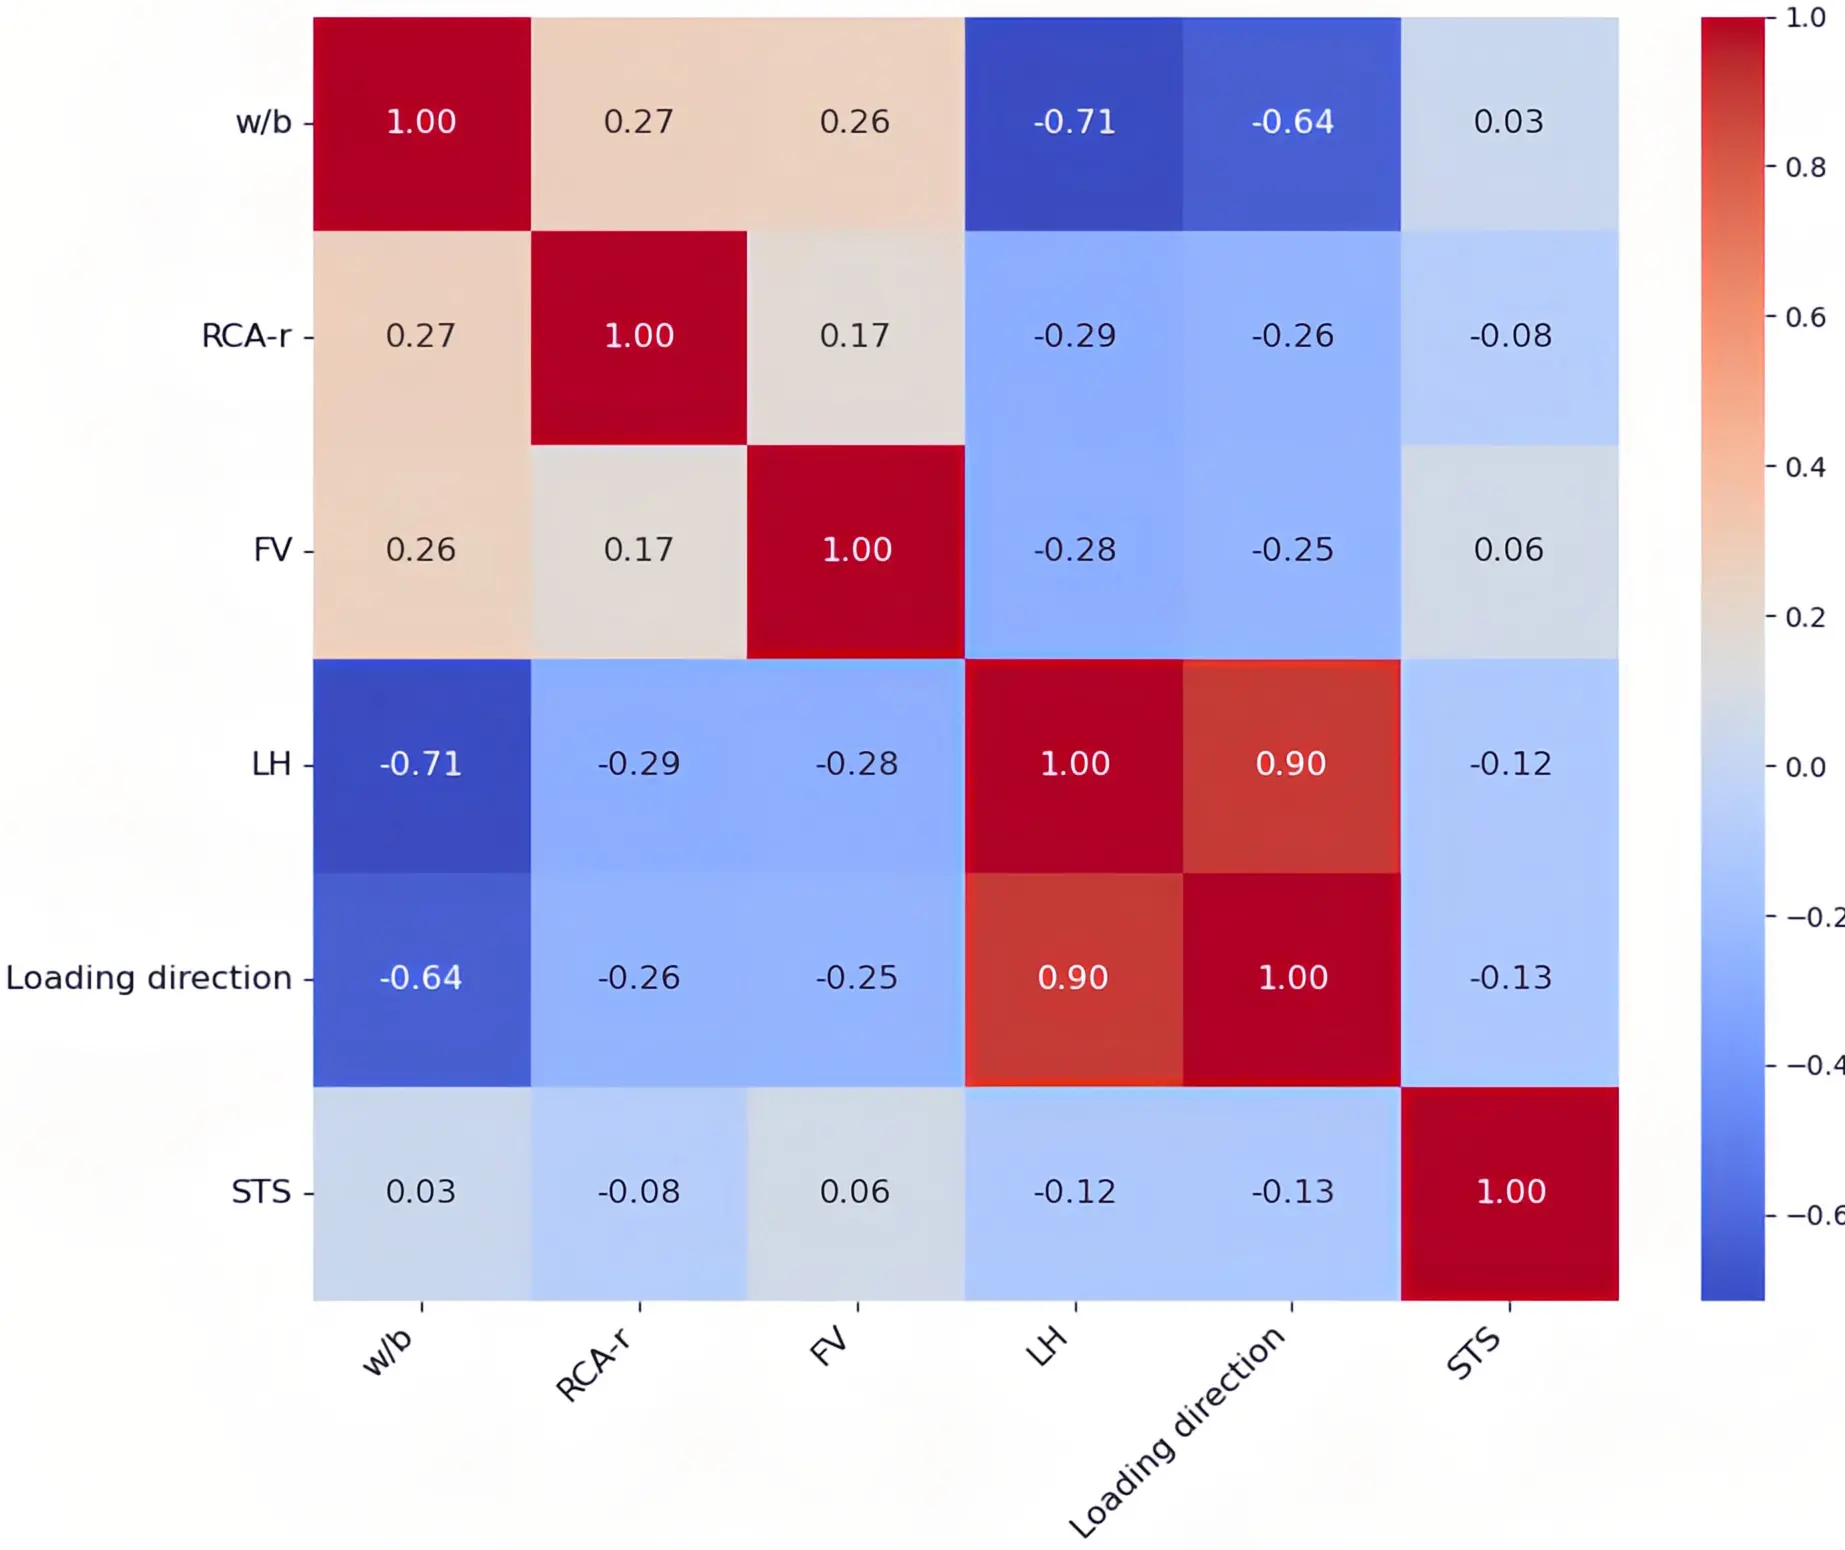
Figure 2. Correlation heatmap analysis of variables. FV: fiber volume; STS: splitting tensile strength; RCA-r: recycled aggregate replacement ratio; LH: layer height.
The linear correlations between the target variable STS and individual input variables were uniformly low, with the maximum coefficient reaching only 0.32 for Age, and others remaining below 0.2. This observation underscored the inadequacy of single physical parameters in elucidating strength variations, thereby necessitating the adoption of holistic multi-parametric analysis and non-linear modeling approaches to capture the complex synergistic effects among variables.
Variance inflation factor (VIF) and Tolerance were calculated to evaluate the severity of multicollinearity, as detailed in Table 2. All VIF indices remained significantly below the critical threshold of 10, indicating negligible multicollinearity risks, despite marginal elevations observed for w/b (3.549) and RCA-r (3.214). Tolerance values for FV and LH exceeded 0.75, supporting the robust independence among predictors.
Table 2. VIF and tolerance values for each independent variable.
| Inputs | |||||
| w/b | RCA-r | FV | LH | ||
| Collinearity Statistics | VIF | 3.549 | 3.214 | 1.317 | 1.219 |
| Tolerance | 0.282 | 0.311 | 0.759 | 0.819 | |
VIF: variance inflation factor; RCA-r: recycled aggregate replacement ratio; FV: fiber volume; LH: layer height.
The LD variable was deliberately excluded from the multicollinearity assessment based on two pivotal considerations. First, regarding statistical applicability, the discrete categorical nature of LD renders it incompatible with VIF metrics intended primarily for continuous linear dependencies. Second, an inherent structural coupling between LD and the material system stems from the contrast between the single-direction constraint of non-3D printed specimens and the multi-directional nature of 3D printed counterparts. This distinction generates a correlation artifact stemming from experimental design rather than genuine physical collinearity. Accordingly, LD was retained as a distinct control parameter to ensure the decoupled elucidation of anisotropic effects on STS.
Both correlation analysis and VIF diagnostics confirmed that the selected features met the statistical assumptions for multivariate regression, providing a sound basis for model development.
2.3 Gene expression programming
2.3.1 GEP working mechanism
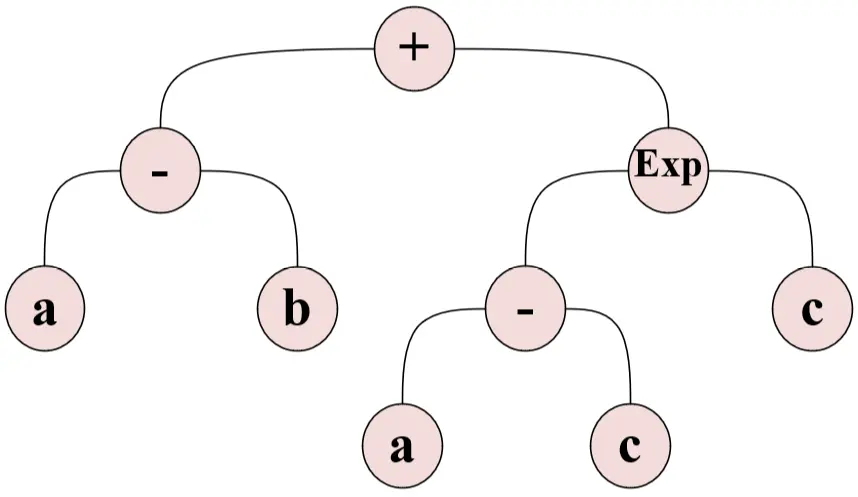
GEP is an advanced evolutionary computation methodology based on the constructs of natural selection and genetics. Resulting candidate solutions are coded in linear chromosomes of fixed length called the genotype, which are then mapped to non-linear expression trees called the phenotype (Figure 3). GEP achieves a balance between rapid convergence and superior generalization through the unconstrained evolution of mathematical expressions that are intelligible and explicit[33,34]. The chromosome assumes a head-tail architecture, with the head containing both function and terminal symbols and the tail containing terminal symbols only. This structure means that chromosomes that have been changed by mutation or crossover can map directly onto syntactically valid expression trees, thus allowing the free optimization of challenging mathematical regularities.
The GEP model was created through an iterative optimization process, illustrated in Figure 4. It began with the random generation of individuals, all of which were expressed as chromosomes in Karva notation. The algorithm then followed with a core evolutionary loop whereby a fitness function assessed each phenotype, and the principle of the survival of the fittest dictated that the finest candidates selected served as the breeding pool. Then, diversity was retained in the population, and the solution space was elaborated by genetic operations of replication, crossover, and mutation until user-defined termination criteria were satisfied.
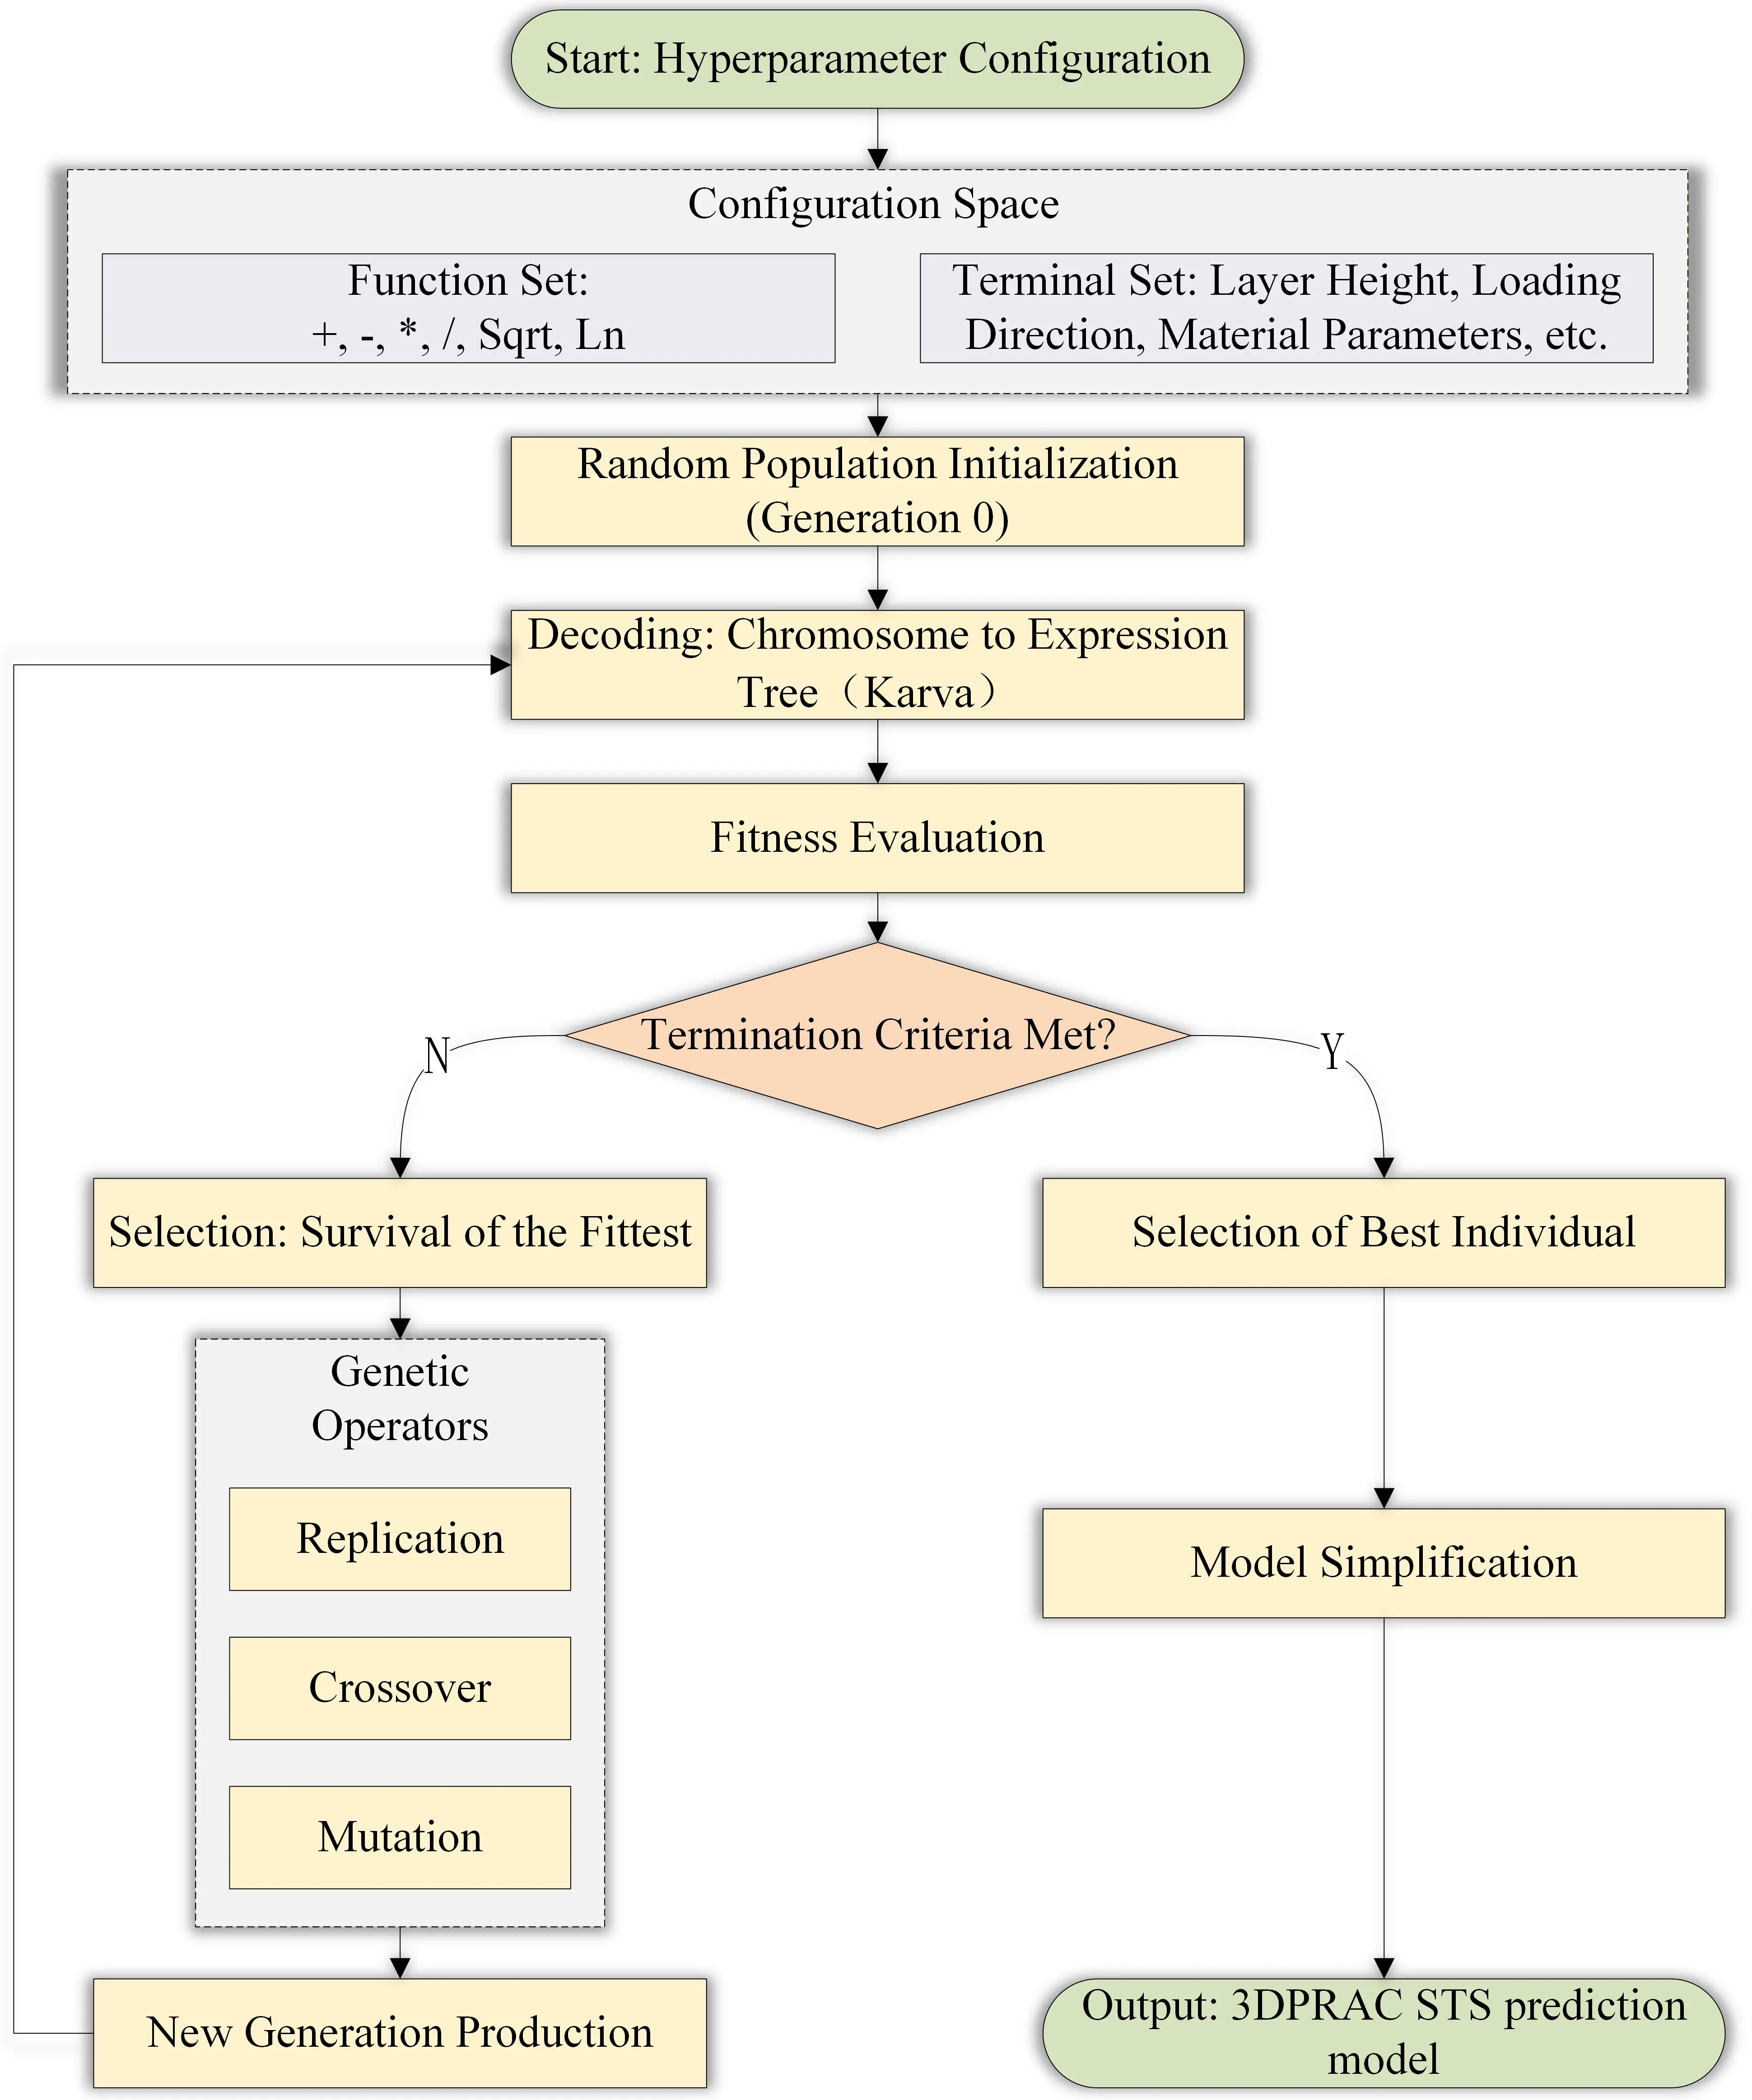
Notably, model performance is sensitive to the proper tuning of hyperparameters, including population size, head length, and probabilities for the genetic operators. The complex physico-mechanical behavior of 3D printed recycled concrete was captured using diverse functions, including arithmetic, algebraic, and nonlinear operators.
In this study, an STS prediction model was established with the GEP for multiple material systems, demonstrating great precision for 3D printed recycled concrete among others. It was essential to transform complex data-driven results into achievable design tools, providing explicit mathematical expressions that were easy to apply directly in engineering, thus offering strong theoretical support for mix design and performance prediction.
2.3.2 Model design and parameter configuration
This study developed two GEP models with distinct hyperparameter configurations (designated CGEP1 and CGEP2) using the GeneXproTools 5.0 platform. The objective was to systematically optimize prediction accuracy and evaluate the influence of model complexity. CGEP1 served as the baseline, featuring 4 genes and 60 chromosomes with a function set of basic arithmetic operators (such as +, -, *, and /). CGEP2 enhanced solution quality through structural adjustment by augmenting the gene count to 5, setting the population size to 50, and incorporating square root (Sqrt) and natural logarithm (Ln) functions to capture nonlinear characteristics. A head length of 12 was maintained for both models, with addition utilized as the linking function to integrate substructures derived from individual genes. Detailed hyperparameter settings are listed in Table 3.
Table 3. Features of CGEP models.
| Feature | CGEP1 | CGEP2 |
| Function Set | +, -, *, / | +, -, *, /, Sqrt, Ln |
| Linking Function | Addition | Addition |
| Number of Genes | 4 | 5 |
| Chromosomes | 60 | 50 |
| Head Size | 12 | 12 |
| Mutation Rate | 0.00138 | 0.04000 |
| Crossover Rate | 0.2 | 0.3 |
| Fitness Function | RMSE | RMSE |
CGEP: chaotic gene expression programming; RMSE: root mean square error.
The effective implementation of GEP hinges on the precise definition of five core components, comprising the function set, terminal set, fitness function, control parameters, and termination criteria. An initial population was randomly generated based on the selected function and terminal sets. Chromosomes encoded expression trees of varying topologies within the head and tail architecture. Sub-expression trees (Sub-ETs) from individual genes were aggregated into a final mathematical model via a linking function. Throughout the evolutionary process, root mean square error (RMSE) served as the fitness function to quantify individual performance. Subsequently, the algorithm iteratively optimized the population through genetic operators, including reproduction, crossover, and mutation, until the maximum iteration count was reached or model convergence was achieved.
2.4 Model evaluation indicators
Three standard statistical criteria were adopted for assessing the goodness of fit of the GEP models: the Coefficient of Determination (R2), mean absolute error (MAE), and RMSE. These are defined mathematically by Eqs. (2) to (4):
where, n denotes the total sample size, while Xi and Yi represent the predicted and actual values for the i-th sample, respectively, with
Overall, R2 measures linear correlation, while the MAE and RMSE quantify the predictive discrepancies. The comparison of performance outcomes across training and testing datasets effectively diagnosed potential overfitting, ensuring robust generalization ability to unknown data.
2.5 Sensitivity analysis
This study used both the relevance factor (r) and permutation feature importance (PFI) to systematically assess the relative effects of individual input variables on model predictions.
2.5.1 Relevance factor analysis
The relevance factor assesses the linear correlation strength between input variables and model outputs. It elucidates the relative statistical significance of each parameter by quantifying the direct impact of variations in individual input parameters on STS predictions. The mathematical definition is presented in Eq. (5):
where Ij,i is the j-th input value of the i-th sample and Oi is the predicted STS output for the i-th sample.
2.5.2 Permutation feature importance
PFI evaluates feature importance by randomly permuting feature values and observing the decline in model performance. The greater the performance degradation, the more important the feature is, as this reveals its contribution to predictions. This is calculated as defined in Eq. (6):
where MAEo is the mean absolute error on the original dataset and MAEp is the mean absolute error obtained by randomly permuting a specific input variable. Higher PFI values indicate stronger variable influence on the model predictions, whereas lower values indicate weaker influence. Values close to zero suggest that the corresponding input variables have little impact. PFI can effectively identify key variables that affect STS performance, providing a foundation for subsequent model refinement and feature selection.
3. Results and Discussion
This section constitutes a comprehensive evaluation of the prediction capabilities of the GEP-based unified STS framework. First, the overall prediction accuracy and error distribution are statistically analyzed and compared. Second, sensitivity analysis reveals the influence of input variables, particularly 3D printing parameters and loading direction, on STS. Finally, the explicit GEP formula is analyzed to demonstrate the model’s interpretability and effectiveness.
3.1 Overall prediction performance of GEP models
As detailed in Section 2.3.2, two GEP models featuring distinct topological architectures and hyperparameter settings, designated as CGEP1 and CGEP2, were constructed. This section aims to identify the optimal model through quantitative evaluation on the testing dataset.
3.1.1 Statistical metrics and regression analysis
R2, RMSE, and MAE were used as performance metrics to evaluate predictive accuracy. Table 4 presents the performance metrics for CGEP1 and CGEP2 on the training and testing datasets.
Table 4. Comparison of performance metrics for CGEP models.
| Models | Datasets | R2 | RMSE (MPa) | MAE (MPa) |
| CGEP1 | Training sets | 0.758 | 0.512 | 0.408 |
| Testing sets | 0.545 | 0.752 | 0.588 | |
| CGEP2 | Training sets | 0.895 | 0.339 | 0.267 |
| Testing sets | 0.914 | 0.312 | 0.244 |
CGEP: chaotic gene expression programming; RMSE: root mean square error.
As shown in Table 4, while both models demonstrated reasonable fitting proficiency during training, performance discrepancies on the testing set reveal fundamental differences in generalization potential. The lower R² obtained for CGEP1 suggests limited predictive capacity for unseen data, while elevated RMSE and MAE values confirm significant deviations when processing new samples. By contrast, CGEP2 exhibits superior predictive fidelity. An R2 of 0.914 on the testing set indicates that this model captures over 91% of the variability in the target variable, achieving high concordance between predicted and actual values. Moreover, CGEP2 achieves significantly lower RMSE and MAE values than CGEP1. This improvement stems from the increased number of genes, extended head length, and the inclusion of non-linear operators (e.g., Sqrt), which enable CGEP2 to better capture the complex
Figure 5 presents the regression analysis between predicted and experimental values for CGEP1 and CGEP2. The figure includes data from both training and testing sets, as well as the ideal diagonal (y = x) and ± 5% error bands. Figure 5a shows that CGEP1 exhibits a scattered distribution, with many data points deviating from the 1:1 line and falling outside the ± 5% error bands, indicating predictive instability. In contrast, CGEP2 (Figure 5b) shows superior robustness, as most points are clustered around the ideal diagonal and fit within ± 5% margins. Notably, although 3D printed concrete typically exhibits significant strength decay in the Z-direction (vertical loading) due to weak inter-layer interfaces, the median prediction error for CGEP2 in the Z-direction is only marginally higher than that in the X-direction. This indicates that CGEP2 accurately predicts the anisotropic behavior and accounts for the loss of strength due to inter-layer defects.
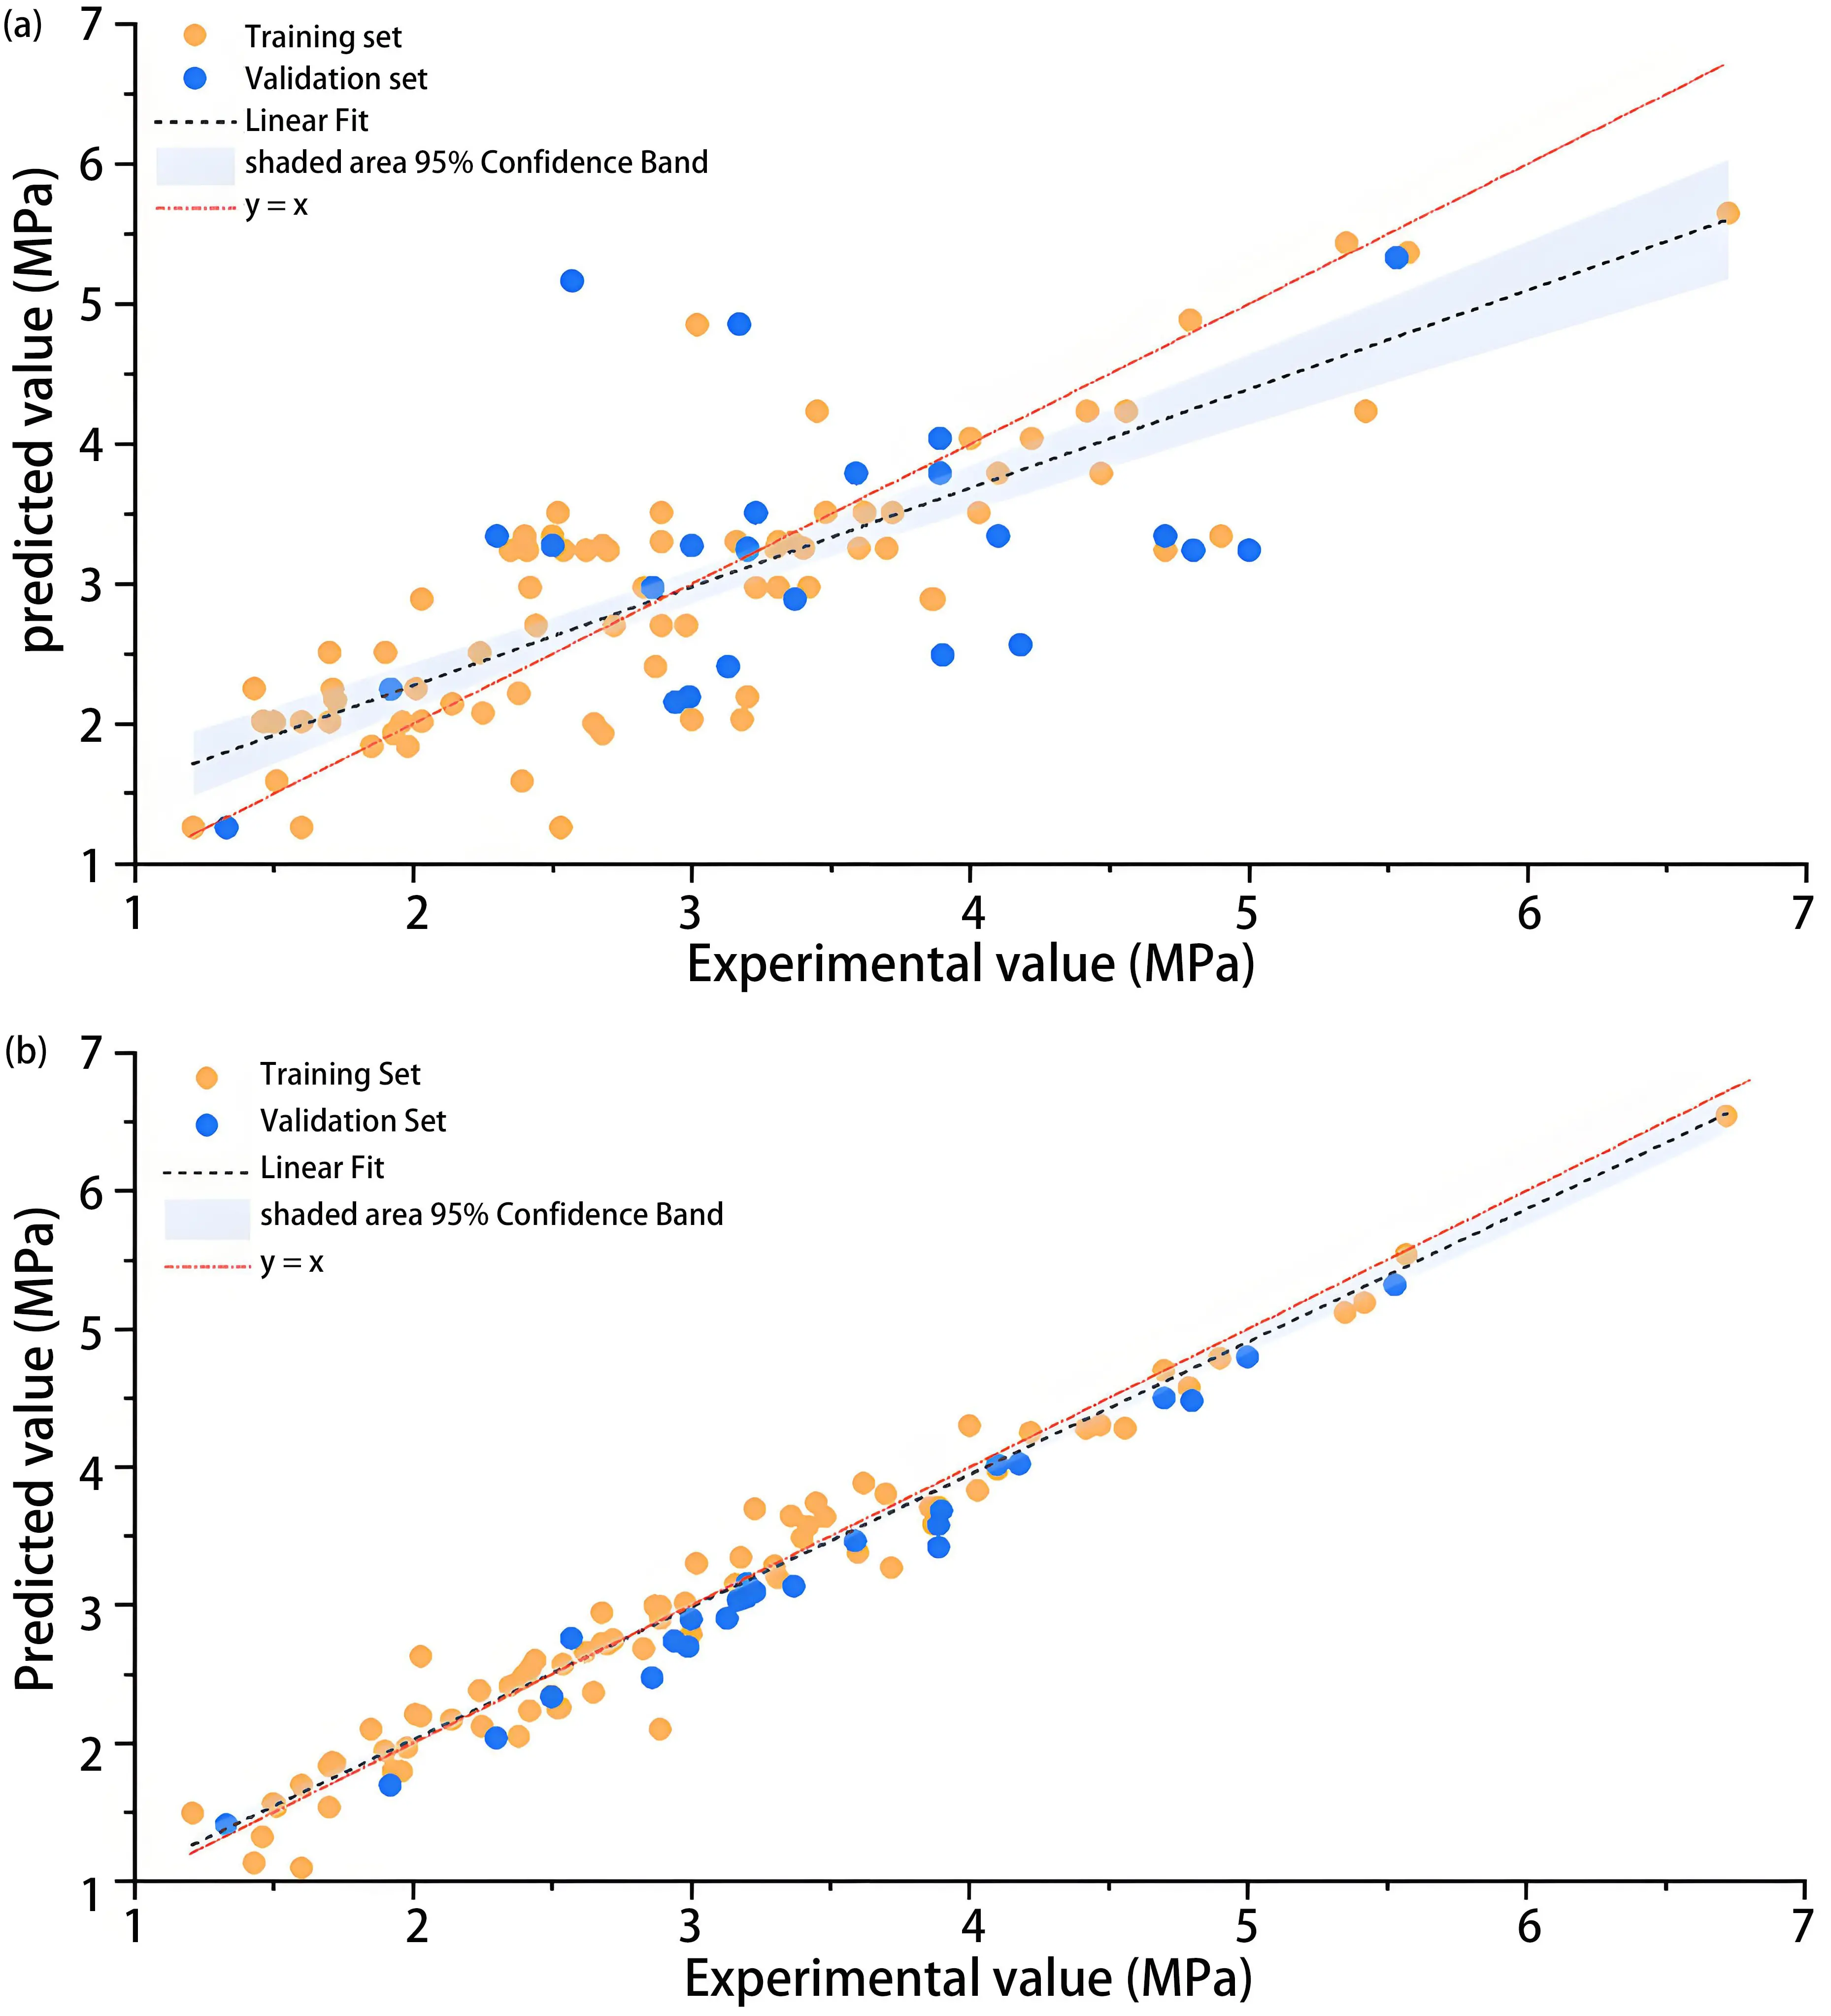
Figure 5. Regression plots of predicted versus experimental values: (a) CGEP1 model; (b) CGEP2 model. CGEP: chaotic gene expression programming.
The observed performance disparity stems fundamentally from the physical applicability of the employed function sets. CGEP1 attempts to approximate highly non-linear material behaviors by relying solely on rational fractions constrained by basic arithmetic operations, which inevitably results in predictive dispersion. Conversely, incorporating non-linear operators into the function set of CGEP2 endows the model with superior mathematical expressiveness. Specifically, the Sqrt function facilitates the capture of
Next, this study designed comparative experiments with two widely used models, multiple linear regression (MLR) and RF, to further validate the performance advantages of CGEP2. MLR represents traditional linear modeling approaches, while RF represents ensemble learning methods. All models were trained and evaluated on identical datasets to ensure fair comparison.
The performance metrics of the three models are summarized in Table 5. MLR achieved a testing R2 of only 0.647 with an RMSE of 0.623 MPa, indicating that linear assumptions fail to capture the nonlinear behavior of fiber reinforcement and hydration evolution. RF, through an ensemble of 200 decision trees with optimized hyperparameters, achieved higher accuracy (testing R2 = 0.883,
Table 5. Performance comparison of CGEP2 with MLR and RF models.
| Model | Training C | Testing R2 | Testing RMSE (MPa) | Testing MAE (MPa) |
| MLR | 0.682 | 0.647 | 0.623 | 0.498 |
| RF | 0.967 | 0.883 | 0.359 | 0.281 |
| CGEP2 | 0.895 | 0.914 | 0.312 | 0.244 |
CGEP: chaotic gene expression programming; MLR: multiple linear regression; RF: random forest; RMSE: root mean square error; MAE: mean absolute error.
In contrast, CGEP2 achieved testing R2 = 0.914, RMSE = 0.312 MPa, and MAE = 0.244 MPa, outperforming RF by 3.5% in R2 and 13.1% in RMSE reduction, while providing a fully interpretable analytical formula. Additionally, the minimal gap between training R2 and testing R2 demonstrates superior generalization capability without the overfitting issues observed in RF.
In summary, RF achieves high accuracy but sacrifices interpretability and exhibits overfitting, while MLR lacks predictive accuracy. In contrast, CGEP2 successfully balances both requirements, delivering superior performance with complete mathematical transparency.
3.1.2 Error distribution analysis
The absolute error distribution for the testing set (Figure 6) is utilized to scrutinize predictive stability at the individual sample level, elucidating point-wise error characteristics across the entire data domain.
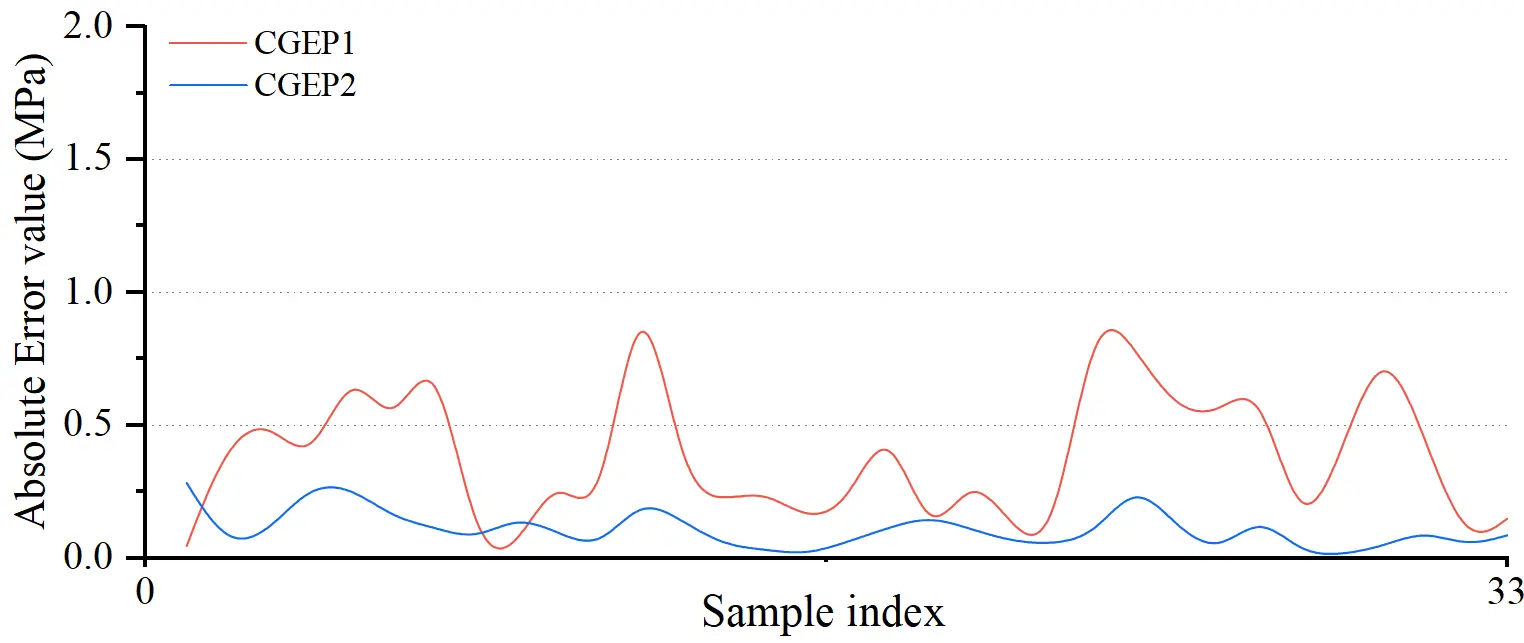
Figure 6. Distribution of absolute errors for CGEP predictions on the testing set. CGEP: chaotic gene expression programming.
The error trajectory for CGEP1 manifests pronounced instability (Figure 6), characterized by high-frequency, large-amplitude oscillations, where absolute error peaks for multiple samples surpass 0.8 MPa. Such erratic fluctuations suggest hypersensitivity to specific sample features and limited robustness. In contrast, CGEP2 exhibits exceptional stationarity, with errors consistently maintained within 0.3 MPa. The significantly reduced magnitude and frequency of errors for CGEP2, relative to CGEP1, indicate that this model not only excels in aggregate performance but also maintains superior consistency in local, individual sample predictions.
Overall, multi-dimensional evaluations based on R2, RMSE, MAE, and error distribution confirm that CGEP2 significantly outperforms CGEP1 in predictive accuracy, generalization capability, and stability. CGEP2 effectively transcends the limitations of basic algebraic operations by leveraging an optimized gene topology and an extended non-linear function set, precisely capturing intricate
3.2 Sensitivity analysis
This section deconstructs the internal decision-making logic of the CGEP2 model to quantify the contribution weights of input parameters to STS. It elucidates the intrinsic influence of material and processing parameters on STS from dual dimensions of linear correlation and non-linear contribution through the evaluation of relevance factors and PFI.
3.2.1 Relevance factor analysis
Figure 7 shows the relevance of input variables to STS based on the training dataset. The magnitude of r signifies the strength of influence of each variable on STS, with positive and negative values denoting corresponding correlations.
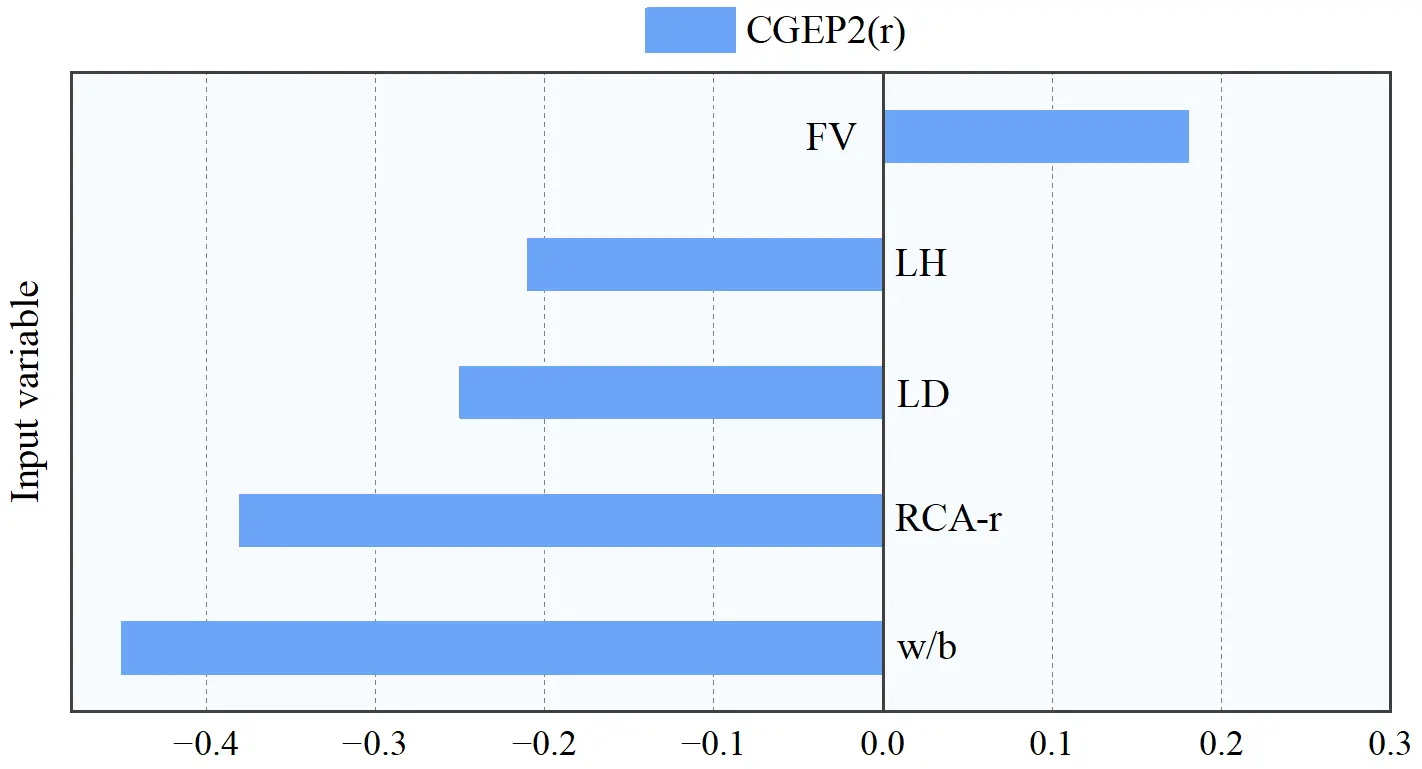
Figure 7. Relevance factor between input variables and predicted STS. CGEP: chaotic gene expression programming; FV: fiber volume; LH: layer height; LD: load direction; RCA-r: recycled aggregate replacement ratio.
The w/b ratio displays the highest negative correlation (r = -0.45), consistent with micromechanics theory, where higher water content increases capillary porosity and reduces matrix density. RCA-r also shows a significant negative correlation (r = -0.38), confirming the detrimental effect of attached porous mortar and weak interfacial transition zones. The printing parameters LD and LH exhibit distinct negative correlations (r = -0.25 and -0.21, respectively). The former captures the anisotropy where cracks propagate along weak inter-layer interfaces under vertical loading, while the latter indicates that increased layer thickness impairs bonding by reducing relative contact area or by enlarging pore defects. Conversely, the FV presents a positive correlation (r = 0.18), validating the bridging mechanism that effectively facilitates stress transfer and inhibits the transition from micro- to macro-cracks.
3.2.2 Permutation feature importance
A PFI analysis was performed to identify non-linear relationships of individual variables, in addition to the linear relationships defined by the relevance factors. Table 6 shows both PFI score and rank of importance for each input variable.
Table 6. Permutation feature importance values and rankings.
| Input Feature | MAE (Permuted) | PFI | Rank |
| w/b | 0.480 | 0.250 | 1 |
| RCA-r | 0.410 | 0.180 | 2 |
| LD | 0.350 | 0.120 | 3 |
| LH | 0.310 | 0.080 | 4 |
| FV | 0.280 | 0.050 | 5 |
| Material Type | 0.250 | 0.020 | 6 |
MAE: mean absolute error; PFI: permutation feature importance; RCA-r: recycled aggregate replacement ratio; LD: load direction; LH: layer height; FV: fiber volume.
The PFI results align closely with the relevance factor analysis, confirming w/b and RCA-r as the paramount determinants of STS. This consensus indicates that matrix densification dictated by w/b and aggregate quality determined by the RCA replacement ratio constitute the fundamental intrinsic factors controlling tensile strength. Notably, the LD ranks third, surpassing both LH and FV. This ranking quantitatively underscores that the structural anisotropy of 3D printed concrete often exerts a governing influence on mechanical performance, outweighing the impact of specific compositional adjustments. Consequently, the presence of weak
In summary, the PFI analysis validates model robustness and offers explicit engineering guidance. For the mix design of 3D printed recycled concrete, priority should be assigned to controlling the w/b ratio and RCA content. Furthermore, rigorous alignment between printing paths and loading directions is essential to mitigate strength reduction induced by anisotropy.
3.2.3 Effect of 3D printing parameters and loading direction
This section presents a decoupling analysis of layer height and loading direction to elucidate the specific impacts of 3D printing parameters on mechanical performance.
The sensitivity analysis indicates a negative correlation between LH and STS (r = -0.21), reflecting the defect amplification effect of layer height. STS paradoxically declines as LH increases, despite the significant negative correlation between LH and the w/b ratios in the training dataset. In this dataset, higher layers typically correspond to lower w/b ratios (stiffer inks). This counter-intuitive trend reveals that physical defects induced by layer geometry override the benefits of matrix densification. Specifically, increased layer height enlarges the critical defect size and compromises inter-layer compaction. Consequently, these geometric defects negate the strength enhancement theoretically expected from lower w/b ratios.
The dependency of STS on loading direction represents the intrinsic distinction between 3D printed and cast concrete. The prediction error distribution for 3DPRAC samples across varying loading directions is depicted in Figure 8 to quantify the impact of this anisotropy on predictive accuracy. The statistical characteristics of the errors reveal distinct mechanisms governing prediction accuracy:
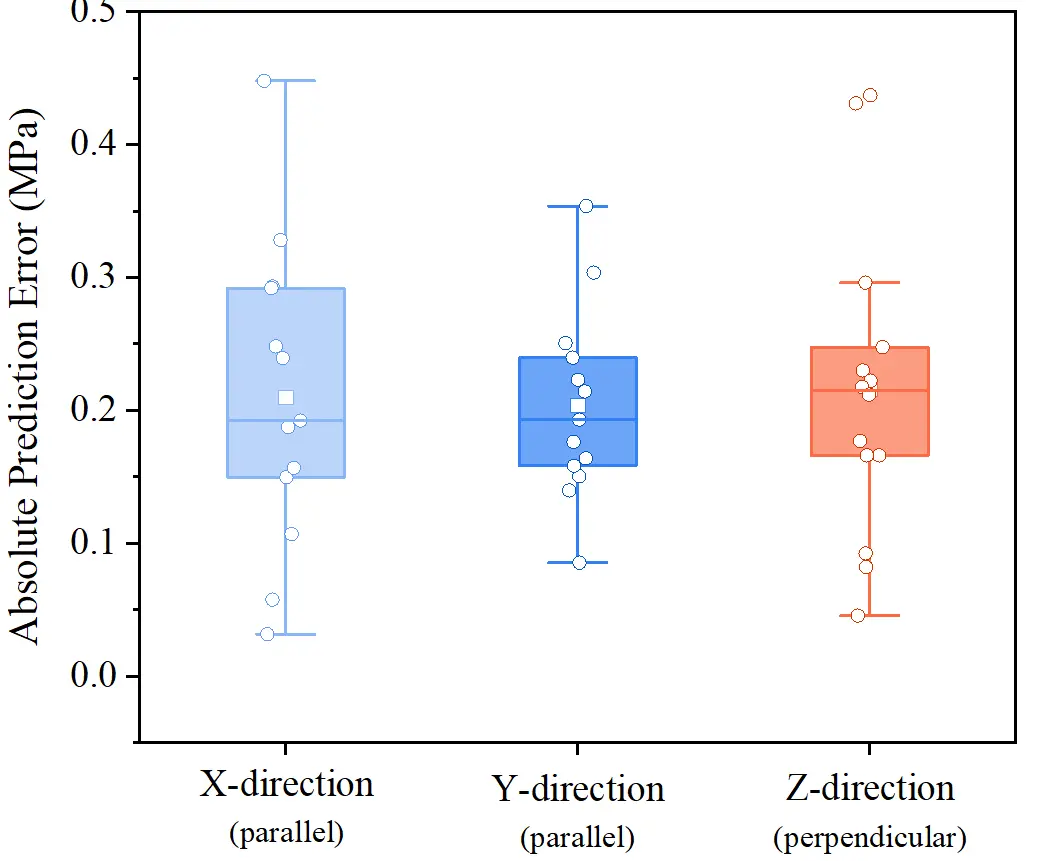
Figure 8. Distribution of prediction errors for 3DPRAC samples under different loading directions. 3DPRAC: 3D printed recycled aggregate concrete.
(1) The median prediction error in the Z-direction (0.21 MPa) marginally exceeds that in the X-direction (0.19 MPa) and Y-direction (0.18 MPa). The high variability of interfacial bonding quality, influenced by factors such as printing time intervals and surface moisture evaporation, maximizes strength dispersion when tensile stress acts perpendicularly to the inter-layer interfaces. This consequently increases prediction difficulty.
(2) Although the X-direction (parallel to the printing path) exhibits a lower median error, its error distribution range (whiskers) is notably extensive, with a maximum error reaching 0.45 MPa. This is likely attributed to process-induced heterogeneity along the printing path. Nozzle start-stops, velocity fluctuations, and material accumulation at corners introduce additional microscopic defects in the X-direction, causing strength deviations in certain samples.
(3) In contrast, the Y-direction displays the most compact interquartile range and the narrowest error span. This indicates that the material exhibits the most stable mechanical response under lateral loading modes, resulting in the highest predictive confidence for the model.
In summary, the CGEP2 model not only successfully captures the strength anisotropy stemming from weak inter-layer interfaces (characterized by lower strength and higher unpredictability in the Z-direction) but also sensitively reveals process instability along the printing path (characterized by significant fluctuations in the X-direction).
3.3 Interpretable prediction formula
This study established an explicit formula applicable to both 3D printed and conventional recycled concrete, grounded in the evolutionary principles of GEP. The formula is constructed through the linear superposition of four Sub-ETs, as shown in Figure 9. The formula is expressed as:
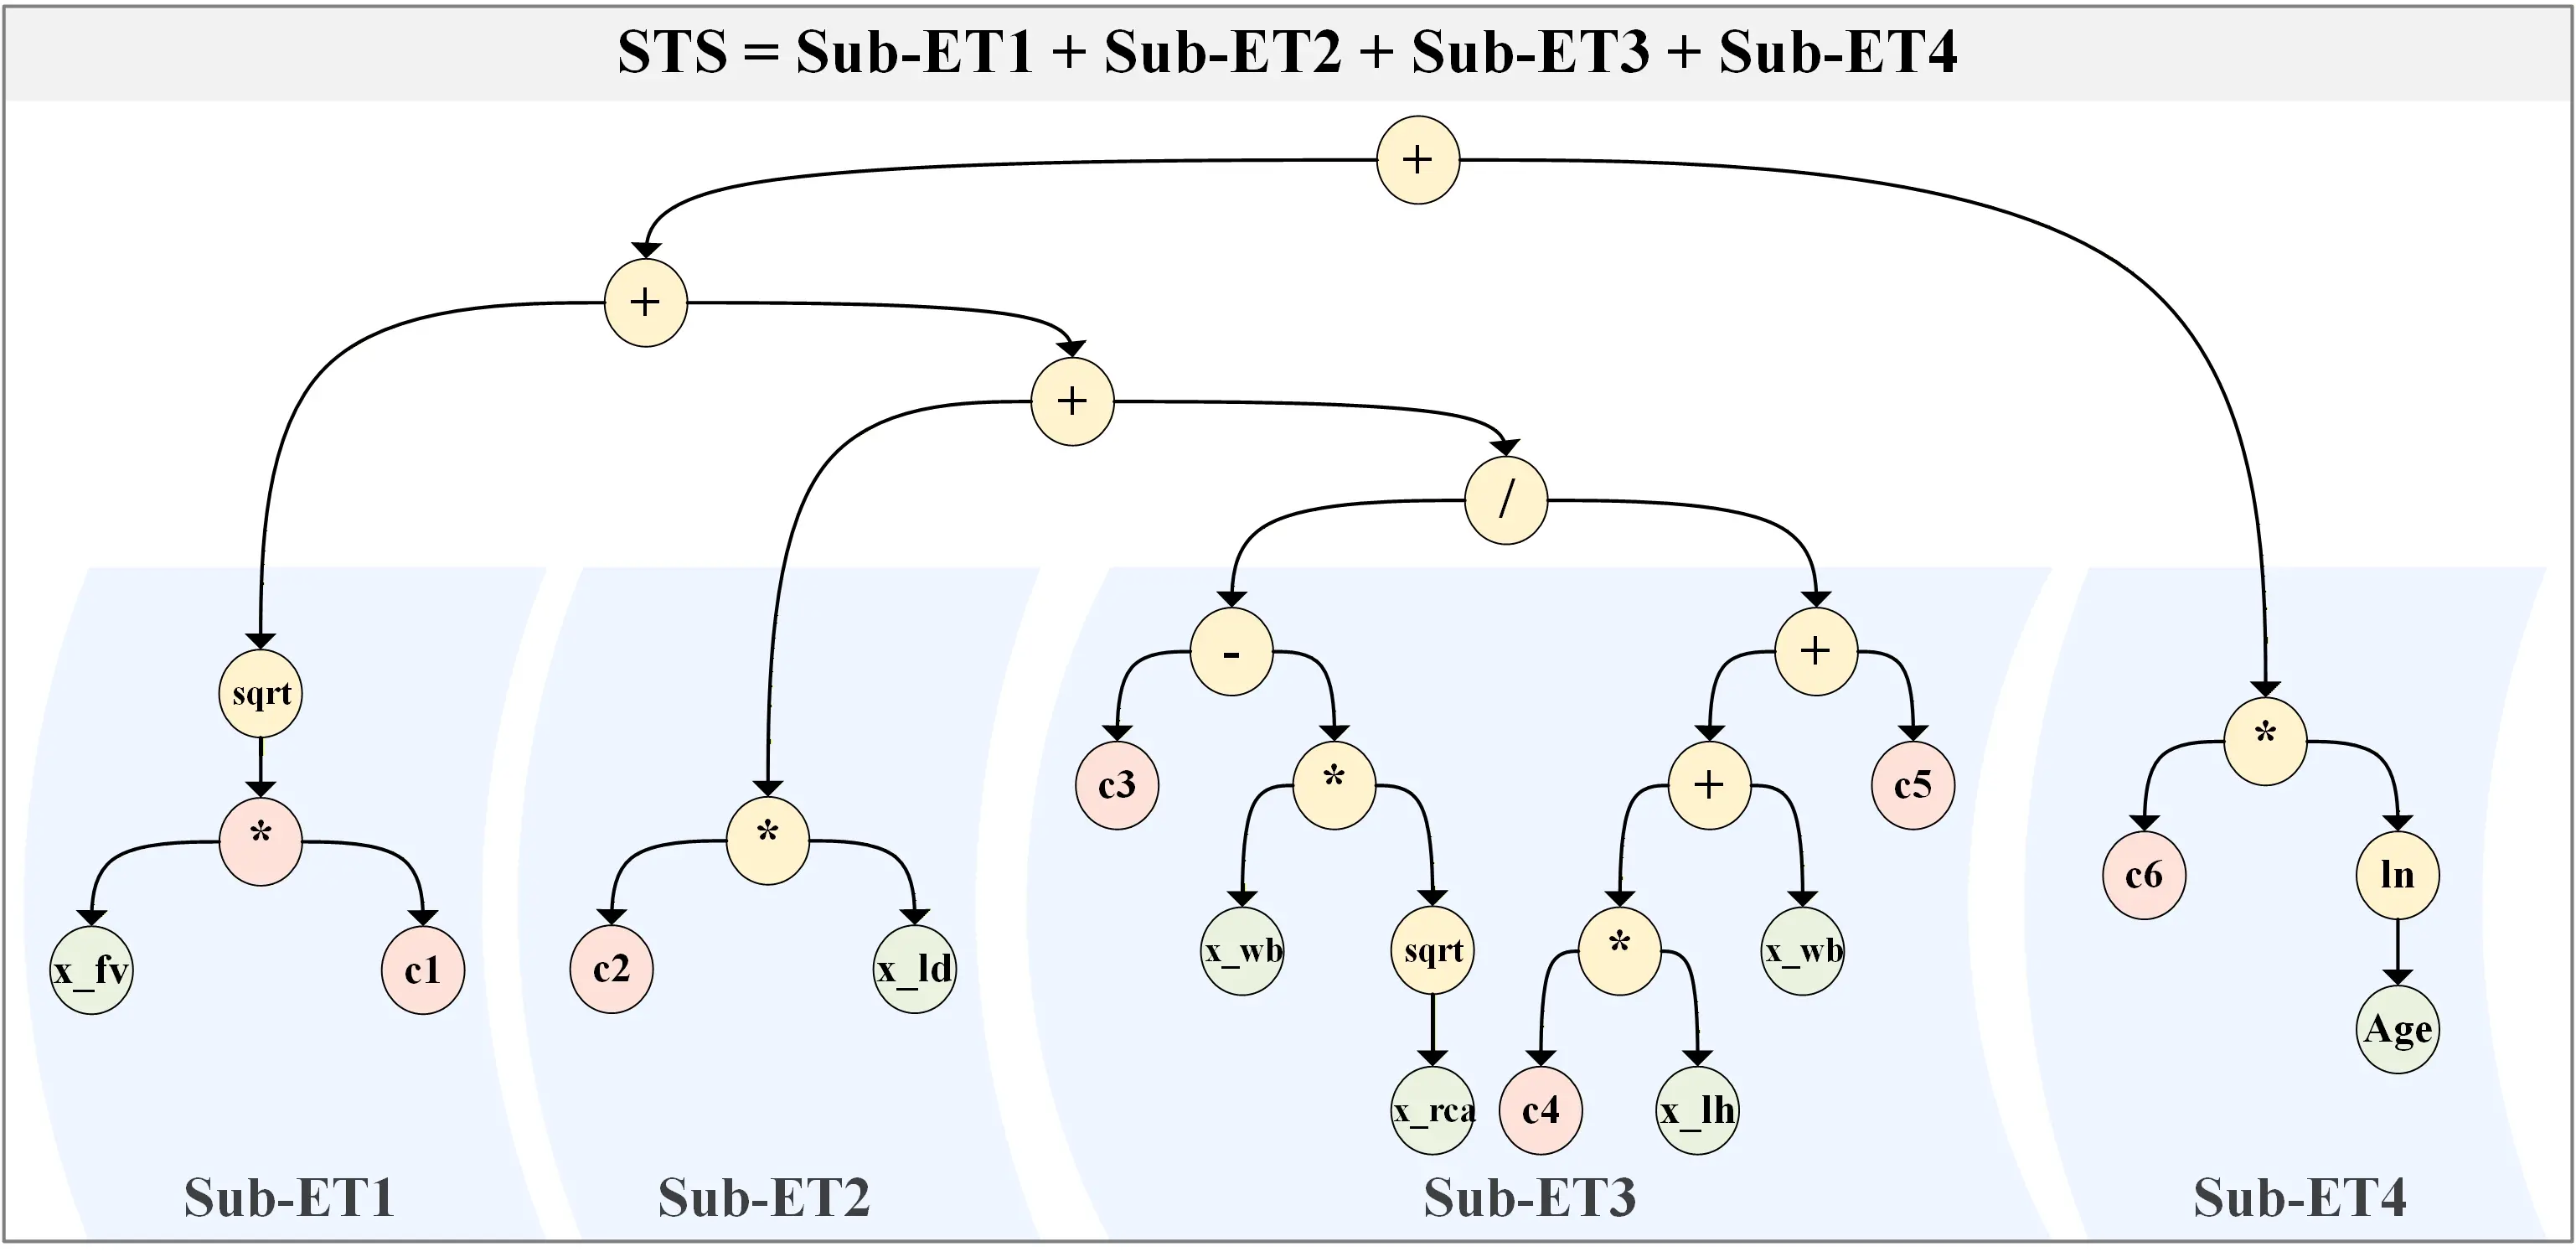
Figure 9. Sub-ETs structure of CGEP2 model. (Yellow nodes represent operators; pink nodes represent constants: c1 = 2.66, c2 = -1.19, c3 = 8.96, c4 = 1.02, c5 = 0.63,
where xw/b represents the water-to-binder ratio, xRCA-r the recycled concrete aggregate replacement ratio, xFV the fiber volume fraction, xLH the layer height, xLD the loading direction, and Age the curing period.
Each term in Eq. (7) corresponds to an independently evolving sub-tree structure that captures a specific physical mechanism, with the linear combination of all sub-trees constituting the complete predictive model.
The initial term
The linear term -1.19·xLD (Sub-ET2 in Figure 9) serves as an anisotropic penalty term in the model to quantify the loading direction effect of 3DCP. This term is a binary variable that equals 0 for parallel loading and 1 for perpendicular loading, imposing a strength penalty of 1.19 MPa. Perpendicular loading applies principal tensile stress directly to the weak interlayer interfaces, activating microscopic defects at the interfaces, and triggering strength degradation. The magnitude of this effect is primarily determined by the bonding quality of interlayer interfaces and exhibits minimal interaction with other parameters such as w/b ratio and RCA-r, thus manifesting as an independent linear penalty term.
Subsequently, the fractional term
Finally, the temporal evolution of strength is modeled by the hydration age correction term +1.59·ln(Age) (Sub-ET4 in Figure 9). The logarithmic form aligns with the reaction kinetics of concrete hydration, where strength develops rapidly in the early stages but tends to plateau as the age extends and the hydration rate decelerates. This term provides a baseline correction to reflect the
The interpretable STS prediction model was developed based on the dataset with specific parameter ranges. The validated parameter ranges based on the dataset are shown in Table 7.
Table 7. Recommended values for variables in the interpretable STS prediction equation.
| Variables | xw/b | xRCA-r | xFV | xLH | xLD | Age |
| Recommended Range | 0.30-0.65 | 0-100 | 0 -5 | 0-18 | 0, 1 | 1-28 |
STS: splitting tensile strength; RCA-r: recycled aggregate replacement ratio; LD: load direction; LH: layer height; FV: fiber volume.
3.4 Limitations and future perspectives
The CGEP2 model is accurate and interpretable within its validated range. The model is demonstrably applicable in predicting the compressive strength of 3D printed concrete, fiber-reinforced concrete, recycled aggregate concrete, and conventional concrete. This enables rapid strength prediction at the preliminary design stage, making it useful for mix proportioning and performance evaluation in engineering practice. However, further assessment is required to refine or constrain its applicability.
The current dataset concerns intrinsic material attributes, where traditional concrete is isotropic while 3D printed concrete exhibits anisotropy. The LD variable is tied to the 3DPRAC database, creating an inherent coupling between anisotropy and the printing process. Future research incorporating diverse printing paths (e.g., concentric and cross-hatching) would facilitate a more granular decoupling of geometric path effects from material composition.
The derived explicit formula currently isolates layer height as the primary geometric constraint. However, mechanical performance is fundamentally governed by the interplay between rheology and hardening kinetics, requiring consideration of additional parameters such as printing speed, nozzle diameter, and time interval. Future studies should incorporate these process variables to enhance model generalization across diverse printing scenarios.
The model construction in this study relies on 110 experimental data sets. While this sample size proves sufficient for the GEP algorithm to effectively capture key physical laws, incorporating more data would further strengthen the generalization capability of the model across diverse material systems and printing conditions. This dataset expansion, combined with emerging techniques such as transfer learning aligned with the Materials Genome Initiative, offers promising pathways to enhance predictive performance. Fine-tuning pre-trained models with incrementally expanded datasets may help transcend current data scale limitations while maintaining computational efficiency.
4. Conclusions
In this study, a unified GEP framework to predict concrete splitting tensile strengths was created. This model was developed based on 110 datasets, including RAC, fiber-reinforced RAC, and 3DPRAC. The main conclusions are as follows:
(1) The developed CGEP2 model demonstrated exceptional robustness, achieving an R² of 0.914 and an RMSE of 0.312 MPa. The model successfully integrated distinct material systems by decoupling material types into continuous physical descriptors (e.g., RCA-r and FV), capturing nonlinear relationships between microscopic components and macroscopic process parameters within a unified computational framework.
(2) Sensitivity analysis established that LD and LH are the key drivers for mechanical performance with respect to 3D printed concrete, with their influence outweighing material constituents such as fiber volume. The model revealed that loading perpendicular to the layers (Z-direction) induces significant strength degradation, confirming the weak interlayer interface mechanism and suggesting the need for contact optimization of printing paths.
(3) An interpretable STS prediction equation was constructed to describe the saturation of fiber content, layer height defect, and anisotropy penalties as mathematical terms. The explicit equations provide a rapid, low-cost tool for mix design and strength prediction, replacing black-box software with a tool that engineers can use directly.
Despite the high fidelity of the developed framework, future work should focus on three extensions. First, integrating diverse printing paths (e.g., concentric and cross-hatching) is necessary to decouple geometric path effects from material composition. Second, incorporating other high-dimensional process variables (e.g., printing speed and interval time) increases the chance for model generalization to more complex printing scenarios. Finally, transfer learning techniques offer a pathway to overcome current data limitations and further improve predictive robustness.
Acknowledgements
The authors declare that AI tools were used solely for language polishing during the manuscript preparation process. All research content, including study design, data analysis, interpretations, figures, and tables, is original and was not generated using AI tools.
Authors contribution
Wang T: Conceptualization, methodology, formal analysis, writing-original draft.
Liu C: Conceptualization, methodology, writing-review & editing.
Zhu C: Formal analysis, writing-review & editing.
Zhu W: Writing-review & editing.
Liu H: Investigation, writing-review & editing.
Conflicts of interest
Huawei Liu serves as a Youth Editorial Board Member of the Journal of Building Design and Environment. The other authors declare no conflicts of interest.
Ethical approval
Not applicable.
Consent to participate
Not applicable.
Consent for publication
Not applicable.
Availability of data and materials
The data that support the findings of this study are available from the corresponding author upon reasonable request.
Funding
This study was supported by the National Natural Science Foundation of China (52178251 and 62276207), the National Natural Science Foundation of China Youth Fund (52408289 and 52508304), the Technology Innovation Guidance Program of Shaanxi Province
Copyright
© The Author(s) 2026.
References
-
1. Alarfaj M, Qureshi HJ, Shahab MZ, Javed MF, Arifuzzaman M, Gamil Y. Machine learning based prediction models for spilt tensile strength of fiber reinforced recycled aggregate concrete. Case Stud Constr Mater. 2024;20:e02836.[DOI]
-
2. Liu H, Liu C, Wu Y, Bai G, He C, Zhang R, et al. Hardened properties of 3D printed concrete with recycled coarse aggregate. Cem Concr Res. 2022;159:106868.[DOI]
-
3. Liu H, Liu C, Wu Y, Bai G, He C, Yao Y, et al. 3D printing concrete with recycled coarse aggregates: The influence of pore structure on interlayer adhesion. Cem Concr Compos. 2022;134:104742.[DOI]
-
4. Liu H, Tao Y, Zhu C, Liu C, Wang Y, Yun J, et al. 3D printed concrete with recycled coarse aggregate: Freeze–thaw resistance assessment and damage mechanisms. Cem Concr Res. 2026;200:108095.[DOI]
-
5. Liu C, Liang Z, Liu H, Wu Y, Zhang Y, Bai G. Seismic performance of 3D printed reinforced concrete walls: Experimental study and numerical simulation. Eng Struct. 2025;333:120176.[DOI]
-
6. Yuan F, Cheng L, Shao X, Dong Z, Zhang L, Wu G, et al. Full-field measurement and fracture and fatigue characterizations of asphalt concrete based on the SCB test and stereo-DIC. Eng Fract Mech. 2020;235:107127.[DOI]
-
7. Hu X, Li Q, Wu Z, Yang S. Modelling fracture process zone width and length for quasi-brittle fracture of rock, concrete and ceramics. Eng Fract Mech. 2022;259:108158.[DOI]
-
8. Chen L, Chen Z, Xie Z, Wei L, Hua J, Huang L, et al. Recent developments on natural fiber concrete: A review of properties, sustainability, applications, barriers, and opportunities. Dev Built Environ. 2023;16:100255.[DOI]
-
9. Khademi F, Akbari M, Jamal SM, Nikoo M. Multiple linear regression, artificial neural network, and fuzzy logic prediction of 28 days compressive strength of concrete. Front Struct Civ Eng. 2017;11(1):90-99.[DOI]
-
10. Sadrmomtazi A, Sobhani J, Mirgozar MA. Modeling compressive strength of EPS lightweight concrete using regression, neural network and ANFIS. Constr Build Mater. 2013;42:205-216.[DOI]
-
11. Zhou F, Jiang H, Huang L, Hu Y, Xie Z, Zeng Z, et al. Early shrinkage modeling of complex internally confined concrete based on capillary tension theory. Buildings. 2023;13(9):2201.[DOI]
-
12. Atici U. Prediction of the strength of mineral admixture concrete using multivariable regression analysis and an artificial neural network. Expert Syst Appl. 2011;38(8):9609-9618.[DOI]
-
13. Fazel Zarandi MH, Türksen IB, Sobhani J, Ramezanianpour AA. Fuzzy polynomial neural networks for approximation of the compressive strength of concrete. Appl Soft Comput. 2008;8(1):488-498.[DOI]
-
14. Deng F, He Y, Zhou S, Yu Y, Cheng H, Wu X. Compressive strength prediction of recycled concrete based on deep learning. Constr Build Mater. 2018;175:562-569.[DOI]
-
15. Celik G, Ozdemir M. Determination of concrete compressive strength from surface images with the integration of CNN and SVR methods. Measurement. 2024;238:115331.[DOI]
-
16. Awoyera PO, Kirgiz MS, Viloria A, Ovallos-Gazabon D. Estimating strength properties of geopolymer self-compacting concrete using machine learning techniques. J Mater Res Technol. 2020;9(4):9016-9028.[DOI]
-
17. Ahmad A, Chaiyasarn K, Farooq F, Ahmad W, Suparp S, Aslam F. Compressive strength prediction via gene expression programming (GEP) and artificial neural network (ANN) for concrete containing RCA. Buildings. 2021;11(8):324.[DOI]
-
18. Bui DK, Nguyen T, Chou JS, Nguyen-Xuan H, Ngo TD. A modified firefly algorithm-artificial neural network expert system for predicting compressive and tensile strength of high-performance concrete. Constr Build Mater. 2018;180:320-333.[DOI]
-
19. Nagarajan D, Rajagopal T, Meyappan N. A comparative study on prediction models for strength properties of LWA concrete using artificial neural network. Rev Constr. 2020;19(1):103-111.[DOI]
-
21. Ray S, Haque M, Ahmed T, Nahin TT. Comparison of artificial neural network (ANN) and response surface methodology (RSM) in predicting the compressive and splitting tensile strength of concrete prepared with glass waste and tin (Sn) can fiber. J King Saud Univ Eng Sci. 2023;35(3):185-199.[DOI]
-
22. Zhu Y, Ahmad A, Ahmad W, Vatin NI, Mohamed AM, Fathi D. Predicting the splitting tensile strength of recycled aggregate concrete using individual and ensemble machine learning approaches. Crystals. 2022;12(5):569.[DOI]
-
23. Patil SV, Rao KB, Nayak G. Prediction of recycled coarse aggregate concrete mechanical properties using multiple linear regression and artificial neural network. J Eng Des Technol. 2023;21(6):1690-1709.[DOI]
-
24. Nguyen H, Vu T, Vo TP, Thai HT. Efficient machine learning models for prediction of concrete strengths. Constr Build Mater. 2021;266:120950.[DOI]
-
25. Pan X, Xiao Y, Ali Suhail S, Ahmad W, Murali G, Salmi A, et al. Use of artificial intelligence methods for predicting the strength of recycled aggregate concrete and the influence of raw ingredients. Materials. 2022;15(12):4194.[DOI]
-
26. Koya BP, Aneja S, Gupta R, Valeo C. Comparative analysis of different machine learning algorithms to predict mechanical properties of concrete. Mech Adv Mater Struct. 2022;29(25):4032-4043.[DOI]
-
27. Sun Z, Li Y, Yang Y, Su L, Xie S. Splitting tensile strength of basalt fiber reinforced coral aggregate concrete: Optimized XGBoost models and experimental validation. Constr Build Mater. 2024;416:135133.[DOI]
-
28. Yang L, Shami A. On hyperparameter optimization of machine learning algorithms: Theory and practice. Neurocomputing. 2020;415:295-316.[DOI]
-
29. Huang H, Guo M, Zhang W, Huang M. Seismic behavior of strengthened RC columns under combined loadings. J Bridge Eng. 2022;27(6):05022005.[DOI]
-
30. Han X, Cui K, Xiao Q. Physics assisted machine learning methods for predicting the cracking performance of recycled aggregate concrete. Research Square [Preprint]. 2022.[DOI]
-
31. Liu C, Zhang Y, Liu H, Wu Y, Yu S, He C, et al. Interlayer reinforced 3D printed concrete with recycled coarse aggregate: Shear properties and enhancement methods. Addit Manuf. 2024;94:104507.[DOI]
-
32. Liu C, Liu H, Wu Y, Wu J, Ding S. Effect of X-ray CT characterized pore structure on the freeze–thaw resistance of 3D printed concrete with recycled coarse aggregate. Constr Build Mater. 2025;469:140492.[DOI]
-
33. Ferreira C. Gene expression programming in problem solving. In: Roy R, Köppen M, Ovaska S, Furuhashi T, Hoffmann F, editors. Soft computing and industry: Recent applications. London: Springer; 2002. p. 635-653.[DOI]
-
34. Ferreira C. Gene expression programming: mathematical modeling by an artificial intelligence. London: Springer; 2006. Available from: https://link.springer.com/book/10.1007/3-540-32849-1
-
35. Benamara C, Gharbi K, Nait Amar M, Hamada B. Prediction of wax appearance temperature using artificial intelligent techniques. Arab J Sci Eng. 2020;45(2):1319-1330.[DOI]
-
36. Ahmad MR, Chen B, Dai JG, Kazmi SMS, Munir MJ. Evolutionary artificial intelligence approach for performance prediction of bio-composites. Constr Build Mater. 2021;290:123254.[DOI]
Copyright
© The Author(s) 2026. This is an Open Access article licensed under a Creative Commons Attribution 4.0 International License (https://creativecommons.org/licenses/by/4.0/), which permits unrestricted use, sharing, adaptation, distribution and reproduction in any medium or format, for any purpose, even commercially, as long as you give appropriate credit to the original author(s) and the source, provide a link to the Creative Commons license, and indicate if changes were made.
Publisher’s Note
Science Exploration remains a neutral stance on jurisdictional claims in published
maps
and institutional affiliations. The views expressed in this article are solely those
of
the author(s) and do not reflect the opinions of the Editors or the publisher.
Share And Cite


Science Exploration Style
Wang T, Liu C, Zhu C, Zhu W, Liu H. Interpretable model and explicit formula for 3D printed recycled aggregate concrete strength prediction. J Build Des Environ. 2026;4:2025140. https://doi.org/10.70401/jbde.2026.0035
Tips
Copy completed.
Submit a Manuscript
Author Instructions
Cite this Article
Article Metrics
0
View
0
Download
Cited
Article Updates

Science Exploration Style
Wang T, Liu C, Zhu C, Zhu W, Liu H. Interpretable model and explicit formula for 3D printed recycled aggregate concrete strength prediction. J Build Des Environ. 2026;4:2025140. https://doi.org/10.70401/jbde.2026.0035
copy
Share Link
copy