A review of indoor environmental quality studies using discrete choice experiments: Valuing comfort
Ahmad Syahid
1

,
Siti Aisyah Damiati
2,*
,
Hom Bahadur Rijal
1
*Correspondence to:
Siti Aisyah Damiati, School of Civil Engineering and Construction, Adelaide University, Adelaide 5005, Australia.
E-mail: sitiaisyah.damiati@adelaide.edu.au
J Build Des Environ. 2026;4:2025138. 10.70401/jbde.2026.0037
Received: December 17, 2025Accepted: April 10, 2026Published: April 14, 2026
Abstract
Thermal comfort, indoor air quality, lighting comfort, and acoustic comfort are often treated as separate domains, despite interacting trade-offs. The discrete choice experiment (DCE) technique helps to account for explicit and implicit factors influencing choices, giving a more holistic view of indoor comfort. This paper reviews discrete choice experiment studies that include indoor environmental comfort elements. From 1,418 records found in scientific databases, 21 studies were reviewed. By analysing these studies, DCE’s ability to value indoor comfort was evaluated and methodological deficiencies identified. Given the heterogeneity between studies, this review focused on analysing the p-value and the direction of estimates. Thermal comfort in these studies shows positive and statistically significant coefficients, indoor air quality is generally positive but statistically heterogeneous. Evidence for positively valued lighting and acoustic comfort is frequently statistically non-significant. Methodological challenges identified affecting indoor environmental quality (IEQ) valuation in DCEs include proxy dilution, insufficient attribute clarity, embedded cost signals, and demographic heterogeneity. Proxy-based operationalisations may confound comfort valuation with convenience, cost, or multi-domain interaction effects. Additionally, occupant control and agency emerge as meta-attributes that generate utility beyond environmental improvement. Survey-based DCE can reliably elicit thermal comfort preferences from occupants; experiential approaches such as virtual reality-based DCE may allow occupants to better value acoustic and lighting comfort. Overall findings suggest indoor comfort should be modelled as a multi-attribute bundle instead of separate domains. This review shows that DCE is a useful tool for analysing indoor comfort as a bundle of attributes with strong interaction effects.
Keywords
Literature review, discrete choice experiment, thermal comfort, indoor air quality, visual comfort, acoustic comfort
1. Introduction
Buildings account for 21% of global CO2 emissions[1] and 30% of global final energy consumption[2], which is used to maintain the internal environment to allow occupants to live and work in comfort[3-5]. The use of environmental variables to analyse and model comfort has evolved from the days of mechanical variable monitoring[6] to accounting for human preferences[7] and now encompasses highly granular personal comfort[8], modelling comfort on a personal level. However, this does not consider how occupants trade-off between indoor environmental attributes, such as temperature, humidity, and air velocity, while overlooking other trade-offs and contextual factors that may influence comfort choice and valuation.
The factors influencing indoor comfort are multidimensional and have strong interaction effects with each other, reflecting the trade-offs occupants make in choosing between comfort factors[9]. Given resource or control constraints[9,10], occupants make choices and prioritise between thermal comfort, indoor air quality, acoustic comfort, and lighting comfort.
When it comes to eliciting the valuation of something as intangible as comfort, there are few techniques that can be utilised. Using revealed preferences, Lou et al.[11] attempt to quantify thermal comfort, daylighting, and ventilation using simulations of Hong Kong apartments. Despite being based on Hong Kong’s real estate data and backed by indoor environment simulations, it does not completely capture the complexity of occupants’ thought process in making choices. It is therefore necessary to use a technique that accounts for the trade-offs involved in occupant decision making. Discrete choice experiments (DCEs), used to analyse indoor comfort as a bundle of factors, allow researchers to account for both explicit and implicit factors. DCEs have been used in a wide range of topics from transport[12] to health[13] to real estate[14] to marketing[15]. DCEs provide estimations for the variables in focus and have been shown to enable interaction modelling[16], relative importance analysis[17], and model robustness testing[18].
Some progress has been made in using DCE to value indoor environment quality, but the efforts have remained sporadic and fragmented. Due to this, no current structured synthesis exists to compare these studies and interpret them holistically. Indoor environmental quality variables are also inconsistently used across studies, and thus there is no clarity as to whether occupants are able to value indoor environment quality attributes.
This review synthesises existing DCE literature on indoor environmental comfort to understand if occupants can value indoor comfort by examining how indoor comfort factors are made measurable in DCEs, the statistical evidence of valuation through DCE modelling, and identifying methodological gaps and limitations. The scope of this review includes continuously occupied settings, particularly homes and offices. This paper focuses on the variables used to elicit occupants’ responses to DCEs with regards to the indoor environment in contemporary literature.
This review is structured as follows: a background on DCE, a section detailing the methodology used, the results of the review, an analysis of the results, and final conclusions.
2. Discrete Choice Experiment for Indoor Comfort
Comfort is a perpetually sought after non-market good, with neither explicit price nor observable historical transactions[19]. It is also a culmination of environmental conditions, occupants’ expectations, and their choice of adaptive actions and activities[20], thus it consists of both objective components (temperature, humidity, airflow, and luminance) and subjective components (occupants’ psycho-physiological condition and adaptive actions, components). Thermo-adaptive actions such as window opening that improve ventilation but increase energy consumption[21] demonstrate that comfort is a multi-attribute, composite good. Occupants consider multiple interacting attributes and the trade-offs between them[9,20], making decisions both on a micro and macro scale that may be constrained by resources, controllability, and even personal values[10].
Because comfort is a non-market good, it is necessary to use stated preferences to discover how these comfort aspects are valued by occupants[10], by allowing for hypothetical scenarios and observing the trade-offs made by occupants in these scenarios. DCE allows for the valuation of the constituent components of an item, where each component forms a distinct but otherwise inseparable bundle[16]. DCEs also work well for valuing comfort due to the utility maximisation assumed of individuals, including the effort they are willing to take to achieve it[10], which can be as simple as putting on a sweater to a wholesale renovation of their homes.
The theoretical basis of DCE is the random utility theory[22], where occupants n are assumed to maximise their utility Unsj by choosing choice j in situation s. Their utility, given the observable component Vnsj and residual component εnsj, is given as:
As given in Hensher et al.[16], the observable component Vnsj is assumed in discrete choice experiments to have a linear relationship to observable attribute levels x of each alternative j, and its estimated coefficient β:
The main thrust of DCE is interpreting the estimated coefficient β, which indicates the marginal utility from including an attribute into the chosen bundle of attributes in a DCE[16]. The positive or negative sign of the β coefficient indicates whether the attribute is desirable or otherwise, and when compared across levels and alternatives, the importance of each attribute can be inferred[17].
Additional challenges to coefficient interpretation are introduced by the operationalisation of DCE studies in indoor comfort. With a few exceptions[23-25], these studies do not directly elicit occupant preferences but instead rely on building features, which are more easily understood as proxies. While building features are more easily understood, they also introduce confounding effects that distract from valuing comfort, such as energy savings[26], convenience and automation[27], and aesthetic value[23]. Building features may also affect more than one comfort factor, such as double glazed windows that simultaneously affect thermal and acoustic comfort[28] and draft sealing that affect both indoor air quality and thermal comfort[29].
As with any stated preference tool, DCEs are affected by respondents’ preference heterogeneity[16], arising from any number of personal and demographic factors including income, age, education, and environmental awareness[23]. This heterogeneity will need to be accounted for through both model specification and selection[19]. This means that across studies, DCE coefficient magnitudes differ due to differences in model specification and experimental design, which lead to scalar differences between studies that prevent direct comparison of coefficients.
Considering the factors highlighted above: attribute definition, sample, and model heterogeneity, it can be seen that DCE studies cannot be directly compared in absolute terms[30]. Rather, DCE synthesis relies on coefficient sign, statistical significance, and relative patterns to make meaningful comparisons between attributes and coefficients across DCE studies.
3. Methodology
3.1 Review design and scope
This study synthesises DCE applications in indoor environments with a focus on indoor comfort. This review specifically looks at continuously occupied indoor environments, particularly residential and office settings. The objectives of this review are:
i. Understanding how DCE operationalises indoor environmental attributes – how indoor environmental attributes are reframed as measurable variables that can be observed and analysed empirically.
ii. Discovering whether occupants value the indoor environmental attributes analysed in each DCE.
iii. Highlighting limitations to interpreting the indoor environmental attributes in the papers reviewed using the lens of indoor comfort.
To find studies that provide insight into occupant valuation of comfort in an indoor environment, a systematic review of the current literature was performed. The following sections detail the inclusion criteria, study types, search procedures, search strategy, data collection process, outcomes, and bias risks.
3.2 Search strategies
To provide as much data as possible on indoor environmental quality DCEs, this search includes journal articles, theses, and conference papers that were reviewed.
Literature searches were performed using Google Scholar, Scopus, and Web of Science databases. No publication date restrictions were specified. Table 1 summarises the databases used for this review.
Table 1. Databases used in this review.
| Database | Coverage | Language |
| Google Scholar | 1925-2025 | Multilingual |
| Scopus | 1974-2025 | English |
| Web of Science | 2016-2025 | English |
Using the databases above, the following search string was used to perform an initial search, including the abbreviation “IEQ” for indoor environment quality and linking all keywords using the OR Boolean operator. The search was performed using the search string:
TITLE-ABS-KEY (“thermal comfort” OR “indoor environment quality” OR “IEQ”) AND TITLE-ABS-KEY (“discrete choice experiment”).
The keywords used for the literature search were selected to ensure all DCE studies on indoor comfort are included. “Thermal comfort” and “indoor environment quality” were identified as keywords to link the four elements of indoor comfort: thermal, air quality, acoustic, and lighting comfort. These keywords also capture the multidimensionality of the indoor environment and the comfort derived from it. These keywords also allow for the capture of both direct elicitation of comfort using DCE, as well as studies using building features as proxies for indoor comfort.
3.3 Inclusion criteria
The focus is on studies that show either direct valuation of indoor environmental comfort, or indirect valuation using features that are related to indoor environmental comfort. This means architectural features such as insulation and blinds, respectively indirectly valuing thermal and lighting comfort, are included. Articles are only included if a full text in English is available.
This review was carried out to discover valuations of indoor environmental comfort using DCEs. Table 2 details the inclusion and exclusion criteria set out to include or exclude an article as part of this review.
Table 2. Inclusion and exclusion criteria.
| Inclusion criteria | Exclusion criteria |
| Used DCEs as its main methodology | Used other stated preference methodology e.g., analytical hierarchy process, conjoint analysis |
| Tested indoor environmental quality, or used indoor features that can be used as proxies for indoor environmental quality | Tested outdoor environments |
| DCEs set in homes or offices that are constantly occupied by a relatively fixed set of occupants | DCEs set in other locations that are temporarily occupied, e.g. hotels |
| Full text available in English | Were literature reviews without original data |
| A study using original data | |
| Document types: articles, theses, conference papers |
DCEs: discrete choice experiments.
3.4 Screening and selection process
To identify research already performed on indoor comfort DCEs, manuscripts found using the search terms above from the databases specified were exported in .ris format, which included the title, authors, publication year, journal name, abstract, and keywords, and imported into Covidence[31]. Scopus and Web of Science included a native export tool, but Google Scholar results were processed using the Publish or Perish software[32] to create a ‘.ris’ file.
A total of 1,418 manuscripts were imported into Covidence[31], which identified 18 duplicates. 16 duplicates were manually identified. This included theses that were later published as journal or conference papers.
A total of 1,385 manuscripts were screened using their titles and abstracts, and 1,166 studies were found to be irrelevant to the research objectives. The majority of these were related to transport modelling and energy modelling, the former being a forerunner to the use of DCEs as a scientific method[33].
A total of 219 studies that passed abstract screening were subjected to further full text screening. Most studies excluded, 105 manuscripts, were found to use a study design that does not fulfil the objectives of this review, with most using stated rather than revealed preferences. Other reasons studies were rejected because they use the wrong setting, such as outdoors or in non-continuously occupied indoor spaces such as hotels, or that the analysis precludes factors relating to indoor comfort. Other studies also use stated preference methodologies other than DCEs or are literature reviews without primary data. Finally, a few have English abstracts but full texts in Portuguese, Polish, or Chinese and were excluded. A few duplicates were also found in this stage, theses whose chapters have been published as journal articles.
Post filtering, a total of 21 studies meeting all the conditions above were included in this review. This process is illustrated in Figure 1, generated using Covidence[31]. Scopus appears to have the best relevance to results ratio, with only 2 papers rejected from the 9 results found. Google Scholar and Web of Science returned many results that were subsequently rejected, with an overall acceptance rate of 1.5%. Despite this, both databases found manuscripts that proved valuable to the results of this review.
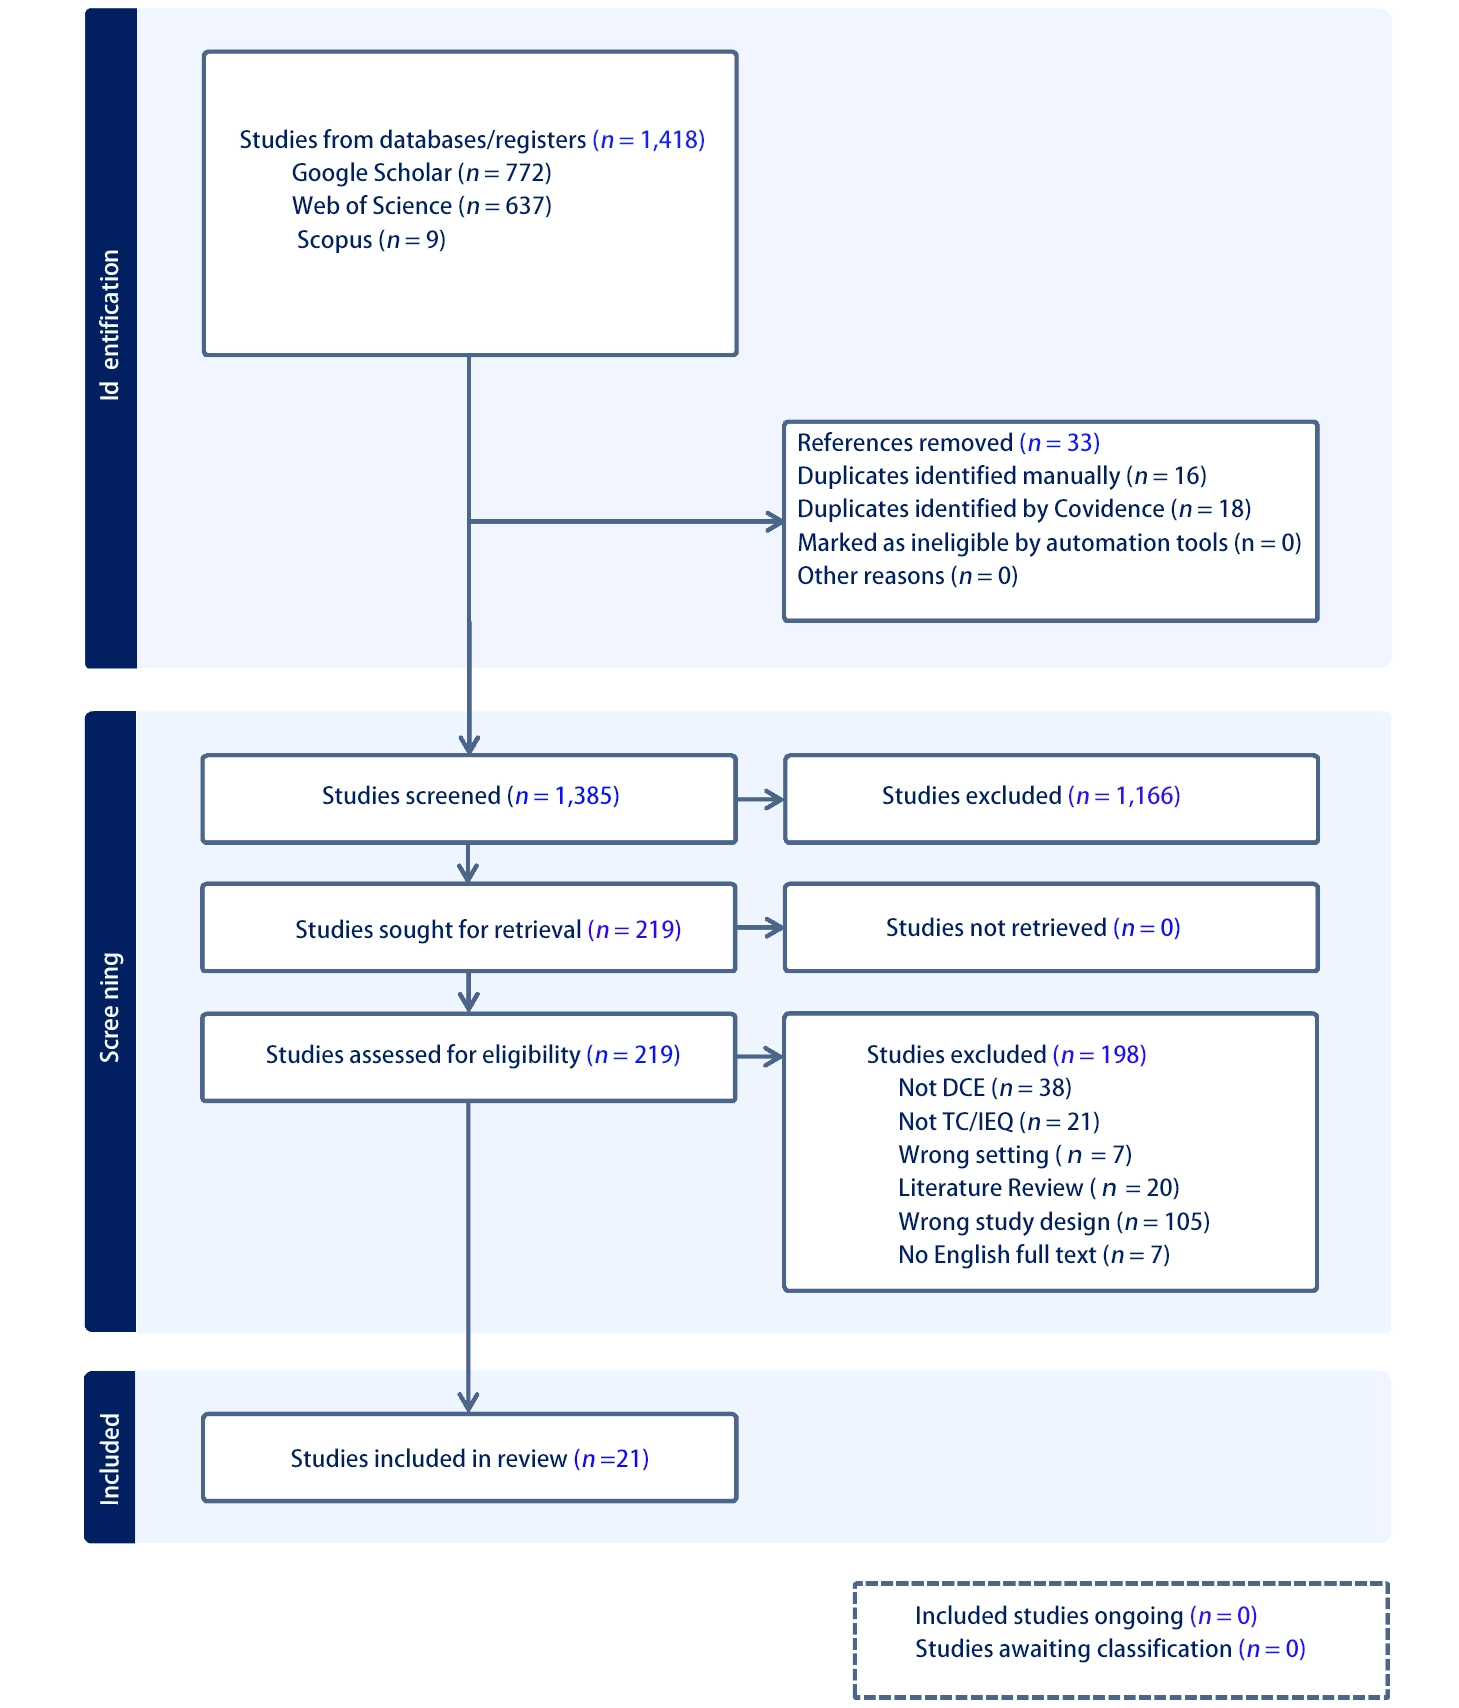
Figure 1. Preferred reporting items for systematic reviews and meta-analyses (PRISMA) diagram. n: number of articles.
3.5 Data extraction
In each study included in this review, the following data points were extracted:
• Study location
• Target population
• DCE design (attributes, levels, choice sets)
• Model specification
• Estimation results
• Statistical significance
• Reported units (log-odds, MWTP, etc.)
For each study, focus was given to the DCE variables that relate to thermal comfort, indoor air quality, lighting comfort, and acoustic comfort.
3.6 Attribute coding and classification
To synthesise overall results from otherwise heterogeneous studies, the DCE attributes analysed in each study were grouped based on their contribution to indoor comfort.
Where attributes are explicitly labelled as relating to thermal comfort, indoor air quality, lighting comfort, and acoustic comfort, they are directly used as such. However, the majority of studies instead rely on proxy attributes, using building features such as insulation, ventilation systems, or window types, the attributes are instead classified, in order of primacy, based on:
• The authors’ stated interpretation of the comfort effects of these features.
• Established relationships known in building science.
• The dominant functional effects of these features.
Some DCE studies[27] also use multiple levels of the same feature to discover if such improvements improve the marginal utility of respondents. Where this is the case, the level with the highest marginal utility that is also statistically significant was selected.
3.7 Synthesis approach
With heterogeneity across studies due to differences in attribute specification, experimental design, estimation models, and sample characteristics, it is not possible to compare DCE studies directly[30]. Instead, this study relied on the direction of the coefficient, whether positive or negative, to identify the desirability of a building feature. This study also considers the statistical significance of the coefficients and relative patterns across studies to discover occupant valuation of comfort.
3.8 Outcomes
The primary outcome from this review is the identification of occupants’ valuation of indoor comfort; thermal, ventilation, lighting and acoustic comfort.
Other outcomes include the identification of reliance on proxies for valuing comfort, and whether comfort can be valued directly. This study also affords the opportunity to assess the differences between direct and indirect valuation, and whether one provides more reliable estimates than the other. By looking at the overall state of indoor comfort research using DCE, it is also possible to find research gaps in the field.
3.9 Bias risk minimisation and limitations
All DCEs come with the risk of hypothetical bias[16], where respondents make choices that they otherwise wouldn’t choose in real situations due to the hypothetical nature of these choices, which the authors have relied on the manuscripts’ measures to minimise this bias.
This review may also suffer from bias of selecting only studies in English as well as using only three databases in the initial literature search. Additionally, despite establishing and using guidelines for interpreting the DCE attributes, there is inherent subjectivity bias in deciding which comfort group each attribute falls into.
4. Results
This review has filtered 1,418 studies found using scholarly databases and uncovered 21 studies that use DCE as a means to find user preferences for indoor comfort. This section discusses these studies, their characteristics, and the current state of the art of indoor comfort in DCE.
Of the 21 studies included, thermal comfort was examined in 18 studies, indoor air quality in 9, visual comfort in 5, and acoustic comfort in 5. Twenty studies examined indoor comfort in residential settings and one in an office setting.
4.1 Study characteristics
Table 3 shows the list of studies included in this review and their characteristics. In addition to the studies reviewed, Table 3 also documents the location where the study was conducted in and the target respondents. 17 are set in Europe and 3 are set in Asia, with all but one targeting residential occupants. Four studies elicit valuations for indoor comfort directly and the rest use building features as proxies. Where available, the tools and model(s) used are also documented, along with choice cards and respondents, which usually but not always multiply to become the number of observations.
Table 3. List and characteristics of studies reviewed.
| Reference | Location | Target respondents | Tool | Model | Choice cards | Observations | Respondents |
| Amaris et al.[27] | Germany and Spain | Population representative (survey panel) | Not specified | Hybrid choice model | 8 | Not specified | 1,262 (Spain) and 1,321 (Germany) |
| Appel-Meulenbroek et al.[34] | Netherlands | Workplace decision makers | NLogit 5 | Multinomial logit | 9 | 756 | 84 |
| Bakaloglou and Belaïd[35] | France | Population representative (survey panel) | Not specified | Multinomial logit | 8 | Not specified | 3,000 |
| Baker et al.[29] | Australia | Low to moderate income renters | Not specified | Not specified | Not specified | Not specified | 1,064 |
| Banfi et al.[36] | Switzerland | Homeowners and renters | Not specified | Fixed-effect binary logit | 14 | 3,861 + 3,458 | 163 apartments and 142 houses |
| Berto et al.[37] | Italy | Not specified | Not specified | Multinomial logit | 12 | Not specified | 83 |
| Bragolusi[28] | Italy | Not specified | Ngene + Apollo[38] for R | Multinomial logit with iterative efficient design | 14 | 3,852 | 218 |
| Chau et al.[39] | Hong Kong | Green building residents | LIMDEP | Conditional logit | 8 | Not specified | 480 |
| Damigos et al.[26] | Greece | Energy impoverished households | Not specified | Conditional logit | 6 | Not specified | 303 |
| Faccioli et al.[40] | Italy | Random | Idefix[41] in R (design) with Models for Discrete Choice Experiments[42] for Matlab (estimation) | Mixed logit model | 10 | 4,340 | 434 |
| Galassi and Madlener[23] | Germany | Homeowners and tenants | Sawtooth Software (design) + mixlogit[43] for Stata | Mixed logit | 6 | 56,898 | 3,161 |
| Galassi and Madlener[10] | Germany | Houseowners and occupiers | Sawtooth Software, mixlogit[43] and gmnl[44] for stata | Mixed mode logit and G-MNL-II[44] | 6 | 37,932 | 3,161 |
| He et al.[24] | China | Random | Nlogit 5.0 | Multinomial logit model with clustering | 8 | 2,504 | 313 |
| Hou and Lan[45] | Hong Kong | Students | Ngene | Multinomial logit | 15 | 54 | |
| Jusoh et al.[46] | Malaysia | Random | SAS + Nlogit | Multinomial logit | Not specified | Not specified | 800 |
| Li et al.[25] | Ireland | Population representative | JMP (design) | Mixed logit | 6 | 793 | 412 |
| Marmolejo-Duarte and Ampudia-Farias[47] | Spain | Homebuyers and renters | Not specified | Unspecified logit model | 4 | 2,000 | 500 |
| Marmolejo-Duarte and Bravi[48] | Spain | Random | Sawtooth Software | Conditional logit | 4 | 1,000 | 250 |
| Stolyarova et al.[49] | France | Random | Mixlbeta[43] in Stata | Multinomial logit | 5 | 1,802 | 125 |
| Taranu et al.[50] | Belgium | Random | Ngene | Conditional logit | 178 |
SAS: statistical analysis system; G-MNL-II: generalized multinomial logit model type II; LIMDEP:
4.2 Results of synthesis
The aim of this review was to identify the articles that research indoor comfort using DCEs, to confirm if the elements of indoor comfort are valued by building occupants, as well as the means of assessing their valuation of comfort.
It is essential to evaluate the valuation of comfort as it is a concept that is sought after by building occupants but has very rarely been valued quantitatively. Despite DCEs being a well-established methodology for bundled good valuation[29] that is becoming increasingly refined in dealing with hypothetical bias and preference heterogeneity, and comfort valuation being an ideal use case, it has only been used in this subject since 2008[36].
Based on the studies reviewed, few DCE studies found directly elicit indoor comfort, while the rest tangentially touch on thermal comfort or indoor environment quality via the use of attributes that influence the indoor environment. This includes smart thermostat overrides[27], valuing thermal comfort in renovation decisions[35], thermal comfort as an attribute for green housing[24], and thermal comfort as part of heat pump and retrofitting decisions[25].
All DCE studies included in this review concern housing and offices, encompassing both purchase/rent and upgrade decisions. While both housing and offices were included in the scope of this study, the lack of academic work meant most studies in this review focused on residential contexts.
Where specified, it can be seen that the tools used by most researchers are standalone programs such as NGene, NLogit, and Sawtooth that generally enable them to design and afterwards estimate DCEs. However, some researchers also appreciate the flexibility and cost-effectiveness afforded by using packages such as mixlogit[43], idefix[41], and Czajkowski’s Discrete Choice Experiments suite[42], using Stata, R, and Matlab respectively. There appear to be no difference in study validity in either option, except for having to take extra steps in using packages as opposed to standalone software.
The results of DCE estimations are usually in log odds, which is the coefficient normalized by the standard error[51], thus cannot be interpreted directly or compared between studies if there is heterogeneous residual variation[52], but provide useful information on both the signs; where positive values indicate a desirable attribute and vice versa[10], and the p-value of said estimates.
4.3 DCE coefficient interpretation
This section provides an example of the procedure used in this review to select and classify features analysed in DCE into one of the four comfort categories. This was previously touched in Section 3.6, and examples for the operationalisation of these features into a comfort domain are provided below.
Berto et al.[37] used building features as proxies for indoor comfort metrics but designed the DCE to provide clear demarcation between thermal comfort, indoor air quality, visual comfort, and acoustic comfort. The utility function (U) is given as:
With β representing the perceived marginal utility, COST representing the cost of the set of options, D representing the difference between the baseline and improved feature, and TC, VC, AC, and IAQ representing thermal comfort, visual comfort, acoustic comfort, and indoor air quality respectively.
Using the logit model, the following β values for each coefficient were derived, along with the willingness to pay (WTP):
Because of the author stated interpretation of these coefficients to represent indoor comfort, the values are used as-is in this review. These values are then imported into Table 4.
Table 4. DCE coefficients from Berto et al.[37].
| Coefficient | β | WTP |
| Cost | -2.77922e- 05 | |
| Thermal Comfort - Underfloor heating with zone control | 1.05039 | 377.94 EUR/m2 |
| Visual Comfort - Automatic shutter with integrated sensors | 0.463659 | 166.83 EUR/m2 |
| Acoustic Comfort - Correct design and on-site verification of passive acoustic requirements. | 0.332394 | 119.60 EUR/m2 |
| Indoor Air Quality - Decentralized mechanical ventilation with coupled machines. | 0.220132 | 79.21 EUR/ m2 |
DCE: discrete choice experiment; WTP: willingness to pay.
Other studies pose interpretation challenges requiring the application of consistent interpretation rules. Amaris et al.[27] conducted two DCEs with respondents from Spain and Germany. Additionally, it also tests multiple levels of manual overrides for automatic thermostat control, encompassing both temperature (1 and 2 °C) and time (2, 4, and 6 hours) horizons. As a result, there are 12 values to choose from to encompass one variable included in this review. However, the highest level was the ‘Thermal Comfort 2 Degree for 6 Hours’ variable from the Spanish DCE, that is also significant at p < 0.001. This variable is classed as a thermal comfort variable because it is interpreted as such in the study, and represents the amount of time and the number of degrees the thermostat can be adjusted manually to achieve higher thermal comfort.
Using the attributes included in each of the selected manuscripts, Table 5 has been compiled. Where multiple levels of the same attribute are included, the highest level is used to represent the effect of the feature on indoor comfort, such as the multiple levels of noise abatement[23] or the multiple levels of smart heating system manual adjustments[27] that influence occupants’ thermal comfort control.
Table 5. Indoor comfort operationalisation.
| Reference | Unit | Thermal Comfort | Indoor Air Quality | Visual Comfort | Acoustic Comfort | ||||||||
| Variable | Type | Value | Variable | Type | Value | Variable | Type | Value | Variable | Type | Value | ||
| Amaris et al.[27] | Log-odds | Adjust smart system by 2 °C for 6 hours | Proxy | 0.957*** | |||||||||
| Appel-Meulenbroek et al.[34] | Log-odds | Balanced system with minor comfort fluctuation + Adjustable per space | Proxy | 0.409 | Ventilation with air treatment and air filtering | Proxy | 0.216 | Large window size with adjustable sun blinds + Adjustable light fittings | Proxy | 0.118 | Acoustic insulation external and absorption internal sound sources | Proxy | 0.3 |
| Bakaloglou and Belaïd[35] | Log-odds | Increased indoor temperature | Direct | 0.57*** | |||||||||
| Baker et al.[29] | Log-odds | Ceiling insulation | Proxy | 0.18*** | |||||||||
| Banfi et al.[36] | MWTP (house price %) | New windows | Proxy | 13%*** | Housing ventilation system | Proxy | 8%*** | ||||||
| Berto et al.[37] | MWTP per m2 | Underfloor heating with zone control | Proxy | 377.94 EUR/m2*** | Decentralized mechanical ventilation with coupled machines | Proxy | 79.21 EUR/m2*** | Automatic shutter with integrated sensors | Proxy | 166.83 EUR/m2*** | Correct design and on-site verification of passive acoustic requirements | Proxy | 119.60 EUR/m2*** |
| Bragolusi[28] | Log-odds | Home automation | Proxy | 0.0703* | Indoor air quality | Proxy | 0.027 | ||||||
| Chau et al.[39] | Log-odds | Air | Direct | 0.307** | Noise | Direct | 0.2036** | ||||||
| Damigos et al.[26] | MWTP (energy cost savings) | Annual savings-Heating | Proxy | 3.50*** | |||||||||
| Faccioli et al.[40] | Log-odds | Comfort | Direct | 0.204*** | |||||||||
| Galassi and Madlener[23] | Log-odds | Temperature – warm | Direct | 0.089*** | Air quality – better | Direct | 0.536*** | Noise insulation – inside and outside | Proxy | 0.176*** | |||
| Galassi and Madlener[10] | Log-odds | Window fully open + heating off | Proxy | 0.733*** | |||||||||
| He et al.[24] | MWTP per m2 | Thermal comfort – comfortable | Direct | 133.29*** | Indoor air quality – comfortable | Direct | 209.17*** | ||||||
| Hou and Lan[45] | Choice % | Lighting Intensity – high | Direct | 36.3%§ | Intrusive noise – low | Direct | 41.98%§ | ||||||
| Jusoh et al.[46] | Log-odds | Indoor ventilation | Proxy | 0.2838*** | |||||||||
| Li et al.[25] | MWTP | Thermal comfort increase – high | Direct | 28,673.15*** | |||||||||
| Marmolejo-Duarte and Ampudia- Farias[47] | Log-odds | AC + Heating | Proxy | 0.25§ | |||||||||
| Marmolejo-Duarte and Bravi[48] | Log-odds | Heating + Air conditioning | Proxy | 0.3188*** | |||||||||
| Stolyarova et al.[49] | MWTP per °C heating | Heating from renewable energy sources | Proxy | 386*** | |||||||||
| Taranu et al.[50] | Log-odds | Big thermal comfort improvement | Direct | 0.30** | |||||||||
Unit denotes the term used to explain the DCE regression in each paper; MWTP: marginal willingness to pay; DCE: discrete choice experiment; ***: p-value ≤ 0.01; **: p-value ≤ 0.05; *: p-value ≤ 0.1; §: no p-values given.
Where multiple attributes have been interpreted to enhance one element of indoor comfort, the highest-level attribute with the highest significance is used. This approach is used to allow for the largest effect from each paper reviewed to be showcased, but also because the focus of this paper is not on the magnitude of the effects, but on the positive/negative direction and statistical significance of the coefficients. Because each level is a separate estimation on its own, it is not meaningful to average across levels. Reporting all levels only detract from seeing the main effects of the studies reviewed on the indoor comfort metrics.
The attributes are organised into thermal comfort, indoor air quality, visual comfort, and acoustic comfort. This table also documents the variable that has been chosen to represent each of the indoor comfort factors, its type, whether it was directly elicited or used as proxy features to discover occupant preferences, along with the corresponding published values of each chosen coefficient. A positive coefficient generally equates to an attribute that contributes positively to marginal utility. “*”, “**”, and “***” denote p-values of 0.1, 0.05, and 0.01 respectively. Refer to the supplementary materials for further explanation on the attributes, coding, and interpretation used in this review.
4.4 IEQ statistical patterns
This section summarises the studies reviewed in Table 5, specifically looking at statistical patterns emerging from this tabulation.
Thermal comfort was analysed in 17 of the 21 studies reviewed. All of these studies found thermal comfort to be positively valued by occupants. 11 of these used proxy building features to elicit thermal comfort valuation. 12 of these analyses found thermal comfort valuation to be statistically significant at p < 0.01.
Indoor air quality was found in 8 of the 21 studies reviewed. Similarly, indoor air quality was universally positively valued by occupants in both homes and offices. 5 of these studies found statistically significant results at p < 0.01. A different set of 5 studies used proxy features to elicit occupant valuation.
Visual comfort was analysed in 3 of the 21 papers included in this review, 2 of these using proxy features. These were also all found to be positively valued but only 2 of these had statistically significant results.
Acoustic comfort was analysed in 5 of the 21 papers in this review. As with other indoor comfort attribute, all 5 studies were also found to be positively valued, but only 2 had statistically significant results.
Evidence for thermal comfort and indoor air quality show that there is heterogeneity in statistical significance between all results regardless of whether it is directly elicited or if it uses proxy features. The lack of studies encompassing acoustic and visual comfort prevent the same conclusion being drawn for these two comfort attributes.
5. Discussion and Analysis
The previous sections have demonstrated that there are statistically significant, positive valuations of the elements of indoor comfort amongst building occupants. While this overview is useful in showing that thermal comfort and indoor air quality, and to a lesser extent acoustic and lighting comfort are desirable characteristics in an indoor space, much of the nuance is missed, which will be discussed in the following sections.
5.1 Interpretation of cross-domain patterns
This section discusses the interpretation of indoor comfort across the four comfort domains; thermal comfort, indoor air quality, visual comfort, and acoustic comfort, and the patterns that can be found through cross-domain analysis. This section discusses this through three main perspectives, a comparison between direct and proxy elicitation, the perceptibility of indoor comfort attributes, and the dilution of main effects through proxy use.
5.1.1 Direct vs. proxy
As given in Table 5, this review has clearly demarcated studies that rely on direct elicitation of indoor comfort and those relying on the use of building features as proxies. The papers found in this review showed that occupants statistically significantly value thermal comfort positively, whether through direct elicitation[40,50] or also using proxy features[37]. However, there may be issues of interaction effects in other attributes of indoor comfort. Building features that influence multiple comfort attributes also introduce cross-attribution across domains, such as daylighting that introduces solar heat gain and influence thermal comfort[46] or acoustic insulation that also increase thermal resistance[34]. These interaction effects make disentangling the actual valuation of indoor comfort domains less precise by complicating attribution to a single comfort domain.
Table 6 shows the indoor comfort papers included in this review split between direct and proxy variables, further split based on statistical significance:
Table 6. Significance of variables for each comfort attribute.
| Direct | Proxy | |||||||
| p-value | < 0.01 | < 0.05 | < 0.1 | NS | < 0.01 | < 0.05 | < 0.1 | NS |
| Thermal comfort | 6 | 8 | 1 | 2 | ||||
| Indoor air quality | 2 | 1 | 3 | 2 | ||||
| Acoustic comfort | 1 | 1 | 2 | 1 | ||||
| Visual comfort | 1 | 1 | 1 | |||||
NS: Non-significant.
As shown in Table 6, valuations of thermal comfort, whether valued using proxy features or elicited directly frequently yield statistically significant coefficients of p < 0.01. However, evidence for indoor air quality, acoustic comfort, and visual comfort shows more heterogeneous patterns and higher proportions of non-significant results. The smaller number of samples of visual and acoustic comfort studies limit the ability to draw conclusions regarding their operationalisation in DCE.
Proxy features cause less cognitive burden amongst respondents, allowing them to anchor their imagination and expectations[23], especially in survey-based DCE with limited stimuli options.
While proxy and direct attributes show similar statistical performance, using direct elicitation in DCE shows clearer conceptual alignment between the coefficient and the comfort attribute under examination. This is especially true where multi-domain features, such as improved glazing[36] complicate attribution.
Future indoor comfort studies should explicitly justify whether comfort attributes are elicited directly or by using building features as a proxy, and discuss the implications of this choice on the interpretation in advance.
5.1.2 Perceptibility
Comfort is a matter of perception[20] and valuing indoor comfort in a DCE is a matter of being able to perceive the added utility from being more comfortable.
Previous studies have shown that thermal comfort is the most dominantly perceived element of indoor comfort[53]. This may lead occupants to adjust to maximise thermal comfort, leading to downstream adjustments of environmental variables, sometimes to the detriment of other metrics, such as energy use and heating bills[40].
This prominence may partially explain the frequency of thermal comfort in indoor comfort DCEs. This dominance is likely a reason thermal comfort exhibits consistently positive and statistically robust valuations across studies, using both direct and proxy variables. This suggests that occupants can reliably value thermal comfort within DCE frameworks.
Even in indoor air quality focused studies, temperature perceptions influence occupants’ perception of indoor air quality[54,55]. There is a likelihood that this may be the cause for mixed significance, and weaker statistical significance when exploring indoor air quality using direct variables in DCEs.
Occupants’ ability to perceive and value visual and acoustic comfort based on DCE is less conclusive, due to the lack of evidence from reviewed literature. However, based on the studies reviewed, it can be seen that using experiential settings such as virtual reality[45] or experimentally controlled settings[56] in conjunction with DCE may create conditions that allow occupants to more accurately value their visual comfort. This review also found that acoustic comfort valuation depends on having a steady baseline and demonstrates diminishing returns[39].
Overall, the findings show that perceptibility alone does not determine occupants’ DCE valuations, but also depends on factors including experimental framing, baseline conditions, and overlap between comfort domains. These results reinforce the notion that indoor comfort is an interdependent bundle of attributes, even in experimental settings[57].
5.1.3 Proxy dilution
Proxy features are a popular method for DCE researchers to reduce cognitive burden on participants in eliciting their valuation of indoor comfort. However, this review has found that the use of proxies reduces interpretative clarity of the main effects of a comfort domain, but introduces utility components unrelated to indoor comfort as a whole.
One example is related to the use of proxies in Berto et al.[37] and the challenge of eliciting occupant valuation of visual comfort. The researchers in this case chose automatic shutters with integrated sensors, which ultimately reduces glare and improves thermal comfort. While the positive valuation for this feature can be interpreted to mean occupants value visual comfort, it could also be interpreted as the composite utility of glare reduction, the convenience of automation, and possible thermal benefits from reduced solar radiation, making the visual comfort component difficult to isolate.
Attempting to represent indoor air quality using features such as ventilation systems[28,37] in this review are met with underwhelming valuations that are positive but not statistically significant. This runs counter to revealed preferences where ventilation systems provide the biggest increase in house selling prices[11]. Using the relative attribute importance methodology[17] it was found that air quality to be the most important attribute amongst German occupants[23].
One argument that may explain this effect is that ventilation systems are a background service that is not immediately visible[29], which leads to indoor air quality attracting the lowest WTP in Berto et al.[37]. There is also evidence that installation of ventilation systems does not provide long term returns on energy savings[58]. In this example, when ventilation systems are used as proxies in DCE, the estimated coefficient may reflect perceptions of cost, maintenance, and aesthetics rather than indoor air quality per se.
Another example is the high WTP for coated, sealed windows amongst Swiss occupants[36], which might be driven by its ability to seal the indoor environment from thermal leakage and acoustic intrusion, as well as cut down on solar radiation and glare. In this case, the valuation of a proxy represents a bundled utility gain rather than an increase in any specific comfort domain.
The findings suggest proxy attributes enable occupant comprehension but simultaneously dilute DCE interpretability. Where it is not possible to use direct elicitation, careful attribute design and explicit experimental framing are necessary to ensure the estimates reflect the intended comfort attribute.
Taken together, these three perspectives suggest that statistical outcomes in IEQ DCE studies are shaped not only by intrinsic preference strength, but by perceptual salience, attribute operationalisation, and proxy-induced bundling effects.
5.2 Methodological implications for DCE in IEQ
This review also identifies several methodological implications for the design and interpretation of DCE studies in IEQ research.
5.2.1 Attribute clarity
This review found that DCE attributes need to be precisely defined and unambiguous in order to be interpretable by respondents, especially in context poor instruments such as surveys. Without such clarity, it is possible that increased variance from respondents undermines the stability and statistical significance of the estimated coefficients.
Examples include the definition of indoor ventilation as a direct variable[23,24,39,46] that includes descriptors such as “not good, good, very good” or “better” without specifying the baseline or the extent of these improvements. Because indoor air quality is a combination of factors, from air velocity to particulate matter to chemical pollutants[59], occupants may apply heterogeneous internal interpretations outside of those expected by the researchers. Experimental evidence instead shows that pollutant perception is relatively blunted in occupants’ indoor air quality perception, instead relying on temperature as a proxy marker[55].
This is also true for visual comfort, which is a combination of glare, luminance, and colour temperature[9,57]. The use of proxy variables such as blinds and windows[29,34,37] bundle multiple dimensions of visual comfort, but without clear framing of these variables in the visual comfort context, it is possible that DCE respondents interpret the attribute heterogeneously, and introduce variability into marginal utility estimations.
Overall, these findings suggest that attribute clarity plays a central role in the internal validity and cross-study comparability of DCE results in IEQ research. To enhance interpretability, future DCE applications in indoor comfort should prioritise explicitly quantified or clearly defined quantitative descriptors to enhance interpretability.
5.2.2 Separation of monetary elements
Cost plays a role in DCE as a trade-off dimension against other attributes, allowing researchers to estimate willingness to pay and marginal rates of substitution between attributes. To function as such, this cost needs to be clearly defined (e.g., in absolute dollar terms, as a percentage) and also must be analytically separable from other attributes in the DCE.
This review identified a number of attributes where costs are implicitly embedded within building features when used as comfort proxies. This is prevalent when occupants are given DCEs focusing on retrofitting comfort-improving features such as windows and insulation[36], where multiple utilities components including thermal and acoustic comfort, as well as non-comfort components including operational savings and capital costs of retrofitting combine. This captures multiple utility components simultaneously rather than isolating the comfort element of each attribute.
A further example includes the retrofitting, rental, or purchase of ventilation systems[34,36,37] where minimal energy savings and long payoff periods[58] may introduce a negative financial component into a building feature meant to be the proxy of indoor air quality.
Both these instances may induce a DCE respondent to interpret these attributes to include economic savings and costs instead of, or in addition to, the comfort improvement. This implicit cost signal distorts the comfort element of the utility and complicates the interpretation of willingness to pay, hampering cross study compatibility.
To improve interpretability of willingness to pay estimations, future studies are recommended to separate upfront costs and operational savings from comfort related attributes. Having transparent cost specification enhances internal validity of marginal utility estimations and improves economic interpretation of occupant trade-offs, thus enhancing cross-study comparability.
5.2.3 Experiential DCE
Another methodological finding that arose in this review is the possibility to move towards experiential DCE as opposed to the traditional survey-based DCE. Advances in virtual and augmented reality, along with simulation technologies, have made experiential DCE increasingly feasible.
An advantage of experiential DCE, either in real-life experimental settings or in virtual reality environments, is that it is more accurate to measure occupant preference for certain comfort metrics as seen, such as eliciting visual comfort preferences by adjusting lighting and glare intensities physically[56] or virtually[45]. This not only provides the researcher with more control over the stimuli, as well as reduces the reliance on participants’ subjective interpretation of DCE attribute descriptions.
As highlighted in Section 5.1.2 and Section 5.2.1, where perception and attribute clarity contribute to statistical stability, experiential DCE offers a methodological solution to these issues. However, experiential approaches introduce logistical constraints that may limit sample size.
DCE-based research into comfort would benefit from experiential methodologies where perceptual cues, such as luminance or noise levels, are difficult to convey through textual description. While experiential approaches are not universally required, their application may strengthen attribute clarity and reduce interpretative variability in specific IEQ contexts.
5.3 Heterogeneity and comparability
A further issue highlighted in this review is the lack of comparability between studies that is a symptom of the DCE methodology. In addition, further factors increase heterogeneity between studies and reduce comparability.
5.3.1 Demographic heterogeneity
The studies in this review cover multiple countries and socio-economic contexts, introducing significant heterogeneity across studies.
This review saw how demographic factors such as income influences the magnitude of marginal utility coefficients and willingness to pay estimates. In He et al.[24], it was seen that there is higher emphasis for thermal comfort from lower-middle income households and indoor air quality from upper-middle class occupants. The same upper-middle class occupants also have higher willingness to pay for both thermal comfort and indoor air quality. This was also seen in Greek households, where willingness to pay for energy efficiency increases with income[26].
There is also cross-country heterogeneity in control preference in Amaris et al.[27], suggesting contextual and cultural variation in control preference between occupants in Spain and Germany. This study showed the coefficient for manual thermostat adjustment was lower amongst occupants in Germany than in Spain, across all temperatures and timeframes.
Demographic heterogeneity is therefore not merely a sampling issue but a structural feature of DCE outcomes. Variations in income, location, and socio-cultural context influence both coefficient magnitude and statistical significance, complicating direct comparison across studies. These findings reinforce the need for careful model specification, inclusion of interaction terms where possible, and cautious interpretation of cross-study synthesis.
5.3.2 Mixed signals and non-significance
This review found that statistical significance was not uniformly distributed across comfort domains. As given in Table 6, thermal comfort DCE estimations show consistently positive and statistically significant results, while indoor air quality, visual, and acoustic comfort display greater statistical variability, including several statistically non-significant results.
It is useful to keep in mind that a statistically non-significant result does not imply that an attribute is not preferred, but instead indicates insufficient statistical evidence to form a conclusion with regards to occupant preferences, based on a DCE model and its sample[16]. Rather than indicating underlying occupant preference, this non-significance may arise from high variance, weak attribute framing, or small sample sizes.
Mixed signals may be caused by any number of factors including proxy dilution, attribute clarity, and demographic heterogeneity. Some examples found in this review include Appel-Meulenbroek et al.[34], where using a non-occupant sample may lead to weaker or non-significant estimations.
We can see that differences in scale parameters across studies affect coefficient magnitude and statistical significance, making comparisons across studies unreliable. Therefore, using coefficient direction and statistical significance to compare across studies, as used in this review, can provide more meaningful analyses than magnitude comparisons.
5.4 Theoretical and practical contributions
This review highlights several theoretical and practical implications. Section 5.4.1 addresses structural interaction between comfort domains, Section 5.4.2 highlights agency as an additional utility component within these bundles.
5.4.1 Multi-attribute bundle concept
Previous sections have discussed that indoor comfort cannot be separated into discrete domains. Studies have shown that it is experienced as an integrated domain[20] and that indoor environment variables interact both physically and perceptually[57].
Based on the background provided in Section 2, a standard DCE assumes additive separability between the attributes, where the marginal utility of each attribute is independent of the levels of other attributes. However, as this review has found, the assumption of full independence between comfort attributes does not hold in practice and thus need to be accounted for using interaction terms.
A number of examples in this review show interaction effects including the use of window upgrades that affect not only thermal comfort but also acoustic and visual comfort[36] and ventilation features that improve indoor air quality but also affect thermal comfort[37]. The thermo-adaptive window opening actions in Galassi and Madlener[10] not only lower temperatures and improve thermal comfort, but also improve ventilation and increase energy consumption[21].
These interaction effects go across comfort domains through both physical interaction, given above, as well as perceptual interaction such as between thermal comfort and indoor air quality[54]. These interactions will complicate coefficient interpretation and may influence statistical stability.
These arguments show that the additive model may oversimplify indoor environmental quality valuation using DCE, despite its usefulness in other fields. Attributes that are bundled reduce the clarity of attributing estimation to a single indoor comfort domain, but using interaction terms may improve model specification, enhance interpretability, and provide more statistically reliable estimates.
5.4.2 Control and agency in IEQ valuation
Across multiple studies in this review, occupants can be seen to consistently and positively value the ability to adjust their environment such as by opening windows[10], degree of system control[23], and overriding smart system controls[27] to suit their comfort needs. In these examples, variables that represent occupant agency are both positive and statistically significant.
Given that utility in random utility equation in equation (1), we can see that the utility from control may enter this equation instrumentally through achieving higher comfort states and procedurally, as intrinsic utility from having the agency to influence the indoor environment.
The examples in this review also show that control-derived utility comes from both the action of adjusting the environment, such as adjusting thermostat settings or opening windows, as well as the perceived agency of being able to make adjustments, even if this is not utilised[27]. This perception of increased comfort from having degrees of control is present even in real-world settings[55].
Both perspectives come into play in smart systems[27], where occupants accept temperature deviations away from their optimum comfort level, but exhibit positive marginal utility from being able to exert control over these systems.
Using the reported coefficients tabulated in Amaris et al.[27] “Determinants of preferences for smart energy technologies”, specifically the partial log-odds from the Spanish survey, without rescaling or transformation, are given in Table 7.
Table 7. Partial log-odds for smart system time and temperature deviation (Spanish sample).
| 1 °C | 2 °C | |
| 2 hours | 0.878*** | 0.928*** |
| 4 hours | 0.873*** | 0.934*** |
| 6 hours | 1.038*** | 0.957*** |
*** p < 0 .001 (two-sided).
Figure 2 plots the partial log-odds (β coefficients) directly reported in published results[27] and are interpreted based on the reference level specified in the original model, reflecting marginal utility changes rather than changes in thermal comfort.
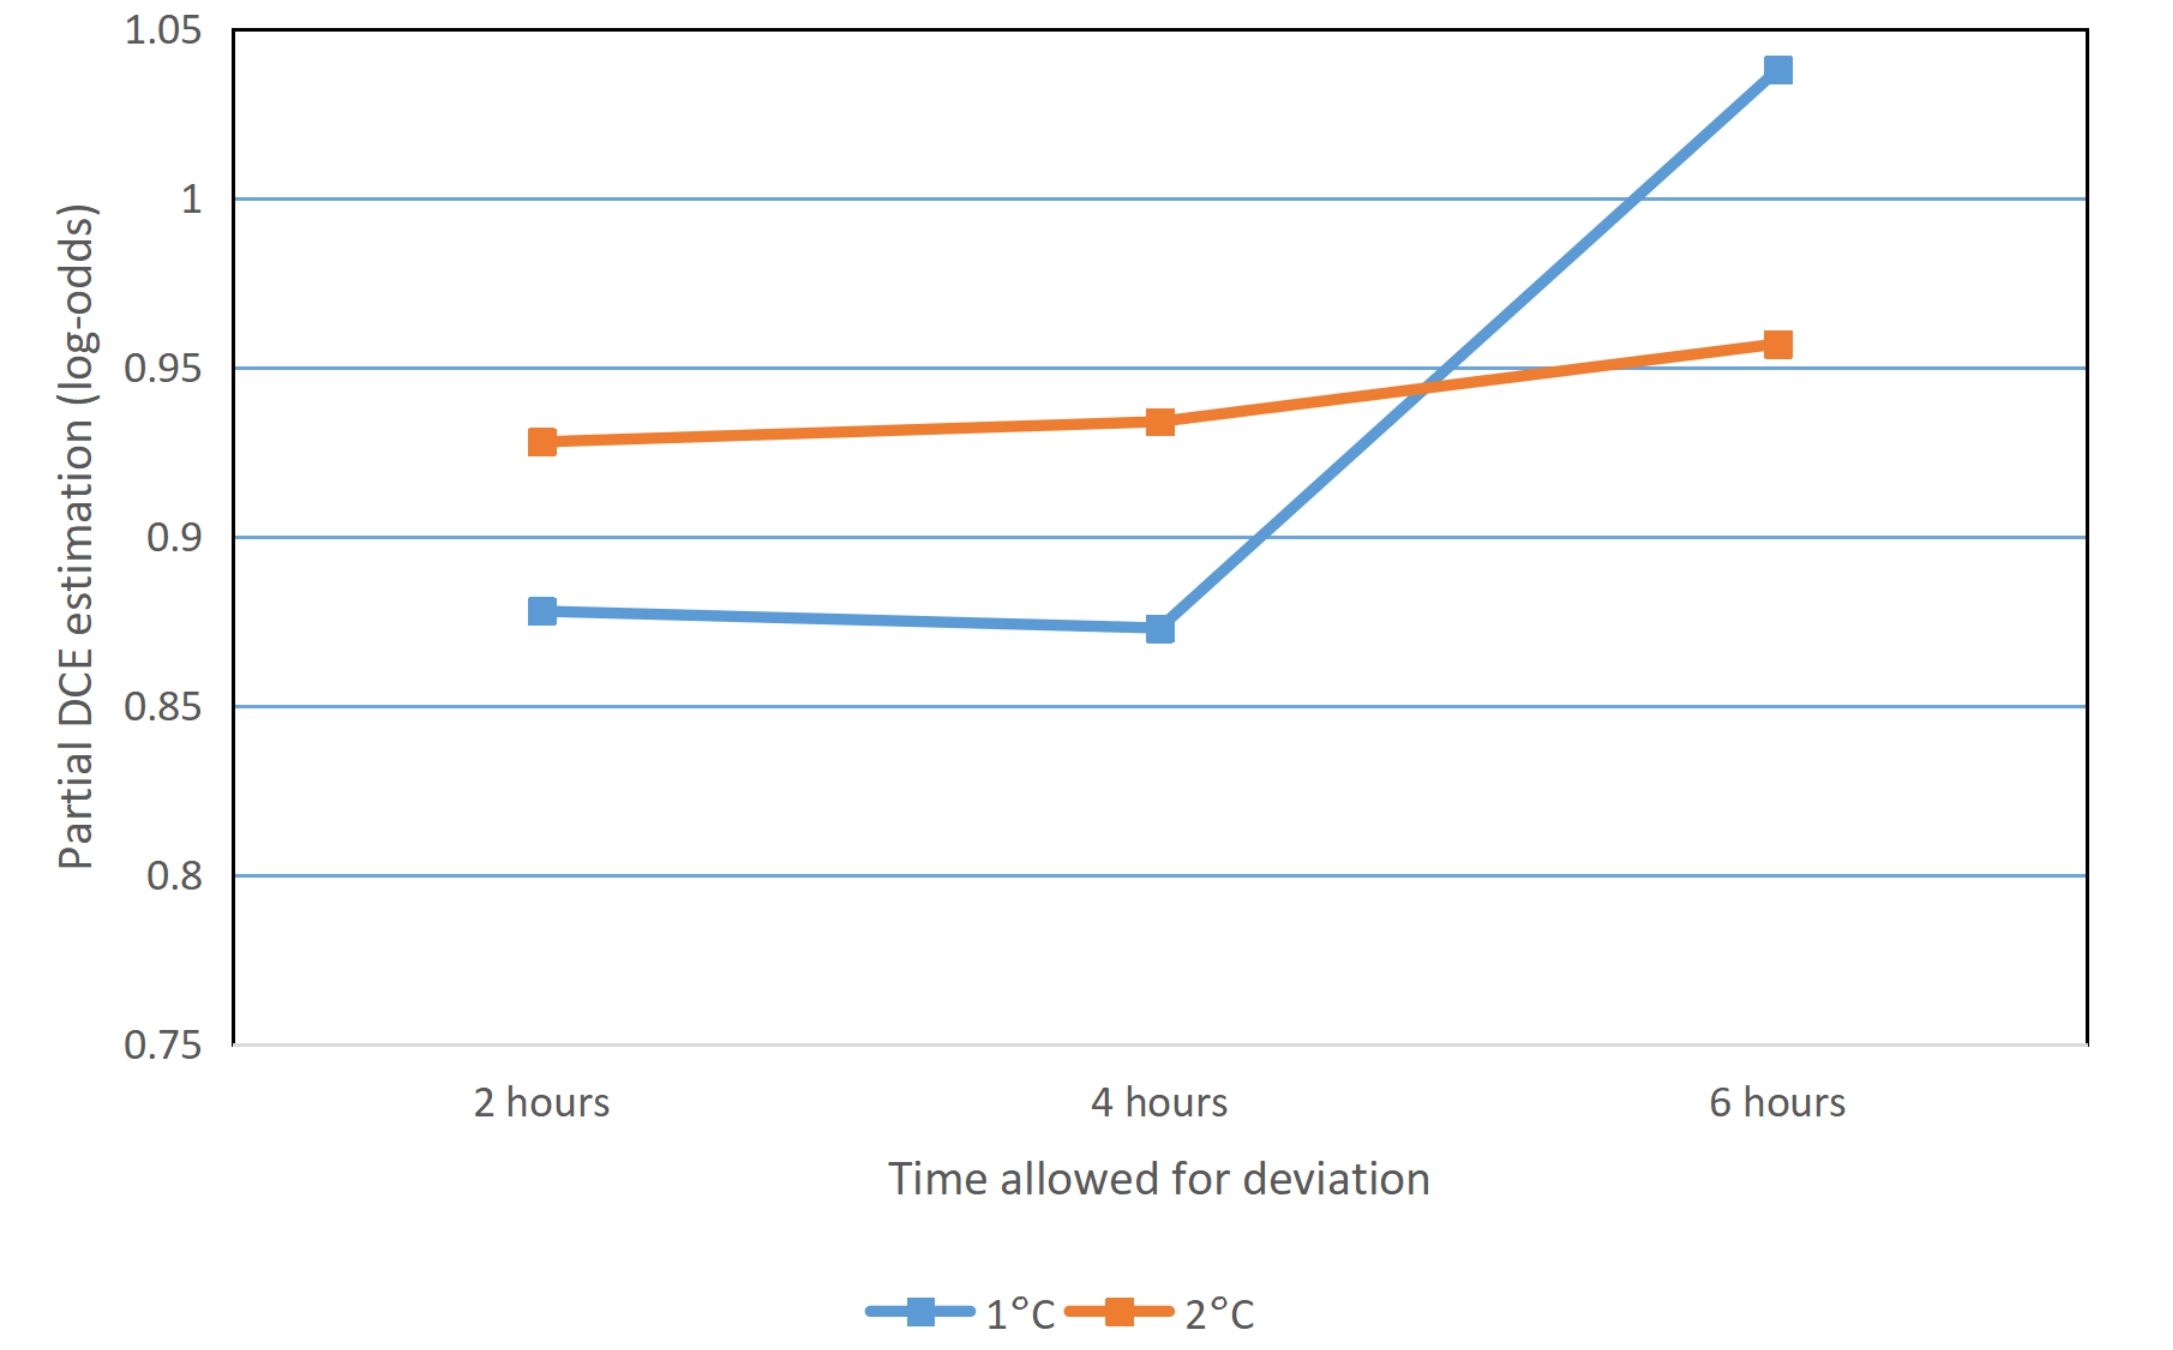
Figure 2. Marginal utility associated with smart thermostat deviation and duration.
The positive and increasing marginal utilities associated with longer and larger deviation windows, shown in Figure 2, suggest that respondents value the flexibility of extended control, relative to having no adjustment ability. The slight dip at 4 hours shows that variations across time horizons are not strictly linear, but should be interpreted cautiously in the absence of interaction terms in the original model.
In DCE modelling, occupants’ ability to control their environment may increase marginal utility, independent of comfort, while also interacting with comfort attributes without adequate methodological framing. This may also change willingness to pay, especially for smart systems with no override elements vis-à-vis those that provide some degree of adjustment.
In practice, we can see that a positive valuation of control means that when designing or retrofitting smart homes, it is important to allow occupants to perceive control, as this is not only a desirable attribute in theory, but also evidenced in real world contexts[60]. This finding also suggests that override capability should not be removed purely for the sake of automation efficiency.
6. Conclusions
This review has systematically examined existing literature on indoor comfort, narrowing it down to 21 studies that utilise DCE to analyse elements of indoor comfort, either through direct elicitation or through building features that improve thermal comfort, indoor air quality, visual comfort, and acoustic comfort. By analysing coefficient direction and statistical significance across heterogeneous study designs, this study reaches the following conclusions.
6.1 Different strength of evidence across comfort domains
The review finds consistent and statistically robust positive valuations for thermal comfort across both direct elicitation and proxy-based operationalisations. Thermal comfort emerges as the most reliably valued IEQ domain in DCE studies.
Indoor air quality shows positive but more heterogeneous results. Visual and acoustic comfort display mixed statistical significance and greater variability across studies. Non-significant results in these domains do not imply lack of value, but rather reflect methodological variability, proxy dilution, sample heterogeneity, and attribute framing challenges.
6.2 Comfort as a multi-attribute bundle
This review reinforces the concept of comfort being a multi-attribute bundle instead of separable domains. Physical and perceptual cross-effects between indoor comfort variables are evident across DCE studies including:
• DCE of windows where it was shown that occupants simultaneously value thermal, acoustic, and visual comfort when making choices.
• DCE estimations of ventilation that demonstrate cross-domain effects in indoor air quality and thermal comfort.
• Arguments in DCE design that show lighting interacting with thermal comfort.
Thus, standard additive DCE may oversimplify indoor comfort without the necessary interaction terms.
6.3 Utility from control and agency
Some studies showed that occupants positively value occupant control of indoor comfort, generating utility beyond improvements in indoor comfort. The ability to adjust the personal environment or override controls are valued beyond otherwise modest comfort gains. This suggests that control could be its own attribute in indoor comfort DCE, rather than being embedded in other attributes.
6.4 Methodological implications
This review identified several methodological challenges including proxy dilution, attribute clarity, embedded costs crosstalk, and inter-study heterogeneity.
As highlighted in Section 5.1.3, the use of proxies in DCE when attempting to value indoor comfort come with proxy dilution effects. When proxies are used as DCE attributes, occupants’ subjective judgement may assign utilities and costs outside of those specified in the experimental design to this feature. This embedment of multiple utility and costs will cloud the interpretation of the DCE coefficient, causing mixed signals and unreliable utility and WTP estimates.
Some survey based DCE also suffer from weak attribute clarity, using subjective and objective frames of references that can be poorly understood by DCE participants. Without this frame of reference, respondents may apply their own subjective interpretation and muddle the results of the DCE.
Even with perfect attribute clarity, the use of proxy features in DCE also come with embedded costs that create confounding signals with WTP. Occupants have been shown to consider costs and savings when making proxy variable choices, thus embedding a cost term in the utility estimates that prevent clear WTP signals.
For future reviews, it can be seen that sample heterogeneity and scale differences are additional roadblocks to comparison across DCE studies, in addition to the experimental framework issue highlighted in earlier sections.
Future indoor environment DCE research would benefit from having clear attribute definitions with explicit baselines, as this allows not only more reliable participant responses where heterogeneous subjectivity does not affect estimate reliability.
The costs and potential savings from a DCE alternative should also be separated from the main effects attribute, using tools such as interaction terms. This will allow any utility and WTP estimates to provide clear signals about occupant preferences. Bundling effects can also be reduced with interaction terms, to again allow control against other effects that would otherwise be embedded in the main effects.
This review also makes a case for experiential DCE, where comfort attributes, such as sound and lighting, are less likely to be well understood without direct stimulus. This may include using experimental settings where these attributes can be controlled or virtual reality settings that can be programmed to the researchers’ needs.
6.5 Practical implications
In the context of building designs and retrofits, this study found that the primary driver for indoor comfort perception in DCE is thermal comfort, which is backed by indoor comfort research in other fields. This valuation for thermal comfort may mean that buildings need to account for thermal comfort first before other comfort aspects.
This study has found from the positive marginal utility of occupant control that building automation system designers should leave room for manual control and overrides for occupants. By allowing occupants agency over the indoor environment, not only do occupants feel more comfortable by having a sense of control, but also happier from having the ability to make changes, even if no changes are made.
6.6 Limitations
This review synthesised coefficient sign and statistical significance rather than effect magnitude due to scale heterogeneity across DCE studies. While this approach improves comparability, it limits quantitative aggregation. In addition, the relatively small number of studies in visual and acoustic domains constrains generalisation from these studies.
Overall, this review demonstrates that DCE is a viable framework for valuing indoor environmental quality, particularly for thermal comfort and occupant control. However, methodological refinement is necessary to accurately capture the perceptual, interactive, and multi-dimensional nature of indoor comfort. Moving towards clearer attribute framing, explicit modelling of agency, and experiential DCE designs represents a promising direction for future IEQ valuation research.
Supplementary materials
The supplementary material for this article is available at: Supplementary materials.
Acknowledgements
We would like to thank the researchers and their tireless efforts in advancing discrete choice experiments (DCE), especially with regards to indoor comfort in homes and offices, allowing us to stand on the shoulders of giants. We also thank this journal’s editors and reviewers for spurring this paper towards a more academic direction.
Authors contribution
Syahid A: Conceptualization, methodology, investigation, writing-original draft, visualization.
Damiati SA: Methodology, investigation, writing-original draft, writing-review & editing.
Rijal HB: Supervision, writing-review & editing.
Conflicts of interest
Hom Bahadur Rijal is an Editorial Board Member of Journal of Building Design and Environment. The authors declare that they have no competing interests.
Ethical approval
Not applicable.
Consent to participate
Not applicable.
Consent for publication
Not applicable.
Availability of data and materials
Not applicable.
Funding
None.
Copyright
© The Author(s) 2026.
References
-
1. Cabeza LF, Bai Q, Bertoldi P, Kihila JM, Lucena AFP, Mata É, et al. Buildings. In: Shukla PR, Skea J, Slade R, Al Khourdajie A, van Diemen R, McCollum D, Pathak M, Some S, Vyas P, Fradera R, Belkacemi M, Hasija A, Lisboa G, Luz S, Malley J, editors. Climate change 2022: mitigation of climate change. Contribution of Working Group III to the Sixth Assessment Report of the Intergovernmental Panel on Climate Change. Cambridge (UK): Cambridge University Press; 2023. p. 953-1048.[DOI]
-
2. International Energy Agency. Buildings [Internet]. 2022. Available from: https://www.iea.org/reports/buildings
-
3. Damiati SA, Ahmad Zaki S, Rijal HB, Wonorahardjo S. Field study on adaptive thermal comfort in office buildings in Malaysia, Indonesia, Singapore, and Japan during hot and humid season. Build Environ. 2016;109:208-223.[DOI]
-
4. Jeong SH, Irakoze A, Lee YA, Kim KH. Balancing thermal comfort and energy efficiency of a public building through adaptive setpoint temperature. Buildings. 2025;15(24):4568.[DOI]
-
5. International Energy Agency. Transition to sustainable buildings. Paris: International Energy Agency; 2013. Available from: https://www.oecd.org/content/dam/oecd/en/publications/reports.pdf
-
7. de Dear R, Brager GS. Developing an adaptive model of thermal comfort and preference. ASHRAE Trans. 1998; 104(Part 1):145-167. Available from: https://escholarship.org/uc/item/4qq2p9c6
-
8. Arakawa Martins L, Soebarto V, Williamson T. A systematic review of personal thermal comfort models. Build Environ. 2022;207(A):108502.[DOI]
-
9. Molina G, Donn M, Johnstone ML, MacGregor C. The feeling of comfort in residential settings I: A qualitative model. Build Cities. 2023;4(1):422-440.[DOI]
-
10. Galassi V, Madlener R. Shall I open the window? Policy implications of thermal-comfort adjustment practices in residential buildings. Energy Policy. 2018;119:518-527.[DOI]
-
11. Lou J, Wang B, Yuan Z, Lu W. Willingness to pay for well-being housing attributes driven by design layout: Evidence from Hong Kong. Build Environ. 2024;251:111227.[DOI]
-
13. Wang J, Min H, Li T, Li J, Jiang Y, Zhang J, et al. Women’s preferences and willingness to pay for AI chatbots in women’s health: Discrete choice experiment study. J Med Internet Res. 2025;27:e67303.[DOI]
-
14. Syahid A, Tareq MA, Zaki SA. Sustainability or bust: Malaysian home buyers’ stated preferences for sus-tainable housing. MATEC Web Conf. 2016;68:13001.[DOI]
-
15. Rommel K, Meyerhoff J. Preferences for attributes of running events: Evidence from a choice experiment among recreational runners. Int J Phys Mark Spons. 2026;27(1):63-80.[DOI]
-
16. Hensher DA, Rose JM, Greene WH. Applied choice analysis. Cambridge: Cambridge University Press; 2015.[DOI]
-
17. Orme BK. Getting started with conjoint analysis: Strategies for product design and pricing research second edition. Madison: Research Publishers; 2010.
-
19. Alpizar F, Carlsson F, Martinsson P. Using choice experiments for non-market valuation. Econ Issues J Art. 2003;8(1):83-110. Available from: https://ideas.repec.org/a/eis/articl/103alpizar.html
-
20. Fuller S, Bulkeley H. Changing countries, changing climates: Achieving thermal comfort through adaptation in everyday activities. Area. 2013;45(1):63-69.[DOI]
-
21. Fabi V, Andersen RV, Corgnati S, Olesen BW. Occupants' window opening behaviour: A literature review of factors influencing occupant behaviour and models. Build Environ. 2012;58:188-198.[DOI]
-
22. McFadden D. The choice theory approach to market research. Mark Sci. 1986;5(4):275-297.[DOI]
-
23. Galassi V, Madlener R. Some like it hot: The role of environmental concern and comfort expectations in energy retrofit decisions. SSRN Electron J. 2016.[DOI]
-
24. He C, Yu S, Han Q, de Vries B. How to attract customers to buy green housing? Their heterogeneous willingness to pay for different attributes. J Clean Prod. 2019;230:709-719.[DOI]
-
25. Li N, Ryan L, Wheatley J. Inferring households' heterogeneous preference for home energy efficiency investment trade-offs: An example from a nationally representative Irish survey. In: 46th International Association for Energy Economics International Conference (IAEE2025); 2025 Jun 15-18; Paris, France. Available from: https://iaee2025paris.org/download/contribution/fullpaper.pdf
-
26. Damigos D, Kaliampakou C, Balaskas A, Papada L. Does energy poverty affect energy efficiency investment decisions? First evidence from a stated choice experiment. Energies. 2021;14(6):1698.[DOI]
-
27. Amaris G, Vesely S, Klöckner CA. Smart thermostats, washing machines, and electric vehicle charging: Determinants of preferences among German and Spanish consumers. Energy Res Soc Sci. 2025;129:104344.[DOI]
-
28. Bragolusi P. Energy efficiency in buildings: willingness to pay for buildings energy retrofit [dissertation]. Padova: Università degli Studi di Padova; 2019.
-
29. Baker E, Moore T, Daniel L, Caines R, Padilla H, Lester L. Sustainable social housing retrofit? Circular economy and tenant trade-offs. Melbourne (Australia): Australian Housing and Urban Research Institute Limited; 2023. Final Report No. 397.[DOI]
-
31. Veritas Health Innovation. Covidence [software]. 2025. Available from: https://www.covidence.org/
-
32. Harzing AW. Publish or Perish [software]. 2007. Available from: https://harzing.com/resources/publish-or-perish
-
33. Hensher DA. Identifying the influence of stated choice design dimensionality on willingness to pay for travel time savings. J Transp Econ Policy. 2004;38(3):425-446.[DOI]
-
34. Appel-Meulenbroek R, Arentze T, Kemperman A, Buskermolen W, Van den Putten V. Willingness to pay for healthy office workplace aspects - preferences of workplace decision makers. In: 27th Annual European Real Estate Society Conference (ERES 2021); 2021 Jun 2-5; Kaiserlautern, Germany. The Netherlands: European Real Estate Society; 2021. Available from: https://library.eres.org/eres2021/paperupload/P_20210520091936_9579.pdf
-
35. Bakaloglou S, Belaïd F. The role of uncertainty in shaping individual preferences for residential energy renovation decisions. Energy J. 2022;43(4):127-158.[DOI]
-
36. Banfi S, Farsi M, Filippini M, Jakob M. Willingness to pay for energy-saving measures in residential buildings. Energy Econ. 2008;30(2):503-516.[DOI]
-
37. Berto R, Tintinaglia F, Rosato P. How much is the indoor comfort of a residential building worth? A discrete choice experiment. Build Environ. 2023;245:110911.[DOI]
-
38. Hess S, Palma D. Apollo: A flexible, powerful and customisable freeware package for choice model estimation and application. J Choice Model. 2019;32:100170.[DOI]
-
39. Chau CK, Tse MS, Chung KY. A choice experiment to estimate the effect of green experience on preferences and willingness-to-pay for green building attributes. Build Environ. 2010;45(11):2553-2561.[DOI]
-
40. Faccioli M, Lucarelli C, Mazzoli C, Severini S. What are the policy drivers to undertake green retrofitting investments? The role of tax incentives and communication in Italian households’ decision-making. Ital Econ J. 2025;11:1211-1237.[DOI]
-
41. Traets F, Sanchez DG, Vandebroek M. Generating optimal designs for discrete choice experiments in R: The idefix package. J Stat Soft. 2020;96(3):1-41.[DOI]
-
42. Czajkowski M. Models for discrete choice experiments [software]. Warsaw: University of Warsaw; 2025. Available from: https://github.com/czaj/DCE/activity
-
43. Hole AR. Fitting mixed logit models by using maximum simulated likelihood. Stata J Promot Commun Stat Stata. 2007;7(3):388-401.[DOI]
-
44. Gu Y, Hole AR, Knox S. Fitting the generalized multinomial logit model in stata. Stata J Promot Commun Stat Stata. 2013;13(2):382-397.[DOI]
-
45. Hou C, Lan H. A discrete choice experiment approach towards students’ preferences of the lighting and acoustic condition in a virtual classroom. In: 57th International Conference of the Architectural Science Association; 2024 Nov 26-29; Australia. Southport: Australia and New Zealand Architectural Science Association; 2025. Available from: https://archscience.org/wp-content/uploads/2025/03/A-discrete-choice-experiment-approach-towards-students-preferences-of-the-lighting-and-acoustic-condition-in-a-virtual-classroom.pdf
-
46. Jusoh Z, Rahim H, Bakar E, Jamaluddin A, Rasdi R, Zaini Z. The choice of sustainable housing towards sustainable development: A case study in Malaysia. OIDA Int J Sustain Dev. 2012;4(5):83-98. Available from: https://oidaijsd.com/wp-content/uploads/2019/04/04-05-07.pdf
-
47. Marmolejo-Duarte C, Ampudia-Farias A. Do energy performance certificates matter in housing selection: Evidence from choice experiments in Barcelona. In: PLEA 2018: Smart and Healthy Within the Two-Degree Limit: proceedings of the 34th International Conference on Passive and Low Energy Architecture; 2018 Dec 10-12, Hong Kong, China. Hong Kong: Passive and Low Energy Architecture International Conference; 2018. p. 13-18. Available from: https://hdl.handle.net/2117/341330
-
48. Marmolejo-Duarte C, Bravi M. Does the energy label (EL) matter in the residential market? A stated preference analysis in Barcelona. Buildings. 2017;7(2):53.[DOI]
-
49. Stolyarova E, Le Cadre H, Osso D, Allibe B. Stated preferences for space heating investment. In: The 13th International Conference on Economic Modeling and Data Science (EcoMod 2015); 2015 Jul 15-17; Boston, United States. 2015. Available from: https://ecomod.net/system/files/Stolyarova_heating_inv_V3.pdf
-
50. Taranu V, Lizin S, Verbeeck G. Are dwellers deliberative or heuristic in their decisions to invest in energy efficient renovation measures. In: ECEEE Summer Study Proceedings; 2017 May 29-Jun 3; Hyères, France. Sweden: ABA Intercopy; 2017. p. 1979-1988. Available from: https://www.eceee.org/library/conference_proceedings/eceee_Summer_Studies/2017/9-consumption-and-behaviour/are-dwellers-deliberative-or-heuristic-in-their-decisions-to-invest-in-energy-efficient-renovation-measures/
-
52. Allison PD. Comparing logit and probit coefficients across groups. Sociol Meth Res. 1999;28(2):186-208.[DOI]
-
53. Huebner GM, Cooper J, Jones K. Domestic energy consumption: What role do comfort, habit, and knowledge about the heating system play? Energy Build. 2013;66:626-636.[DOI]
-
54. Alonso A, Suárez R, Llanos-Jiménez J, Muñoz-González CM. Students’ thermal and indoor air quality perception in secondary schools in a Mediterranean climate. Energy Build. 2025;333:115479.[DOI]
-
55. Torriani G, Lamberti G, Fantozzi F, Babich F. Exploring the impact of perceived control on thermal comfort and indoor air quality perception in schools. J Build Eng. 2023;63(A):105419.[DOI]
-
56. Despenic M, Chraibi S, Lashina T, Rosemann A. Lighting preference profiles of users in an open office environment. Build Environ. 2017;116:89-107.[DOI]
-
57. Yang W, Moon HJ. Combined effects of acoustic, thermal, and illumination conditions on the comfort of discrete senses and overall indoor environment. Build Environ. 2019;148:623-633.[DOI]
-
58. Jakob M. Marginal costs and co-benefits of energy efficiency investments. Energy Policy. 2006;34(2):172-187.[DOI]
-
59. Ma N, Aviv D, Guo H, Braham WW. Measuring the right factors: A review of variables and models for thermal comfort and indoor air quality. Renew Sustain Energy Rev. 2021;135:110436.[DOI]
-
60. Garg R, Cui H. Social contexts, agency, and conflicts: Exploring critical aspects of design for future smart home technologies. ACM Trans Comput-Hum Interact. 2022;29(2):11.[DOI]
Copyright
© The Author(s) 2026. This is an Open Access article licensed under a Creative Commons Attribution 4.0 International License (https://creativecommons.org/licenses/by/4.0/), which permits unrestricted use, sharing, adaptation, distribution and reproduction in any medium or format, for any purpose, even commercially, as long as you give appropriate credit to the original author(s) and the source, provide a link to the Creative Commons license, and indicate if changes were made.
Publisher’s Note
Science Exploration remains a neutral stance on jurisdictional claims in published
maps
and institutional affiliations. The views expressed in this article are solely those
of
the author(s) and do not reflect the opinions of the Editors or the publisher.
Share And Cite


Science Exploration Style
Syahid A, Damiati SA, Rijal HB. A review of indoor environmental quality studies using discrete choice experiments: Valuing comfort. J Build Des Environ. 2026;4:2025138. https://doi.org/10.70401/jbde.2026.0037
Tips
Copy completed.
Submit a Manuscript
Author Instructions
Cite this Article
Article Metrics
0
View
0
Download
Cited
Article Updates

- Abstract
- Keywords
- 1. Introduction
- 2. Discrete Choice Experiment for Indoor Comfort
- 3. Methodology
- 4. Results
- 5. Discussion and Analysis
- 6. Conclusions
- Supplementary materials
- Acknowledgements
- Authors contribution
- Conflicts of interest
- Ethical approval
- Consent to participate
- Consent for publication
- Availability of data and materials
- Funding
- References
- Copyright
Science Exploration Style
Syahid A, Damiati SA, Rijal HB. A review of indoor environmental quality studies using discrete choice experiments: Valuing comfort. J Build Des Environ. 2026;4:2025138. https://doi.org/10.70401/jbde.2026.0037
copy
Share Link
copy