Automated approach for indoor geometric quality inspection data collection based on BIM and quadruped robot equipped with LiDAR
Yi Tan
1

,
Zihong Wen
2
,
Yuzhe Chen
3
,
Ting Deng
4
,
Hongzhe Yue
5
,
Dawei Hao
6
,
Qian Wang
5,*
*Correspondence to:
Qian Wang, Department of Construction and Real Estate, School of Civil Engineering, Southeast University, Nanjing 211189, Jiangsu, China.
E-mail: qianwang@seu.edu.cn
J Build Des Environ. 2025;3:202569. 10.70401/jbde.2025.0019
Received: August 25, 2025Accepted: November 11, 2025Published: November 18, 2025
This article belongs to the Special lssue BIM-Driven Intelligent Construction and Operation
Abstract
Indoor geometric quality inspection plays a crucial role in construction quality control. Light detection and ranging (LiDAR) can obtain point cloud data of the indoor environments in full range, which then can be utilized to efficiently extract geometric features of building elements for inspection. However, existing data collection of indoor environments using LiDAR is still manually planned and implemented, which is quite time-consuming as the scanning space is usually unknown and the movability of equipment is limited. Therefore, this paper proposes an automated approach for indoor geometric quality inspection data collection based on Building Information Model (BIM) and quadruped robot equipped with LiDAR. First, BIM with accurate geometric and semantic information of building is integrated with heuristic algorithm to automate scan planning, including scan stations and order. Second, Simultaneous Localization and Mapping (SLAM) integrates with BIM is equipped into a quadruped robot to achieve automated data collection capability. Finally, an intelligent execution module for scanning point cloud data in indoor environments is introduced. The proposed approach is validated in real indoor environments. Compared with traditional data collection methods, the experiment results show that the proposed approach can save 42% of scanning time, and the scanned point cloud data has better quality and enough density, which significantly improves the efficiency of inspection data collection for indoor geometric quality management. By unifying BIM-driven planning, SLAM-based localization, and quadruped robot mobility into a single framework, this study introduces a novel approach for large-scale automated indoor inspection, with attention to connected areas to ensure continuity across multiple spaces.
Keywords
BIM, data collection, quadruped robot, scan scheme, autonomous navigation
1. Introduction
Indoor geometric quality inspection is one of the primary monitoring methods for building safety, exerting significant influence on both construction quality control and subsequent interior decoration projects[1]. Currently, the inspection heavily relies on manual methods, where construction workers typically utilize tools such as spirit levels, measuring tapes[2-4], and vernier calipers to measure dimensional information of indoor components, followed by comparing the built dimensions with the design information to determine whether the components meet quality requirements. However, manual inspection often suffers from inefficiency and low precision[5-7]. With urbanization progressing rapidly, construction activities have significantly increased, leading to a substantial increase in inspection workload[8]; the aging construction workforce further exacerbates labor shortages, making large-scale, high-frequency inspection difficult to achieve. Moreover, the current inspection methods mostly rely on sampling, which cannot comprehensively reflect the complete situation of indoor geometric quality, thereby posing potential risks for subsequent work.
With the development of surveying and radio frequency technology, light detection and ranging (LiDAR) technology is increasingly employed in the field of indoor geometric quality inspection of buildings. LiDAR can simultaneously scan the physical dimensions of multiple components, greatly improving the efficiency of geometric quality inspection and reducing labor costs. Indoor 3D laser scanning eliminates the need for direct contact with the measurement target and avoids the risk of physical damage. In addition, LiDAR can comprehensively capture the surface shape, color, texture, and spatial location of the target, and can obtain a large amount of indoor component data in a short period of time[9]. Therefore, LiDAR is commonly used for reverse modeling of buildings with complex indoor structures and for geometric quality inspection of indoor components. Compared with traditional component measurement technology, LiDAR can greatly improve work efficiency and measurement accuracy[10]. However, obtaining high-quality point cloud data of the indoor environments typically requires careful scan planning[11]. In addition, scan planning is usually conducted manually and relies on construction personnel’s experience. This can be subjective and error-prone[12], especially when floor plan drawings are not available. The current manipulation of LiDAR-based data collection also limits the efficiency of inspection. To complete the whole indoor scanning, workers need to manually move the scanner and leave it alone when scanning to reduce the subjectively negative effect.
Recently, robots are widely used in various industries, such as rescue and emergency response[13], industrial heavy lifting, and intelligent daily inspection[14]. Considering their strong mobility and load capacity, unmanned ground vehicles, such as quadruped robots, have the potential to be employed in LiDAR-based data collection for indoor environments, thereby reducing human involvement and achieving automation. Understanding the building layout in advance is essential for effectively achieving scan station positioning and deploying these robots. In this context, Building Information Model (BIM), with its rich physical information and spatial topology relationships of the built environment, can facilitate this understanding by supporting visibility-based scan station selection for full component coverage and safety-constrained route planning to avoid collisions[15]. From a practical standpoint, this BIM-supported planning not only ensures that scan stations cover key inspection components without blind spots but also lays a safety foundation for subsequent robotic execution, preventing collisions with structural elements like walls or columns during navigation. The robot, meanwhile, executes the plan with repeatable motion and in-scene localization. This integration reduces labor and shifts sampling-based checks toward coverage-oriented acquisition; it not only solves manual inefficiency but also aligns with the trend of intelligent inspection, addressing the demand for more accurate, efficient, and automated indoor geometric quality assessment in modern engineering scenarios. Despite prior work, there are still some shortcomings that limit deployment. As shown in Table 1, most existing studies ignore doorways in planning, leading to cross-space data discontinuity, incomplete connected-space collection, and higher collision risks, and use fixed robotic motion parameters regardless of environment type, while few adequately consider how robot actions should adapt at doorways or in narrow corridors to maintain execution stability[16-18]. Moreover, existing visibility analysis methods like triangular mesh-based, suffer from high computational cost, further restricting efficiency[18]. The consequences include a higher risk of collisions at doorways, getting stuck in narrow passages, incomplete data collection in connected spaces, and low computational efficiency, all of which directly restrict the automation level and reliability of robot-based indoor inspection.
Table 1. Comparison between this study and existing literature.
| Publication | Year | BIM Utilization | Robot Motion Control | Cross-space Data Handling |
| Park et al.[18] | 2023 | BIM for navigation grid; triangular mesh visibility analysis, high computation cost | Fixed obstacle avoidance; constant speed; narrow-area collision risk | No doorway transit stations or dedicated scan stations |
| Zhai et al.[17] | 2024 | BIM + IndoorGML for navigation graphs | Constant speed; fixed safety buffer | BIM-based subspace connectivity; no doorway transit stations or scan stations |
| Chung et al.[16] | 2025 | No BIM | Fixed speed; fixed slope threshold | Single-scene only |
| This study | - | BIM extracts inspection surfaces; detection surface visibility analysis, low computation cost | Dynamic speed for open/narrow areas; adaptive obstacle avoidance | Arranges doorway transit stations; dedicated scan stations |
BIM: building information model; IndoorGML: Indoor Geographic Markup Language.
To address these shortcomings, we present a workflow of BIM-driven planning and quadruped robot execution. The input is the design-state BIM, which is converted to a robot-executable map. In parallel, a line-of-sight visibility model is derived to determine whether candidate scan stations can observe the target inspection points. This model is built on BIM-extracted target inspection surfaces, avoiding the high computation cost of triangular mesh-based analysis in existing studies. To ensure cross-space continuity, doorway transit stations and heading control are incorporated into the workflow. Additionally, door width and safety distance are explicitly considered during the planning phase. Based on this representation, the planning process computes station selection and routes under access constraints and outputs a scan scheme that specifies the station set, execution order, and dwell time. During execution, BIM is integrated with simultaneous localization and mapping (SLAM) for real-time localization and online adjustment, with speed and inflation radius adapted for open versus narrow passages. A LiDAR-equipped quadruped robot follows the scan scheme to complete multi-station acquisition, improving coverage and execution reliability while reducing manual effort and stall risk.
The following of this paper is organized as follows: Related work introduces recent research on indoor laser scan planning and automatic point cloud data collection. Methodology details the implementation of the proposed automated data collection approach. A specific case is implemented to validate the proposed approach in a real construction project in Experiment and results. Conclusions concludes the paper and puts forward the limitations as well as directions of future improvement.
2. Related Work
2.1 LiDAR-based indoor scan planning
LiDAR can collect completely high-quality point cloud data for indoor geometric quality inspection[19]. While considering the endurance of laser, data collection time cost, and data quality of scanned points[20], the planning for scanning[21], which is a multi-objective planning problem[22], is usually conducted through continuous iterative evolution in the feasible region[23] through relevant heuristic algorithms[24], where indoor environments and floor plan are usually required. Chen et al.[25] and Zeng et al.[26] have conducted scan planning by obtaining indoor spatial information from two-dimensional drawings. Li et al.[27] highlighted the necessity of scanning indoor environments in full 3D to obtain comprehensive information about structural elements such as walls, floors, columns, beams, and ceilings. Building upon this requirement, Noichl et al.[28] developed an adaptive scan planning method that dynamically updates scanner positions based on real-time visibility and occlusion analysis, aiming to enhance spatial coverage and data acquisition efficiency. Nevertheless, these approaches have not integrated BIM or exploited the geometric and semantic information it contains, which limits their ability to systematically support multi-room connectivity and pre-scan planning.
BIM contains rich information, including component physical geometry, site distribution, and component topology relationships[29], which provides enough information for scan planning[30]. Therefore, some researchers have utilized BIM for 3D spatial planning. For example, Chen, et al.[31] proposed a framework for optimizing camera placement using BIM to address the challenge of finding the best camera configuration in dynamic construction site monitoring. Chen, et al.[32] proposed a planning method for a large-scale building façade terrestrial laser scanning (TLS) observation network based on 3D models. In addition, Qiu et al.[33] proposed a method to generate a scan scheme based on the point cloud model, which has the advantages of higher scanning coverage and shorter scanning distance. Hu and Gan[34] constructed room-centric next-best-view paths using BIM models; Park et al.[18] used BIM to generate robotic navigation paths. Xu et al.[35] proposed a two-stage TLS viewpoint optimization method based on BIM, and Zhai et al.[17] developed a three-layer semantic navigation framework integrating BIM and Indoor Geographic Markup Language (IndoorGML) to support connectivity-aware path planning across multiple rooms.
Notably, BIM-LiDAR integration studies have made targeted progress in different application scenarios. Son and Han[23] generated BIM surface sampling points based on LiDAR parameters, ensuring coverage of key measurement points. Song et al.[12] constructed probabilistic voxel maps for scan targets using BIM. Voxels simplify geometric structures and have strong adaptability to minor details, but occlusion analysis faces resolution trade-off issues. Zhai et al.[17] proposed hidden point removal (HPR) operator-based visibility analysis to replace ray-tracing, but a fixed inversion radius R caused accuracy loss. To improve visibility analysis in indoor environments, Park et al.[18] converted 3D models into triangular meshes for scan targets. Although these meshes can accurately represent geometric shapes, they also bring new challenges. Scan planning methods usually use 3D ray-tracing for visibility analysis, which involves double-loop traversal to check for obstacles. However, the large number of triangular meshes leads to excessive computation time. Differences in BIM utilization for LiDAR scan planning between these studies and this work are shown in Table 2.
Table 2. Comparison between this study and existing literature on BIM utilization for LiDAR scan planning.
| Publication | Year | BIM Utilization for LiDAR Scan Planning |
| Song et al.[12] | 2022 | Builds BIM-based probabilistic voxel maps for LiDAR; voxel resolution affects occlusion analysis accuracy |
| Park et al.[18] | 2023 | Converts BIM to triangular meshes for LiDAR; massive meshes increase computation time |
| Son and Han[23] | 2023 | Generates BIM surface sampling points based on LiDAR parameters |
| Zhai et al.[17] | 2024 | Uses BIM for LiDAR visibility analysis; adopts HPR, fixed inversion radius causes accuracy loss |
| This study | - | Converts BIM to point cloud; uses BIM inspection surfaces for LiDAR visibility analysis |
BIM: building information model; LiDAR: light detection and ranging; HPR: hidden point removal.
These studies indicate that the integration of BIM with LiDAR holds significant potential: BIM can serve as reliable prior information for pre-scan planning, not only enabling more systematic scan station placement and path design to avoid blind sampling but also reducing the reliance on manual operation, thereby improving the efficiency of indoor scan planning. However, several key challenges in this integration remain unresolved. For one, BIM models cannot encode temporary on-site clutter or transient human movement, making pre-scan plans less flexible, especially in multi-room scenarios, this often leads to gaps in coverage. For another, converting BIM geometry into LiDAR-compatible formats for occlusion reasoning incurs substantial computational cost in large indoor scenes; this not only prolongs the pre-processing time of scan planning but also constrains scalability and practical deployment.
2.2 Automatic indoor data collection
Indoor environment data collection is usually implemented according to optimized scan planning manually, either through handheld scanners or by fixing the scanner to a flat surface, which is suitable for small objects or high-precision scanning[36]. For example, Chen et al.[31] explored the concept of planning completion measurement, analyzed 3D laser scanning technology and its technical route in-depth, and analyzed in detail four aspects of instrument selection, data collection, data processing, and result based on practical cases. Lauterbach et al.[37] compared the backpack-mounted 3D mobile scanning system with other surveying and mapping scanning methods and explored the practical application value of the backpack style SLAM laser scanning system in indoor environments. Liang et al.[38] proposed a pre-mapping method for indoor construction sites by using prior progress videos to generate updated navigation maps through the removal of transient occlusions and reconstruction of scene-consistent point cloud. To improve the efficiency of data collection, automatic alternatives are required.
Mobile robots have been used to perform autonomous scanning and mapping using SLAM[39,40], and multi-sensor fusion techniques have further improved system robustness in unstructured spaces[41]. Several studies have deployed quadruped robots to capture 3D geometry through predefined points or to support navigation through semantic map generation[34]. Halder et al.[42] explored the deployment of quadruped robots for construction inspection and monitoring tasks under a human-robot teaming framework, emphasizing sensor-based route execution and operator-guided task scheduling.
Hu et al.[43] introduced a mobile scanning system that integrates SLAM-based reconstruction, semantic segmentation, and view-based task execution to automate the acquisition of geometry and semantic information. Gan et al.[44] proposed a decoupled mapping framework using a LiDAR-equipped quadruped robot, allowing for pose-stabilized reconstruction and robust control during indoor 3D scene acquisition. Chung et al.[16] proposed a method using robot dogs in scaffold environments, illustrating the broader applicability of quadruped platforms in complex indoor scenarios. Robots can autonomously determine the optimal scanning position and navigation paths to complete relevant construction scanning work around the clock without interruption[45]. However, these implementations often lack dynamic adjustment during execution.
To improve robot performance in complex scenes, some studies combine BIM with navigation modules[18,46]. Chen et al.[47] used a multi-sensor quadruped platform guided by BIM to achieve autonomous path planning and viewpoint-based scanning, as well as defect localization and geometry verification during inspection.
The above research indicates that while BIM has been widely adopted in indoor scan planning and robotic navigation, existing studies generally lack fine-grained modeling of transitional areas such as doors, which are critical for establishing navigable connectivity between spatial regions. Furthermore, current approaches seldom incorporate adaptive control strategies that dynamically adjust robot movement behaviors, such as speed and obstacle avoidance margins, based on semantic or geometric characteristics of the environment, limiting their robustness in real-world multi-room inspection scenarios.
3. Methodology
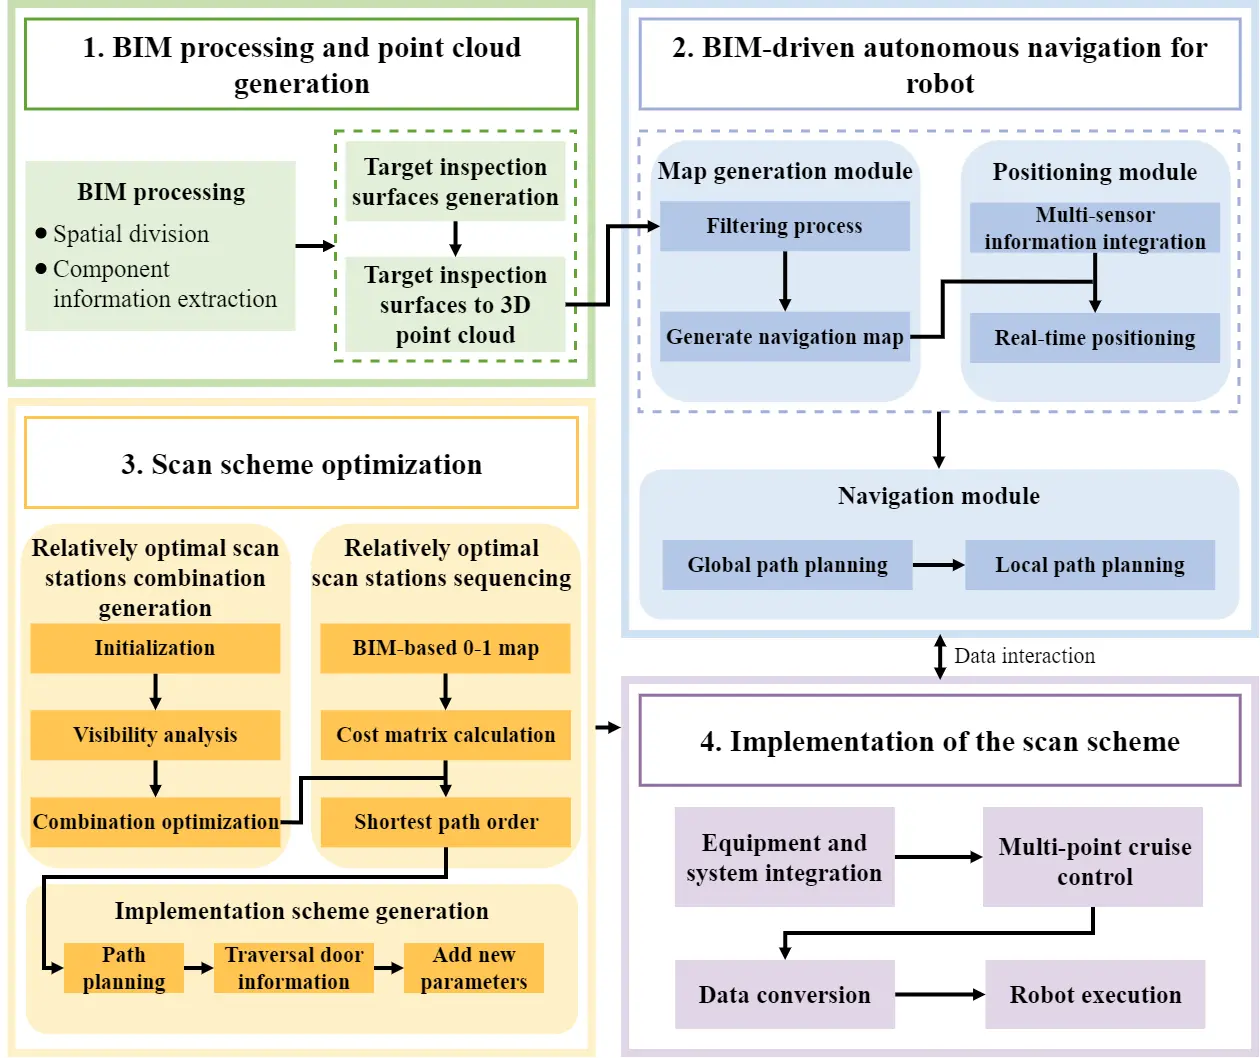
The framework of the proposed approach is divided into four stages as illustrated in Figure 1. In the first stage, the BIM model is utilized and transformed to point cloud model. In the second stage, a navigation map is generated based on the point cloud model, and various sensors are combined to enable the robot’s positioning and navigation. In the third stage, a ray tracing algorithm is employed to calculate the visibility of the scan stations, while a genetic algorithm (GA)[48] optimizes the scan stations. Furthermore, a 0-1 map-based Manhattan distance[49] is used to solve the traveling salesman problem (TSP)[50] to determine the final scanning sequence. In the final stage, the aforementioned methods and technologies are integrated to achieve automated scanning for indoor geometric quality inspection data. This framework unifies BIM-driven pre-scan planning, GA-based optimization, SLAM-enabled localization, and quadruped robot execution into a single automated process. It also introduces action adjustments in connected areas (i.e., doors), which are often overlooked in existing studies but are essential for maintaining continuity and stability in multi-space scanning.
3.1 BIM processing and point cloud generation
The BIM contains extensive building information, but its continuous geometric features are complex, making the direct data processing challenging. To address this issue, this paper proposes a BIM-based point cloud model generation method, which includes target inspection surface generation (i.e., the surfaces to be inspected for indoor geometric quality, such as walls, columns, beams, and ceilings) and conversion of target inspection surfaces to 3D point cloud. By converting the BIM into a point cloud model, continuous geometric features are transformed into discrete data, simplifying the processing and analysis. The point cloud can accurately represent complex surface structures, facilitating plane inspection. Additionally, the floor section of the generated point cloud model can provide potential scan stations for scanning built indoor geometric data. Moreover, the point cloud is highly compatible with existing navigation algorithms, providing a robust data foundation for generating navigation maps for mobile robots.
3.1.1 Target inspection surfaces generation
To achieve efficient point cloud processing, the target inspection surfaces are generated first. By extracting geometric features from the BIM, the target inspection surfaces are created, forming the basis for subsequent point cloud generation. During indoor geometric quality inspection, the work is typically conducted room by room. Therefore, the BIM is spatially divided using walls as boundaries (Figure 2). Additionally, the Revit application programming interface is utilized to automatically read the unique identifier of each building element, known as the primitive ID, to extract the geometric information and vertex coordinates of building components.
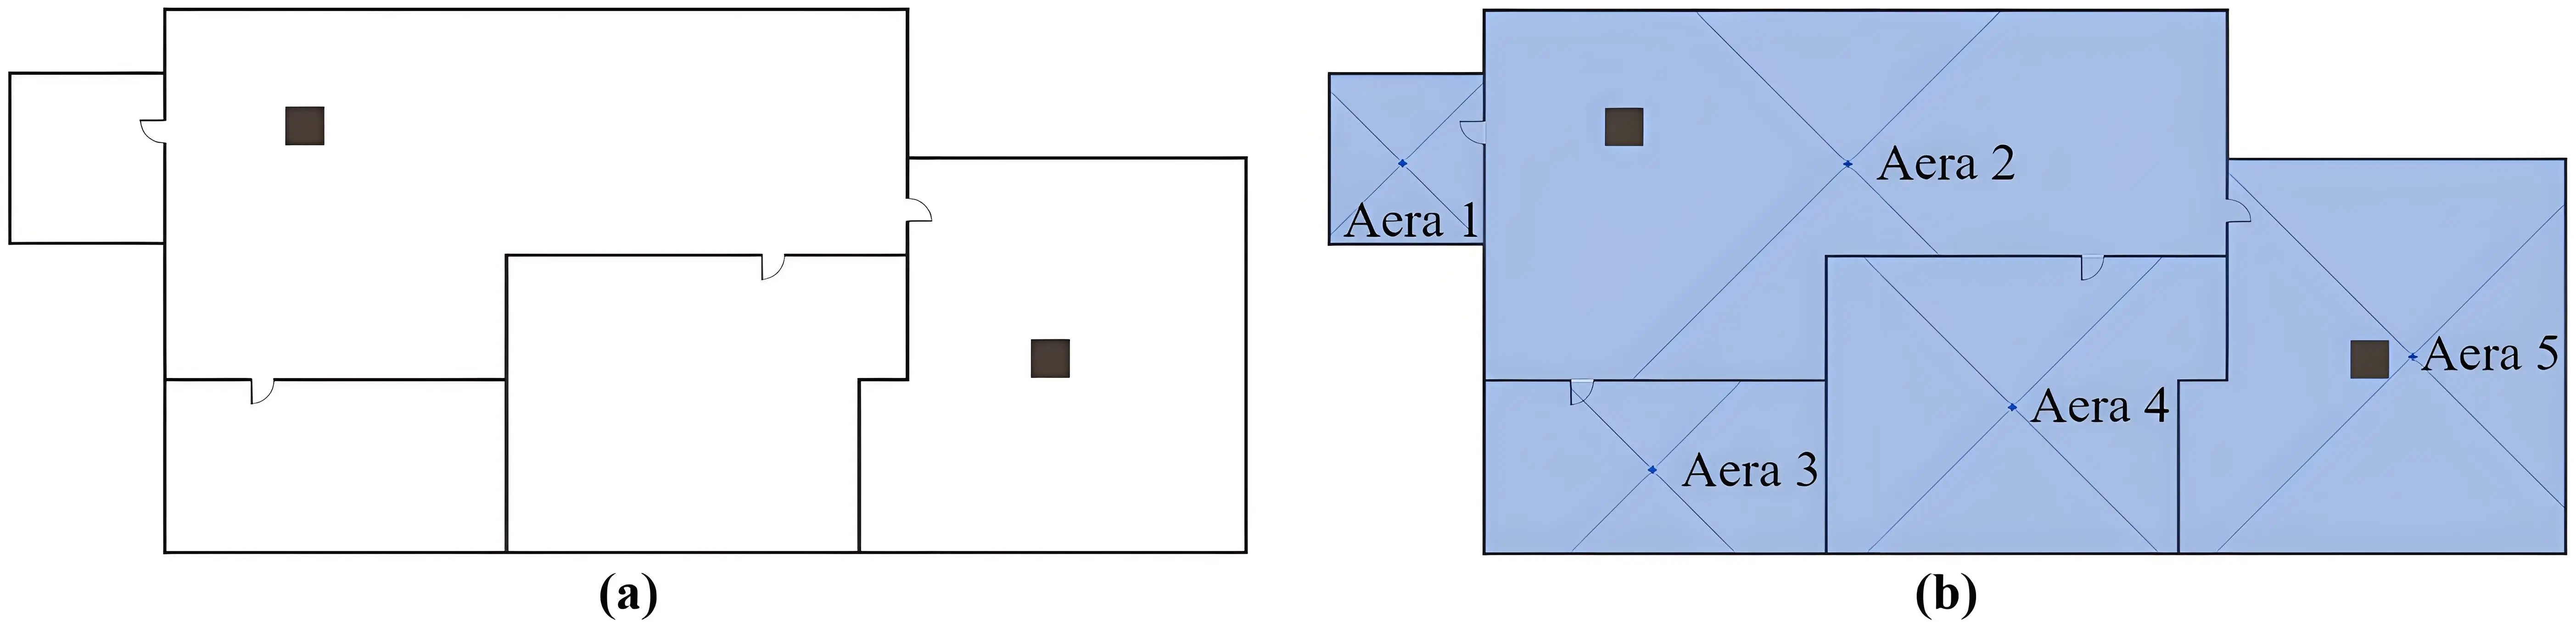
Figure 2. Spatial division of BIM. (a) BIM model; (b) Spatial division. BIM: building information model.
Adjacent points within the same space are connected to form line segments. These line segments are used as the bases of vertical planes, and the floor height served as the height of the vertical planes, thereby generating the vertical planes. Openings are made at the corresponding positions of door and window components on these vertical planes to reflect the actual spatial penetrations. Subsequently, a horizontal plane is generated based on the vertex and floor top elevation information of the same space. The sides and bottom surfaces of beams are generated using the extracted beam geometry information and vertex coordinates. These horizontal planes and beam surfaces are combined to represent the actual ceiling plane. Finally, these planes are integrated to form the final indoor geometric quality target inspection surfaces. This target inspection surface model accurately represents the actual building, providing a reliable data foundation for subsequent point cloud conversion and serving as a reference for obstacle determination during indoor geometric quality inspection data collection.
3.1.2 Target inspection surfaces to 3D point cloud
After generating the target inspection surfaces, they are converted into a 3D point cloud model. The specific operations are as follows (Figure 3).
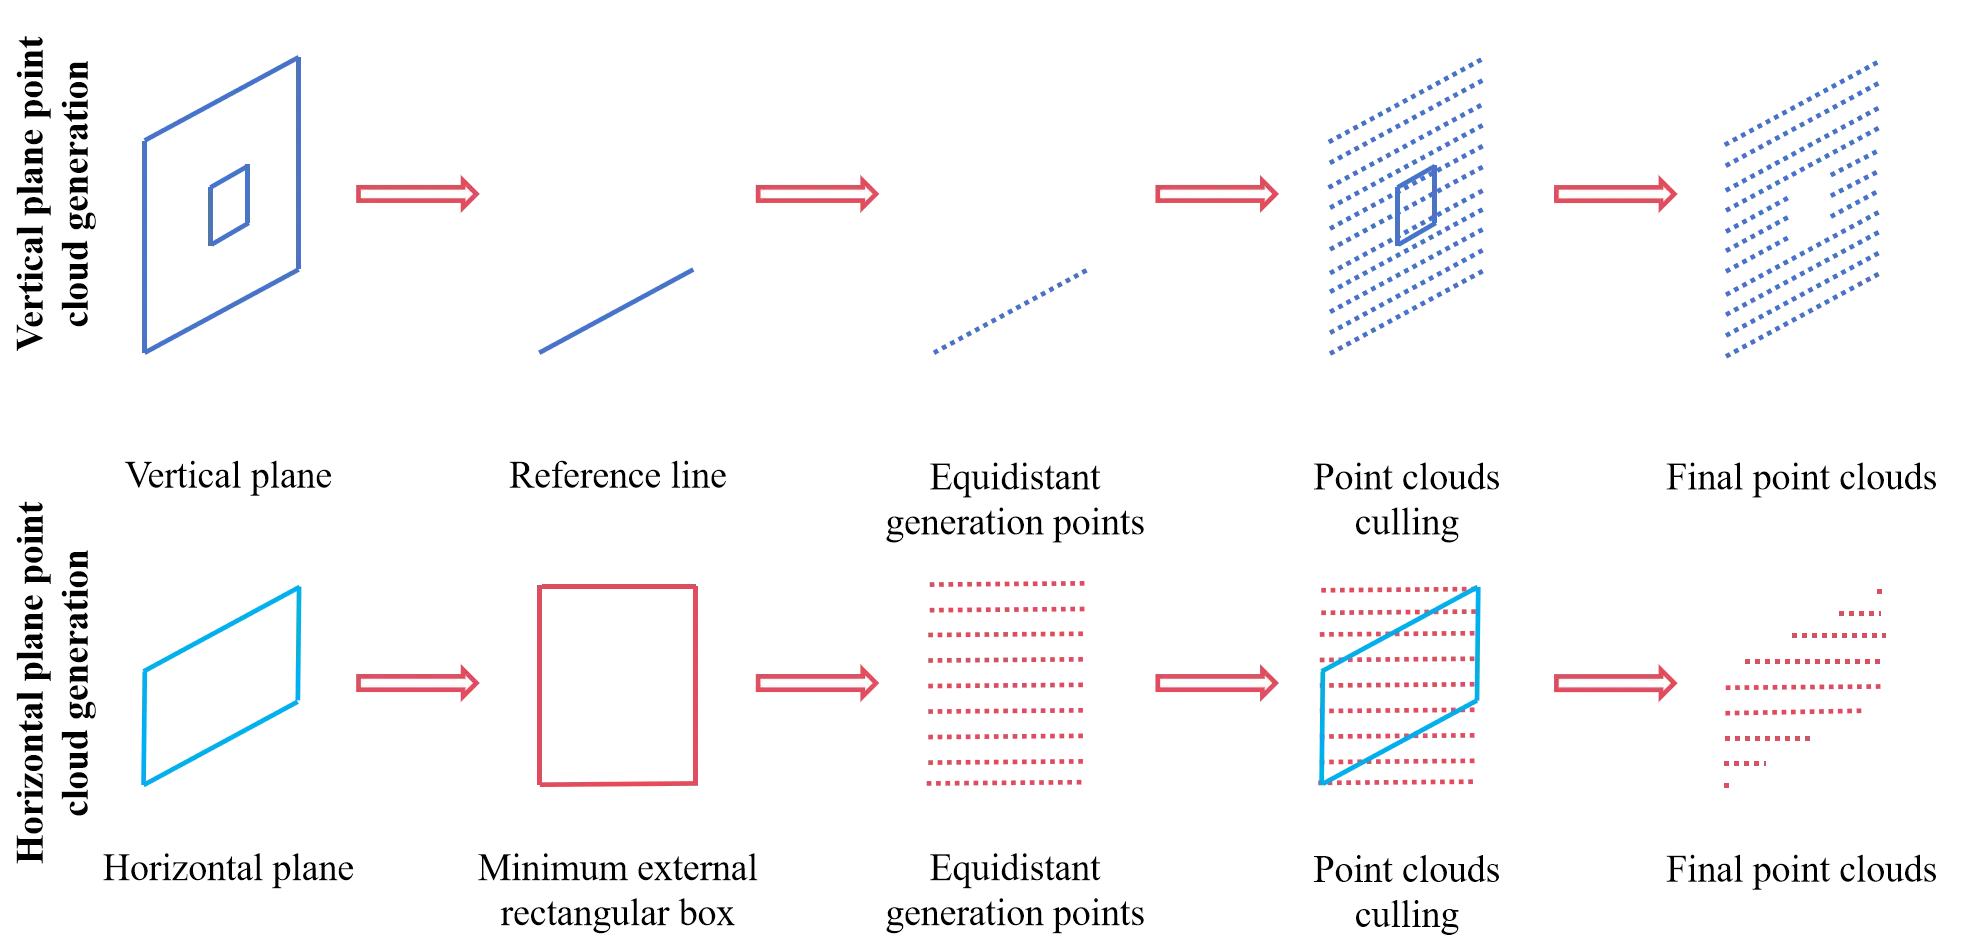
Vertical plane point cloud: First, the bottom edge line of the vertical plane is selected as the reference positioning line, and a series of points are generated evenly along this line according to the pre-set point spacing. Then, using the same point spacing standard, each point on the bottom edge line is copied along the vertical direction, eliminating points in the opening areas such as doors and windows, to form a point cluster representing the vertical inspection surface.
Horizontal plane point cloud: For the horizontal plane, the minimum bounding rectangle is first determined as the processing boundary, since the horizontal area is not necessarily a regular rectangle. Using the same point cloud generation strategy, points are generated within this rectangular frame. Points that do not belong to the original horizontal region are then eliminated, resulting in a converged point cloud representing the inspection surface of the characteristic level.
Furthermore, two parameters, “visibility” and “scan count” are introduced to the point cloud to enrich its informational dimension. “Visibility” identifies whether the point cloud is within the effective scanning range of the 3D laser scanner, while “scan count” records the number of times each point has been scanned. By integrating these parameters into the point cloud, a comprehensive 3D point cloud model is constructed to accurately characterize indoor geometric quality inspection (Figure 4a).
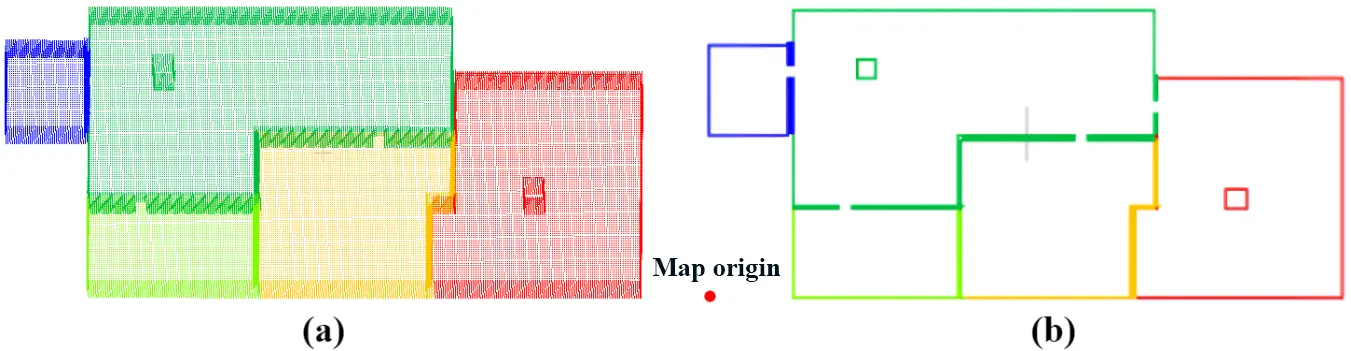
Figure 4. 3D point cloud processing. (a) 3D point cloud model based on the target inspection surfaces; (b) Model after filtering.
It should be noted that the ground is leveled during the construction process and usually has high flatness; hence, scanning inspection is generally not required, making the generation of ground point cloud unnecessary under normal circumstances. However, to construct candidate scan stations, this paper generates a ground point cloud by replicating the ceiling plane point cloud and adjusting its height to match the indoor floor elevation. In this process, all points in the ground point cloud are regarded as candidate scan stations, which directly supports the optimization of subsequent scan scheme (see Section 3.3).
3.2 BIM-driven autonomous navigation for robot
This section introduces BIM-driven autonomous navigation technology for robots, which includes the map generation module, positioning module, and navigation module. The map generation module processes the point cloud model obtained in ‘Target inspection surfaces to 3D point cloud’ to provide a detailed navigation map for the robot. The positioning module integrates various sensor data to ensure accurate positioning of the robot in complex environments. Based on the generated navigation map and positioning data, the navigation module plans the optimal path to enable the robot to move safely and efficiently. In these modules, the BIM supplies detailed geometric and environmental information, ensuring the accuracy and reliability of the navigation system.
3.2.1 Map generation module
Maps provide accurate environmental information and form the basis for autonomous navigation. The point cloud data format is relatively simple, easy to process and analyze, and can be directly utilized by existing navigation algorithms (such as occupancy grid maps and OctoMap). Based on this, a point cloud-based map generation method is proposed in this paper. To improve map generation efficiency, the point cloud model obtained in ‘Target inspection surfaces to 3D point cloud’ is simplified using a filtering method. First, straight-through filtering[51] is applied to eliminate points higher than the robot, as these areas are inaccessible and irrelevant to the robot’s navigation. Then, radius filtering[52] is used to further simplify the data. By setting the search radius and the minimum number of neighbor points, points with insufficient neighbors within the given radius are considered noise and removed. The filtered model is shown in Figure 4b.
After filtering, the map generation module reads the simplified point cloud model and generates the navigation map accordingly. Specifically, the minimum values of the X and Y coordinates in the point cloud are selected as the map origin. Next, the relative position of each point to the map origin is calculated, converting absolute coordinates to relative coordinates.
Following the coordinate conversion, the map generation module sets the map conversion parameters, including map resolution, map threshold, and map format. Map resolution defines the actual distance represented by each grid. The map threshold distinguishes occupied space from free space. Map formats define how maps are stored and represented, such as 2D and 3D raster maps.
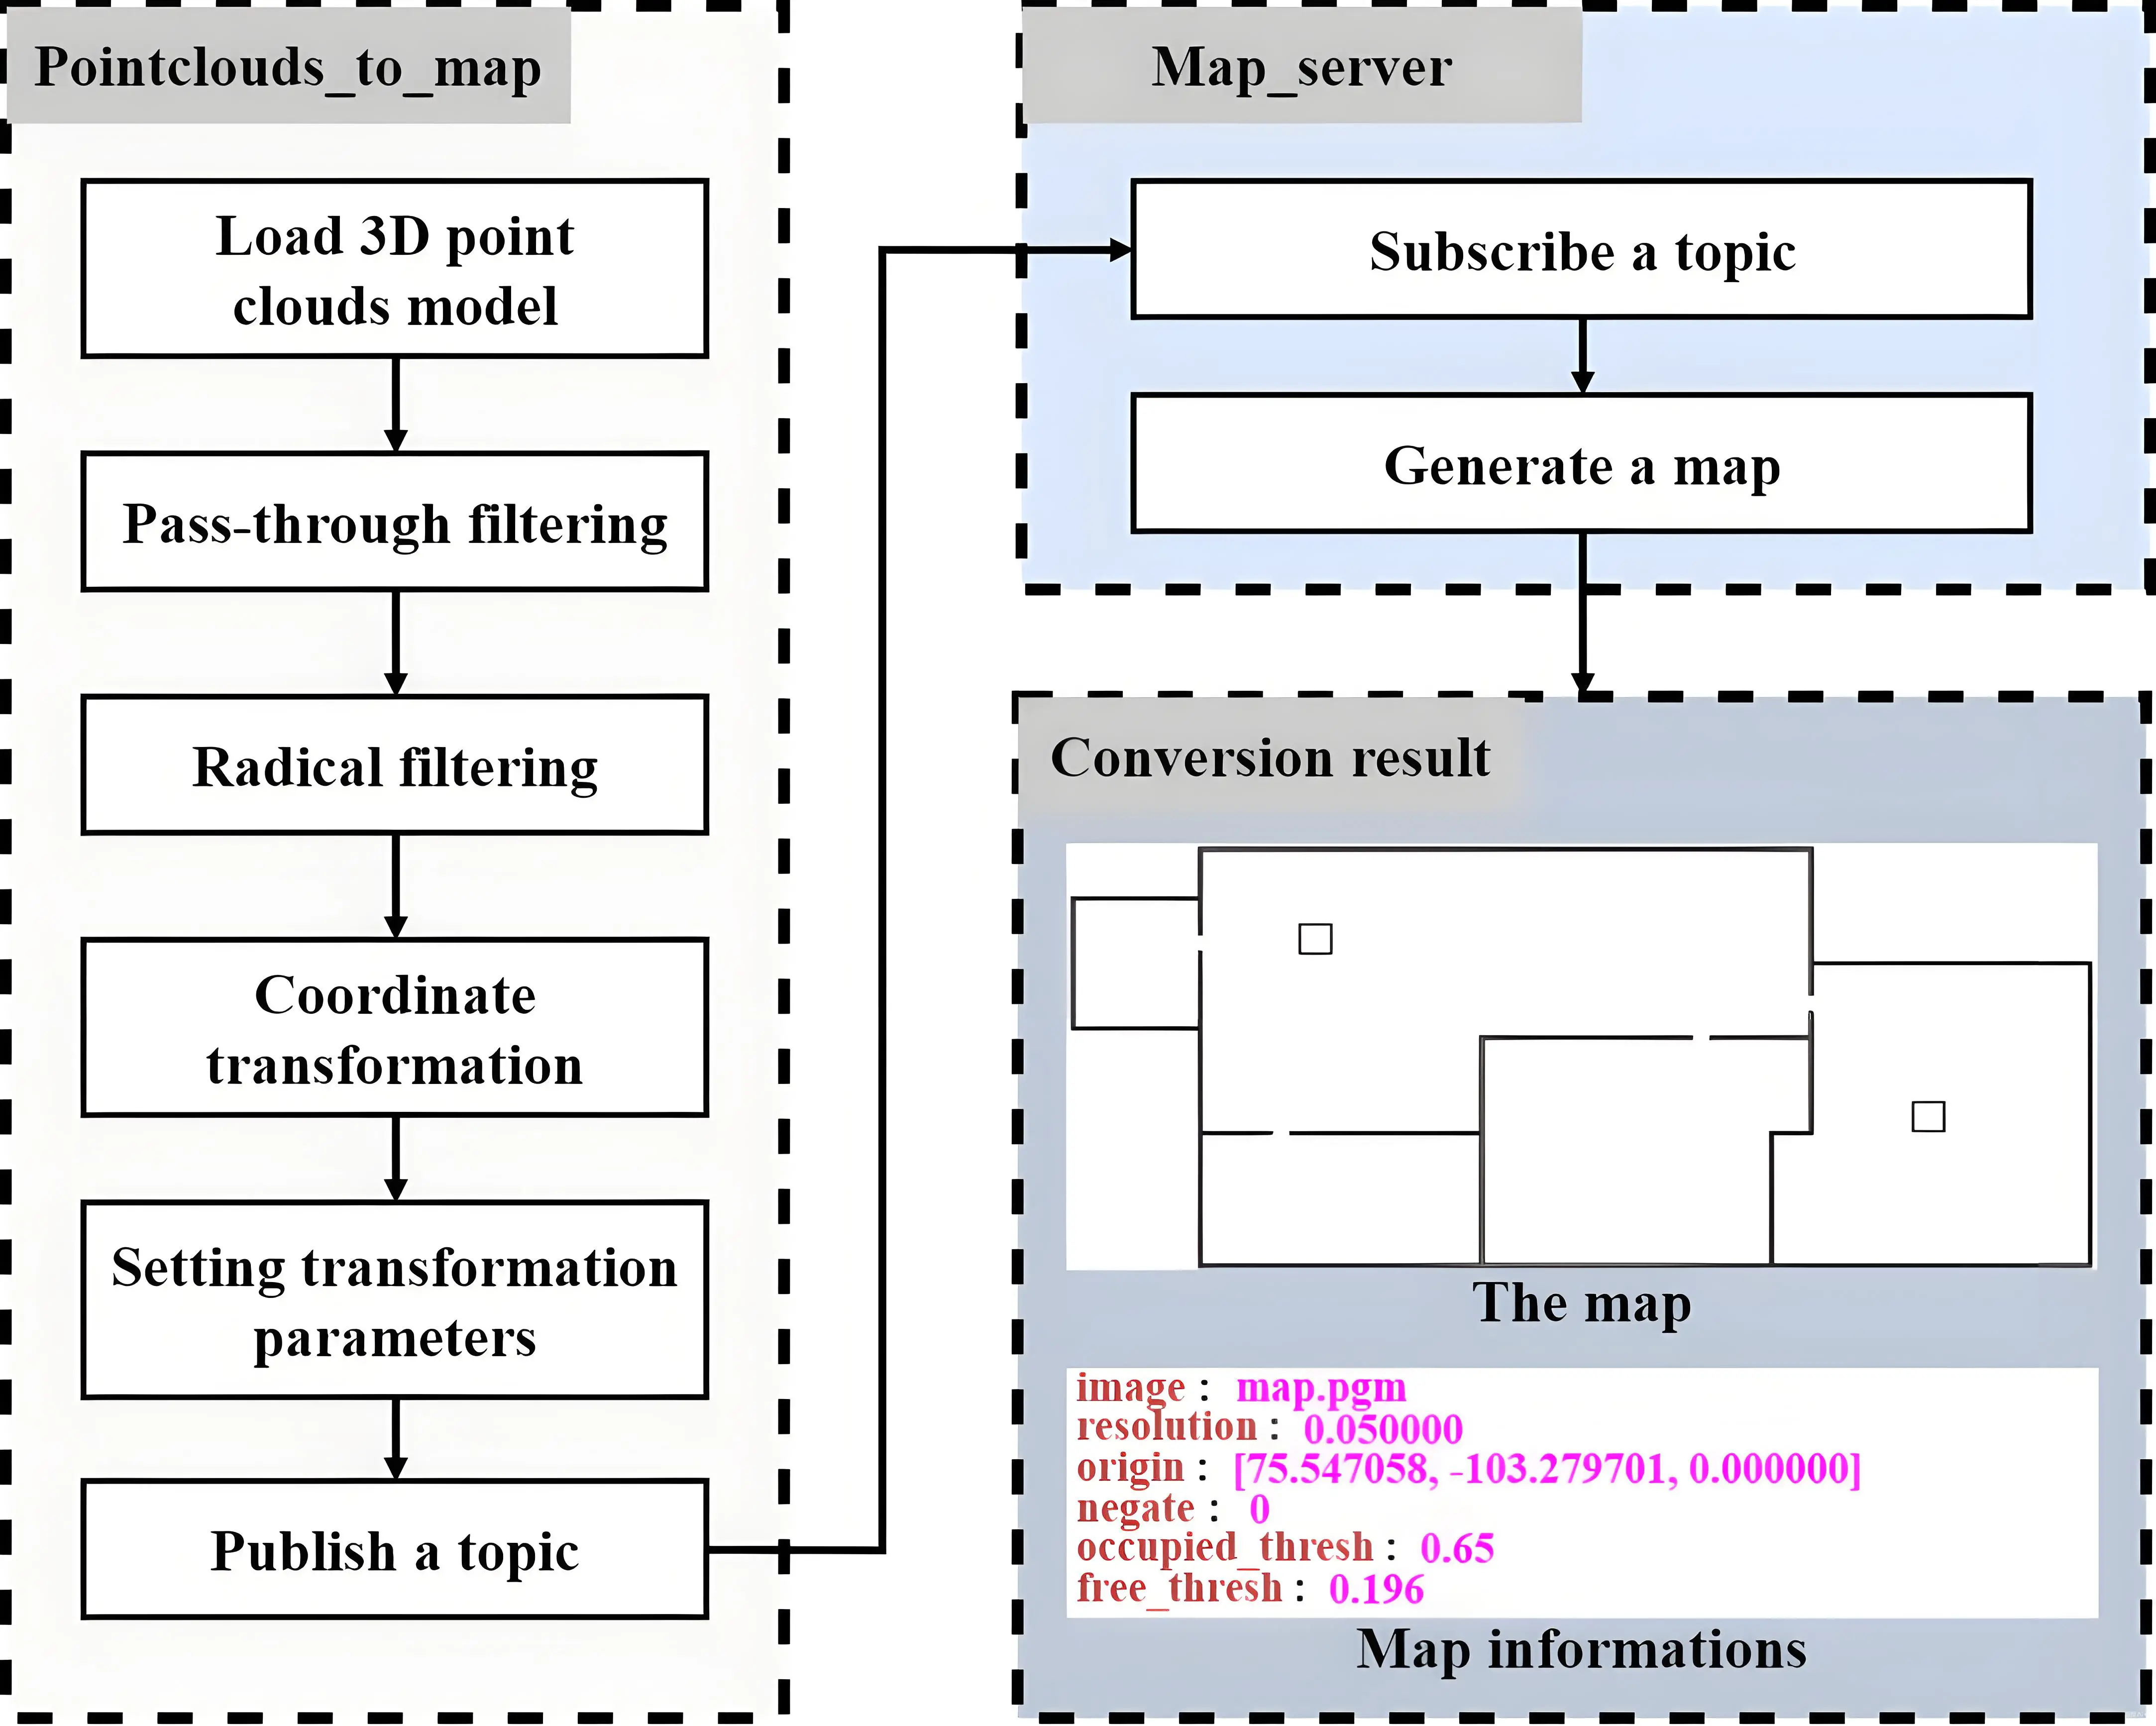
This study uses Robot Operating System (ROS)[53] to generate maps. ROS is a flexible open-source software framework that allows nodes with different functions to communicate and exchange data efficiently through its publish-subscribe mechanism. As shown in Figure 5, during the map generation process, the “Pointclouds_to_map” node publishes the processed point cloud and map conversion parameters as “topic”. The “Map_server” node subscribes to the “topic” to receive the information and generate a high-precision raster navigation map.
In practical applications, ensuring the alignment of the BIM, navigation map, and actual building is a critical issue. If these data sets are not accurately aligned, it can lead to severe errors in robot navigation. To address this issue, this paper adopts a relative positioning transformation strategy. This strategy involves identifying key points at the construction site, obtaining their coordinates, and matching them with corresponding points in the BIM to calculate the coordinate transformation matrix. Through this method, the BIM’s coordinate system is first converted to the actual building’s coordinate system. Subsequently, the navigation map’s coordinate system is adjusted to the same coordinate system, ensuring that all data sources are aligned. This ensures precise mapping between the BIM, navigation map, and construction site, thereby enabling accurate positioning and navigation of the robot in the actual environment.
3.2.2 Positioning module
The positioning module is a key component of the robot navigation system. Its purpose is to enable the robot to accurately determine its position in complex environments by utilizing the navigation map generated in ‘Map generation module’, in combination with data from multiple sensors.
3.2.2.1 Sensors
To perceive environmental information, the robot is equipped with various sensors (Figure 6), including a built-in odometer, an external inertial measurement unit (IMU), and LiDAR. The odometer provides the robot’s relative position to the starting point during movement. The IMU provides attitude and acceleration information, and the LiDAR generates a 3D point cloud of the environment by emitting laser beams and receiving reflected signals.
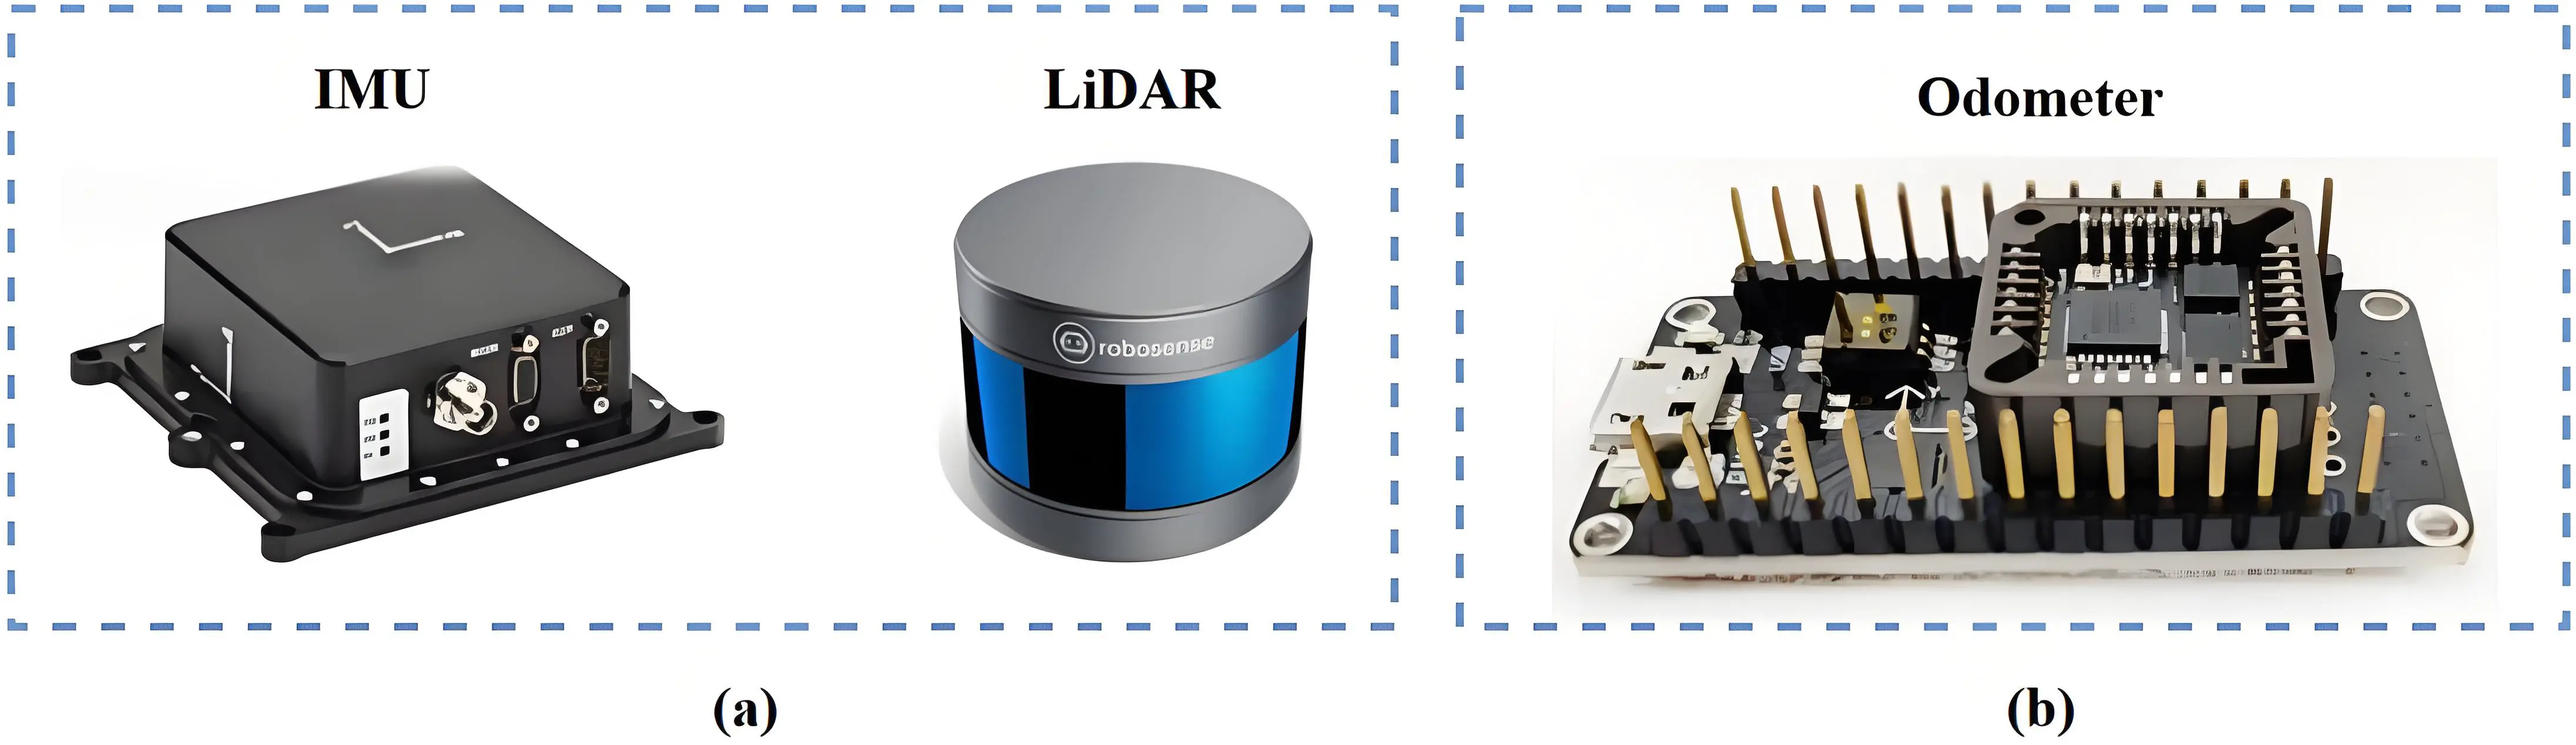
Figure 6. Sensors equipment for robot. (a) External sensors; (b) Internal sensor. IMU: inertial measurement unit; LiDAR: light detection and ranging.
During robot movement, the odometer can produce errors due to factors such as position slip, mechanical loosening, and accumulated errors. To address this issue, a Kalman filter[54] is used to integrate odometer and IMU information, thereby providing more accurate odometer data through comprehensive analysis. The Kalman filter is a recursive algorithm that offers the best estimate of the robot’s state (position, speed, etc.) by continuously estimating and correcting the robot’s motion model with the observed data.
Although the Kalman filter, combined with odometer and IMU data, can significantly reduce errors, residual errors may still persist due to factors such as sensor noise, model inaccuracies, environmental changes, and data synchronization issues. To further eliminate these residual errors, the positioning module incorporates LiDAR technology. LiDAR generates high-precision 3D point cloud by emitting laser pulses that capture detailed information about the robot’s surroundings. Since the robot moves on a planar surface, the 3D point cloud is simplified into a 2D contour to effectively describe the characteristics of the indoor environment. The 3D point cloud model sensed by LiDAR is shown in Figure 7a, and the corresponding 2D contour line is shown in Figure 7b.
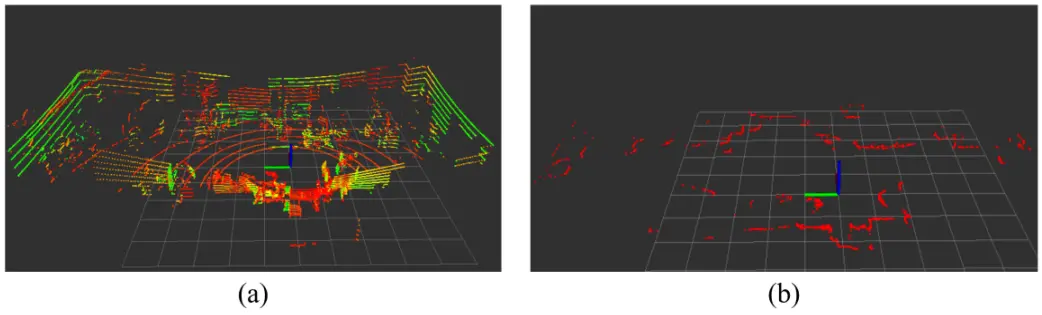
Figure 7. LiDAR information. (a) 3D point cloud model; (b) Corresponding 2D contour line. LiDAR: light detection and ranging.
3.2.2.2 Multi-sensor information integration
In order to accurately utilize the multi-sensor information mentioned above, the positioning module establishes multiple coordinate systems, including the global coordinate system, IMU coordinate system, odometer coordinate system, robot coordinate system, and LiDAR coordinate system. Based on the relative positions of these coordinate systems and the robot’s center of gravity, the transformation relationships among the coordinate systems are developed. During this process, the positioning module uses the coordinate transformation relationship tree (Figure 8) to ensure that all sensor data can be processed and integrated under a unified global coordinate frame. The global coordinate system serves as a fixed reference, representing the robot’s position and direction in the entire environment, and uniformly representing various data within the robot and the environment.
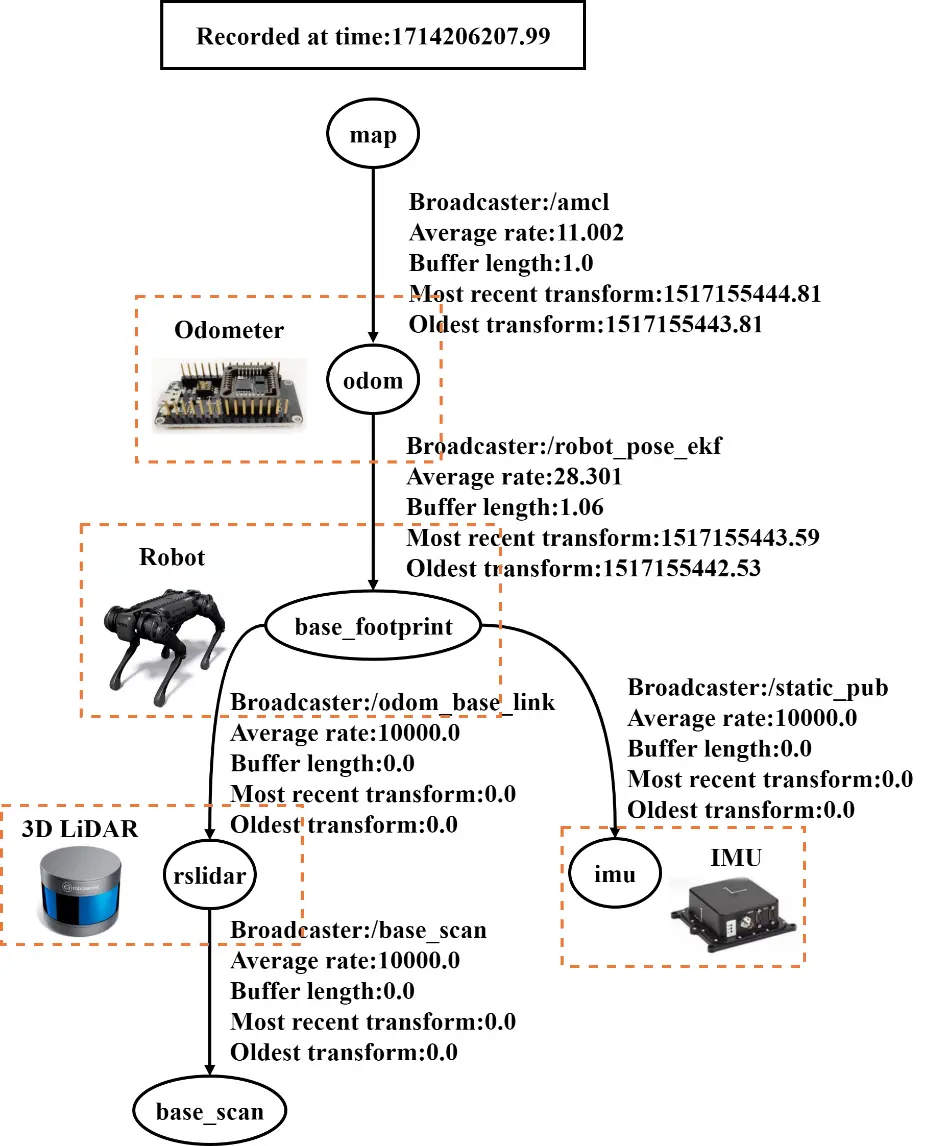
Figure 8. Transformation relationship tree. LiDAR: light detection and ranging. IMU: inertial measurement unit.
After establishing the coordinate systems, the positioning module uses the global coordinate system as the base coordinate system, with the other coordinate systems serving as auxiliary systems. Through the transformation relationships among the coordinate systems, various types of information are mapped to the global coordinate system according to these relationships, thus ensuring efficient data utilization. Simultaneously, to maintain the consistency of multi-sensor information in the time dimension, the positioning module synchronizes sensor data through timestamp alignment.
Once the coordinate systems are constructed and time synchronization is achieved, the positioning module integrates multi-sensor information from LiDAR, the odometer, and the IMU using the Adaptive Monte Carlo Localization (AMCL) algorithm[55], a probabilistic localization method that uses particle filters to estimate the robot’s position by matching sensor data with the navigation map. The LiDAR provides obstacle information, the odometer provides motion information, and the IMU provides attitude information. These data sets are integrated after time synchronization and coordinate transformation to form an accurate estimate of the robot’s position.
To reduce positioning errors, the positioning module employs a real-time closed-loop correction strategy, continuously processing sensor data for real-time correction, reducing accumulated errors, and mapping the corrected position to the global coordinate system. This ultimately provides the real-time position of the robot in the indoor environment. Through the dual integration of spatial and temporal dimensions, the positioning module achieves precise positioning of the robot in complex environments.
3.2.3 Navigation module
The navigation module framework is shown in Figure 9. Specifically, after the robot is started, the navigation module receives sensor information, navigation map data, and the real-time position of the robot to obtain its current position and attitude. In the initialization phase, the navigation module processes the navigation map and sets the inflation radius to provide a safety buffer and ensure the safety of the robot’s movement. Furthermore, the navigation module reads navigation parameters such as navigation speed, obstacle avoidance weight, and avoidance priority from the ROS navigation component “move_base” and the local path planner “teb_local_planner”, which is based on the Timed Elastic Band (TEB)[56] optimization approach. The TEB method formulates robot trajectory planning as an optimization problem, where the path is represented by a sequence of discrete poses connected by elastic bands, allowing real-time adjustment for smooth navigation and dynamic obstacle avoidance. The “move_base” package integrates global and local path planning, while “teb_local_planner” focuses on generating smooth paths and obstacle avoidance strategies.
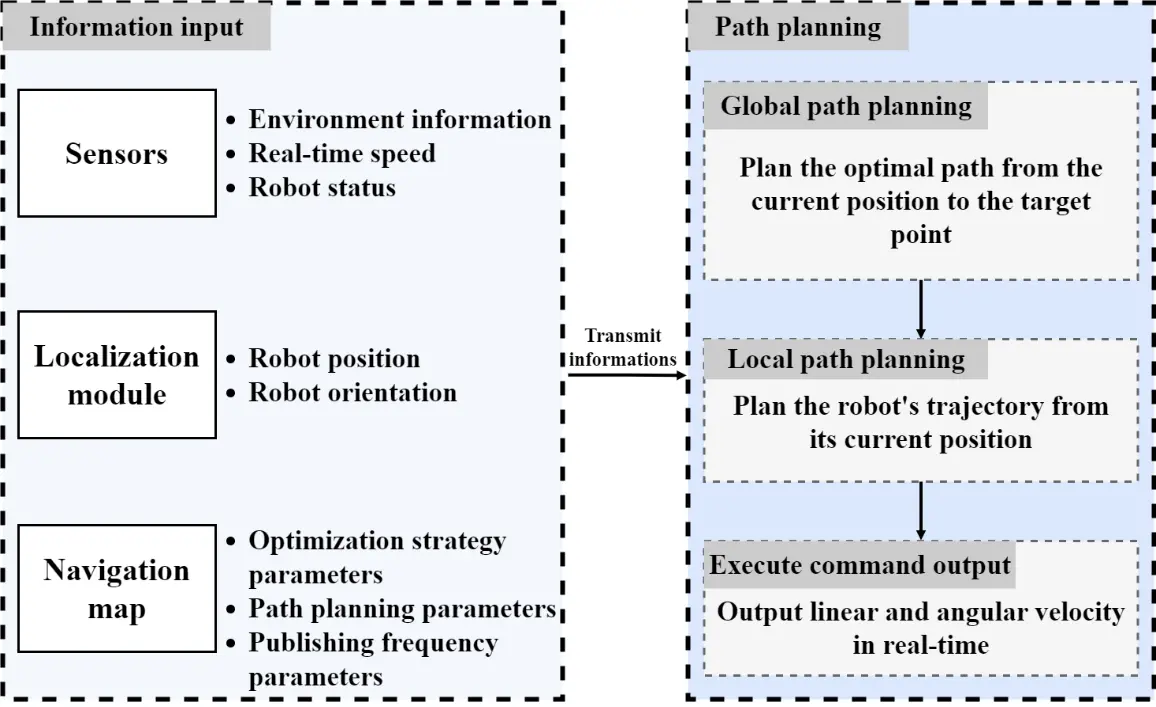
During operation, the navigation module analyzes the robot’s position, sensor data, and navigation parameters to plan the path in real time and generate instructions. Global path planning and local path planning work in tandem to guide the robot efficiently. Global path planning determines the overall route from the current station to the target station based on the navigation map using the A* algorithm[57]. Local path planning uses the TEB algorithm to adjust the robot’s movement trajectory in real time according to the current position and environmental information. For example, when the LiDAR detects an obstacle, the navigation module instantly re-plans the path, ensuring that the robot can safely avoid the obstacle and reach its destination smoothly.
In ‘BIM processing and point cloud generation’, a detailed indoor 3D point cloud model was generated by generating the target inspection surfaces based on the BIM and point cloud processing. This model not only represents the object inspection surfaces but also provides candidate scan stations, laying the foundation for navigation map generation. Building on this, ‘BIM-driven autonomous navigation for robot’ utilizes ROS to achieve map generation, robot positioning, and navigation path planning. The combination of global and local path planning ensures that robots can move safely and efficiently in complex indoor environments. Next, the focus will be on researching and optimizing the scan scheme to enhance the accuracy and efficiency of data collection, thereby providing more robust support for robot navigation.
3.3 Scan scheme optimization
Optimizing the scan scheme is crucial for improving the accuracy and efficiency of data collection during robot operations. This section details how to generate a relatively optimal scan stations combination based on the set of candidate scan stations obtained in ‘Target inspection surfaces to 3D point cloud,’ and how to sequence these scan stations to ensure comprehensive and effective data collection. The optimization of the scan scheme mainly includes three aspects: optimizing scanning coverage rate (Cov), optimizing the scanning sequence based on the TSP, and adding transit stations in areas near doors while setting the execution mode for the robot in complex environments. Comprehensive coverage of the target area can be achieved through a reasonable layout of scan stations. By optimizing the scanning sequence, the time and path complexity for robots moving between scan stations are reduced. Finally, generating the implementation scheme ensures that the robot can move and work safely and efficiently in complex indoor environments, perform the scan scheme smoothly, and improve the efficiency and accuracy of data collection.
3.3.1 Relatively optimal scan stations combination generation
The generation of the relatively optimal scan stations combination is based on the set of candidate scan stations established in ‘Target inspection surfaces to 3D point cloud’ and consists of three parts: scan stations combination initialization; scan stations combination visibility analysis; and combination optimization.
3.3.1.1 Scan stations combination initialization
Because the connected areas between spaces are often narrow, they are not conducive to the registration of scan data in different spaces. Therefore, before initialization of the scan stations, a collection of candidate scan stations is added to the doorways to ensure data registration between spaces. After adding candidate scan stations, the combination of scan stations is initialized (Figure 10).
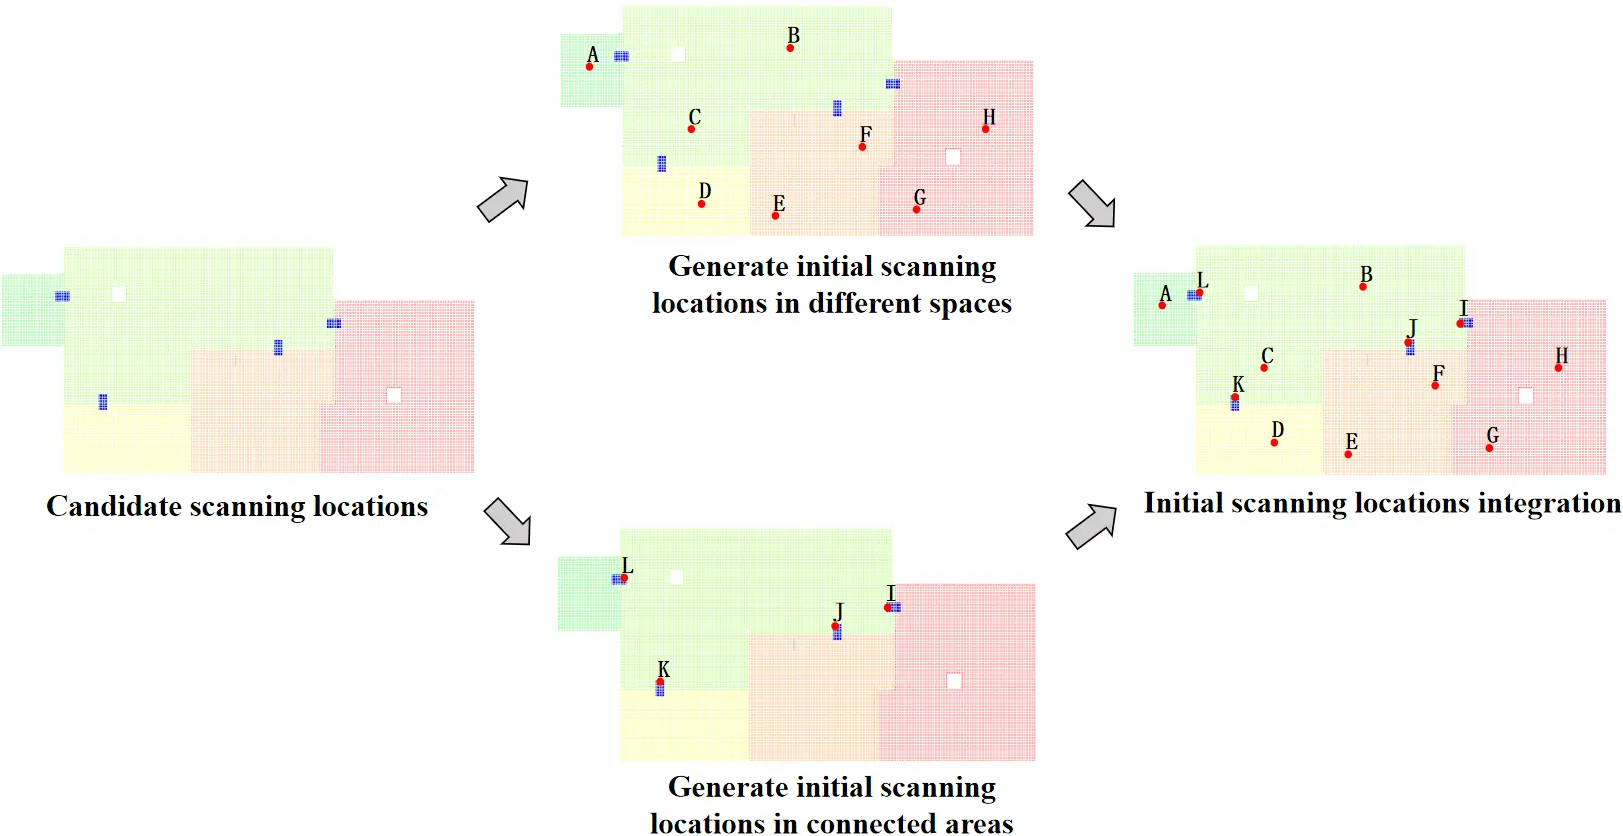
Specifically, to ensure that every space can be scanned, at least one scan stations need to be placed in each space. To meet the requirements of point cloud model processing and analysis for point spacing, the maximum scanning radius is determined based on the differences in scanning results under different scanning times and radii, under the premise of the user selecting the scanning time. The corresponding number of scan stations is then determined according to the area of each space. Subsequently, the appropriate number of scan stations is randomly selected from the candidate scan stations in different spaces. Additionally, one scan station is selected form the candidate scan stations in each connected area. Combining these two parts forms the initial scan stations. The calculation formula for the number of scan stations is shown in Eq. (1), where P is the number of sites, Ai is the space footprint, d is the maximum scanning radius of the 3D laser scanner, D is the number of doors, and I (see Section 3.3.1.3) is the scan stations increment.
3.3.1.2 Scan stations visibility analysis
After determining the initial scan stations combination, a visibility analysis is required to verify whether it meets Cov (see Section 3.3.1.3). Many researchers use triangular meshes to represent BIM geometry and perform visibility analysis based on these meshes[18,58,59]. However, the number of triangular meshes is usually enormous, and even judging the visibility of a small area requires determining whether the line of sight collides with many triangular mesh.
Therefore, this study conducts visibility analysis based on the target inspection surfaces (see Section 3.1.1) and point cloud model (see Section 3.1.2). The point cloud model represents the BIM geometry and serves as the point to be scanned, while the target inspection surfaces are regarded as an obstacle. First, the distance between the scan stations and the point to be scanned is calculated. If the distance exceeds the preset maximum scanning radius (see Section 3.3.1.1), it is directly determined that the point cannot be scanned by the current scan station without further occlusion analysis. Conversely, if the distance is within the range, the line segment equation between the scan stations and the point to be scanned is constructed to simulate the laser from the 3D laser scanner to the scanning area.
As shown in Figure 11a, if the laser line collides with a target inspection surface, the point to be scanned is marked as invisible; if no intersection is found, it is marked as visible, and the “scan count” value of the point to be detected is increased by one to indicate that the point can be covered by a scan station. Compared with the triangular mesh method, this approach significantly reduces the number of obstacles to be judged, ensures the accuracy of line-of-sight occlusion judgment, and greatly improves the efficiency of visibility analysis.
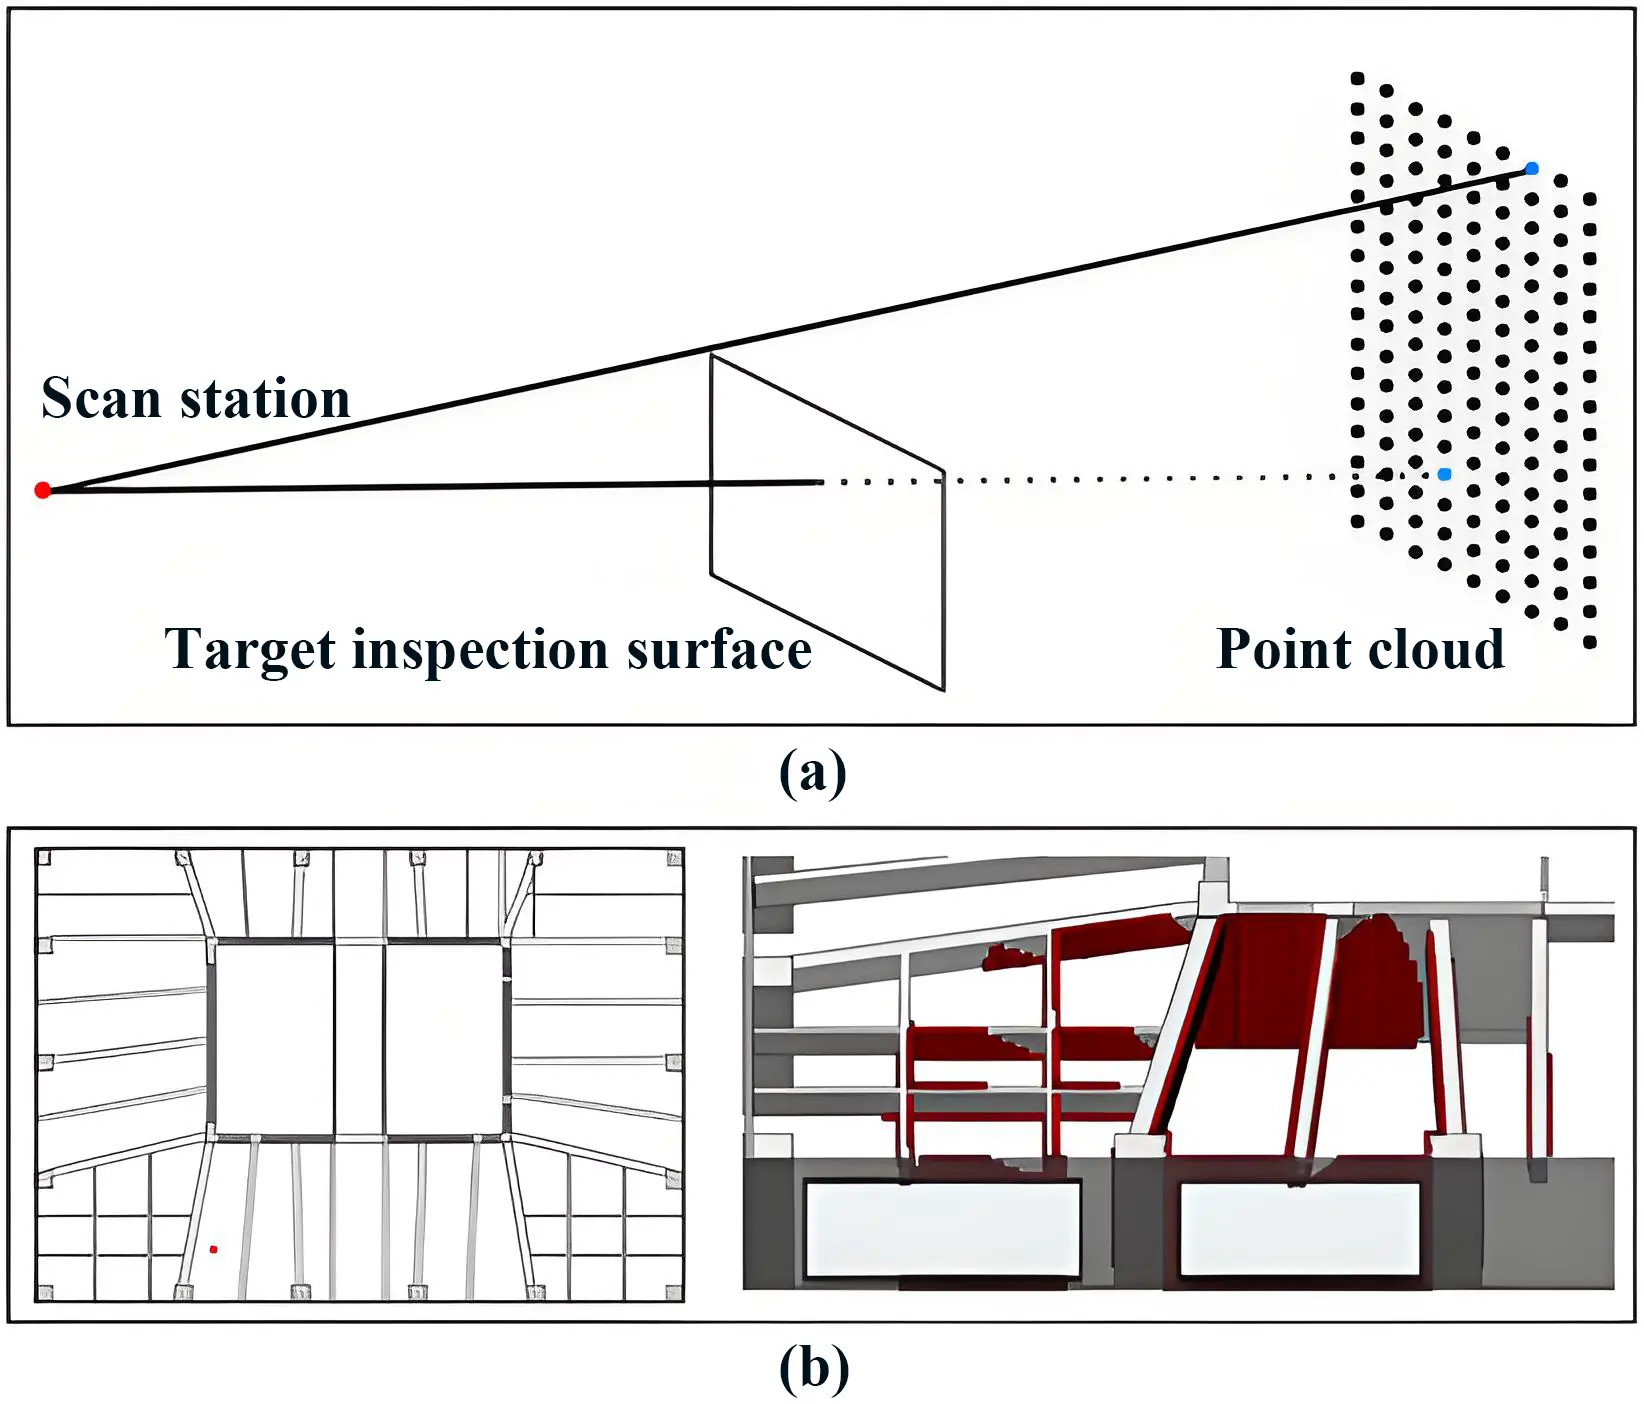
Figure 11. Example of visibility analysis. (a) Visibility analysis; (b) Scan station visibility situation.
To assist the surveyors in understanding the on-site scanning situation, cube markers are generated in BIM based on the coordinate information of visible point cloud. Figure 11b shows the visualization of the scan station, including its specific positions of the scan station and partial details of the scanned points.
3.3.1.3 Scan stations combination optimization
After completing the visibility analysis, Cov and scanning repetition rate (Rep) were calculated to evaluate the quality of the scan stations combination. Cov is determined based on the number of visible points obtained from the visibility analysis (see Section 3.3.1.2), while Rep is calculated based on the number of point clouds with a “scan count” value greater than one. Using Pareto optimization theory[60], a single fitness function is formed by weighting and linear programming. The relevant equations are as follows:
where T is the total number of point cloud, Num is the number of viewable point cloud, Num_ is the number of points that are repeatedly scanned, Fitness is the fitness function, A and B are the weights, and Covindex is the scanning coverage threshold, which is defined by the user.
Typically, the initial scan stations combination (see Section 3.3.1.1) has difficulty achieving Covindex. Therefore, after the visibility analysis of the initial scan stations combination is completed, further optimization is needed. The main goal of optimization is to minimize the number of scan stations and maximize the number of visible point clouds while ensuring that Cov exceeds Covindex.
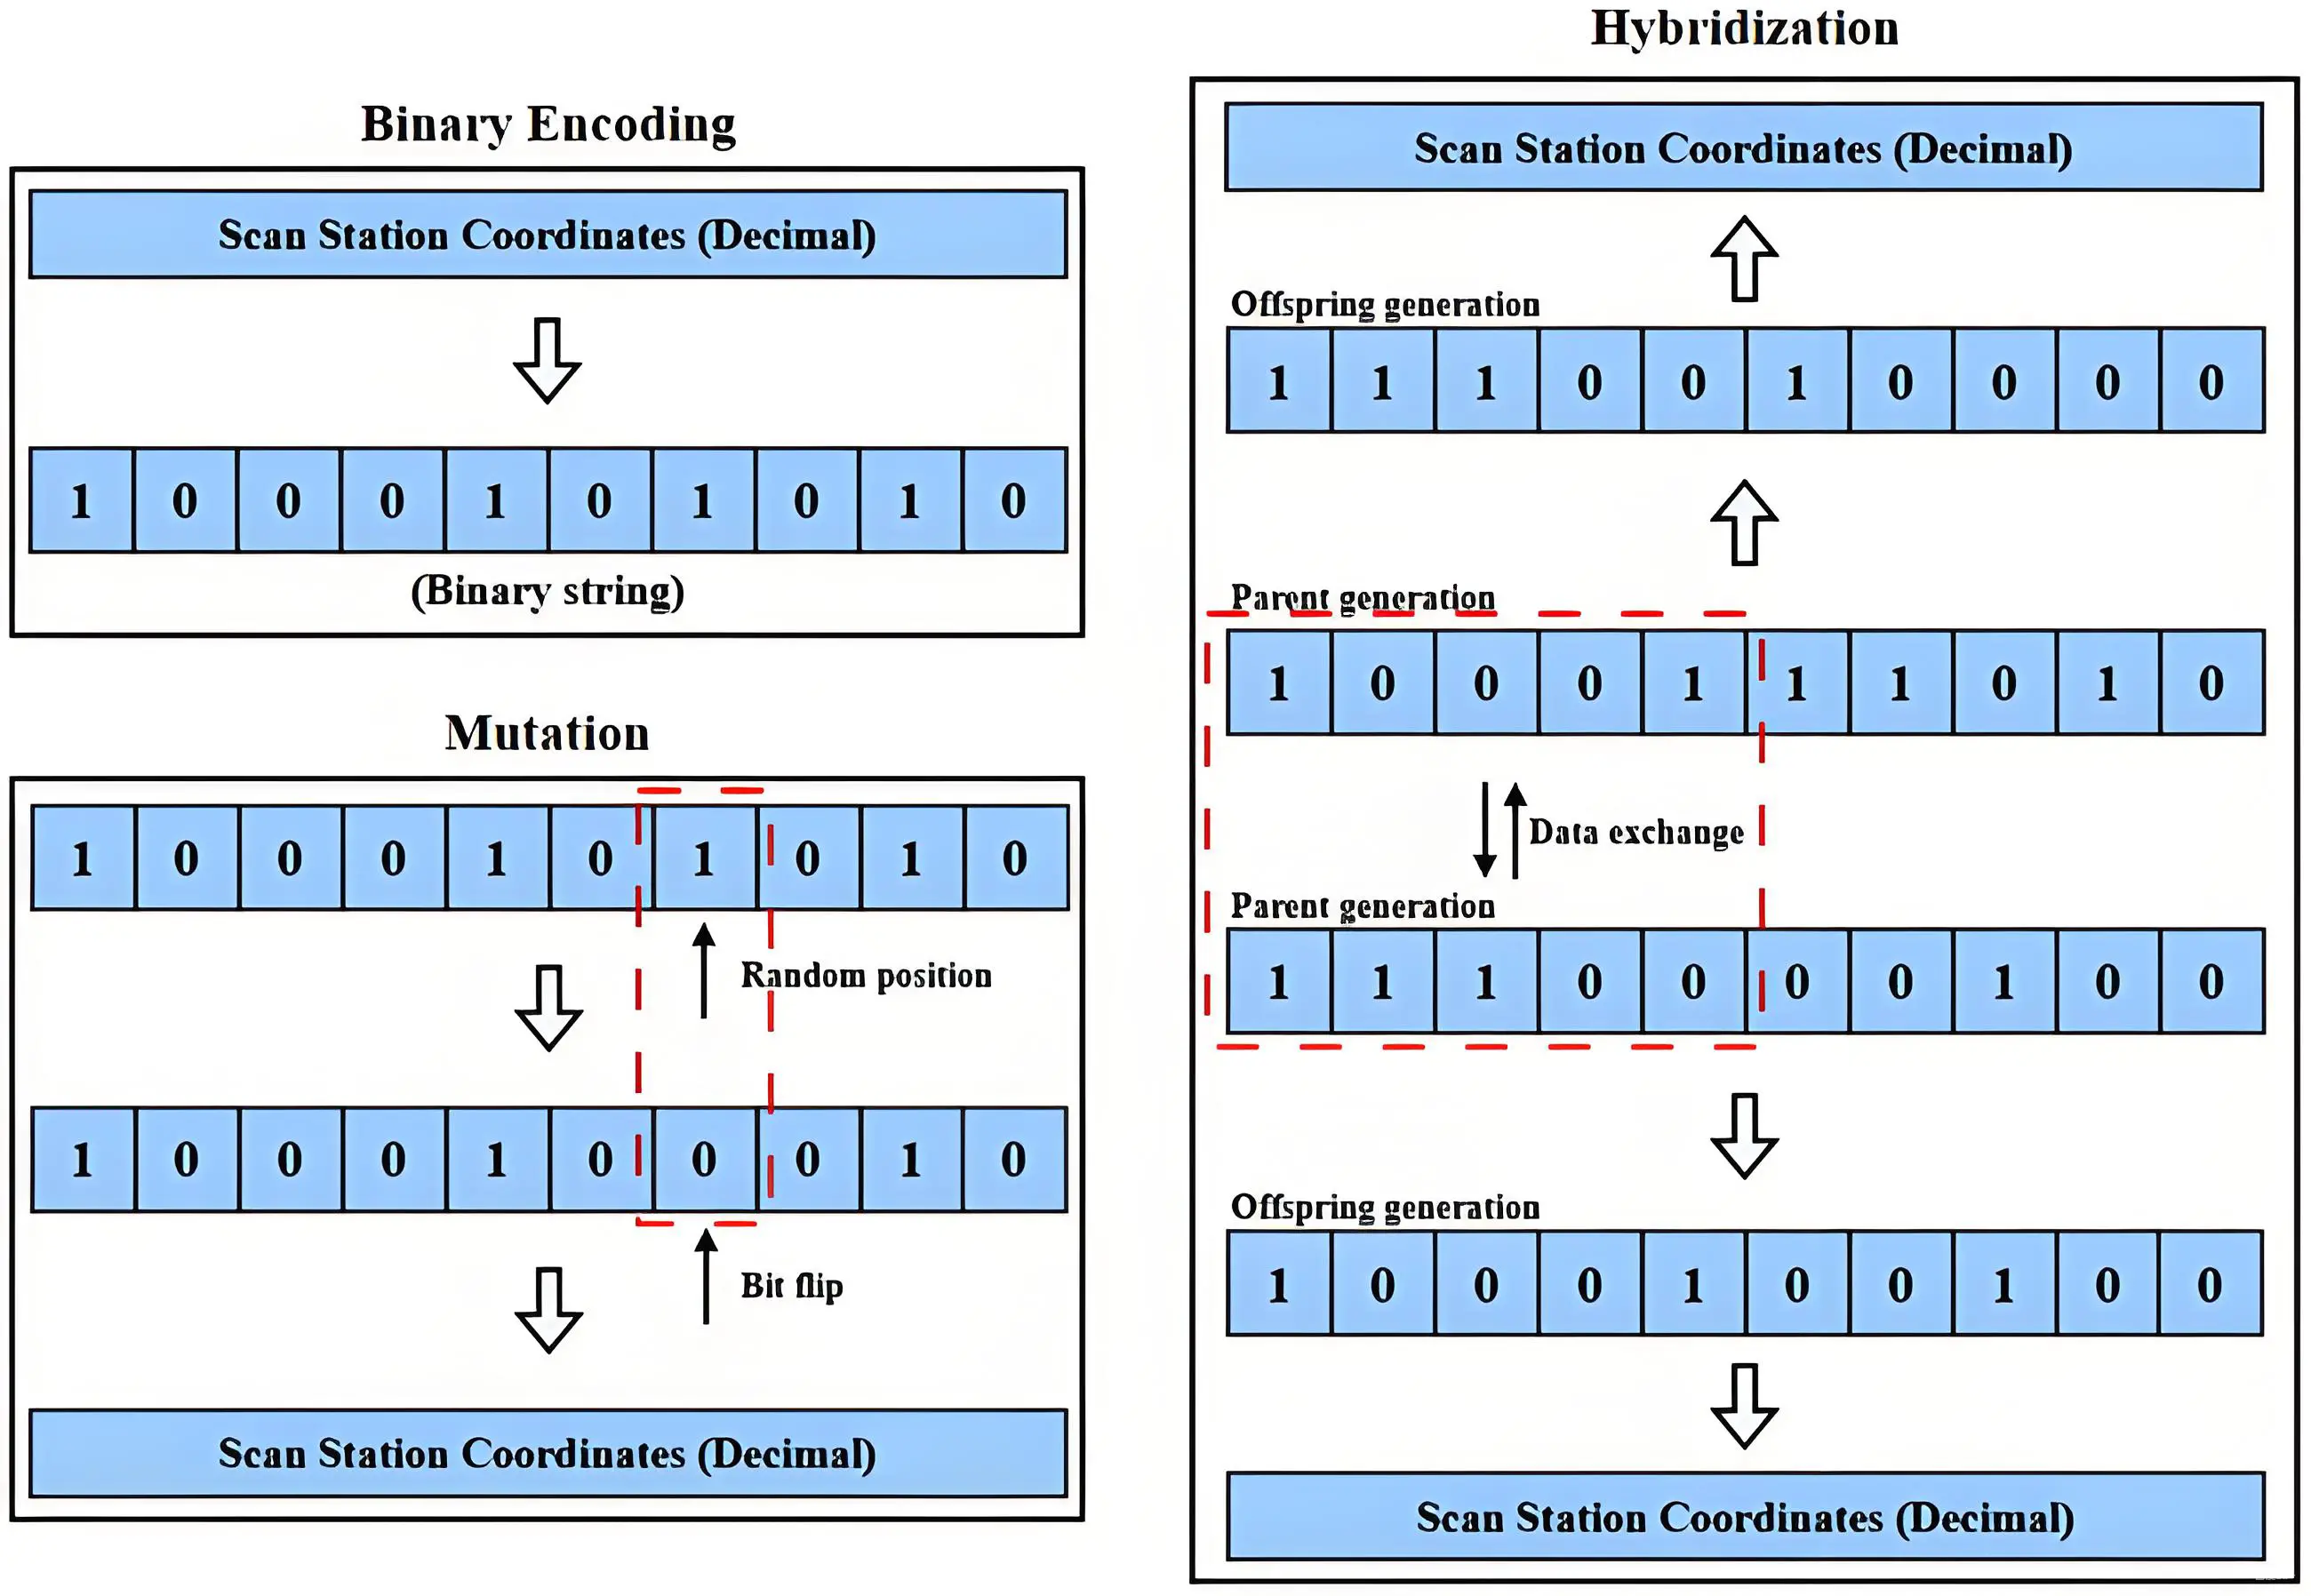
To achieve this goal, GA is used to find relatively optimal solutions. In this study, a population is first initialized, where multiple initial scan stations combinations are generated as individuals of the population to form the first generation. Each combination undergoes a fitness assessment, and the one with the highest fitness is selected for the next generation using tournament sorting[61]. Since the original decimal coordinate information is not suitable for effective information exchange, it is converted into a binary number string (Figure 12) to improve efficiency and processing speed. New combinations are generated through hybridization and mutation operations (Figure 12), which are analyzed for visibility and evaluated for fitness. If a new combination outperforms the current one, it replaces the existing combination and progresses to the next generation. Conversely, if the new combination performs worse, a simulated annealing algorithm[62] is used to evaluate whether it can still replace the current combination, helping to avoid getting trapped in local optimal solutions.
To improve the adaptability and practicability of the algorithm, three parameters are utilized: growth threshold (GT), stability coefficient (SC) and iteration threshold (IT). GT measures the minimum growth required for the highest score among the scan stations combination, SC records the number of generations that maintain the same solution, and IT sets a maximum number of iterations for the scan stations combination. When the iteration count reaches the IT, the Cov of the scan stations combination is compared with the Covindex. If Cov exceeds Covindex, the scan stations combination meets the requirements. Otherwise, a new scan station (i.e., I) is added, and the iteration continues until Cov exceeds Covindex. The iteration termination process is shown in Figure 13. By maximizing Cov while penalizing excessive Rep in the fitness function, the framework balances coverage and redundancy, ensuring both efficiency and completeness in scanning.
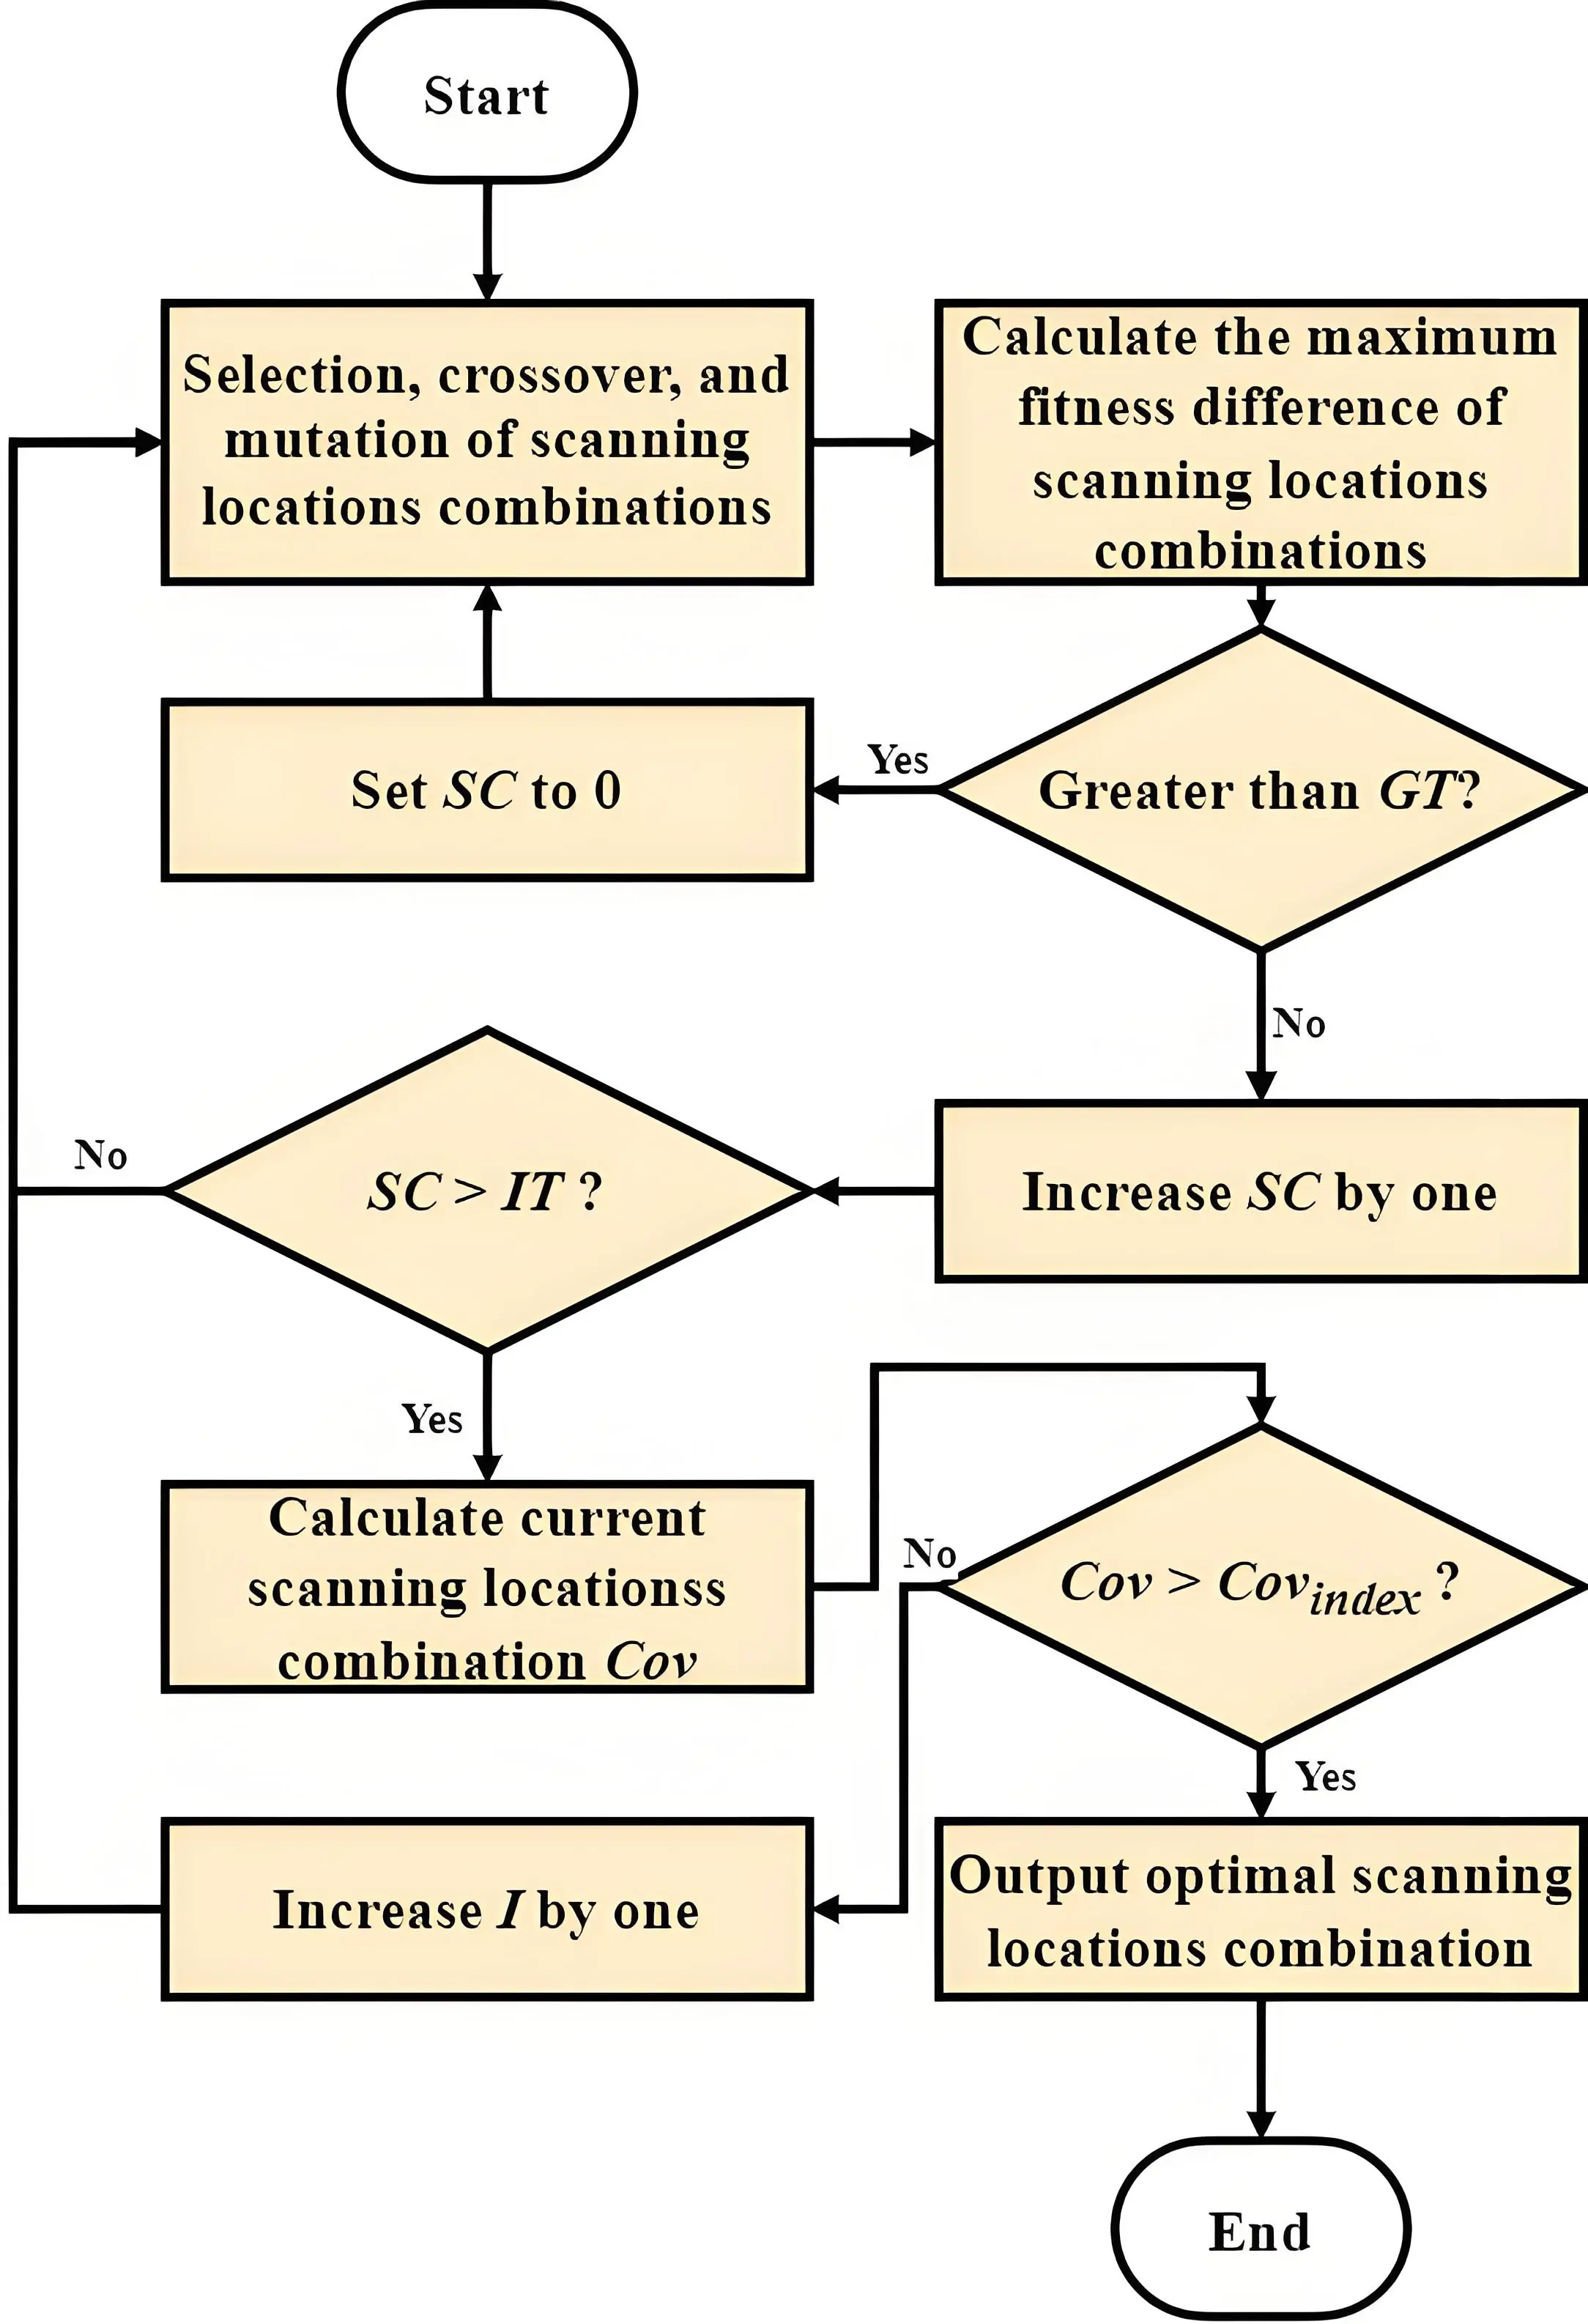
Figure 13. Relatively optimal scan stations combination iteration. SC: stability coefficient; IT: iteration threshold; Cov: coverage rate; GT: growth threshold.
3.3.2 Relatively optimal scan stations sequence
After obtaining the relatively optimal scan stations combination, the scan stations need to be sorted to minimize the distance and time required to complete the scanning, thereby improving scanning efficiency. For robots with limited endurance, finding the shortest path is particularly important. Therefore, this study proposes solutions based on a 0-1 map and the TSP, including: 1) generating a 0-1 map based on the BIM, 2) using the A* algorithm to calculate the cost matrix based on the Manhattan distance formula, and 3) obtaining the order of scan stations with the shortest total distance using a GA. The details are as follows:
First, vertex information of different spaces is extracted from the BIM model, and the maximum and minimum values of the X and Y coordinates are determined to draw the minimum rectangular bounding box of multiple spaces. According to the point spacing specified in ‘Target inspection surfaces to 3D point cloud’, a two-dimensional array is initialized to represent the 0-1 map. The size of the matrix is determined by dividing the width and height of the minimum rectangular bounding box by the point spacing. All elements of the two-dimensional array are initialized to 1, indicating that all areas are considered obstacles by default.
Next, the boundary positions of each space in the BIM model (Figure 14a) are read and mapped into the 0-1 map. The area elements within the space boundary are changed from 1 to 0, marking them as passable areas. Finally, based on the location and width of the doorways, connected areas between the spaces are added, changing the elements in these connected areas from 1 to 0 to obtain the complete 0-1 map (Figure 14b).
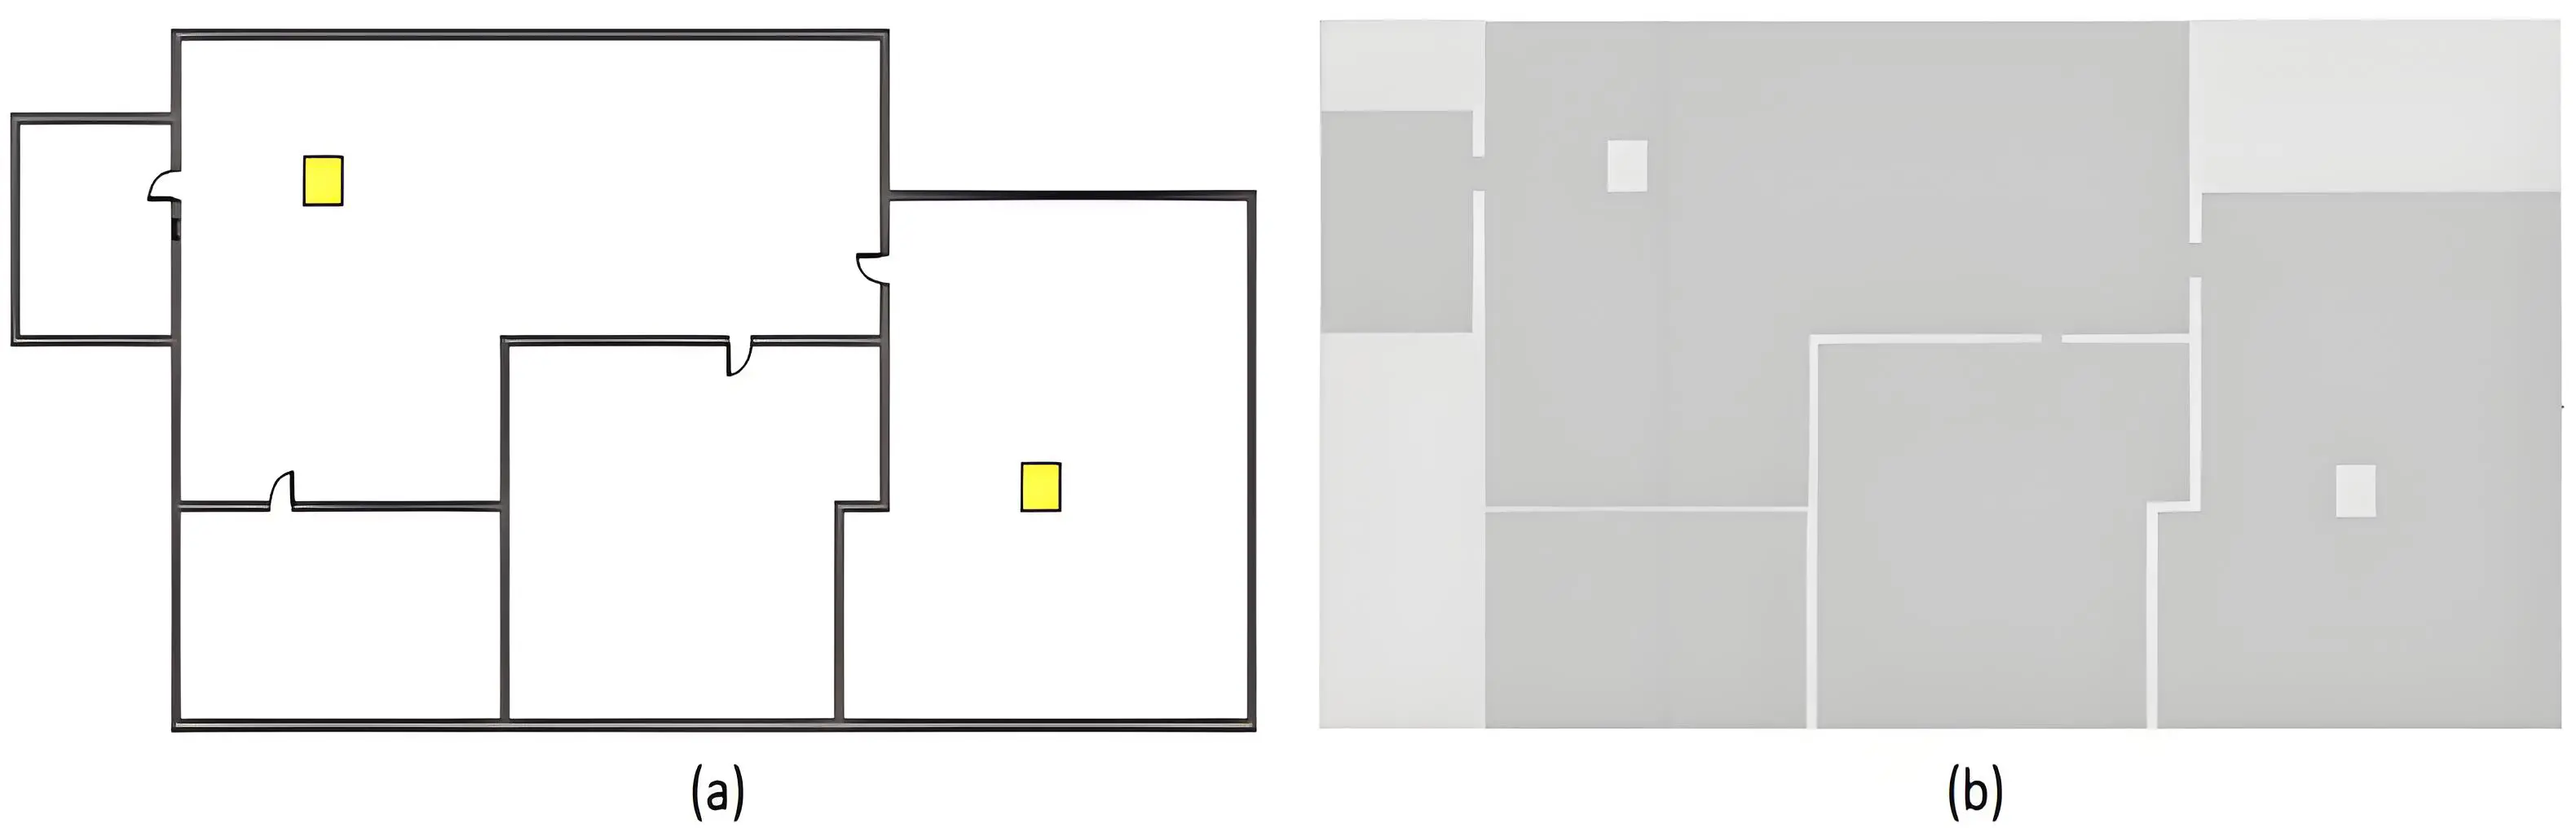
Figure 14. BIM-based 0-1 map. (a) BIM model; (b) 0-1 map. BIM: building information model.
After generating the 0-1 map, the A* algorithm and GA are used for relatively optimal scan stations sequencing. First, the A* algorithm uses the Manhattan distance to calculate the shortest path between sites and stores it in a distance matrix of size N*N (where N is the number of scan stations). The GA then randomly generates multiple possible sequences of scan stations visits and calculates the total distance for each sequence based on the distance matrix. By continuously selecting, combining, and adjusting these sequences, the algorithm identifies the final sequence of the scan stations.
3.3.3 Implementation scheme generation
After obtaining the relatively optimal scan stations combination and sequence, the next step is to generate the implementation scheme to ensure that the robot can successfully complete the task. The goal of the implementation scheme is to control the robot’s execution during movement, allowing it to better adapt to field conditions. Figure 15 illustrates the flow of generating the implementation scheme.
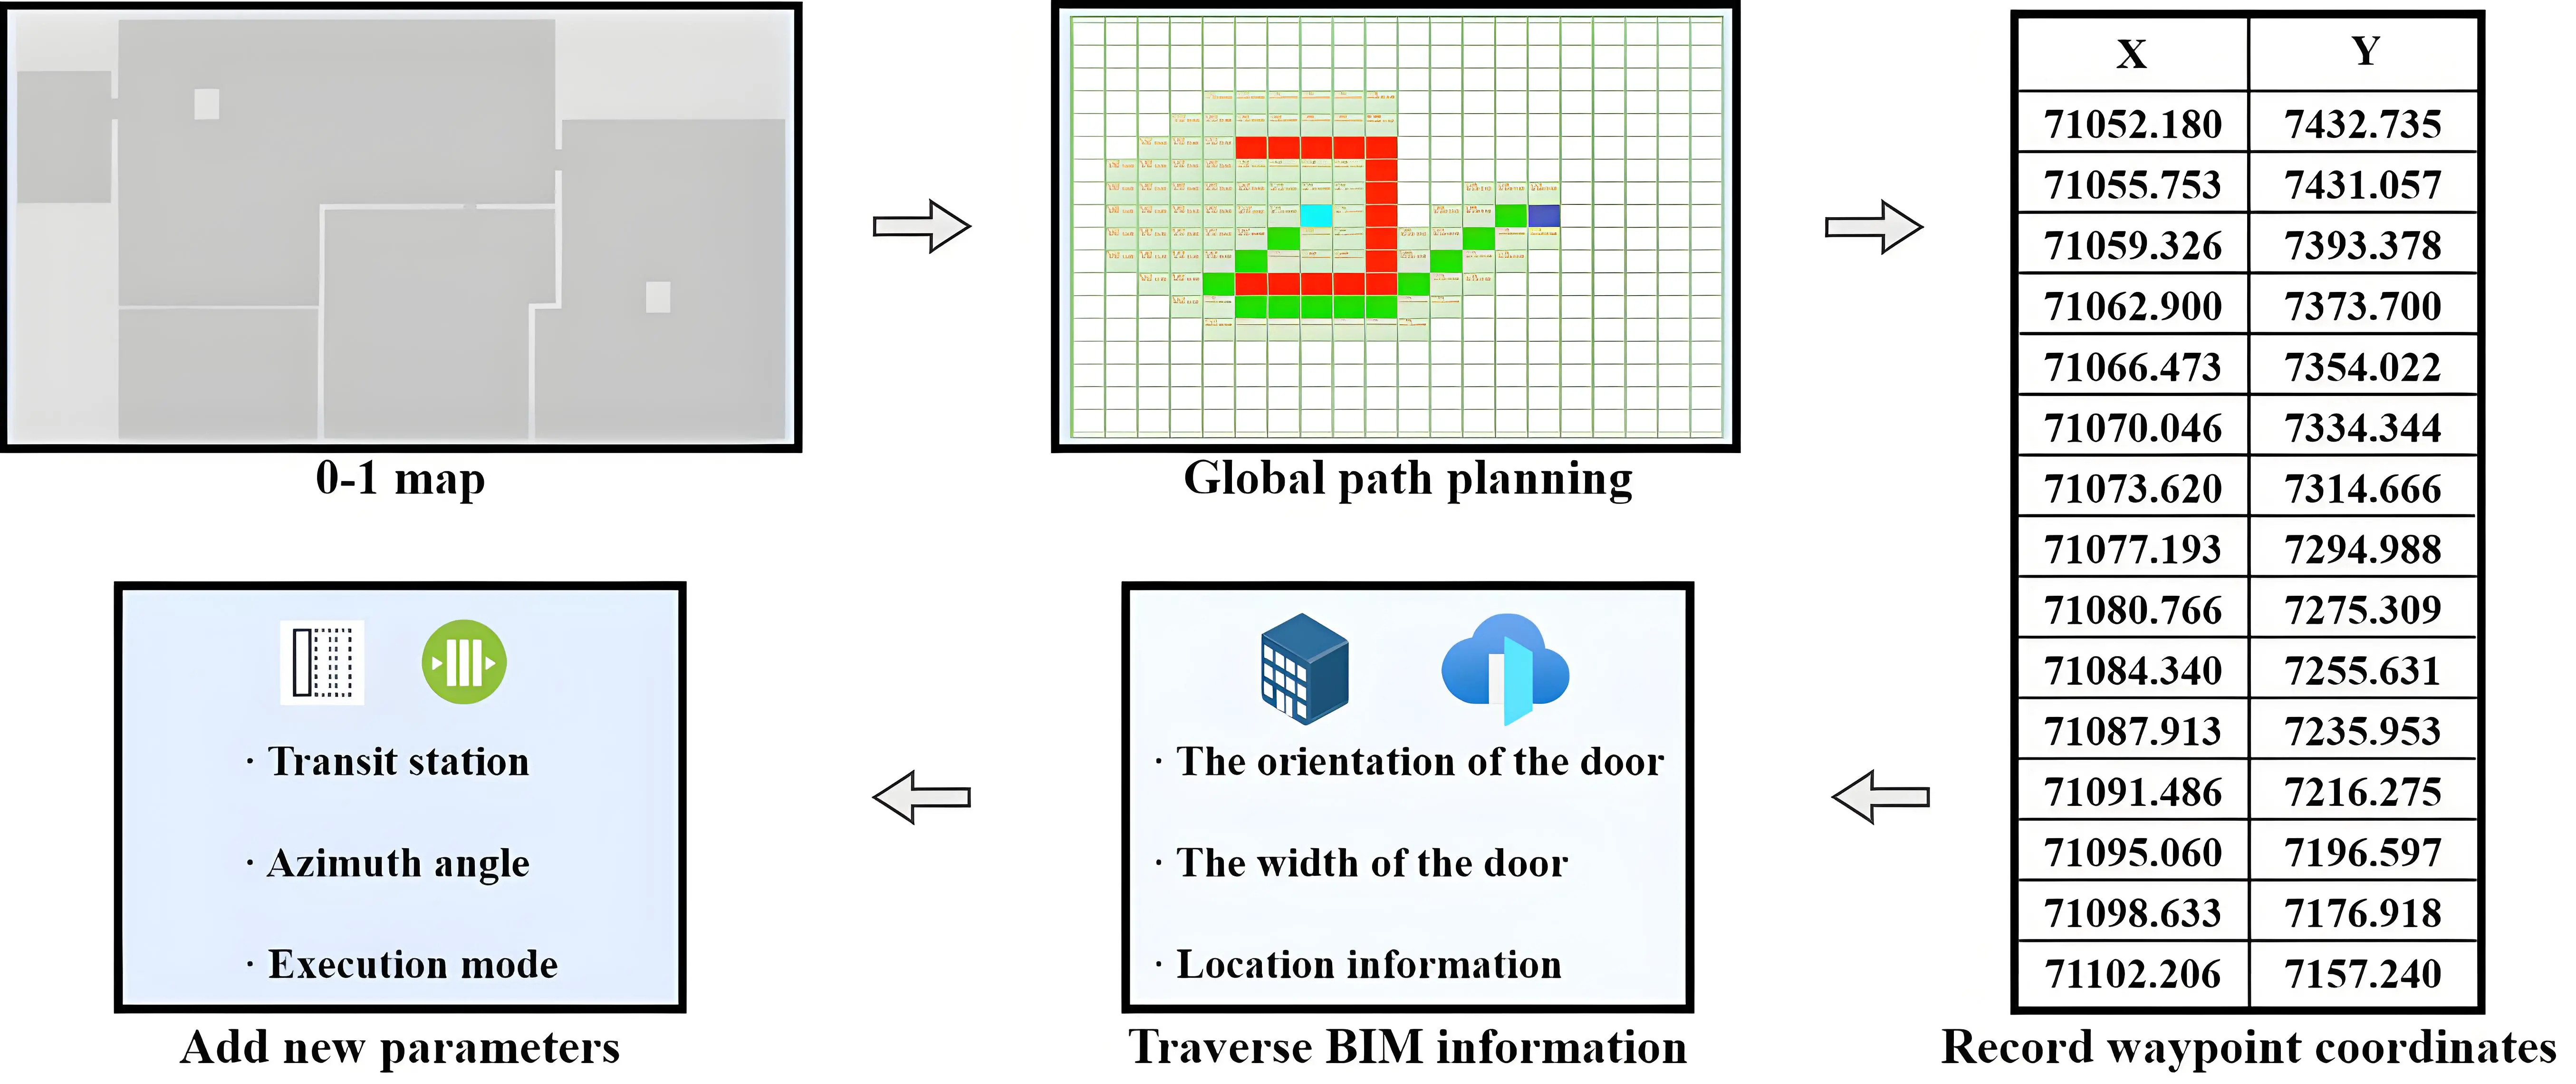
Figure 15. Flow chart of generating scan implementation scheme. BIM: building information model.
Firstly, the 0-1 map is obtained, and the location information of adjacent scan stations is input. The shortest path is then planned using the A* algorithm, and the traversing area and coordinate information of the path are automatically stored. The path coordinates are then read, and transit stations and azimuth angles are added in the areas passing through doorways to ensure that the robot moves perpendicular to the door frame when passing through, thus avoiding collisions. Additionally, the bottom elevation of the door is read to determine the robot’s execution mode when it passes through the doorway. If the height of the door frame or step is higher than the robot’s step height, the robot switches to obstacle crossing mode.
Furthermore, the combination of Cov and Rep ensures resilience to temporary static obstacles: even if some scanning regions are partially occluded, overlapping coverage across multiple stations allows the complete reconstruction of the point cloud model during registration. Based on the sequenced relatively optimal combination of scan stations, information regarding transit stations, azimuth angles, and execution modes is integrated to generate the implementation scheme. This scheme enables the robot to efficiently complete scanning tasks and maintain stable performance in complex environments.
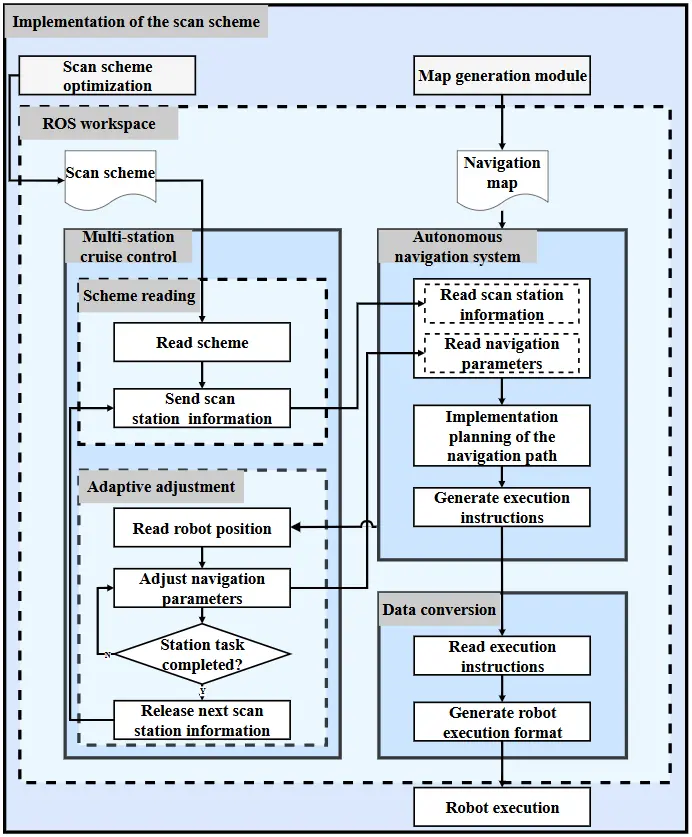
3.4 Implementation of the scan scheme
After optimizing the scan scheme, the next step is to effectively execute it to ensure efficient and accurate data collection. The following outlines the core steps for executing a scan scheme, including equipment and system integration, multi-station cruise control, and data conversion, as illustrated in the framework in Figure 16.
3.4.1 Equipment and system integration
The study utilized a quadruped robot, the Unitree B1, equipped with an RS-LiDAR-16 LiDAR sensor and a built-in Unitree proprietary IMU module integrated into the robot controller to enhance the robot’s positioning capabilities, along with a Trimble X7 laser scanner for high-precision data collection. Based on the size requirements of this equipment, a carrying platform was designed and 3D-printed to integrate the components into a complete system, as shown in Figure 17. The Unitree B1 robot boasts a high carrying capacity, stable movement performance, long endurance, and adaptability to complex terrains, allowing it to navigate indoor steps and stairs. Additionally, the Unitree B1’s Jetson Xavier NX provides data storage and high-performance computing, running ROS1 (Noetic Ninjemys) on Ubuntu 16.04 capabilities to meet the needs of developers. The point spacing of the Trimble X7 scan results under different scanning modes is shown in Table 3. To maximize data collection efficiency while meeting the quality requirements of the point cloud model for subsequent processing, this study set the scanning time to 2 minutes and the maximum scan radius to 10 meters. The resulting point spacing is less than 11 mm, which meets the point cloud quality standards set by the General Services Administration of the United States, which stipulate that the point spacing for indoor point cloud collection models should not exceed 13 mm.
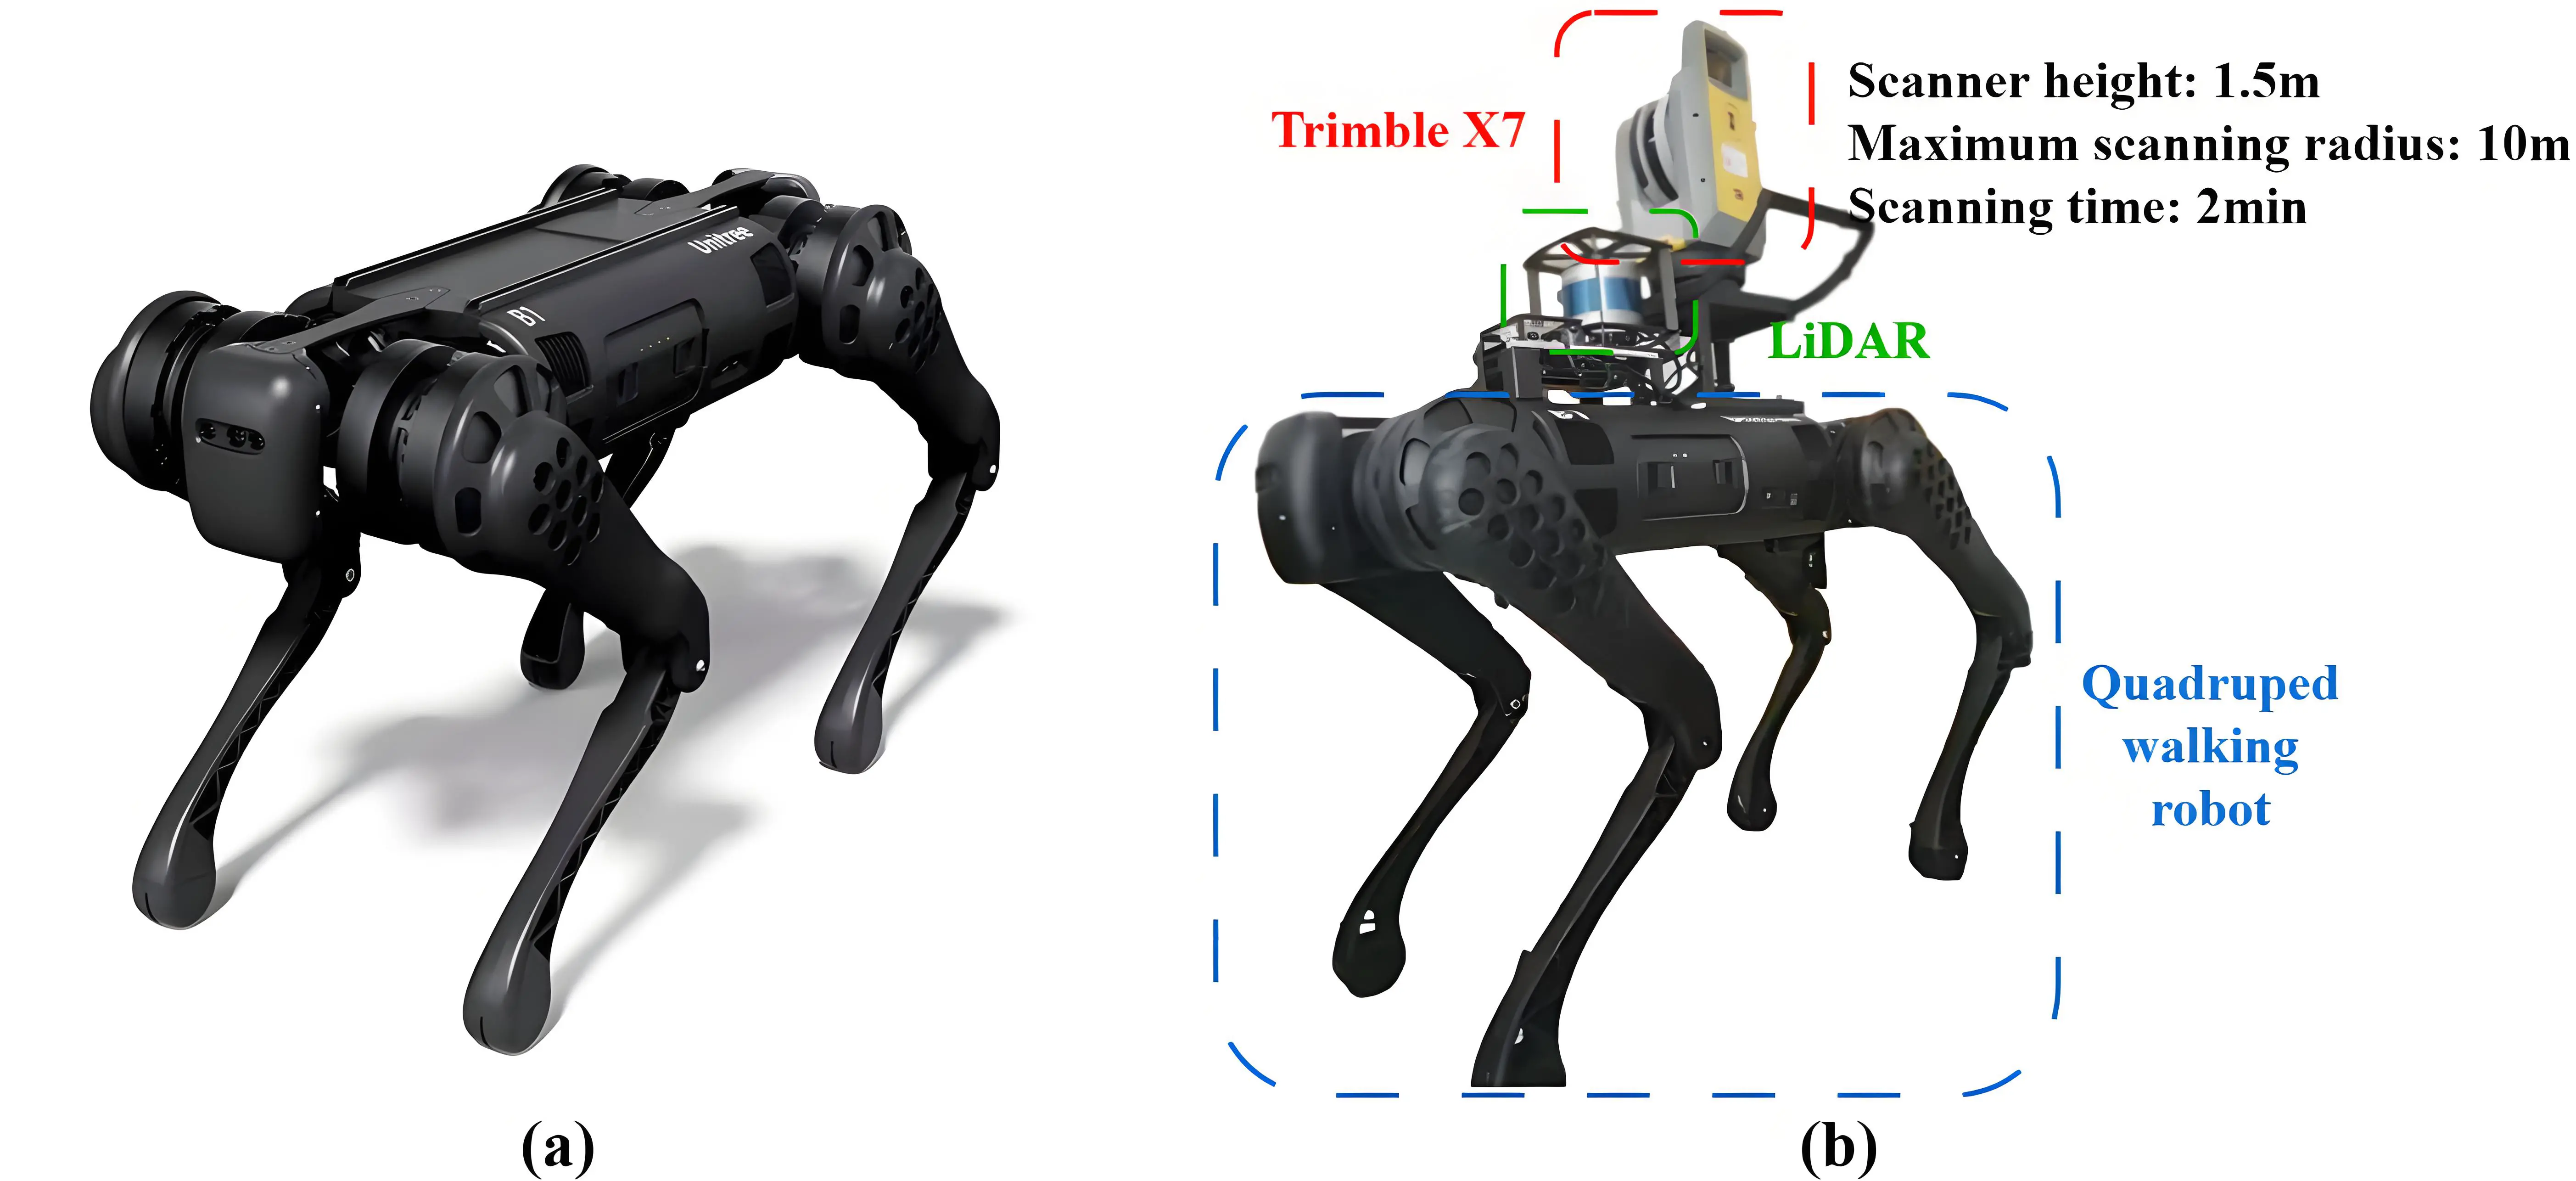
Figure 17. Intelligent scanning system. (a) Quadruped walking robot platform, Unitree B1; (b) Robotic systems integrating LiDAR and Trimble X7. LiDAR: light detection and ranging.
Table 3. Point spacing of Trimble X7 scan results.
| Scanning Time (min) | Scanning Radius (m) | Point Spacing of The Scan Result (mm) |
| 10 | 11 | |
| 2 | 20 | 40 |
| 30 | 57 | |
| 10 | 9 | |
| 4 | 20 | 33 |
| 30 | 47 | |
| 10 | 6 | |
| 7 | 20 | 21 |
| 30 | 30 | |
| 10 | 4 | |
| 15 | 20 | 13 |
| 39 | 19 |
In terms of system integration, ROS is adopted as the development framework. It encapsulates different hardware and systems within the robot, enabling individual sensors to be expressed in ROS in a consistent manner and invoked at the upper application level, making it easy for developers to build and deploy robot applications.
A ROS workspace is created on the Jetson Xavier NX to house the navigation map (see Section 3.2.1), the autonomous navigation system encapsulated by the positioning module (see Section 3.2.2) and navigation module (see Section 3.2.3), and the scan scheme (see Section 3.3.3). The ROS workspace is a directory structure for organizing and managing ROS software packages. Creating this workspace ensures the smooth operation of individual software packages and provides a unified platform to manage all resources and configurations related to robot operation.
Furthermore, to ensure that the previously built system functions can be effectively used in real-world applications, two key modules, multi-station cruise control and data conversion, are developed in the ROS workspace. The multi-station cruise control module includes two functions: scheme reading and adaptive adjustment. The data conversion module is responsible for converting the instructions generated by the autonomous navigation system into a format that the robot can understand and execute. These two modules are developed and integrated to ultimately achieve efficient and accurate scan scheme.
3.4.2 Multi-station cruise control
The multi-station cruise control module includes two functions, scheme reading and adaptive adjustment, to achieve intelligent multi-station scheme execution and real-time adjustments. The scheme reading function is responsible for reading the scan scheme and sending scan station information to the autonomous navigation system for path planning. After the global path is generated, the local path and navigation parameters suitable for robot movement are further generated.
The adaptive adjustment module ensures flexibility and security in scheme execution. According to the scheme requirements, this module adjusts the robot’s safety distance, maximum speed, and other parameters. Common navigation parameters are shown in Table 4. The module reads the robot’s position information from the autonomous navigation system to determine whether it has reached the target station. If not, the robot continues path planning and movement; upon arrival, it performs the corresponding operation. At the transit station, the direction and speed are adjusted, and the inflation radius of the navigation map and the minimum distance from obstacles are set to half the width of the robot, then fed back to the autonomous navigation system to ensure smooth passage. At the scan station, the robot adjusts its orientation and activates the 3D laser scanner for data collection. After completing a station task, the next station information is released, and the scheme reading function instructs the robot to proceed to the next station.
Table 4. Common navigation parameters.
| Common Navigation Parameters | Function |
| min_distance_obstacle | minimum distance to obstacle |
| inflation_radius | navigation map inflation radius |
| max_vel_x | maximum forward speed |
| acc_lim_theta | Acceleration limit |
3.4.3 Data conversion
The data conversion module is responsible for converting the execution instructions generated by the autonomous navigation system into a format that the robot can understand and execute. Since the instruction format generated by the autonomous navigation system differs from the format executed by the robot, the data conversion module parses and re-encodes these instructions in real time. This ensures that the robot can correctly interpret and perform the corresponding actions, providing reliable support for multi-station cruise control.
4. Experiment and Results
To verify the effectiveness of the proposed approach, an office building was selected as the experimental site. First, the BIM of the experimental site was processed. Then, the scan scheme was generated. Finally, the quadruped robot executed the scheme to perform data collection. The specific implementation details and experimental results are as follows.
4.1 Experimental site
The office building (Figure 18a) covers an area of 7,193.57 m2, with a total construction area of approximately 81,000 m2. The above-ground construction area is 63,279.96 m2, while the underground construction area is 17,556.16 m2. The main building is 150 m high, with a total of 32 floors. Such a large amount of data cannot be efficiently handled by traditional manual scanning, which is not only inefficient but also prone to errors. Therefore, more efficient and automated scanning technology must be used to ensure the accuracy and completeness of the data. This study utilizes quadruped robot autonomous navigation and optimized scan scheme to effectively complete extensive indoor scanning tasks. One floor was selected as the experimental site (Figure 18b). This floor has a construction area of 1,363 m2 and is a large indoor space requiring multiple scan stations. Notably, the site includes steps, which pose mobility challenges for traditional wheeled mobile robots. The corresponding BIM model of the experimental site is shown in Figure 18c.
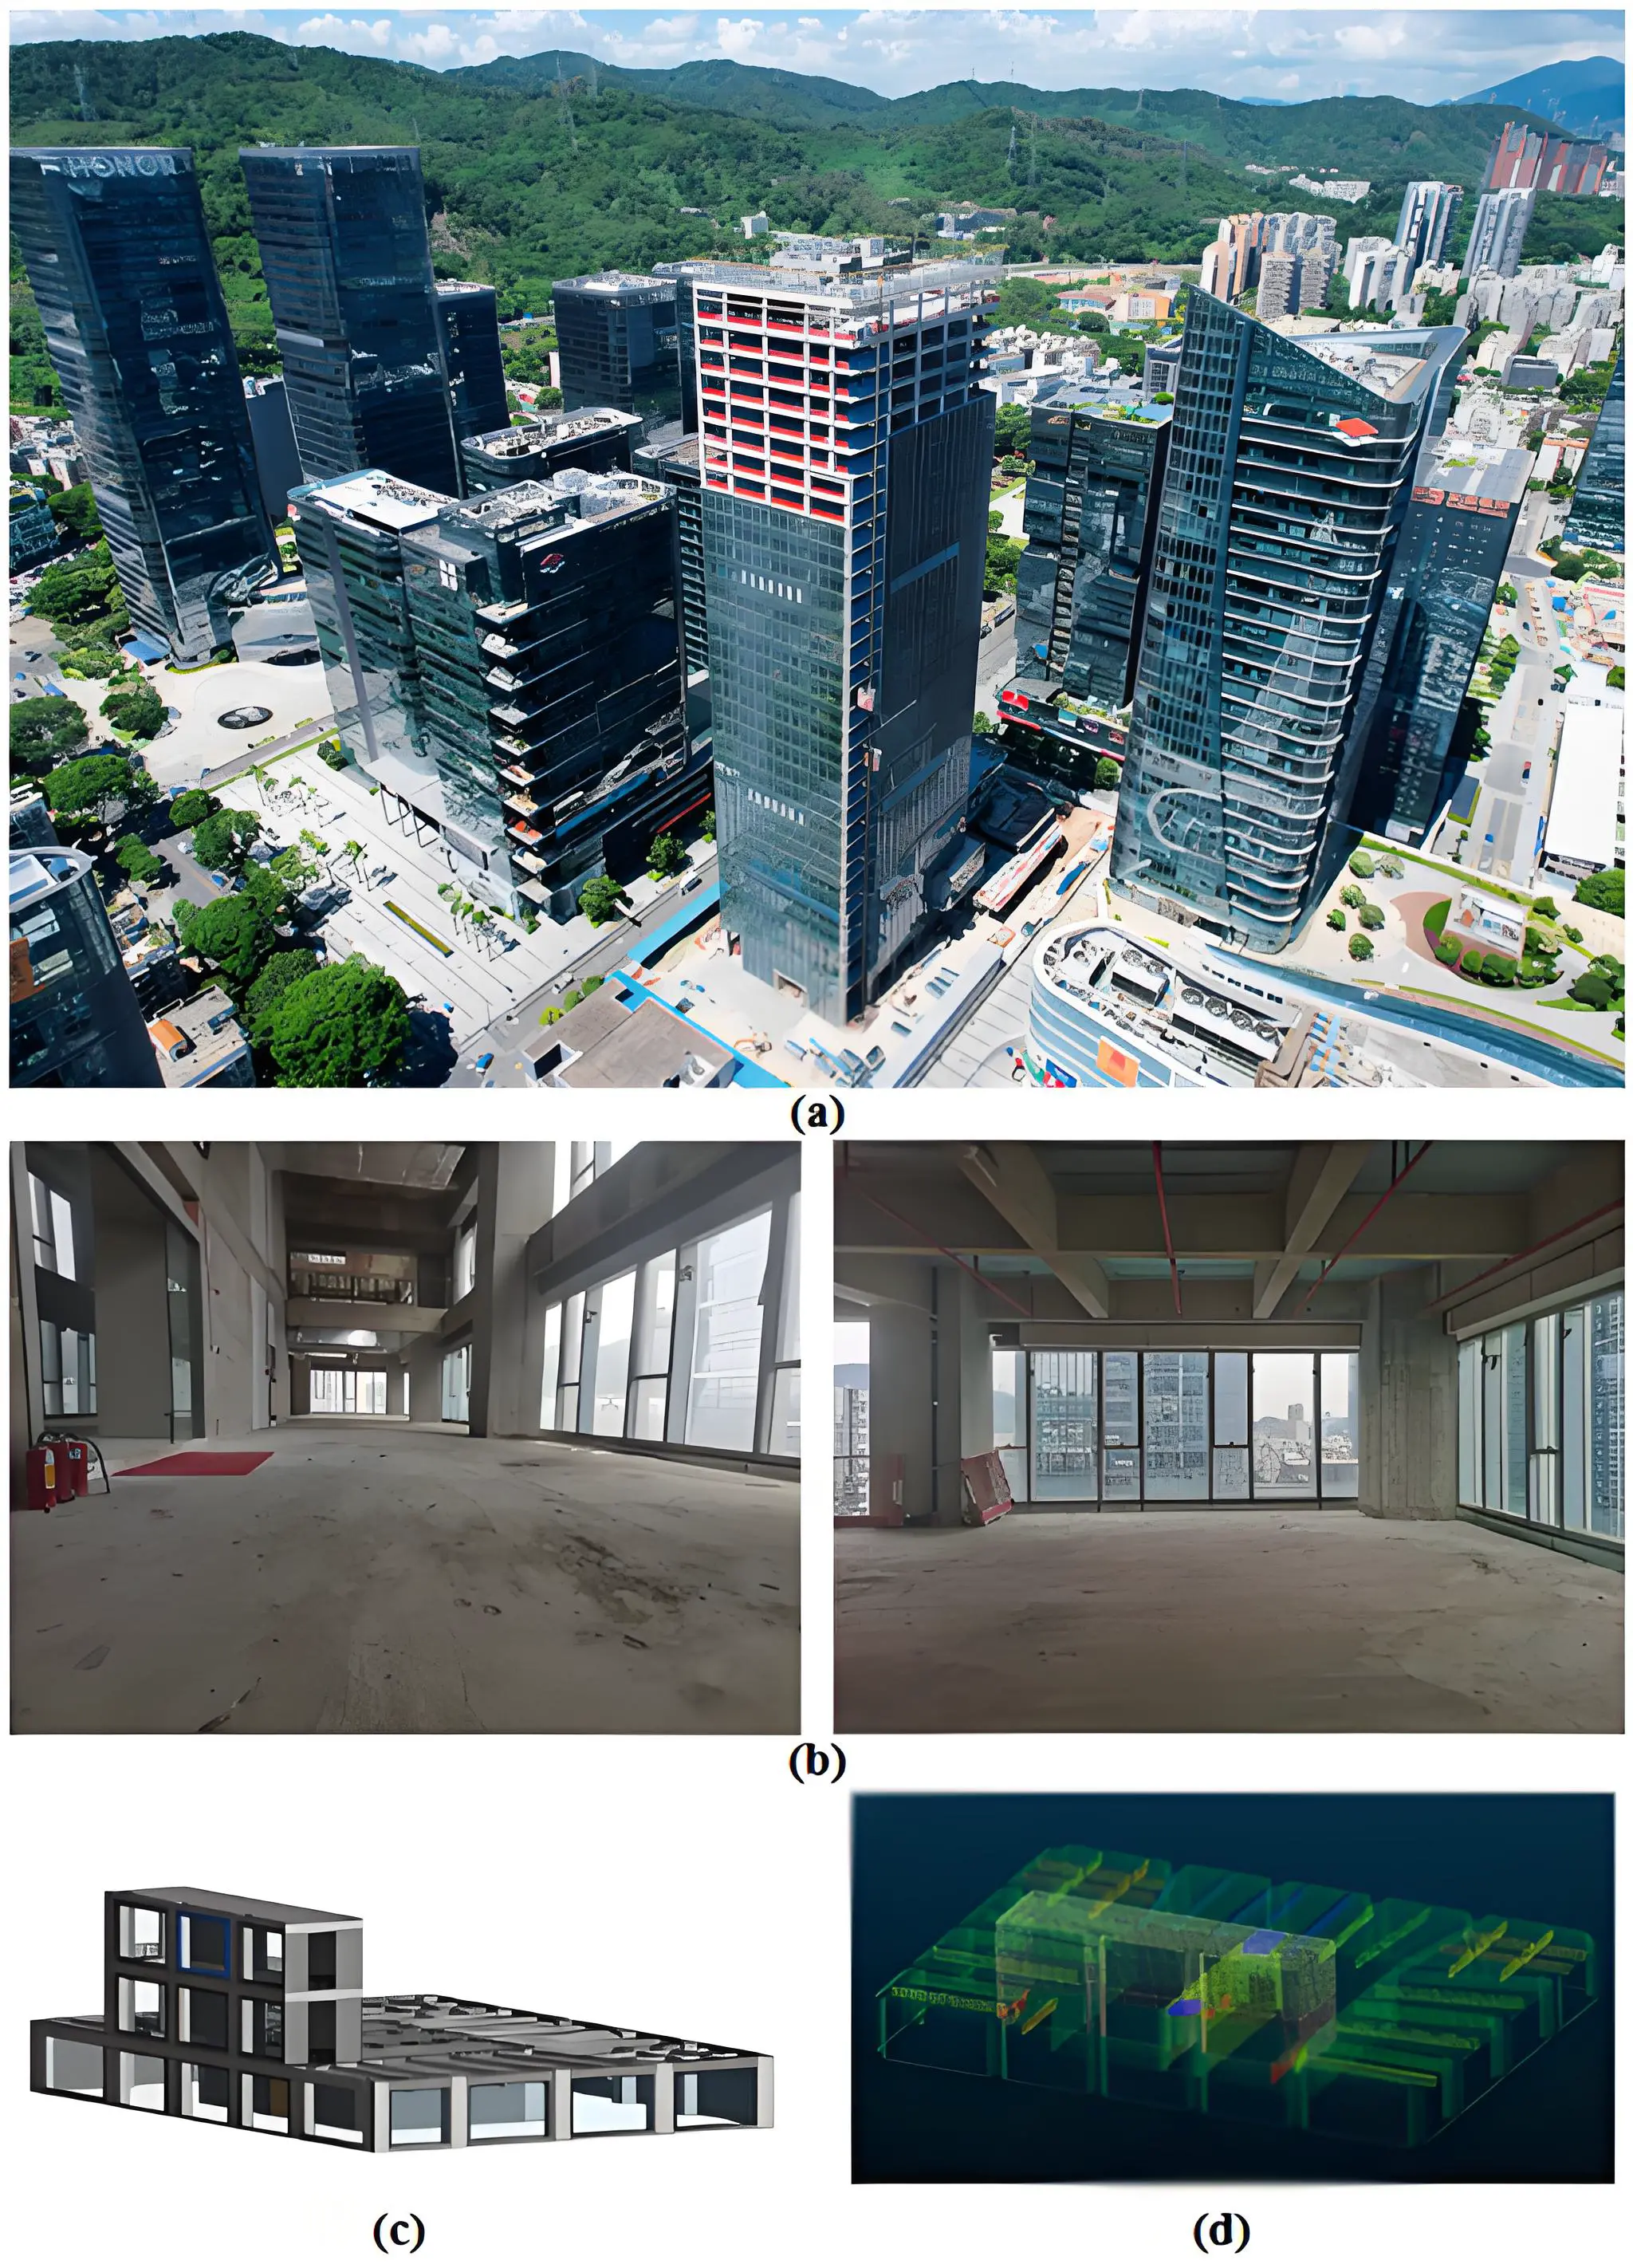
Figure 18. Experimental site. (a) Actual project; (b) Photos of the experimental site; (c) BIM of the experimental site; (d) Point cloud model based on BIM. BIM: building information model.
4.2 BIM processing and autonomous navigation system construction
In the BIM processing for the office building, the BIM is first divided into spaces. Information such as component dimensions, vertices, and elevations is extracted, and the indoor target inspection surfaces are generated based on this information. By setting a spacing of 0.35 m, the plane is converted into point cloud, as shown in Figure 18d. The map generation module then filters the point cloud model and publishes it as a topic on the ROS platform. The map generation node receives this information, generates a navigation map combined with map parameters and indoor environment information, and enables mutual mapping among the navigation map, BIM, and real environment. The positioning module uses the AMCL algorithm to integrate LiDAR, IMU, odometer, and map information, generating real-time positioning information for the quadruped robot. Finally, the navigation module employs the A* algorithm for global path planning and the TEB algorithm for local path planning based on the robot, map, and sensors information.
4.3 Intelligent scanning planning
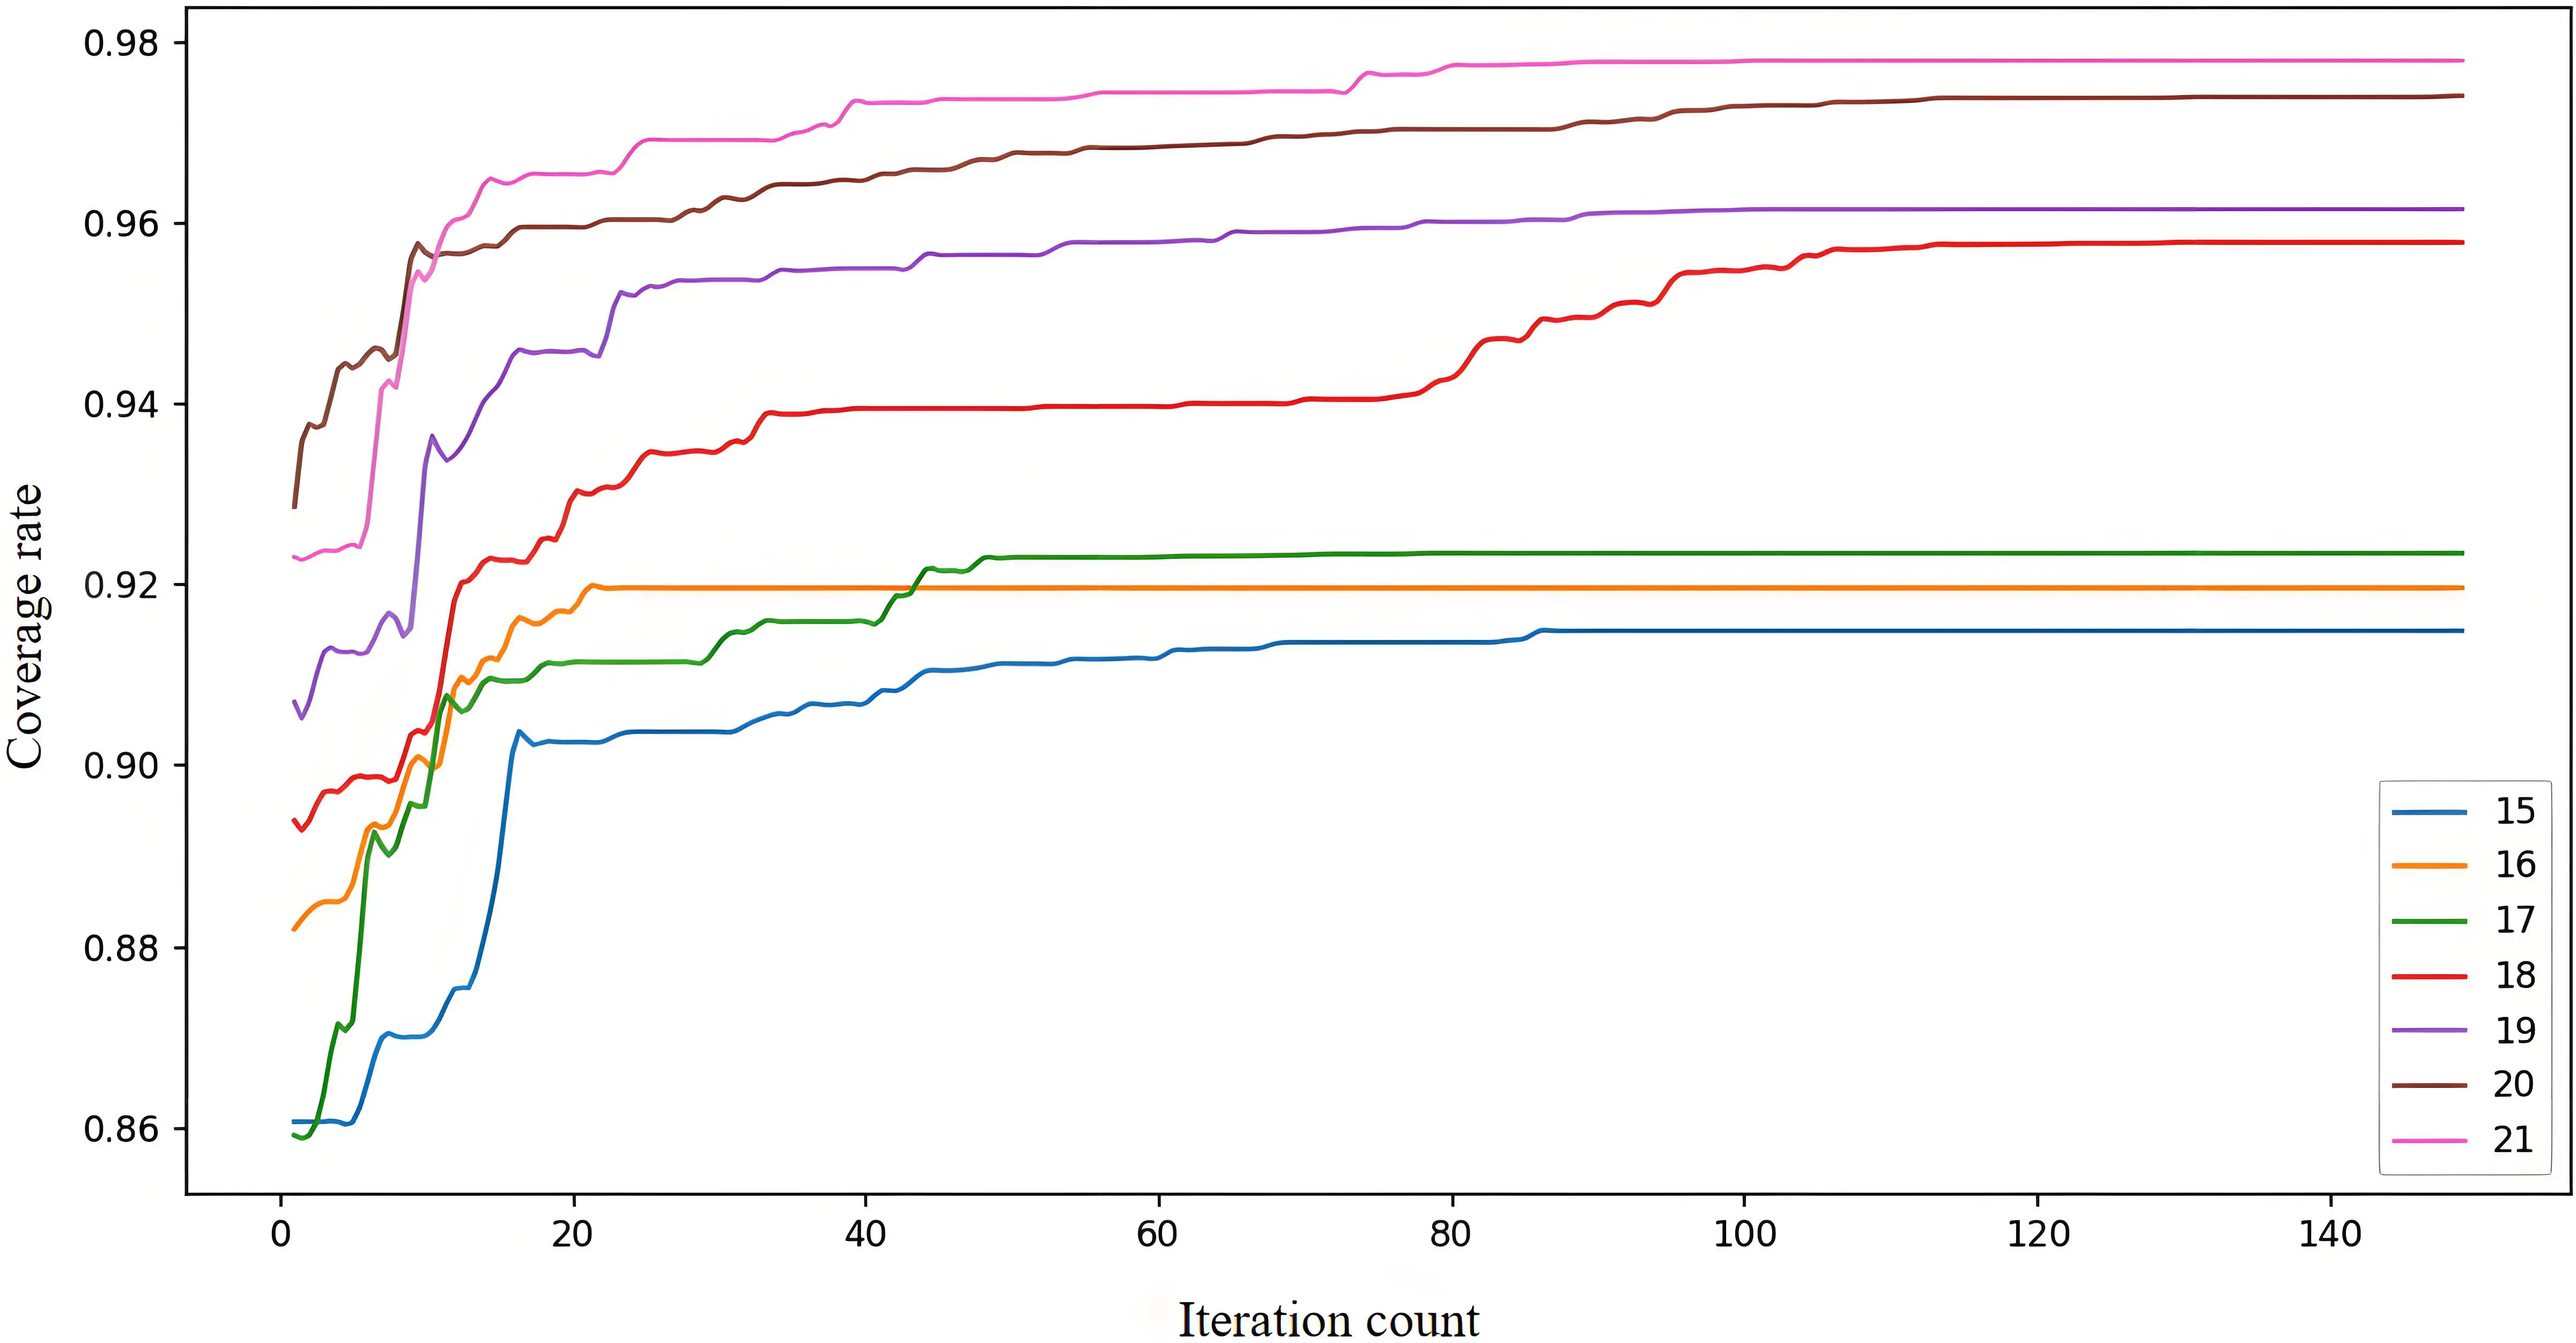
Based on the scanning condition parameters determined above and the pre-processing of the BIM, the initial number of scan stations is set to 15 (Eq. (1)). Accordingly, the corresponding number of scan stations is randomly generated within the candidate scan stations of different spaces, followed by a visibility evaluation. GA is then iteratively employed to achieve a relatively optimal solution for the scan stations combination. In this process, the population size is set to 100, with a mutation rate of 0.15 and a hybridization rate of 0.96. The fitness function is set to A = 0.8 and B = 0.2 (Eq. (4)). The iteration terminates once the Cov reaches a Covindex of 97.5%. Ultimately, the final number of scan stations is 21, achieving a Cov of 97.7%, which exceeds the predefined goal. The iterative process is shown in Figure 19.
A 0-1 map generated from the BIM information is used in conjunction with the A* algorithm and the Manhattan distance formula to calculate the distance matrix for the scan stations combination. GA is then employed to optimize the sorting of the sites, resulting in the shortest traversal order (Figure 20a), reducing the total distance to 177 m. Additionally, transit stations are added in the connected areas between the scan stations (Figure 20b) to ensure the smooth passage of the robot.
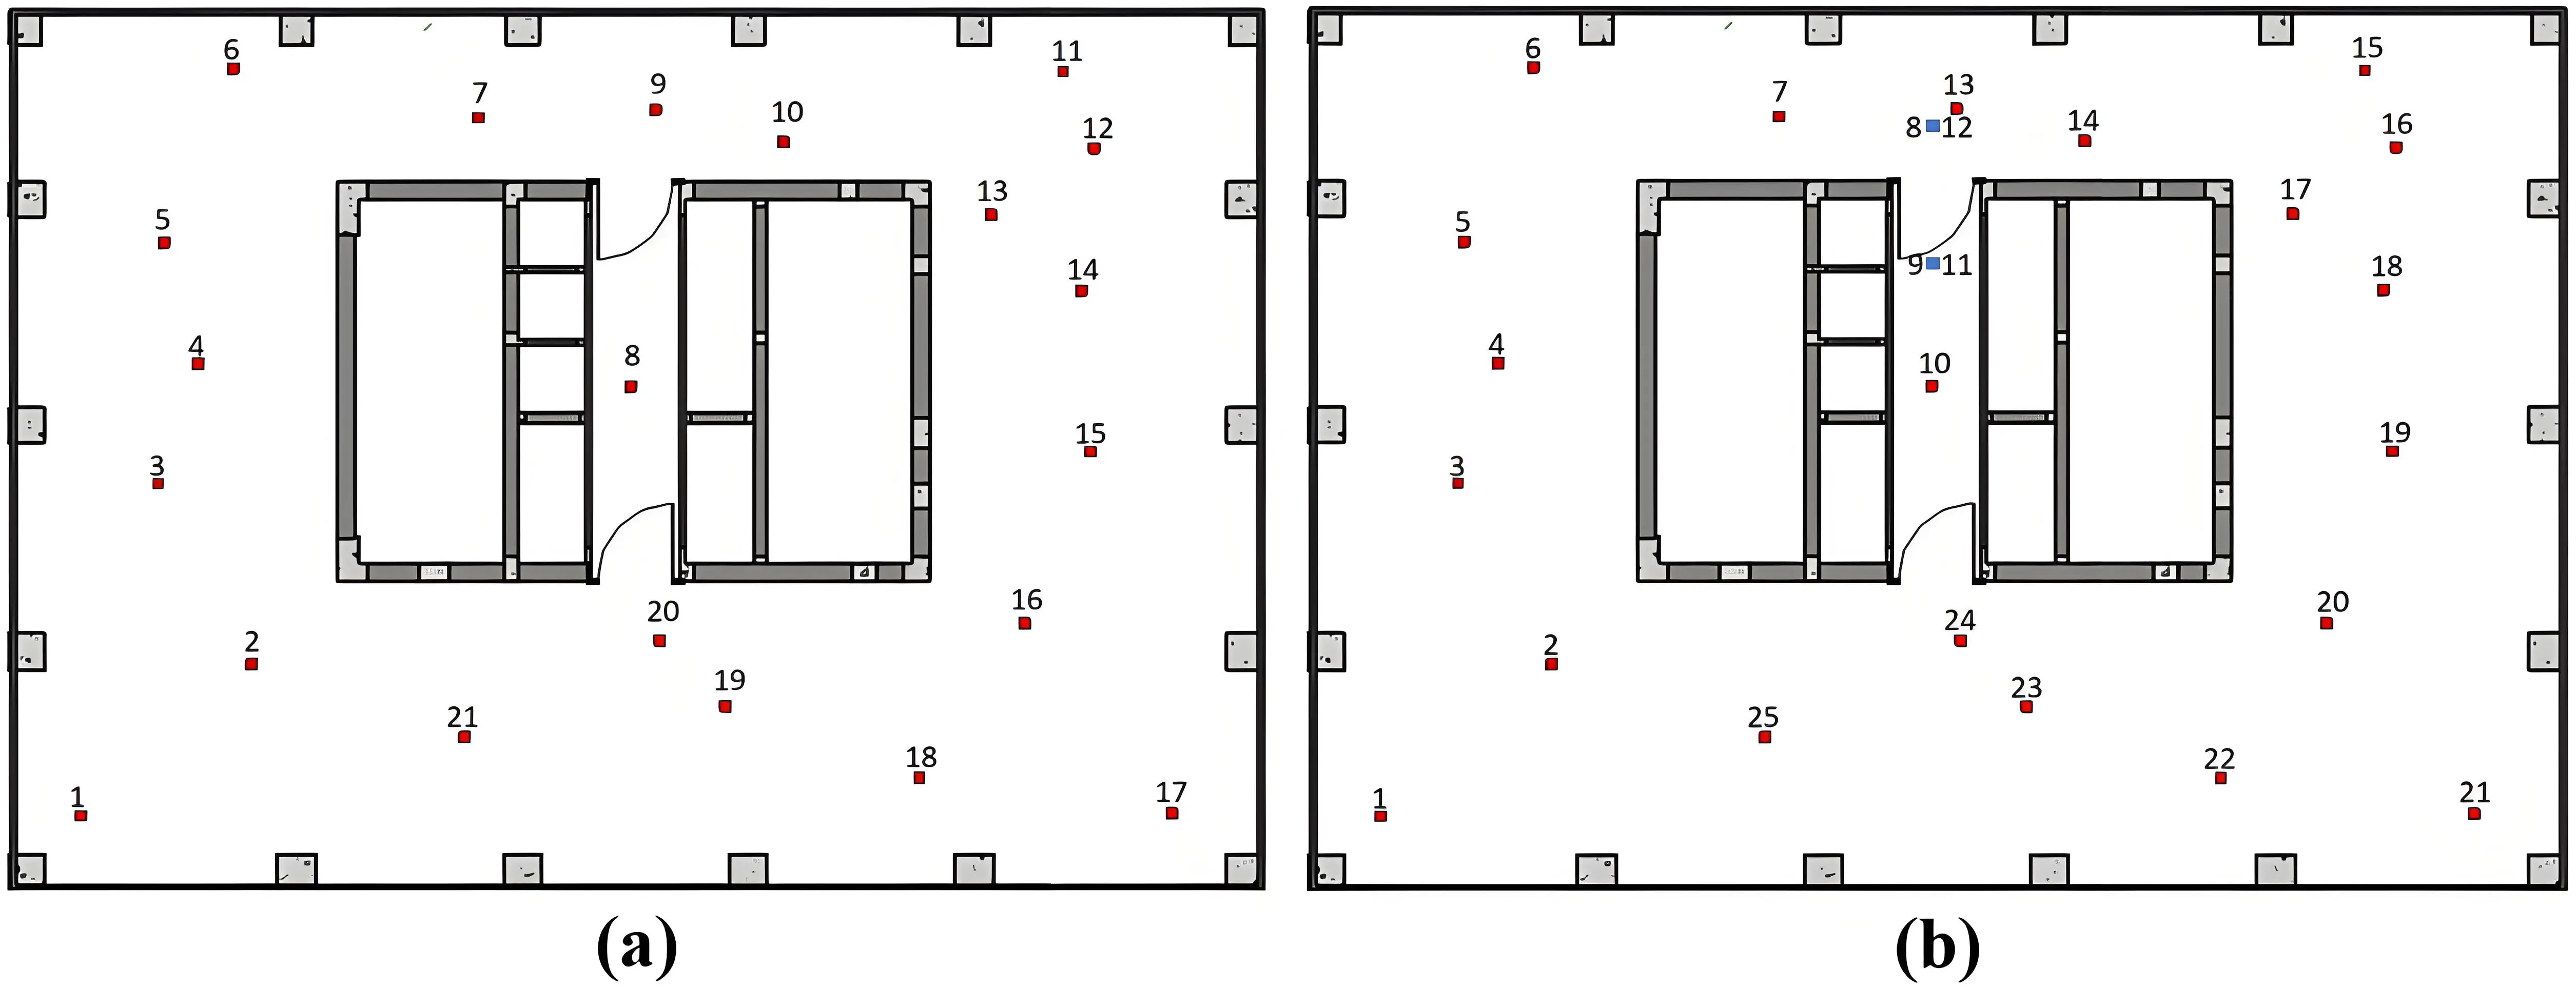
Figure 20. Final scan stations combination. (a) Shortest traversal sequence; (b) Added transit stations in the connected areas.
4.4 Intelligent scanning implementation
Before executing the scan scheme, the scan scheme is loaded into the robot’s autonomous navigation system. The adaptive module initializes execution parameters: the safety distance and obstacle inflation radius are set to 1.1 m to ensure avoidance of walls and structural columns. When the robot navigates through narrow areas, the inflation radius and safety distance are adjusted to 0.4 m to ensure smooth passage. The adaptive module then adjusts the robot’s movement speed based on its real-time position, accelerating to 1.1 m/s in open areas and slowing to 0.6 m/s in narrow or obstructed areas to avoid collisions. The execution module converts these speed instructions into a format that the robot can execute during the scanning process. Upon arrival at each scan station, the Trimble X7 performs a two-minute data collection. The scanning process is shown in Figure 21, and the scan overview is depicted in Figure 22.
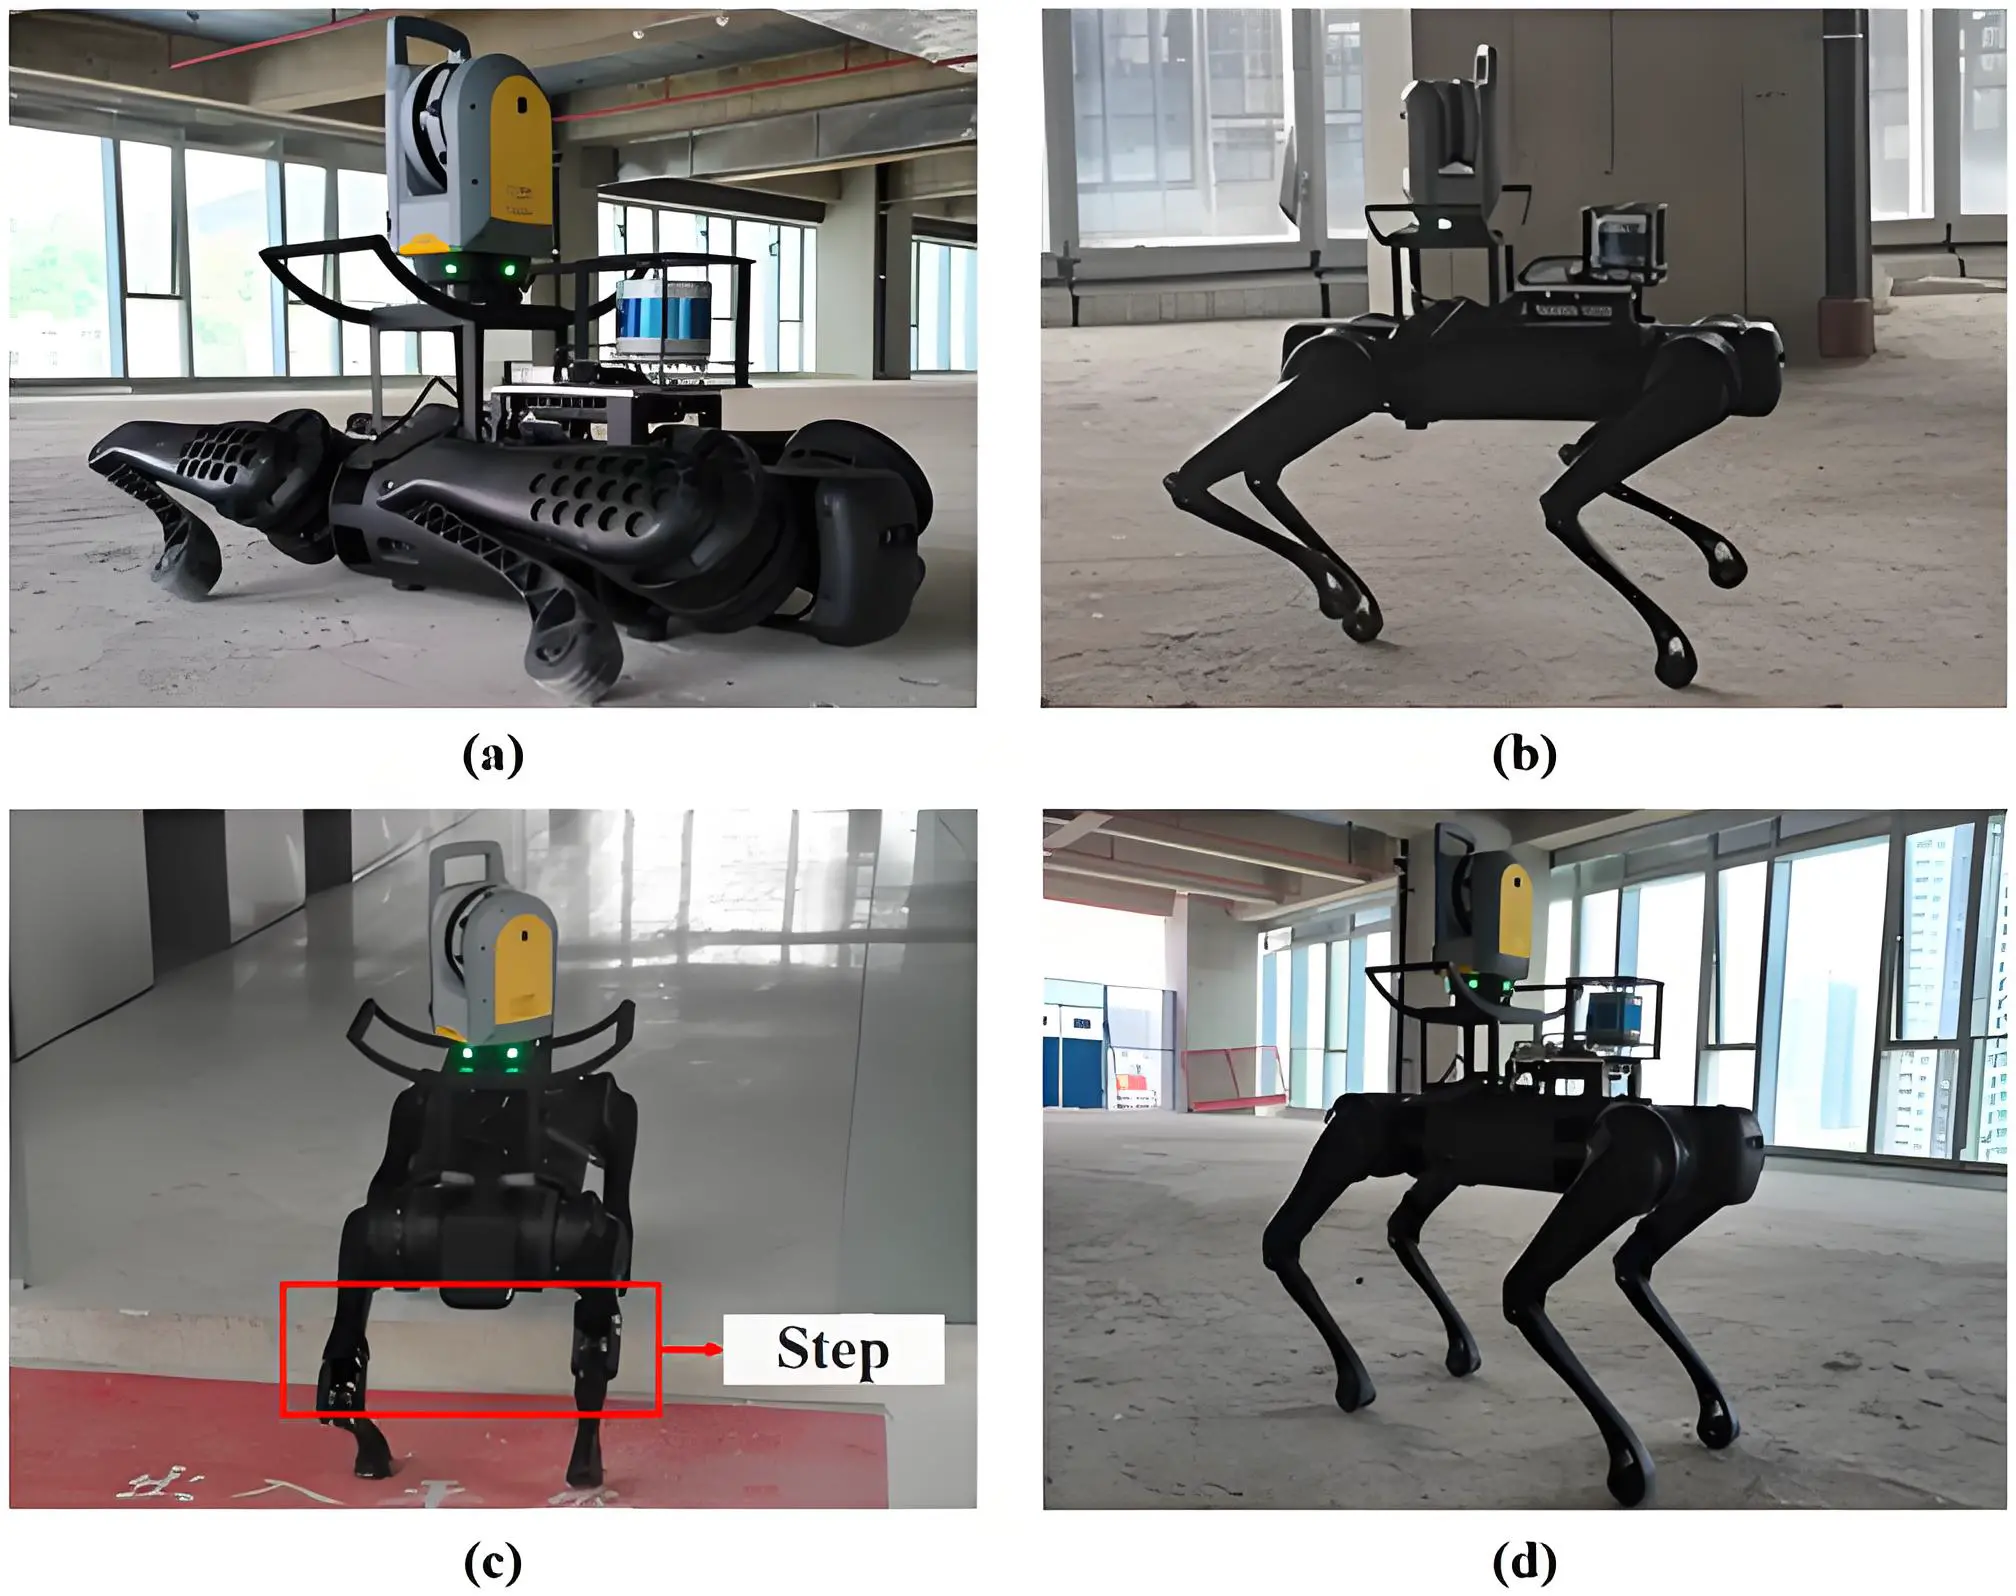
Figure 21. Scanning process. (a) State before scanning; (b) Movement in open area; (c) Obstacle crossing; (d) Scanning.
Although the main experiments were carried out in relatively static environments, the system also showed resilience to minor dynamic disturbances. Occasional short-term occlusions caused by moving people did not significantly affect the scanning results, since the fixed scanning duration and overlapping coverage allowed these regions to be recovered during registration. In scenarios with more frequent human movement, scanning tasks can be coordinated with site management to minimize disruptions. These observations indicate that, while dynamic obstacle handling was not the primary focus of this study, the proposed workflow can maintain stable performance under typical indoor conditions.
4.5 Case analysis
To verify the practicability and efficiency of the proposed approach, a skilled and experienced surveyor was invited to use the same equipment to scan the test site manually for comparison, as shown in Figure 23. The comparison results are divided into three regions.
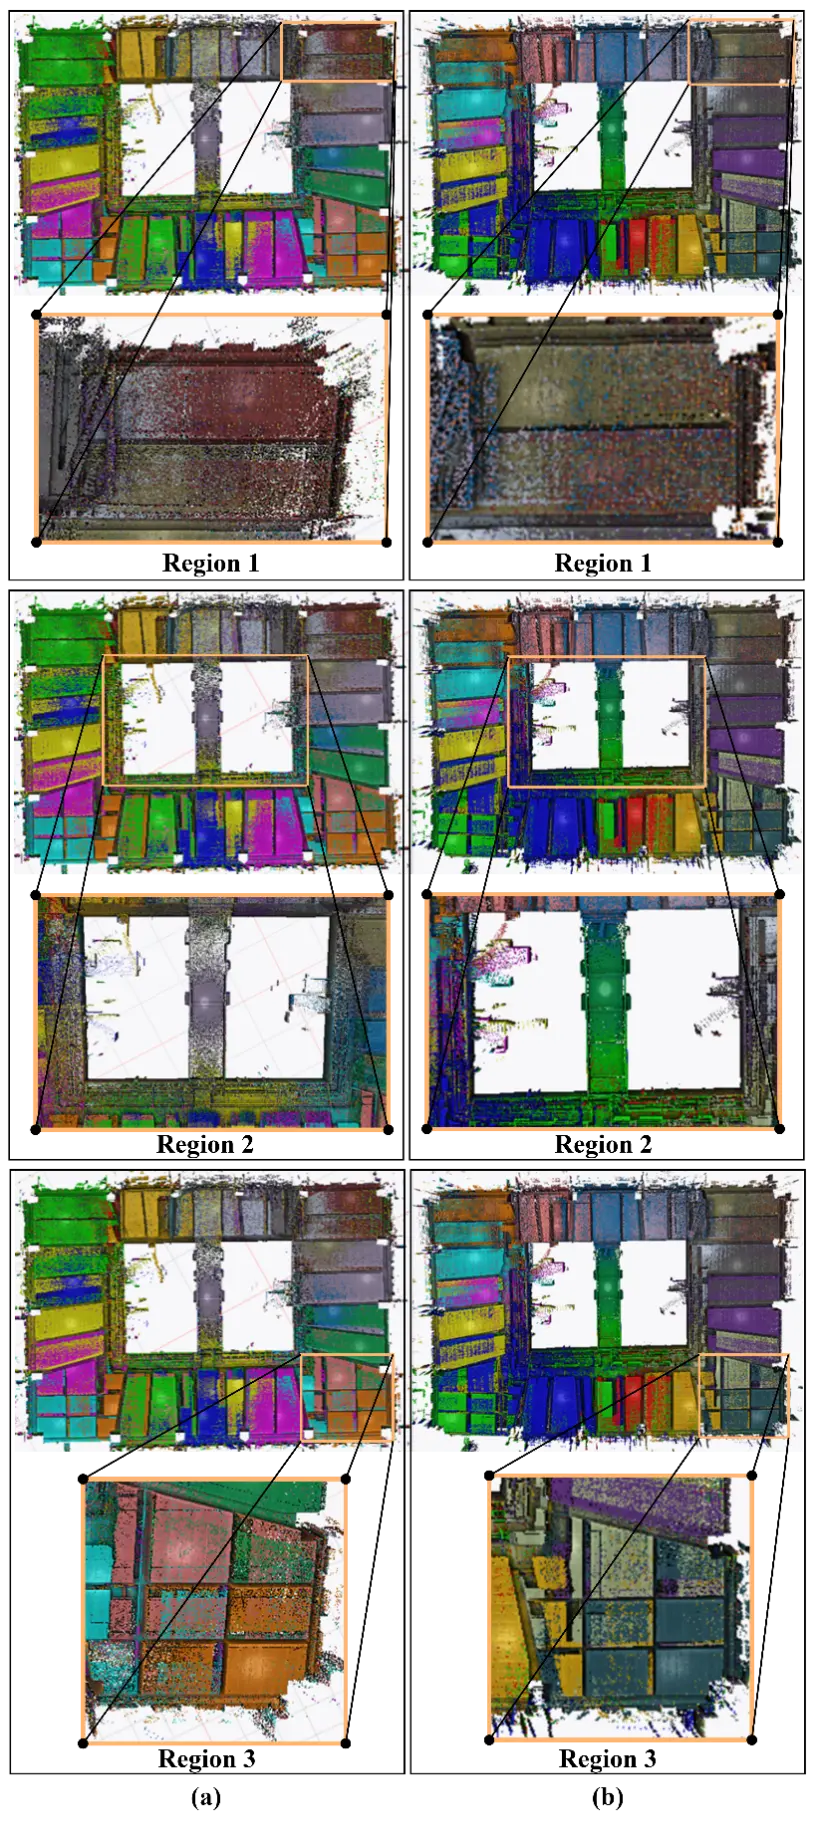
Figure 23. Comparison of scanning results. (a) Scanned model using the manual method; (b) Scanned model using the proposed approach.
Table 5 compares the test site scanning process of the proposed approach with the manual methods. The existing data collection method requires 29 scan stations, with a single scan station adjustment time of 20 s, a total acquisition time of 100 minutes, and a travel distance of 315 m. In contrast, the proposed approach requires only 21 scan stations, with an adjustment time of 3 s per scan station, a total acquisition time of 58 minutes, and a travel distance of 177 m. Compared with the existing data collection methods, the proposed approach reduces the number of scan stations by 27%, the adjustment time per scan station by 85%, the acquisition time by 42%, and the travel distance by 43%.
Table 5. Comparison with manual scanning methods.
| Scanning Method | Scan Stations | Scanning Time per Scan Station (min) | Adjustment Time per Acan Station (s) | Total Time (min) | Movement Distance (m) |
| Manual Method | 29 | 2 | 20 | 100 | 315 |
| Proposed Approach | 21 | 2 | 3 | 58 | 177 |
Comparing the quality of the point cloud models from both methods reveals that the existing scanning method results in lower point cloud density in beam gathering areas and connecting spaces, leading to incomplete indoor information collection. This is because it is challenging for the surveyor to consider multiple factors affecting data collection in large and complex indoor spaces. To further substantiate this observation, portions of the three regions were randomly extracted from the point clouds of both methods, and the number of points was compared. As shown in Table 6, the proposed approach consistently collected a higher number of points, with increases of 22.9%, 20.7%, and 1.4% across the three regions. This improvement is mainly because the proposed method considers the scanning process more systematically, ensuring sufficient coverage and overlap, whereas the manual method relies largely on the surveyor’s experience. These results demonstrate that the proposed approach can more comprehensively and accurately collect geometric inspection data, better reflecting the real-world conditions of indoor spaces.
Table 6. Comparison of point counts from sampled portions of three regions.
| Sampled Region | Manual Method (points) | Proposed Approach (points) | Increase (%) |
| Region 1 | 1,606,811 | 1,974,347 | 22.9 |
| Region 2 | 934,146 | 1,127,568 | 20.7 |
| Region 3 | 956,875 | 970,644 | 1.4 |
Taken together, the results in Table 5 and Table 6 show that the proposed workflow links BIM-based pre-scan planning with robotic execution, delivering measurable gains in both efficiency and data completeness. Although previous studies have also achieved BIM-based robotic integration for automated inspection, they generally overlooked the continuity of scanning across connected areas and lacked adaptive execution control for complex environments. In contrast, this study incorporates connected areas into scan planning and execution to preserve geometric continuity across rooms and adjusts the robot’s motion parameters to ensure stable traversal in narrow passages or over steps. These enhancements enable the proposed framework to maintain continuous, efficient, and accurate data collection across multi-space indoor environments, demonstrating improved adaptability to real-world inspection tasks.
4.6 Discussions
This study improves indoor geometric quality inspection by integrating BIM-based scan planning, heuristic optimization, and robotic execution into a unified workflow. Scan planning is automated through BIM and heuristic algorithms, replacing manual, experience-driven layout decisions. BIM-informed localization and navigation further enhance the stability of robot movement during execution, while the use of a quadruped platform ensures reliable data collection in large, multi-space indoor environments.
When contextualized within existing BIM-robot integration studies for indoor scanning, the proposed framework addresses three key limitations that have hindered prior work. First, studies like Park et al.[18] and Zhai et al.[17] treat doorways as mere transit passages without dedicated design for data continuity. Second, in the approach proposed by Chung et al.[16], the robot dog relies on fixed motion parameters when performing navigation and scanning tasks, adopting a constant speed. It does not consider the impact of environmental differences on speed, nor does it dynamically adjust this parameter, which remains consistent throughout the entire task execution process. Third, Park et al.[18] uses fragmented triangular meshes for collision detection, which require double-loop traversal to verify obstacle intersections—this increases pre-processing time for scan schemes, especially in large indoor spaces, limiting the method’s scalability.
The proposed approach delivers practical value to multiple key stakeholders in the architecture, engineering and construction (AEC) industry, with targeted benefits for each group. Construction quality inspectors benefit from reduced dependence on manual labor and more comprehensive inspection coverage, as the automated workflow minimizes repetitive tasks and subjective judgments inherent in traditional scanning. BIM managers and facility operators gain support for accurate as-built BIM updating through high-quality, continuous point cloud data, which is critical for effective facility maintenance and renovation planning. AEC robotics developers obtain a modular, reusable framework that can be extended to other indoor inspection tasks, reducing the development effort needed for new automated solutions. Construction project managers benefit from streamlined inspection cycles and reliable data, which help accelerate project acceptance and reduce rework risks. This multi-stakeholder value aligns with the industry’s demand for efficient, intelligent quality management solutions.
Overall, the results show that the BIM-guided robotic workflow can significantly enhance scanning efficiency and maintain geometric continuity across multiple spaces, without compromising data quality. This aligns with the broader development trend of BIM-robot integration for construction inspection and demonstrates the practical value of improving both efficiency and continuity in complex indoor environments.
5. Conclusions
This paper presents a data acquisition framework for indoor geometric quality inspection through the combination of LiDAR, a quadruped robot and BIM. The framework aims to improve the efficiency and accuracy of data acquisition. First, BIM information is extracted to generate target inspection surfaces, which are transformed into a point cloud model, and then a navigation map is constructed from the point cloud, laying the foundation for indoor localization and navigation of the robot. Secondly, candidate scan stations are generated by spatial division, combining target inspection surfaces and the point cloud, using ray tracing algorithm to calculate visibility and GA to determine the scan stations. Then, the final scan stations combination is ranked by optimizing the TSP based on the distance of 0-1 graph. Finally, the quadruped robot, integrating the scan scheme and autonomous navigation, is able to automatically perform the data collection task for indoor geometric quality inspection, which significantly improves the efficiency and accuracy.
In addition, the BIM and quadruped robot group significantly reduced scanning time by 42% compared to the manual-based group, which indicated that the manual scanning method was very time consuming. The use of BIM to plan the scanning solution reduced the subjective impact of manual labor, which significantly improved the quality of the scanned data. The quadruped robot-based scanning method automated data collection and made the process much easier.
Compared with previous BIM-robot integration studies[17,18], the framework resolves three core limitations: it solves cross-space data discontinuity doorway scan stations, a problem caused by treating doorways as simple passages in[17,18]; it eliminates collision risks from fixed motion parameters through environment-adaptive control, a shortcoming of[16]; and it reduces computational complexity by using BIM-derived target inspection surfaces, which avoids the complexity from mesh-based collision detection in[18]. These improvements highlight its innovative advantages over prior works. However, it still has limitations: unlike Zhai et al.[17], it fails to integrate IndoorGML and lacks fine-grained spatial topology description; compared with Park et al.[18], its target inspection surface-based approach is difficult to apply to irregular components such as curved columns; and, versus Chung et al.[16], it targets indoor spaces and lacks adaptability to outdoor challenges.
From an industry perspective, this study also illustrates the practical impact of automated inspection. With the growing demand for industrialized construction and the challenges posed by workforce aging, the ability to conduct comprehensive, systematic, and less labor-intensive inspection aligns closely with the quality management requirements of modern construction practice. Thus, the proposed approach not only advances technical performance but also addresses pressing industrial needs.
However, there are some limitations that require further addressing in the future: the proposed method currently focuses on static indoor environments and does not fully consider the impact of dynamic obstacles such as temporary construction materials or personnel movement, which may affect scanning continuity in high-traffic scenarios. Additionally, scan scheme planning does not integrate the quadruped robot’s energy consumption model, potentially limiting task completeness in extra-large indoor spaces requiring long-duration data collection. Finally, the framework has not yet involved multi-robot cooperative operation, which would require addressing challenges such as task assignment, inter-robot communication, and collaborative data fusion in future work.
Authors contribution
Tan Y: Supervision, resources, project administration, funding acquisition conceptualization.
Wen Z: Writing-review & editing, writing-original draft, visualization, validation, methodology, investigation.
Chen Y: Writing-original draft, visualization, validation, software, methodology, investigation, formal analysis, data curation, conceptualization.
Deng T, Yue H: Resources, investigation, formal analysis, conceptualization.
Hao D: Investigation, validation.
Wang Q: Validation, writing-review & editing, funding acquisition.
Conflicts of interest
Yi Tan is a Youth Editorial Board Member of Journal of Building Design and Environment. The other authors declare no conflicts of interest.
Ethical approval
Not applicable.
Consent to participate
Not applicable.
Consent for publication
Not applicable.
Availability of data and materials
Some or all data, models, or code that support the findings of this study are available from the corresponding author upon reasonable request.
Funding
This research is supported by the National Natural Science Foundation of China [Grant No. 52308319].
Copyright
© The Author(s) 2025.
References
-
1. Tan Y, Liu X, Jin S, Wang Q, Wang D, Xie X. A terrestrial laser scanning-based method for indoor geometric quality measurement. Remote Sens. 2024;16(1):59.[DOI]
-
2. Screeds, bases and in situ floorings [Internet]. London (UK): BSI; 2009. Available from: https://knowledge.bsigroup.com/search
-
3. Execution of concrete structures [Internet]. London (UK): BSI; 2009. Available from: https://knowledge.bsigroup.com/products
-
4. Bond G, editor. National structural concrete specification for building construction [Internet]. Camberley: The Concrete Centre; 2010. Available from: https://www.engineeringsurveyor.com/software/NSCS-Edition-4.pdf
-
5. Cheok GS, Stone WC, Lipman RR, Witzgall C. Ladars for construction assessment and update. Autom Constr. 2000;9(5-6):463-477.[DOI]
-
6. Akinci B, Boukamp F, Gordon C, Huber D, Lyons C, Park K. A formalism for utilization of sensor systems and integrated project models for active construction quality control. Autom constr. 2006;15(2):124-138.[DOI]
-
7. Bosche F, Haas CT, Akinci B. Automated recognition of 3D CAD objects in site laser scans for project 3D status visualization and performance control. J Comput Civ Eng. 2009;23(6):311-318.[DOI]
-
8. Cao Y, Liu J, Feng S, Li D, Zhang S, Qi H, et al. Towards automatic flatness quality assessment for building indoor acceptance via terrestrial laser scanning. Measurement. 2022;203:111862.[DOI]
-
9. Jia F, Lichti DD. A model-based design system for terrestrial laser scanning networks in complex sites. Remote Sens. 2019;11(15):1749.[DOI]
-
10. Werbrouck J, Pauwels P, Bonduel M, Beetz J, Bekers W. Scan-to-graph: Semantic enrichment of existing building geometry. Autom Constr. 2020;119:103286.[DOI]
-
11. Oytun M, Atasoy G. Effect of terrestrial laser scanning (TLS) parameters on the accuracy of crack measurement in building materials. Autom Constr. 2022;144:104590.[DOI]
-
12. Song C, Chen Z, Wang K, Luo H, Cheng JC. BIM-supported scan and flight planning for fully autonomous LiDAR-carrying UAVs. Autom Constr. 2022;142:104533.[DOI]
-
13. Eoh G, Choi JS, Lee BH. Faulty robot rescue by multi-robot cooperation. Robotica. 2013;31(8):1239-1249.[DOI]
-
14. Law M, Ahn HS, Broadbent E, Peri K, Kerse N, Topou E, et al. Case studies on the usability, acceptability and functionality of autonomous mobile delivery robots in real-world healthcare settings. Intell Serv Robot. 2021;14(3):387-398.[DOI]
-
15. Jung W, Lee G. Slim BIM charts for rapidly visualizing and quantifying levels of BIM adoption and implementation. J Comput Civ Eng. 2016;30(4):04015072.[DOI]
-
16. Chung D, Kim J, Paik S, Im S, Kim H. Automated system of scaffold point cloud data acquisition using a robot dog. Autom Constr. 2025;170:105944.[DOI]
-
17. Zhai R, Zou J, Gan VJ, Han X, Wang Y, Zhao Y. Semantic enrichment of BIM with IndoorGML for quadruped robot navigation and automated 3D scanning. Autom Constr. 2024;166:105605.[DOI]
-
18. Park S, Yoon S, Ju S, Heo J. BIM-based scan planning for scanning with a quadruped walking robot. Autom Constr. 2023;152:104911.[DOI]
-
19. Zhu Z, Chen T, Rowlinson S, Rusch R, Ruan X. A quantitative investigation of the effect of scan planning and multi-technology fusion for point cloud data collection on registration and data quality: A case study of bond university’s sustainable building. Buildings. 2023;13(6):1473.[DOI]
-
20. Aryan A, Bosché F, Tang P. Planning for terrestrial laser scanning in construction: A review. Autom Constr. 2021;125:103551.[DOI]
-
21. Wang J, You H, Qi X, Yang N. BIM-based structural health monitoring and early warning for heritage timber structures. Autom Constr. 2022;144:104618.[DOI]
-
22. Phan NDM, Quinsat Y, Lartigue C. Optimal scanning strategy for on-machine inspection with laser-plane sensor. Int J Adv Manuf Technol. 2019;103(9):4563-4576.[DOI]
-
23. Son RH, Han K. Automated model-based 3D scan planning for prefabricated building components. J Comput Civ Eng. 2023;37(2):04022058.[DOI]
-
24. Wang Q, Li J, Tang X, Zhang X. How data quality affects model quality in scan-to-BIM: A case study of MEP scenes. Autom Constr. 2022;144:104598.[DOI]
-
25. Chen M, Koc E, Shi Z, Soibelman L. Proactive 2D model-based scan planning for existing buildings. Autom Constr. 2018;93:165-177.[DOI]
-
26. Zeng Y, Liu J, Cao Q, Wu Z, Chen B, Li D, et al. Optimal planning of indoor laser scans based on continuous optimization. Autom Constr. 2022;143:104552.[DOI]
-
27. Li D, Liu J, Zeng Y, Cheng G, Dong B, Chen YF. 3D model-based scan planning for space frame structures considering site conditions. Autom Constr. 2022;140:104363.[DOI]
-
28. Noichl F, Lichti DD, Borrmann A. Automating adaptive scan planning for static laser scanning in complex 3D environments. Autom Constr. 2024;165:105511.[DOI]
-
29. Moyano J, León J, Nieto-Julián JE, Bruno S. Semantic interpretation of architectural and archaeological geometries: Point cloud segmentation for HBIM parameterisation. Autom Constr. 2021;130:103856.[DOI]
-
30. Kim Y, Chin S, Choo S. BIM data requirements for 2D deliverables in construction documentation. Autom Constr. 2022;140:104340.[DOI]
-
31. Chen X, Zhu Y, Chen H, Ouyang Y, Luo X, Wu X. BIM-based optimization of camera placement for indoor construction monitoring considering the construction schedule. Autom Constr. 2021;130:103825.[DOI]
-
32. Chen Z, Zhang W, Huang R, Dong Z, Chen C, Jiang L, et al. 3D model-based terrestrial laser scanning (TLS) observation network planning for large-scale building facades. Autom Constr. 2022;144:104594.[DOI]
-
33. Qiu Q, Wang M, Tang X, Wang Q. Scan planning for existing buildings without BIM based on user-defined data quality requirements and genetic algorithm. Autom Constr. 2021;130:103841.[DOI]
-
34. Hu D, Gan VJL. Semantic navigation for automated robotic inspection and indoor environment quality monitoring. Autom Constr. 2025;170:105949.[DOI]
-
35. Xu Y, Wang Y, Yang J, Zhang J. Two-stage terrestrial laser scan planning framework for geometric measurement of civil infrastructures. Measurement. 2025;242:115785.[DOI]
-
36. López A, Ogayar CJ, Jurado JM, Feito FR. Metaheuristics for the optimization of terrestrial LiDAR set-up. Autom Constr. 2023;146:104675.[DOI]
-
37. Lauterbach HA, Borrmann D, Heß R, Eck D, Schilling K, Nüchter A. Evaluation of a backpack-mounted 3D mobile scanning system. Remote Sens. 2015;7(10):13753-13781.[DOI]
-
38. Liang H, Yeoh JKW, Chua DKH. Premapping of dynamic indoor construction sites using prior construction progress video to enhance UGV path planning. J Comput Civ Eng. 2024;38(5):04024025.[DOI]
-
39. Xu L, Feng C, Kamat VR, Menassa CC. A scene-adaptive descriptor for visual SLAM-based locating applications in built environments. Autom Constr. 2020;112:103067.[DOI]
-
40. Zhao X, Cheah CC. BIM-based indoor mobile robot initialization for construction automation using object detection. Autom Constr. 2023;146:104647.[DOI]
-
41. Zou H, Zhou C, Li H, Wang X, Wang Y. Application of 3D point cloud and visual-inertial data fusion in robot dog autonomous navigation. PLoS One. 2025;20(2):e0317371.[DOI]
-
42. Halder S, Afsari K, Chiou E, Patrick R, Hamed KA. Construction inspection & monitoring with quadruped robots in future human-robot teaming: A preliminary study. J Build Eng. 2023;65:105814.[DOI]
-
43. Hu D, Gan VJL, Yin C. Robot-assisted mobile scanning for automated 3D reconstruction and point cloud semantic segmentation of building interiors. Autom Constr. 2023;152:104949.[DOI]
-
44. Gan VJL, Hu D, Wang Y, Zhai R. Automated indoor 3D scene reconstruction with decoupled mapping using quadruped robot and LiDAR sensor. Comput-Aided Civ Infrastruct Eng. 2025;40(15):2209-2226.[DOI]
-
45. Xu L, Feng C, Kamat VR, Menassa CC. An occupancy grid mapping enhanced visual SLAM for real-time locating applications in indoor GPS-denied environments. Autom Constr. 2019;104:230-245.[DOI]
-
46. Yin H, Lin Z, Yeoh JKW. Semantic localization on BIM-generated maps using a 3D LiDAR sensor. Autom Constr. 2023;146:104641.[DOI]
-
47. Chen Z, Song C, Wang B, Tao X, Zhang X, Lin F, et al. Automated reality capture for indoor inspection using BIM and a multi-sensor quadruped robot. Autom Constr. 2025;170:105930.[DOI]
-
48. Lambora A, Gupta K, Chopra K. Genetic algorithm-A literature review. In: 2019 International Conference on Machine Learning, Big Data, Cloud and Parallel Computing (COMITCon); 2019 Feb 14-16; Faridabad, India. Piscataway: IEEE; 2019. p. 380-384.[DOI]
-
49. Chiu WY, Yen GG, Juan TK. Minimum manhattan distance approach to multiple criteria decision making in multiobjective optimization problems. IEEE Trans Evol Comput. 2016;20(6):972-985.[DOI]
-
50. Matai R, Singh SP, Mittal ML. Traveling salesman problem: An overview of applications, formulations, and solution approaches. In: Davendra D, editor. Traveling salesman problem, theory and applications. London: IntechOpen; 2010. p. 1-25.[DOI]
-
51. Zhang Y, Jia T, Chen Y, Tan Z. A 3D point cloud reconstruction method. In: 2019 IEEE 9th Annual International Conference on CYBER Technology in Automation, Control, and Intelligent Systems (CYBER); 2019 Jul 29- Aug 02; Suzhou, China. Piscataway: IEEE; 2019. p. 1310-1315.[DOI]
-
52. Park JI, Park J, Kim KS. Fast and accurate desnowing algorithm for LiDAR point clouds. IEEE Access. 2020;8:160202-160212.[DOI]
-
53. Quigley M, Conley K, Gerkey B, Faust J, Foote T, Leibs J, et al. ROS: An open-source Robot Operating System. In: ICRA Workshop on Open Source Software; 2009. p. 5. Available from: https://www.researchgate.net/publication
-
54. Simon D. Kalman filtering. Embedded Syst Program [Internet]. 2001;14(6):72-79. Available from: https://abel.math.harvard.edu/archive
-
55. Dellaert F, Fox D, Burgard W, Thrun S. Monte Carlo localization for mobile robots. In: Proceedings 1999 IEEE International Conference on Robotics and Automation (Cat. No.99CH36288C); 1999 May 10-15; Detroit, USA. Piscataway: IEEE; 1999. p. 1322-1328.[DOI]
-
56. Sun J, Sun Z, Wei P, Liu B, Wang Y, Zhang T, et al. Path planning algorithm for a wheel-legged robot based on the Theta* and Timed Elastic Band algorithms. Symmetry. 2023;15(5):1091.[DOI]
-
57. Wayahdi MR, Ginting SHN, Syahputra D. Greedy, A-Star, and Dijkstra’s algorithms in finding shortest path. Int J Adv Data Inf Syst. 2021;2(1):45-52.[DOI]
-
58. Tran H, Khoshelham K. Building change detection through comparison of a LiDAR scan with a building information model. Int Arch Photogramm Remote Sens Spatial Inf Sci. 2019;42:889-893.[DOI]
-
59. Bassier M, Vincke S, De Winter H, Vergauwen M. Drift invariant metric quality control of construction sites using BIM and point cloud data. ISPRS Int J Geo-Inf. 2020;9(9):545.[DOI]
-
60. Censor Y. Pareto optimality in multiobjective problems. Appl Math Optim. 1977;4(1):41-59.[DOI]
-
61. McLuckie K, Barber A. Tournament sort. In: McLuckie K, Barber A, editors. Sorting routines for microcomputers. London: Macmillan Education; 1986. p. 68-86.[DOI]
-
62. Rutenbar RA. Simulated annealing algorithms: An overview. IEEE Circuits Devices Mag. 1989;5(1):19-26.[DOI]
Copyright
© The Author(s) 2025. This is an Open Access article licensed under a Creative Commons Attribution 4.0 International License (https://creativecommons.org/licenses/by/4.0/), which permits unrestricted use, sharing, adaptation, distribution and reproduction in any medium or format, for any purpose, even commercially, as long as you give appropriate credit to the original author(s) and the source, provide a link to the Creative Commons license, and indicate if changes were made.
Publisher’s Note
Science Exploration remains a neutral stance on jurisdictional claims in published
maps
and institutional affiliations. The views expressed in this article are solely those
of
the author(s) and do not reflect the opinions of the Editors or the publisher.
Share And Cite


Science Exploration Style
Tan Y, Wen Z, Chen Y, Deng T, Yue H, Hao D, et al. Automated approach for indoor geometric quality inspection data collection based on BIM and quadruped robot equipped with LiDAR. J Build Des Environ. 2025;3:202569. https://doi.org/10.70401/jbde.2025.0019
Tips
Copy completed.
Submit a Manuscript
Author Instructions
Cite this Article
Article Metrics
0
View
0
Download
Cited
Article Updates

Science Exploration Style
Tan Y, Wen Z, Chen Y, Deng T, Yue H, Hao D, et al. Automated approach for indoor geometric quality inspection data collection based on BIM and quadruped robot equipped with LiDAR. J Build Des Environ. 2025;3:202569. https://doi.org/10.70401/jbde.2025.0019
copy
Share Link
copy