3D culture systems as a tool for recapitulating in vivo-like phenotypes in murine and human microglia
Bertrand Agbor Tambe
1,#

,
Marina L. Mayer
2,#
,
Stanislav Kozlov
1,#
,
Andreas Husch
3
,
Frank Bradke
3
,
Kristian Händler
5
,
Marc D. Beyer
4,5
,
Elvira Mass
2
,
Nelli Blank-Stein
2,*
,
Annett Halle
1,6,*
*Correspondence to:
Annett Halle, Microglia and Neuroinflammation, German Center for Neurodegenerative Diseases (DZNE), Bonn, NRW 53127, Germany.
E-mail: annett.halle@dzne.de
Nelli Blank-Stein, Developmental Biology of the Immune System, Life & Medical Sciences (LIMES) Institute, University of Bonn, Bonn, NRW 53115, Germany. E-mail: nelli.blank@uni-bonn.de
Nelli Blank-Stein, Developmental Biology of the Immune System, Life & Medical Sciences (LIMES) Institute, University of Bonn, Bonn, NRW 53115, Germany. E-mail: nelli.blank@uni-bonn.de
Myeloid Cells. 2026;1:202602. 10.70401/mc.2026.0006
Received: March 14, 2026Accepted: June 25, 2026Published: June 25, 2026
Abstract
Aims: Conventional two-dimensional (2D) culture systems fail to recapitulate the structural and functional complexity of the brain parenchyma, driving microglia toward an activated, non-homeostatic state. Here, we therefore developed a simple, robust, and scalable three-dimensional (3D) culture system using a Matrigel-collagen composite matrix to promote a more in vivo-like microglial phenotype.
Methods: Primary mouse microglia and human induced pluripotent stem cell-derived microglia (iMGLs) from multiple donor lines were cultured either in conventional 2D conditions or embedded in a Matrigel-collagen 3D matrix. Phenotypes were characterized using confocal microscopy and morphometric analysis, live-cell imaging, transcriptomic profiling, electrophysiology, cytokine secretion assays upon inflammatory stimulation, and flow cytometry.
Results: In 3D culture, mouse microglia developed a markedly more ramified and structurally complex morphology, supported by filamentous actin-rich terminal processes. Live-cell imaging demonstrated enhanced dynamics of cell processes and a more sessile cell body, consistent with physiological microglia surveillance behavior. Transcriptomic profiling further revealed that microglia cultured in 3D downregulated genes associated with activation and proliferation while upregulating homeostatic markers, yet retained a robust cytokine response to inflammatory stimulation. Electrophysiological profiling similarly indicated a shift toward a more resting, in vivo-like state. Human iMGLs showed comparable morphological adaptations in 3D, with protein expression and functional readouts reflecting both shared homeostatic features and cell line- and context-dependent characteristics.
Conclusion: Together, our results demonstrate that a simple and accessible 3D culture system shapes microglial morphology, behavior, and molecular identity, establishing a versatile platform for investigating microglial physiology in a controlled yet physiologically more relevant environment.
Keywords
Microglia, 3D culture, microglial morphology, induced pluripotent stem cell-derived microglia
1. Introduction
Microglia, the resident macrophages of the central nervous system (CNS), are the brain’s primary innate immune cells and play crucial roles in maintaining homeostasis as well as responding to perturbations[1]. Originating from the yolk sac during early embryogenesis, they are ontogenetically distinct from neural cell types[2-5]. Microglial phenotypes are highly dynamic and influenced by regional cues, developmental stage, physiological context, and species-specific differences[6,7]. Microglial morphology is highly dynamic and has long been used as a proxy for functional state[8]. However, morphological changes mainly indicate that microglia have sensed a disturbance in homeostasis, without directly revealing their functional activity[9,10]. Despite substantial progress, the field continues to explore how microglial morphology, gene expression, and function relate to one another in health and disease[11]. In vitro culture systems offer a valuable platform to study these relationships under defined conditions. Traditionally, primary microglia are cultured on rigid two-dimensional (2D) substrates. However, such conditions often shift microglia into a state of heightened responsiveness that poorly reflects their homeostatic baseline in vivo[12,13]. Efforts to overcome these limitations have included optimizing media formulations or co-culture with neural cells, as well as developing more complex models such as brain organoids[14-16] or human-mouse chimeras[17-20]. While these models have provided important insights, they are either limited in scalability or involve complex cellular interactions that make it difficult to dissect microglia-intrinsic features. This has led to increasing interest in well-controlled, yet physiologically relevant, experimental systems that better preserve key aspects of microglial identity. Similar observations have been reported for other neural cell types, where neurons cultured in 3D matrices develop a more physiological phenotype than those grown on conventional 2D substrates[21].
Human induced pluripotent stem cell (iPSC)-derived microglial-like cells (iMGLs) offer an attractive alternative, as they allow patient-specific modeling and can, in principle, be produced in large numbers. However, differentiation outcomes vary substantially between lines and are influenced by donor origin[22-25], sex[26], and even the somatic cell type of origin[27]. These variables contribute to heterogeneous phenotypes and complicate the comparison of iMGL studies across laboratories. Thus, there is a pressing need for standardized culture systems that mitigate donor-specific variability while supporting the structural and functional maturation of iMGLs.
Here, we establish a simplified three-dimensional (3D) culture system that promotes a more in vivo-like microglial morphology, cell motility, actin organization, and functional properties. We optimized conditions for primary mouse microglia and extended this approach to iMGLs, where the 3D environment consistently improved morphological complexity, motility, and responsiveness to inflammatory cues across different donor lines, albeit line-specific responses could be observed. This model provides a robust platform to study microglial biology, bridging the gap between highly artificial 2D cultures and complex multicellular systems, and opens opportunities for drug screening and patient-specific disease modeling.
2. Materials and Methods
2.1 Murine cell culture and experimental procedures
2.1.1 Mouse models
Primary mouse microglia were isolated from the following strains: C57BL/6J mice for transcriptional, electrophysiological, and cytokine response analyses; Cx3cr1gfp/+ mice for morphological and motility analyses; and Lifeactgfp/+ mice for visualization of F-actin. Cx3cr1gfp/+ and Lifeactgfp/+ mice were generated by crossing Cx3cr1gfp/gfp mice[28], obtained from The Jackson Laboratory, or Lifeactgfp/gfp mice[29], with permission from Roland Wedlich-Söldner, with wild-type C57BL/6J mice (Charles River). Mice were housed in individually ventilated cages under specific pathogen-free conditions on a 12 h light/dark cycle. Mouse breeding was carried out in accordance with European Union guidelines and approved by the Veterinary Office of the City of Bonn, Germany (56-2 and 67-5-2022/23).
2.1.2 Preparation of mixed glial cultures and isolation of primary microglia
Mixed glial cultures were prepared from postnatal day 1–3 C57BL/6J mouse pups as previously described[30]. Briefly, meninges were carefully removed from the brains under a dissection microscope. The brains were then incubated in a solution of 0.5% trypsin (#15090046, Life Technologies) in phosphate-buffered saline (PBS) (#14190094, Life Technologies) at 37 °C for 10 min for enzymatic digestion. The reaction was stopped by adding 3 ml of prewarmed Dulbecco’s modified Eagle medium (DMEM) cell culture medium (#31966021, Life Technologies), followed by centrifugation at 300 g for 10 min. The tissue pellet was resuspended in 1 ml pre-warmed DMEM, then mechanically dissociated using a pipette. The resulting cell suspension was filtered through a 70 µm cell strainer (#431751, Corning). Cells from 1.5 brains were seeded into one 0.01% poly-L-lysin-coated (#P1399, Sigma) T-75 flask and cultured in DMEM supplemented with 10% fetal bovine serum (#F7524, Sigma Aldrich) at 37 °C in a humidified incubator with 10% CO2. After 24 h, cell culture medium was replaced. At 7 days in vitro (DIV), a mixed glial population was established, with astrocytes forming a confluent monolayer and microglia residing on top. The supernatant was collected, filtered through a 0.22 µm membrane filter (#SCGP00525, Merck Millipore), and stored at 4 °C as astrocyte-conditioned medium (ACM) until further use. At 10 DIV, the culture medium of the mixed glial cell culture was replaced with 20% L929-conditioned medium in DMEM cell culture medium, and cells were incubated for an additional three days. At 13 DIV, primary microglia were isolated by mechanical dissociation. The cell culture flasks were tapped firmly on the bench to detach the microglial cells. Supernatants containing floating microglia were collected, passed through a 70 µm strainer, and centrifuged at 300 g for 10 min. The resulting cell pellets were resuspended in prewarmed L929-conditioned medium. 1.5 × 10⁶ cells were seeded in a 60 mm Nunc UpCellTM dish coated with thermo-responsive poly (N-isopropylacrylamide) (#10592954, Thermo Fisher Scientific) in 5 ml L929-conditioned medium and incubated overnight at 37 °C. At 37 °C, cells adhere to the hydrophobic surface of these dishes; a temperature change to room temperature (~22 °C) induces a hydrophilic switch, enabling enzyme-free detachment and enrichment of primary microglia[31,32]. At 14 DIV, medium was replaced with 2 ml prewarmed cell culture medium, and dishes were exposed to room temperature for 30 min to detach microglia for downstream applications.
2.1.3 Murine microglia 2D and 3D culture systems
Both 2D and matrix-based 3D microglia culture systems were kept at 37 °C and 10% CO2 in ACM. ACM was obtained from filtered supernatants of mixed glial cultures at 7 DIV as described above. All downstream analyses were performed after microglia were cultured under 2D or 3D conditions for 24 h. For 2D cultures, cells were seeded into µ-Slide 8-Well chamber slides (#80827, Ibidi) at 7.5 × 10⁴ cells/well in 400 µl ACM for imaging experiments. For RNA sequencing and cytokine assays, 3.75 × 10⁵ cells in 1 ml ACM were seeded into 24-well plates.
For 3D cultures, cells were embedded at a density of 5,000 cells per µl of the specified 3D matrix. For imaging and morphological analysis, 7.5 × 10⁴ cells were plated in the respective 15 µl cell-matrix mixture into µ-Slide 8-Well chamber slides. All matrices were allowed to polymerize at 37 °C for 45 min, and were then overlaid with 400 µl ACM for 24 h of culturing.
To obtain hyaluronan-based 3D cultures, 3.75 × 10⁵ microglial cells were pelleted and resuspended in 5 µl ACM. 25 µl lysine-functionalized (HA-TG/lys) and 25 µl glutamine-functionalized (HA-TG/gln) hyaluronan components[33] were mixed with the cell suspension. Gel crosslinking was initiated by adding 20 µl pre-warmed FXIIIa enzyme (Fibrogammin 250, CSL Behring) before 15 µl of this cell-matrix mixture was plated. For 3D microglia cultures in star-shaped poly(ethylene glycol)–heparin (StarPEG–heparin) hydrogels, 3.75 × 10⁵ microglial cells in 5 µl ACM were mixed with 25 µl heparin-maleimide solution, and 45 µl StarPEG-precursor solution before 15 µl of this cell-matrix mixture was plated. To obtain 3D microglia cultures in Matrigel, 3.75 × 10⁵ cells were resuspended in 15 µl ACM and mixed with 60 µl cold, growth factor-reduced, phenol red-free Matrigel (#356231, Corning) before 15 µl of this cell-matrix mixture was plated. For 3D collagen cultures, 45 µl rat-tail collagen type I (#08-115, Merck) was neutralized with 9 µl 10× MEM (#21430020, Life Technologies) and 3 µl 5% NaHCO3 (#1063290500, Merck Millipore). 50 µl neutralized collagen was then mixed with 3.75 × 10⁵ cells in 25 µl ACM before 15 µl of this cell-matrix mixture was plated. For microglial 3D cultures in Matrigel-collagen, 3.75 × 10⁵ cells in 5 µl ACM were mixed with 10 µl neutralized collagen and 60 µl Matrigel before plating 15 µl of this mixture. For RNA sequencing and cytokine assays, 75 µl of this mixture was carefully pipetted onto parafilm, allowed to polymerize at 37 °C for 45 min, and transferred into a 24-well plate containing 1 ml ACM per well. Cells were then incubated at 37 °C for 24 h before analysis.
2.2 Microscopy and image-based quantification
To analyze microglial morphology and motility in 2D and 3D cultures, confocal and spinning disk microscopy were employed. Confocal image acquisition was performed on a Zeiss LSM700 laser scanning microscope equipped with a 488 nm laser. Z-stacks were acquired using a 40x/1.4 NA oil immersion objective with a step size of 0.43 µm and an image resolution of 512 × 512 pixels. For each condition, at least 15 regions of interest were acquired per independent experiment under consistent imaging conditions. Time-lapse imaging of microglial motility in 2D and 3D cultures was performed using a custom-built Andor spinning disk confocal microscope based on an inverted motorized Nikon system. The setup included a Yokogawa spinning disk unit, dual EM-CCD and sCMOS cameras, and lasers at 405, 445, 515, 561, and 640 nm. Microglia expressing eGFP were imaged with a 60x water immersion objective in 30 s intervals for a 10-min period. Z-slices were acquired at 0.2 µm intervals across a total depth of 38.28 µm. Fluorescence excitation was performed using a 488 nm laser at 1% intensity with an exposure time of 250 ms and a gain of 300. To visualize the structure of the collagen-Matrigel matrix, confocal reflection microscopy was performed using a Zeiss LSM780 NLO system. Samples were illuminated with a 633 nm laser, and backscattered light was detected using a red reflection filter and photomultiplier tube. Z-stacks were acquired using a 60x water immersion objective at 37 °C with 0.22 µm intervals over 10 min. To monitor long-term movement of microglia, live cell images of eGFP-expressing microglia were obtained with an LSM780 NLO microscope at 37 °C and 5% CO2 using the 488 nm laser. Time-lapse confocal image stacks were acquired using a 40x water immersion objective at 15-min intervals and 1 µm z-slice increments over a period of 24 h.
2.2.1 Image processing, morphological, and cell movement analysis
Microglial morphology was analyzed using MotiQ, an ImageJ-based cell morphology analysis tool[34]. Following image acquisition, Z-stacks of individual cells were cropped using MotiQ Cropper. Segmentation was performed with MotiQ Thresholder using the ‘Otsu’ method[35]. Morphological parameters were extracted with MotiQ 3D Analyzer, including ramification index, spanned volume, number of cell branches, and dendritic tree length. The ramification index, which is unit-free, was calculated as the ratio between the surface area of the cell and the surface area of a sphere with the same volume, serving as a measure of the complexity of the cellular shape. MotiQ also provides visual output images, such as 3D reconstructions for ramification and volume, as well as skeleton-based views illustrating branching architecture and motility-related changes. Microglial migration was quantified from 0-24 h time-lapse recordings, with images taken every 15 min. Representative cells were tracked across all frames using the MTrackJ plugin in ImageJ, and the parameter Motility (µm/s) was exported.
2.3 Electrophysiological analysis
Whole-cell patch-clamp recordings were performed at 31-32 °C controlled by Temperature Controller VII (Luigs-Neumann) in flowing Ringer solution containing (mM) 125 NaCl, 3 KCl, 1 MgCl, 1.5 CaCl2, 10 Hepes, 10 D-glucose (adjusted to pH 7.3 with NaOH) to assess membrane currents of microglia cultured in 2D and 3D. Microglia were transferred to a recording chamber and continuously superfused with Ringer solution at 1-2 ml/min. Recordings were conducted on an upright microscope (LNscope, Luigs-Neumann) equipped with a 60x water immersion objective (Olympus) and a CCD camera for cell visualization. Patch pipettes (3-5 MΩ, borosilicate glass) were filled with intracellular solution containing (mM) 135 K-gluconate, 10 KCl, 10 Hepes, 0.1 EGTA, 2 MgCl2, 3 K-ATP, 0.3 Na-GTP (adjusted to pH 7.2 with KOH). Currents were amplified and recorded using a Multiclamp 700B, AxonDigidata 1550B (AxonInstruments) and pClamp software (AxonInstruments). Membrane capacitance was determined using the membrane test function implemented in pClamp software immediately after establishing the whole-cell configuration. Input resistance was estimated from the steady-state current response to a small hyperpolarizing voltage step using the Resistance Analysis function in Clampfit. Because all recordings were performed exclusively in voltage-clamp mode, resting membrane potential was not assessed in the present study. For 3D cultures, Dispase (#354235, Corning) was applied through an application pipette (1-3 MΩ) to locally digest and loosen the surrounding matrix of the target cell. To characterize voltage-dependent currents, 10 mV steps from +50 mV to -160 mV (from a holding potential of -70 mV) were applied for 50 ms. Current amplitudes were measured 5-7 ms after step onset, normalized to cell capacitance, and expressed as current density (pA/pF). The whole-cell patch-clamp method was applied as originally described by Hamill et al. (1981)[36].
2.4 RNA isolation, cDNA synthesis, qPCR, and RNA sequencing
Total RNA was isolated from 2D or 3D-cultured microglial cells using the miRNeasy Mini Kit (#217004, Qiagen) according to the manufacturer’s instructions. For 2D cultures, cells were rinsed three times with PBS and lysed directly in 1 ml QIAzol lysis reagent (#79306, Qiagen). For 3D cultures, gels were washed in PBS, incubated in QIAzol, and homogenized before proceeding. The homogenate from 2D or 3D-cultured cells was mixed with 200 µl chloroform (#C2432, Sigma-Aldrich), shaken vigorously, incubated at room temperature for 3 min, and centrifuged at 12,000 g at 4 °C for 15 min. The aqueous phase was transferred into a fresh tube, mixed with 750 µl of 100% ethanol, and passed through RNeasy Mini spin columns to bind RNA. Following the recommended wash steps with RWT and RPE buffers, RNA was eluted with 35 µl of RNase-free water and stored at -80 °C until use.
For cDNA synthesis, total RNA concentrations were measured using a NanoDrop spectrophotometer (Thermo Fisher Scientific), and 500 ng of total RNA was reverse transcribed using the High-Capacity cDNA Reverse Transcription Kit (#4368814, Thermo Fisher Scientific). A master mix containing RT buffer, dNTPs, random primers, reverse transcriptase, RNase inhibitor, and nuclease-free water was prepared according to the manufacturer’s protocol. Samples were incubated at 25 °C for 10 min, followed by incubation at 37 °C for 120 min and enzyme inactivation for 5 min at 85 °C.
Quantitative real-time polymerase chain reaction (PCR) was performed using the TaqMan Gene Expression Assays (#4369016, Thermo Fisher Scientific) on a StepOnePlus Real-Time PCR System (Thermo Fisher Scientific). Each reaction was run in technical triplicates with a total volume of 10 µl, including cDNA template, assay mix, and master mix. Rpl27 was used as a housekeeping gene as its expression remained stable across conditions. The relative gene expression was calculated using the ΔΔCt method. A list of TaqMan probes used in the study is provided in Table S1.
RNA-seq was performed using the Smart-seq2 protocol as established by Picelli et al.[37]. For library preparation, RNA (5 ng) was mixed with lysis buffer and denatured at 95 °C for 2 min, followed by reverse transcription at 42 °C for 90 min using Superscript II reverse transcriptase (#18064071, Thermo Fisher Scientific) and template-switching oligos.
Pre-amplification was performed for 26 PCR cycles with KAPA HiFi polymerase (#07958927001, Roche), and products were cleaned with AMPure XP beads (#A63881, Beckman Coulter). cDNA integrity and fragment size were assessed using a high-sensitivity D5000 ScreenTape (#5067-5592, Agilent) on an Agilent 4200 TapeStation (Agilent Technologies). For library construction, the Nextera XT DNA Library Preparation Kit (#FC-131-1096, Illumina) was used. Tagmentation of 100 pg pre-amplified cDNA was performed at 55 °C for 8 min, followed by neutralization and PCR enrichment with unique index adaptors (i5 + i7). Final libraries were purified with AMPure XP beads and quality-checked using the D1000 ScreenTape assay (#5067-5582, Agilent). DNA concentrations were determined with the Qubit high-sensitivity DNA assay (#Q33230, Thermo Fisher Scientific). Sequencing was carried out on an Illumina NextSeq 550 using a single-end (75 bp) configuration. Kallisto (version 0.44.2) was used for the pseudo-alignment against the Gencode M16 reference transcriptome. Data analysis was performed using R (version 4.3.0). ‘tximport’ (version 1.28.0) was used to import and aggregate transcript-level data to gene level[38]. The number and percentage of aligned reads were analyzed. The data were vst-transformed for principal component analysis, or normalized with Deseq function for differential expression analysis, and pairwise differential expression comparisons were made using the DESeq2 (version 1.40.1[39]) package. Log2 fold changes were shrunk using the default method[39] to reduce variability associated with low-count genes. The Enrichr package[40] was used for the gene term enrichment analysis. The ComplexHeatmap package (version 2.16.0[41]) was used for the visualizations of gene signature expression.
2.5 Enzyme-linked immunosorbent assay (ELISA)
2D- and 3D-cultured microglia were treated with lipopolysaccharide (LPS, 10 ng/ml; #tlrl-3pelps, InvivoGen) in DMEM for 24 h, after which supernatants were collected for IL-6, TNF-α, and CXCL10 quantification. For quantification of IL-1β response, 2D- and 3D-cultured microglia were primed with LPS (10 ng/ml) for 3 h before stimulation with nigericin (10 µM; #N1495, InvivoGen) for another 3 h. Cytokine concentrations (IL-1β, IL-6, TNF-α, CXCL10) in primary murine microglia culture supernatants were quantified using DuoSet ELISA kits (#DY401, #DY406, #DY410, #DY466, R&D Systems), according to the manufacturer’s instructions, using high-binding 96-well plates (Greiner Bio-One). Absorbance was measured at 450 nm with 570 nm as reference wavelength using a microplate reader (Fluostar Omega, BMG Labtech).
3. Human Models and Experimental Procedures
3.1 Ethics approval and informed consent
Ethical approval for the use of the human iPSC lines was granted by the Ethics Committee of the Medical Faculty of the Rheinische-Friedrichs-Wilhelms-Universität Bonn (Reference: 2024-140). The CRTDi004-A iPSC line, used in this study, was generated at the Center for Regenerative Therapies at TU Dresden, Germany. The material is fully anonymized. All iPSC lines are registered in the Human Pluripotent Stem Cell Registry, with the following registration codes: CRTDi004-A (iMGL 1), SCTi003-A (iMGL 2), USCFi001-A (iMGL 3), and SCVi028-A (iMGL 4). Informed consent was obtained from all participants.
3.2 Human iPSC culture
Human iPSC lines iMGL 1, iMGL 2, iMGL 3, and iMGL 4 were cultured in mTeSR Plus medium (#100-0276, Stem Cell Technologies). Cell culture plates were pre-coated with Matrigel® hESC-Qualified Matrix (#354277, Corning) one day before seeding. Cells were maintained at 37 °C and 5% CO2 and routinely checked for mycoplasma contamination using the Venor®gem Classic Mycoplasma Detection Kit (#11-1025, Minerva Biolabs). For passaging, cells were dissociated into small aggregates using ReLeSR (#100-0483, Stem Cell Technologies) or into single cells using Accutase (#07920, Stem Cell Technologies) every 4-5 days. Unless otherwise stated, all analyses presented were performed with iMGLs derived from the listed cell lines.
3.3 Mesodermal differentiation
Successful differentiation begins with a well-maintained human iPSC culture. Before differentiation, iPSC lines were passaged twice after thawing and assessed for quality. iPSCs showing optimal properties with no signs of differentiation and characteristics of pluripotency were selected for mesodermal differentiation. iPSC colonies were detached and dissociated using Accutase and plated onto AggreWellTM800 plates (#34811, Stem Cell Technologies) at a density of 10,000 cells per microwell in mTeSR Plus medium supplemented with 10 µM (R)-(+)-trans-4-(1-Aminoethyl)-N-(4-Pyridyl)cyclohexanecarboxamide dihydrochloride inhibitor (#Y0503-5MG, Sigma-Aldrich) and cultured overnight. On the next day (Day 1), each microwell contained one embryoid body (EB) with visible borders. Mesodermal differentiation was initiated using a two-step priming strategy. On Day 1, media was removed carefully using a 5 ml serological pipette and replaced with priming media 1 (mTeSR plus), containing 50 ng/ml human Bone morphogenetic protein 4 (#130-111-167, Miltenyi Biotec), 50 ng/ml human vascular endothelial growth factor (#130-108-956, Miltenyi Biotec), and 20 ng/ml human stem cell factor (#120-096-692, Miltenyi Biotec). Full media changes with priming media 1 were performed on the next three consecutive days. From Day 4 on, EBs were carefully transferred to a 6-well suspension plate (#83.3920.500, Sarstedt) and cultured using priming media 2, which included the same growth factors as priming media 1, with the addition of 25 ng/ml human interleukin 3 (IL-3, #130-095-070, Miltenyi Biotec). The EBs were moved to agitation on an orbital shaker at 75 rpm (Celltron, Infrose HT), with full media changes performed on Day 6 and Day 9. At Day 11, EBs were removed from agitation, collected, and carefully transferred to a Matrigel® hESC-Qualified Matrix coated 6-well cell culture plate in 1.5 ml X-Vivo media (#881024, Lonza), supplemented with 2 mM GlutaMAX (#35050061, Thermo Scientific), 10 U/ml Penicillin-Streptomycin (#15140122, Thermo Scientific), 0.05 mM-Mercaptoethanol (#31350010, Thermo Scientific), 100 ng/ml human macrophage colony-stimulating factor (M-CSF, #120-096-692, Miltenyi Biotec), and 25 ng/ml human IL-3 (#130-095-070, Miltenyi Biotec). After one week, half of the initial medium volume was added to each well. First full media change was performed after two weeks. First precursor macrophages (preMacs) were evident in suspension in the media after three weeks of static factory cultivation. From there on, full media changes were performed once or twice per week to harvest the preMacs for further differentiation into iMGLs.
3.4 iMGL differentiation: 2D and 3D cultures
iMGLs were differentiated for 11 days on glass coverslips at a density of 1 × 10⁵ cells/cm2 for 2D culture and 1.5 × 10⁵ cells for 5 droplets of 3D cultures. The iMGL differentiation medium consisted of Advanced DMEM/F12 (#12634028, Thermo Scientific) supplemented with 1% N2 (#17502048, Thermo Scientific), 1% GlutaMAX (#35050061, Thermo Scientific), 1% Penicillin-Streptomycin, 0.1%-Mercaptoethanol, 100 ng/ml human interleukin 34 (#130-108-977, Miltenyi Biotec), 25 ng/ml human M-CSF, and 50 ng/ml human Transforming Growth Factor beta 1 (TGF-β1, #130-095-06, Miltenyi Biotec).
For 3D iMGL culture, a matrix for the droplets was prepared on ice using Matrigel Basement Membrane Matrix, lactate dehydrogenase-elevating virus-free (#354234, Corning), and Rat Collagen Type I (#08-115, Sigma-Aldrich). Collagen was neutralized by mixing 45 µl of collagen with 6 µl of 10x MEM (#21430-020, Gibco) and 3 µl of 5% NaHCO3. PreMacs were harvested, and 150,000 cells were collected in a 1.5 ml tube, centrifuged at room temperature for 5 min at 300 g. The supernatant was discarded, and the pellet was resuspended in 4 µl of iMGL differentiation media and mixed with 10 µl of ice-cold neutralized collagen and 60 µl of ice-cold Matrigel. For immunofluorescent labeling, 15 µl of the cell-matrix mixture was carefully transferred into the center of a µ-Slide 8-Well chamber slides (#80826, Ibidi). For flow cytometry, droplets were formed using an Organoid Embedding Sheet (#08579, StemCell Technologies). The droplets were allowed to solidify at 37 °C and 5% CO2 for 45 min. Afterwards, iMGL media was added to the µ-Slides, or the droplets were transferred from the Organoid Embedding Sheet into a 48-well plate by flushing with iMGL media. The cells were cultured for 11 days with half media changes every second or third day. iMGLs were treated with LPS or Fluoresbrite® YG Carboxylate Microspheres 0.50 µm (#15700-10, Polysciences) 24 h before flow analysis or fixation for immunofluorescence labeling.
3.5 Immunofluorescent labelling and analysis of 2D- and 3D-cultured iMGLs
Prior to fixation, 2D-cultured iMGLs and 3D droplets were carefully washed once with warm PBS. Droplets were fixed with 2% PFA at 37 °C for 30 min; 2D-cultured iMGLs were fixed with 4% PFA at room temperature for 15 min. After fixation, droplets were washed three times for 10 min with warm PBS. Droplets were stored at room temperature in PBS, and 2D-cultured iMGLs were stored in PBS at 4 °C until further use.
To block nonspecific binding sites, iMGLs were incubated at room temperature for 1 hour with 2% animal serum (donkey serum) in PBS with 0.4% Triton-X100 (PBT) and 1% bovine serum albumin (BSA) and briefly rinsed in PBS. Subsequently, primary antibodies in 1% BSA in PBT were added to each well, and the samples were incubated overnight at 4 °C for 2D-cultured iMGLs and RT for 3D droplets. The primary antibodies used included anti-P2RY12 (#392108, BioLegend, 1:200) to label homeostatic microglia, and anti-IBA1 (#ab178847, Abcam, 1:500). Anti-osteopontin (OPN) (#ab63856, Abcam, 1:40), which marks proinflammatory microglia, was also included. After incubation, the samples were washed three times with PBT for 10 min each. The secondary antibodies and Phalloidin (#10125092, Fisher Scientific, 1:1,000) were added at a dilution of 1:1,000 in 1% BSA in PBT, and the samples were incubated for 1 hour at RT in the dark. The secondary antibodies used were Alexa Fluor-488 anti-rabbit, Alexa Fluor-488 anti-mouse, Alexa Fluor-555 anti-rabbit, and Alexa Fluor-555 anti-goat (ThermoFisher). Following incubation with secondary antibodies, the cells were washed once with PBT for 10 min, followed by nuclei staining using DAPI (#422801, BioLegend, 1:10,000) in PBT for 10 min, followed by washing in PBS for 10 min. The 2D-cultured iMGLs on coverslips were mounted onto glass slides using Fluromount-G (#00-4958-02, Invitrogen) and µ-Slides were filled with glycerol (50% or 80% glycerol in PBS). The mounted coverslips were stored at 4 °C, and the mounted µ-Slides were stored at room temperature until further use. The morphological complexity of Iba1+ iMGLs from 2D and 3D was analyzed using MotiQ[34], a customized Fiji plug-in. Image segmentation was performed using MotiQ Cropper and Thresholder (v0.1.2), applying Huang’s threshold for 2D-cultured iMGLs and Li’s threshold for 3D-cultured iMGLs. Particle analysis was conducted with MotiQ 3D Analyzer (v0.1.5), using minimum particle volumes of 1,200 and 25,000 voxels for 2D and 3D cultures, respectively. Morphological parameters were extracted with MotiQ 3D Analyzer, including ramification index, spanned volume, number of cell branches, and total tree length. For the 3D reconstruction of iMGLs, Z-stack images (1 μm steps, using a Plan-Apochromat 40x/0.95 objective) were acquired using a Zeiss LSM 880 (Airyscan) confocal microscope (1,024 × 1,024 pixels, 8-bit depth, pixel size of 0.2076 µm (voxel size 0.2076 × 0.2076 × 1.0 µm3); scan zoom = 1 (no additional zoom)) from 2D and 3D-cultured iMGLs. To visualize microglial morphology and assess the spatial distribution of P2RY12, image stacks were processed using Imaris software (version 9.6.1, Bitplane, Oxford Instruments). Microglial cells were rendered in 3D using the “Surfaces” tool based on IBA1 staining to reduce background and allow volume-based visualization. P2RY12 expression was analyzed in the corresponding fluorescence channel to evaluate its subcellular distribution within rendered microglia.
3.6 Digestion and harvesting of 2D- and 3D-cultured cells for flow cytometry
Collagenase I (#LS004214, Worthington Biochemical Corporation) was prepared in Hank’s Balanced Salt (without Ca2+ and Mg2+) at a concentration of 2 mg/ml. To recover cells from the 3D Matrigel-collagen matrix, the droplets were digested with collagenase I at 37 °C for 30 min. After digestion, ice-cold PBS was pipetted on top of the gel to dissolve residual Matrigel. The suspension was pipetted several times up and down to thoroughly mix and break any remaining matrix. More ice-cold PBS was added, and the solution was pipetted up and down again until the whole matrix was dissolved. Next, the suspension was transferred to a 15 ml Falcon tube and centrifuged at 4 °C for 5 min at 400 g. If Matrigel was still evident in the suspension, additional ice-cold PBS was added, and cells were centrifuged again until all Matrigel was dissolved. The resulting pellet was resuspended in FACS buffer and transferred to a 96-well U-bottom plate. For 2D-cultured iMGLs, cells were scraped off the glass coverslip using a cell scraper. After scraping, the cells were transferred to a 15 ml Falcon tube, centrifuged at 4 °C for 5 min at 400 g, resuspended in FACS buffer, and transferred to a 96-well U-bottom plate. Cell surface staining was performed at 4 °C for 20 min with the addition of human Fc receptorblocking reagent (#130-059-901, Miltenyi Biotec, 1:5) to prevent non-specific binding. Fluorescent-dye-conjugated antibodies were purchased from BioLegend for flow cytometry analysis. Data were acquired using the FACSymphony A5 (BD Biosciences), and all data were analyzed using FlowJo (v10.10.0). Median fluorescent intensities were normalized for each antibody based on the 2D condition for each cell line.
3.7 Live-cell imaging of 2D- and 3D-cultured iMGLs
Live-cell imaging of 2D- and 3D-cultured iMGLs was conducted using an inverted wide-field Nikon Eclipse Ti-2E microscope. Cells cultured in µ-Slide 8-Well chamber slides were supplemented with 1 µM Vitamin C, and imaged every 15 min at the same XYZ coordinates over a 24-hour period to assess differences in motility.
3.8 Statistical analysis
Statistical analyses were performed using GraphPad Prism version 10 (GraphPad Software). Datasets were tested for Gaussian distribution and homogeneity of dispersion using the Shapiro-Wilk test and the Bartlett test, respectively. Microglial morphology data across different 3D matrix compositions were analyzed using the Kruskal-Wallis test followed by Dunn’s post-hoc test, as the assumption of homogeneity was not met. Comparisons between 2D and 3D cultures were conducted using unpaired two-tailed t tests, or the Mann-Whitney test when normality or homogeneity criteria were not met. ELISA data were evaluated with two-way analysis of variance followed by Tukey’s post-hoc test. Data are presented as mean ± standard deviation unless otherwise indicated. Statistical significance was defined as p < 0.05, with levels of significance indicated as follows: p < 0.05 (*), p < 0.01 (**), p < 0.001 (***), and p < 0.0001 (****). Statistical tests used were specified in the respective figure legends.
3.9 Data availability
All original next-generation sequencing data have been deposited in the National Center for Biotechnology Information Gene Expression Omnibus repository and will be made publicly available upon acceptance.
4. Results
4.1 3D culture composition determines microglial morphological complexity
To study the effect of 3D culture systems on microglial cells, we established a workflow as outlined in Figure 1A. Brains from mouse pups (P0-P3) were isolated to generate primary mixed glial cultures. After purification, primary microglia were cultured either under conventional 2D conditions or in 3D culture systems, after which they were subjected to analysis. To identify a 3D matrix environment that supports microglial morphological complexity, we cultured microglia from Cx3cr1gfp/+ mice in various 3D matrix compositions and analyzed their morphology after 24 h. The goal was to establish a minimal, yet effective 3D condition that enables microglia to develop a structurally complex, homeostatic–like morphological phenotype. As initial reference conditions, we tested hyaluronan and starPEG as 3D matrices, which have been used previously to culture primary murine neurons and human primary cortical astrocytes or iPSC-derived human neural stem cells, respectively[21,42]. Microglia embedded in either hyaluronan or starPEG remained largely amoeboid and exhibited minimal process extension, indicating that these 3D systems were less suitable to support morphological characteristics of primary microglia (Figure 1B). Furthermore, these 3D matrices displayed reduced structural stability, frequently resulting in a higher cell density within the confocal imaging focal plane. We next assessed other matrices, including collagen type I, Matrigel, and a composite matrix combining both (Matrigel:collagen, 4:1 ratio). This ratio, favoring Matrigel, was selected to provide a laminin-rich environment while maintaining a fibrillar collagen network for structural stability, thereby more closely resembling the CNS extracellular matrix than collagen I-dominant matrices[43]. Microglia cultured in collagen or Matrigel alone showed increased branching and a more complex morphology (Figure 1B,C). Notably, the combination of Matrigel and collagen led to further improvement, with cells displaying more ramified cell processes (Figure 1B,C), suggesting a synergistic effect of the two matrix components in supporting morphological complexity in cultured primary microglia in 3D. To quantify these differences, high-resolution confocal imaging was followed by cell reconstruction and morphometric analysis using the MotiQ toolbox[34]. This allowed the extraction of key morphological parameters of cultured microglia, such as ramification index, spanned volume, number of cell branches, and dendritic tree length (Figure 1C). Microglia in hyaluronan or starPEG exhibited low values across all measured parameters, whereas collagen and Matrigel each induced significantly higher morphological cell complexity. The Matrigel-collagen condition consistently yielded the highest values across all parameters (Figure 1C). Direct comparison with 2D-cultured microglia further confirmed the superiority of the 3D Matrigel-collagen condition in promoting microglial morphological complexity (Figure 1D,E). Taken together, these results demonstrate that a Matrigel-collagen composite matrix provides a supportive 3D environment that robustly enhances microglial morphological complexity already within 24 h of culture.
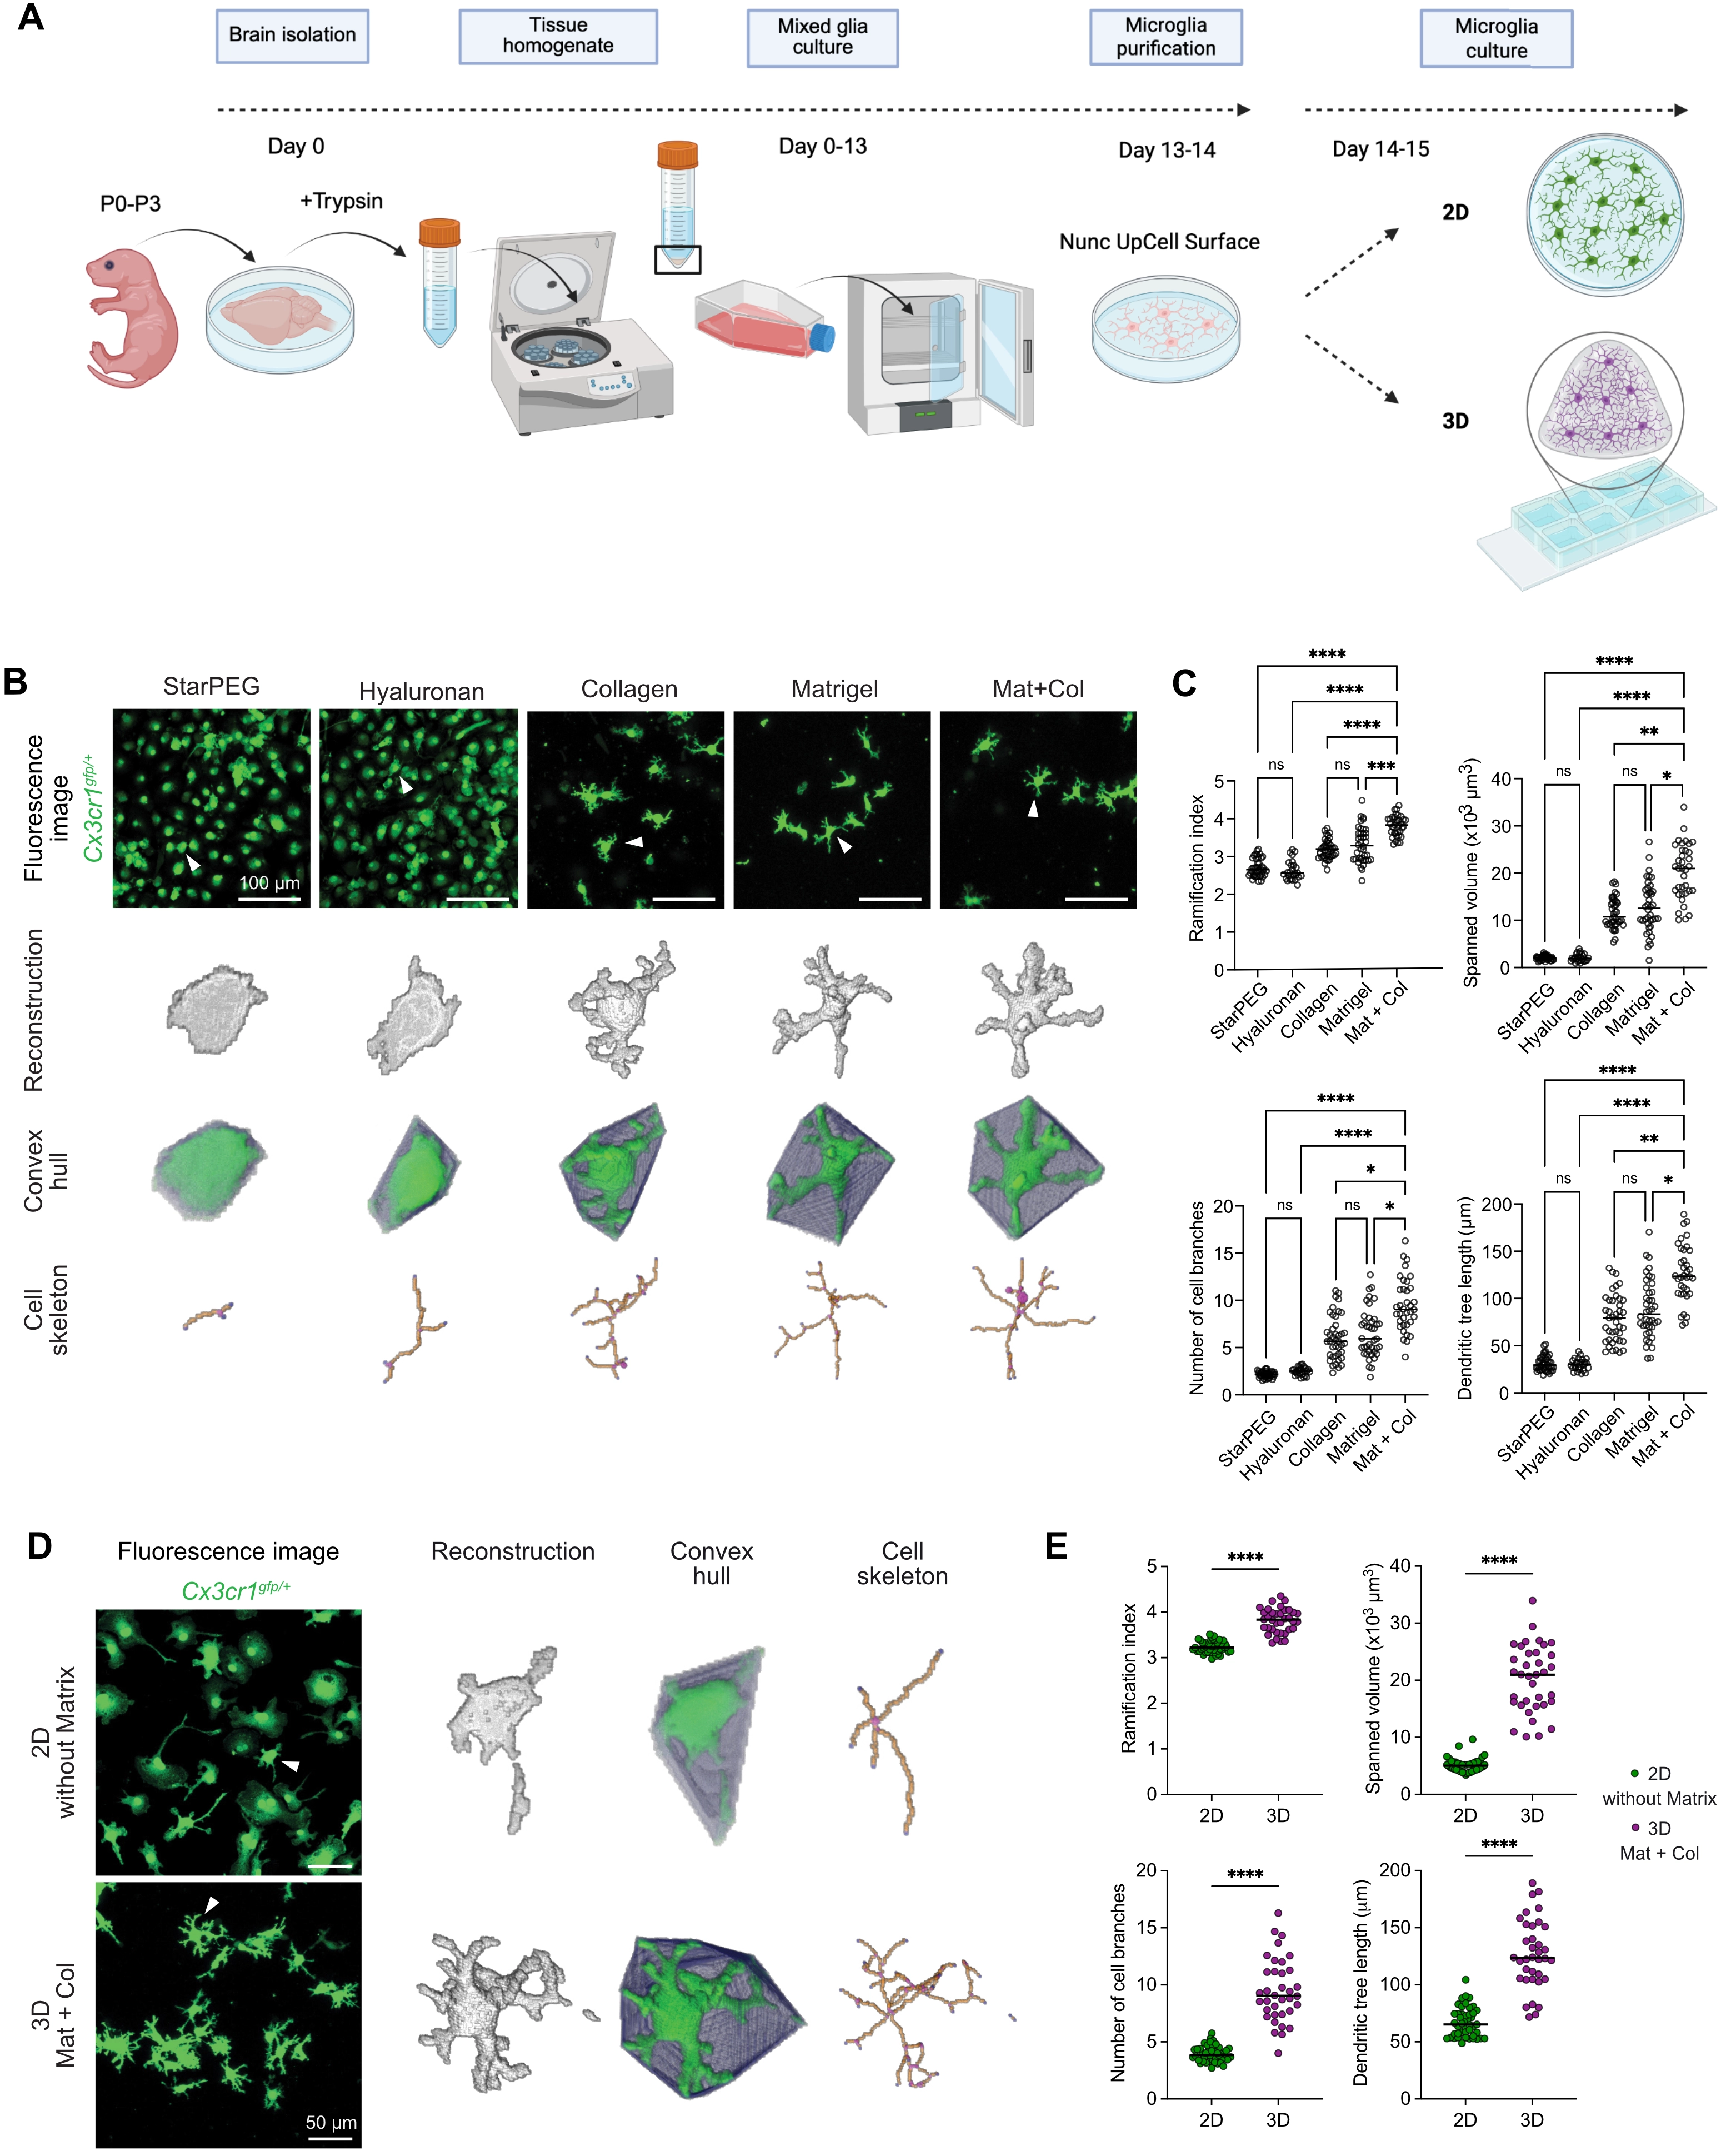
Figure 1. 3D culture composition determines microglial morphological complexity. (A) Workflow for primary microglia generation from mixed glial cultures, followed by culture in 2D or 3D conditions; (B) Representative confocal microscopy images showing the effect of different 3D matrices (starPEG, hyaluronan, collagen, Matrigel, and Matrigel-collagen mixture [4:1, Mat+Col]) on microglia from Cx3cr1gfp/+ mice (green). Morphology after 24 h in ACM. Arrowheads indicate cells shown below as reconstructions, convex hulls, and skeletons analyzed using MotiQ. Scale bar = 100 µm; (C) Quantification of morphological parameters using MotiQ after 24 h of culture in ACM across different 3D matrices. Parameters include ramification index, spanned volume, dendritic tree length, and number of cell branches. Normality tested with Shapiro–Wilk; Kruskal-Wallis test followed by Dunn’s test for multiple comparisons used for analysis. Data are shown as dot plots with median values; each dot represents the mean of all microglia imaged per ROI (starPEG n = 43 ROIs, hyaluronan n = 27 ROIs, collagen n = 41 ROIs, Matrigel n = 40 ROIs, Mat+Col n = 36 ROIs) from three independent experiments. ****p < 0.0001, ***p < 0.001, **p < 0.01, *p < 0.05; (D) Representative confocal microscopy images comparing microglia from Cx3cr1gfp/+ mice (green) cultured in 2D without Matrix or 3D Mat+Col for 24 h in ACM. Arrowheads indicate cells shown on the right as reconstructions, convex hulls, and skeletons analyzed using MotiQ. Scale bar = 50 µm; (E) Quantification of morphological parameters using MotiQ in 2D without Matrix vs. 3D Mat+Col cultures after 24 h in ACM. Parameters include ramification index, spanned volume, number of cell branches, and dendritic tree length. Data are shown as dot plots with median values; each dot represents the mean of all microglia imaged per ROI (n = 45 ROIs for 2D, n = 36 ROIs for 3D Mat+Col) from three independent experiments. ****p < 0.0001; normality tested with Shapiro–Wilk; unpaired t tests or Mann-Whitney test used for analysis (GraphPad Prism 10). 2D: two-dimensional; 3D: three-dimensional; starPEG: star–shaped poly(ethylene glycol); ACM: astrocyte-conditioned media; ROI: region of interest.
4.2 3D culture promotes in vivo-like motility and behavior in primary murine microglia
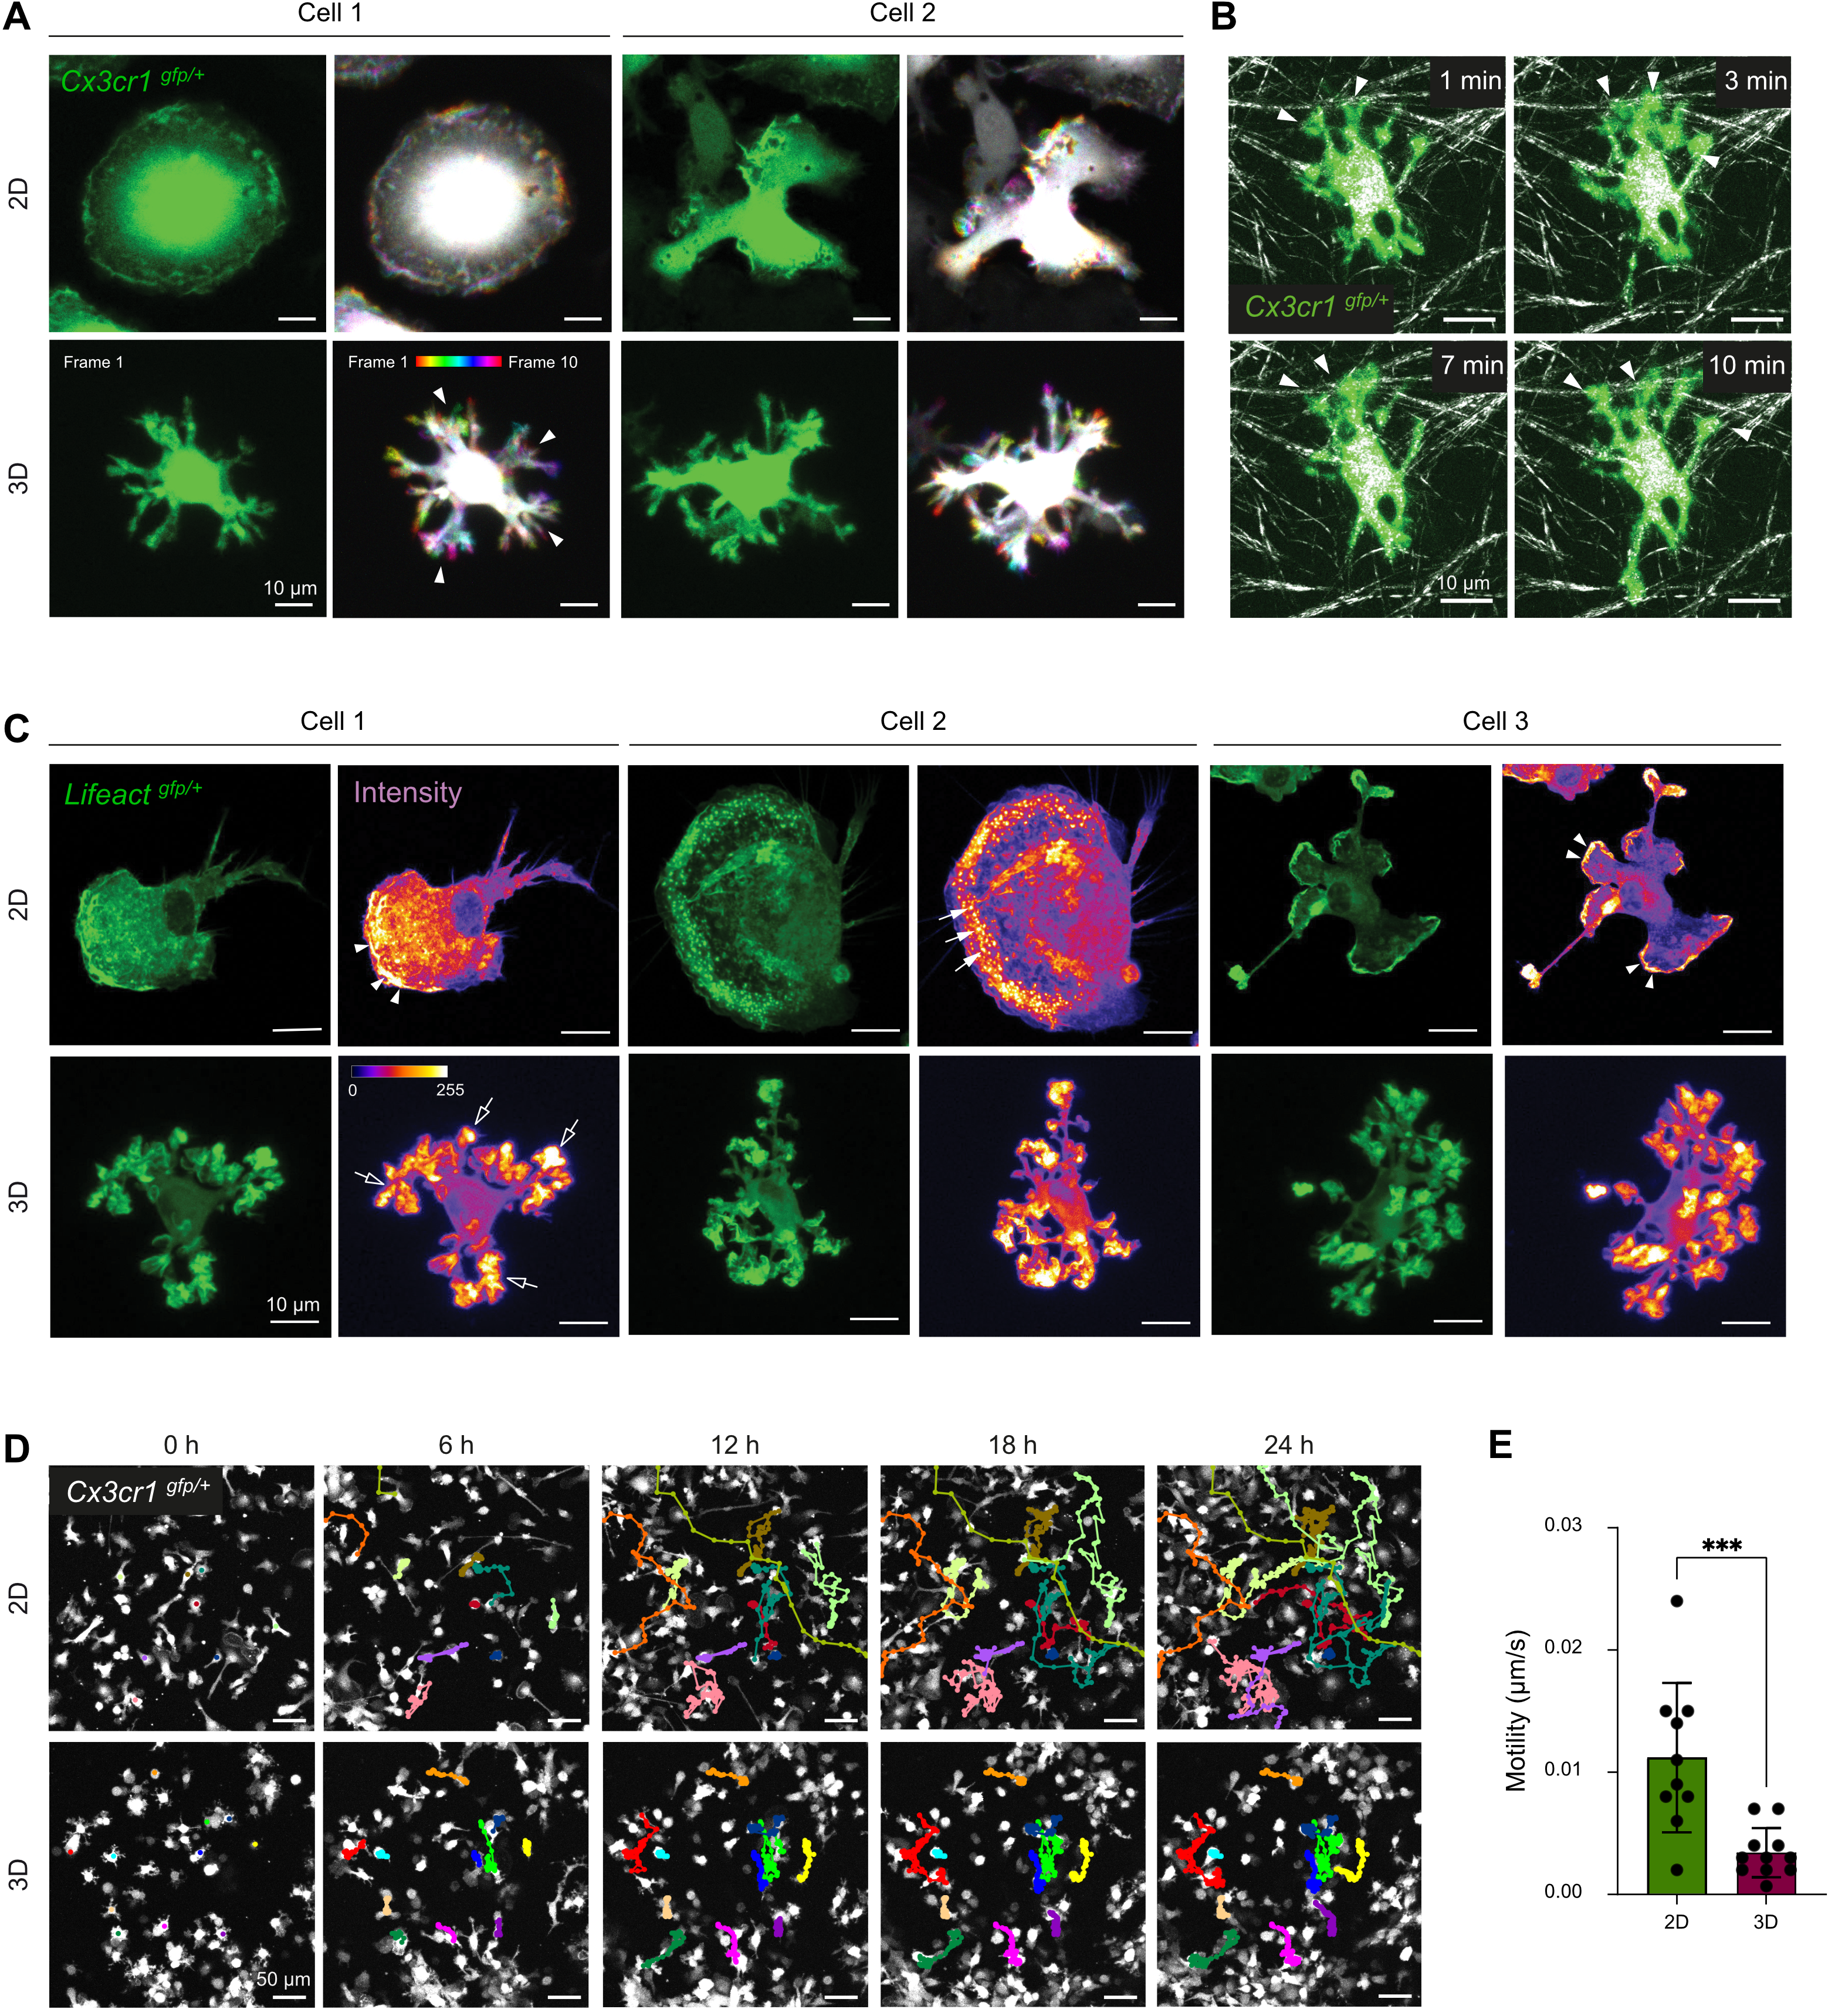
To further characterize how the microglial phenotype is affected by the Matrigel-collagen 3D culture system, we examined dynamic cell motility, cell-matrix interactions, filamentous actin organization, migratory behavior, and electrophysiological properties, comparing microglia maintained in 2D versus 3D. First, we assessed the short-term dynamic behavior of microglial cell processes using high-resolution spinning disk microscopy (Figure 2A). In 3D culture, microglia displayed continuous extension and retraction of their terminal cell processes throughout the imaging period, while the cell body remained largely stationary (Figure 2A, bottom panel). The microglial soma appears white due to its stable position across imaging frames, whereas the motile processes are color-coded according to their temporal position. This behavior resembles the surveillance-like motility of homeostatic microglia observed in vivo[8,44,45]. In contrast, microglia cultured in 2D lacked discernible process dynamics and did not display defined extension or retraction movements of cell processes (Figure 2A, top panel).

Figure 2. 3D culture promotes in vivo-like motility and process dynamics in primary microglia. (A) Representative time-lapse confocal microscopy images of microglia from Cx3cr1gfp/+ mice cultured in 2D (top) or 3D (bottom) conditions, acquired at 1-minute intervals over a 10-minute period. For each condition, a single frame from the time-lapse sequence (green) and the corresponding ten-frame temporal projection generated using Fiji’s Temporal Color Code function with the Spectrum Look Up Table, are shown. Arrowheads indicate exemplary processes dynamically shifting across frames. Scale bar = 10 µm; (B) Visualization of microglia–matrix interactions in 3D culture using confocal reflection microscopy. Representative confocal time-lapse images of 3D matrix fibers (white) and primary microglia from Cx3cr1gfp/+ mice (green) at the indicated time points. Arrowheads indicate microglia–matrix interactions. Scale bar = 10 µm; (C) F-actin cytoskeleton visualized using confocal microscopy of microglia from Lifeactgfp/+ mice (green) in 2D or 3D culture. Signal intensity is visualized using the Fire Look Up Table in Fiji. White arrowheads indicate lamellipodia; filled arrows indicate podosomes; empty arrows indicate podosome-like structures in 3D-cultured microglial cells. Scale bar = 10 µm; (D) Representative fluorescence images of migrating microglia from Cx3cr1gfp/+ mice (white) in 2D or 3D culture over 24 h at the indicated time points (0, 6, 12, 18, 24 h). Colored lines indicate cell tracks using MTrackJ. Scale bar = 50 µm; (E) Quantification of cell migration in 2D vs. 3D-cultured cells using MTrackJ. Data represent mean ± SD from one representative experiment (n = 10 cells for 2D, n = 11 cells for 3D). Normality tested with Shapiro–Wilk; two-tailed, unpaired t tests used for analysis. ***p < 0.001 (GraphPad Prism 10). 2D: two-dimensional; 3D: three-dimensional; SD: standard deviation.
To assess physical interactions between microglia in 3D and the surrounding matrix, we performed short-term time-lapse confocal imaging combined with reflection microscopy (Figure 2B). Microglia in 3D again extended and retracted processes continuously and formed direct contacts with nearby matrix fibers (Figure 2B, arrowheads). These interactions likely provide structural guidance and anchoring points that support the maintenance of their branched morphology.
We next analyzed the actin cytoskeleton using Lifeact-GFP-expressing[29] primary microglia to visualize filamentous (F-)actin structures (Figure 2C). In 2D culture, microglia exhibited heterogeneous cellular morphologies accompanied by diverse patterns of F-actin distribution. Prominent lamellipodia were observed at the leading edge of some microglial cells, whereas others displayed numerous distinct podosomes (Figure 2C, top panel, arrowheads: lamellipodia, filled arrows: podosomes). These structural features are consistent with earlier reports describing microglia maintained in 2D culture systems[46,47]. In contrast, 3D-cultured microglia showed a more uniform overall cell morphology and F-actin organization. Podosome-like structures were exclusively detected at the distal tips of the terminal cell processes, where F-actin was prominently enriched (Figure 2C, bottom panel, empty arrows: podosome-like structures). These structures were less numerous than podosomes in the 2D-cultured cells and exhibited a larger diameter, ranging approximately from 2 µm to 5 µm. This spatial distribution of F-actin indicates a cytoskeletal reorganization induced by the 3D environment[48,49].
We next assessed microglial migration using long-term live-cell imaging over 24 h (Figure 2D). In 2D cultures, microglia predominantly exhibited soma translocation and long-range migratory behavior. In contrast, microglia in 3D cultures remained comparatively stationary and displayed reduced soma translocation relative to 2D-cultured microglia, as confirmed by quantitative analysis (Figure 2D,E).
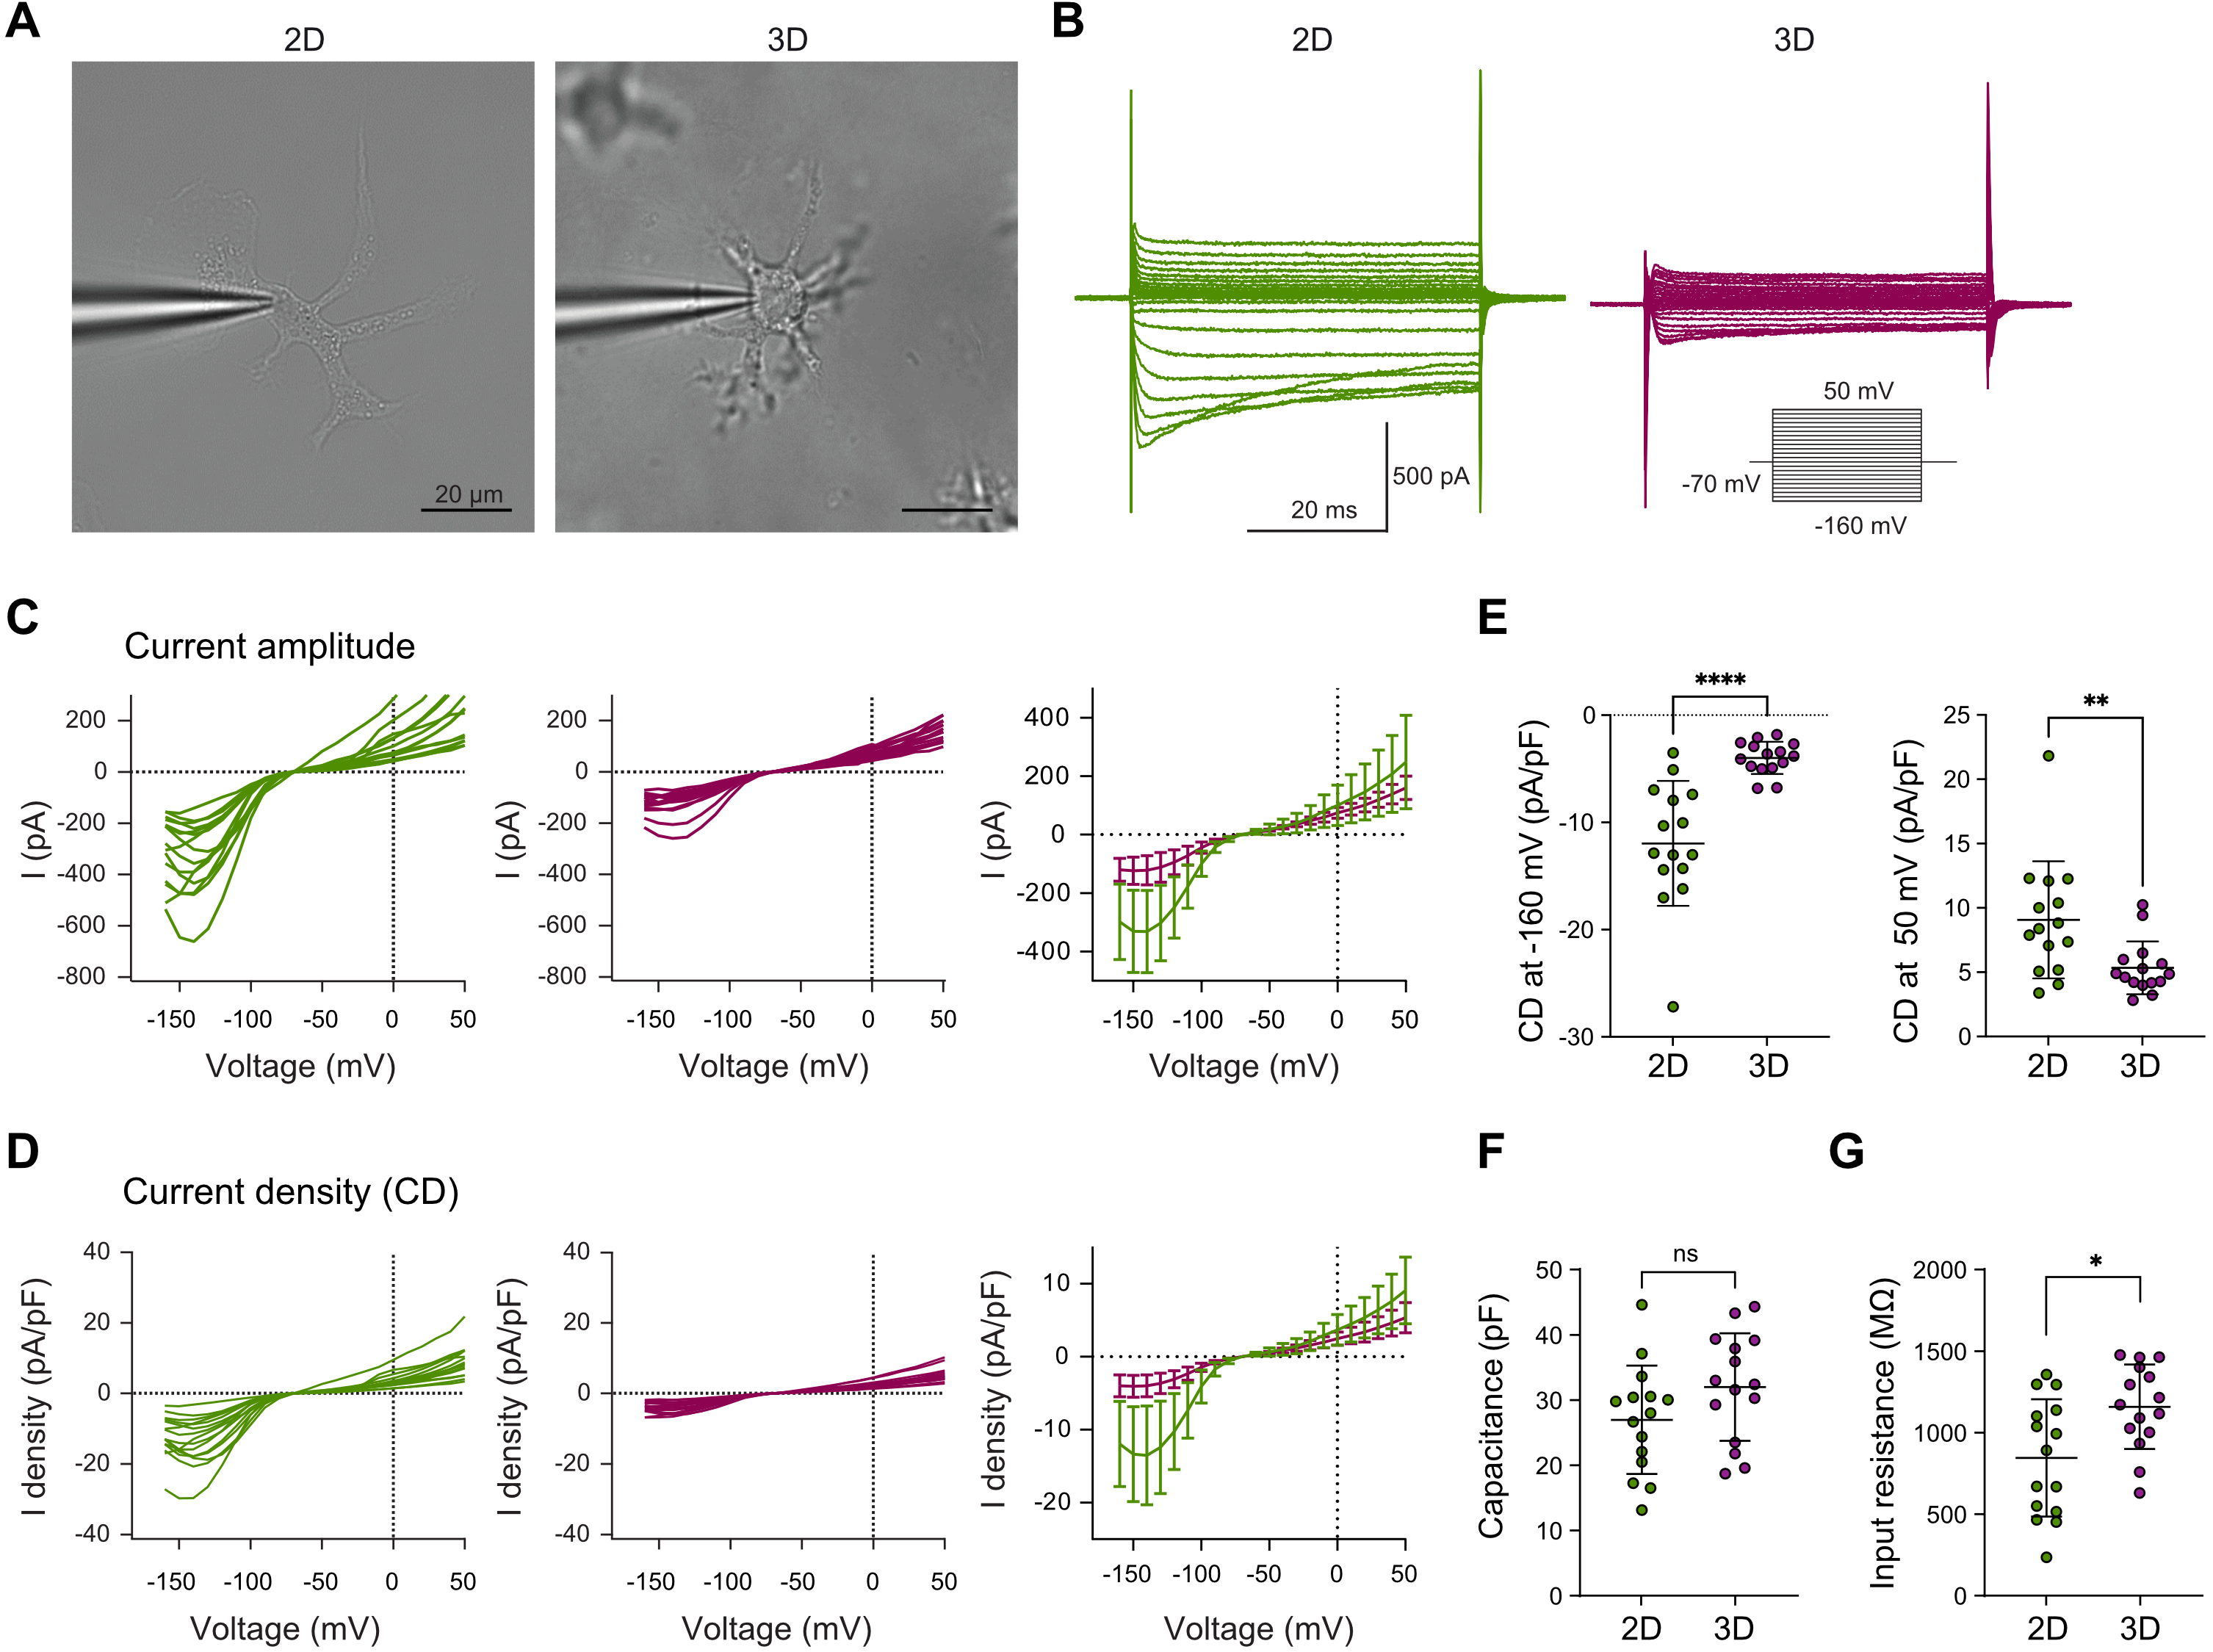
Building on these observed differences in morphology and motility, we next assessed whether the distinct culture conditions also affected the electrophysiological properties of microglia using whole-cell patch-clamp recordings[50] (Figure 3A). Membrane currents of 2D- and 3D-cultured microglia were recorded in response to 10 mV increments ranging from -160 mV to +50 mV (50 ms duration) from a holding potential of -70 mV. Microglia in 3D culture exhibited reduced inward and outward membrane currents compared to those in 2D (Figure 3B). In particular, inward current amplitudes at hyperpolarized potentials and outward currents at depolarized potentials were markedly lower in 3D-cultured cells (Figure 3C). Corresponding current densities and mean current densities at -160 mV and +50 mV were also reduced (Figure 3D,E), consistent with a less activated, more homeostatic electrophysiological profile[50,51]. Although 3D-cultured microglia display a markedly more ramified morphology, membrane capacitance did not differ significantly between 2D- and 3D-cultured microglia (Figure 3F). Whole-cell capacitance measurements primarily capture membrane compartments that are electrically well coupled to the recording site, whereas fine distal processes may contribute only partially to the measured capacitance. In contrast, input resistance was significantly lower in 2D-cultured microglia than in 3D-cultured microglia, consistent with increased membrane conductance in 2D cultures (Figure 3G). Together with the enhanced inward and outward current densities observed in 2D-cultured cells, these findings support the notion that microglia maintained in 3D adopt a more homeostatic electrophysiological profile, consistent with functional traits better resembling microglia in vivo, including process motility and limited soma migration.

Figure 3. 3D culture drives in vivo-like electrophysiological profiles in primary microglia. (A) Representative images of whole-cell patch-clamp recordings from microglia in 2D and 3D. Scale bar = 20 µm; (B) Representative traces of whole-cell voltage-dependent inward and outward membrane currents from microglia in 2D (green) and 3D (magenta) cultures. Voltage steps were applied in 10 mV increments from -160 mV to +50 mV (50 ms duration) from a holding potential of -70 mV; (C) Normalized I-V curves showing current amplitudes of microglia in 2D (green, left) and 3D (magenta, middle) cultures and averaged current amplitude data in 2D and 3D cultures (right), with mean current amplitude determined 5 and 7 ms after the start of the voltage jump; (D) Normalized I-V curves showing current densities, with current amplitudes adjusted to cell capacitance, in microglia cultured in 2D (green, left) or 3D (magenta, middle) and the averaged current density data in 2D and 3D cultures (right); (E) Current densities of microglia cultured in 2D (green) or 3D (magenta) at -160 (left) and +50 mV (right); (F) Whole-cell membrane capacitance of microglia cultured in 2D (green) or 3D (magenta). No significant difference was observed between groups; (G) Input resistance of microglia cultured in 2D (green) or 3D (magenta). Input resistance was significantly higher in 3D-cultured microglia. Normality tested with Shapiro–Wilk; unpaired t tests and Mann-Whitney test used for analysis. ****p < 0.0001, **p < 0.01, *p < 0.05 (GraphPad Prism 10). Data represent curves of individual microglial cells or mean ± SD from n = 15 cells per condition from 3 independent experiments (C-G). 2D: two-dimensional; 3D: three-dimensional; SD: standard deviation.
4.3 3D culture drives transcriptional reprogramming in microglia
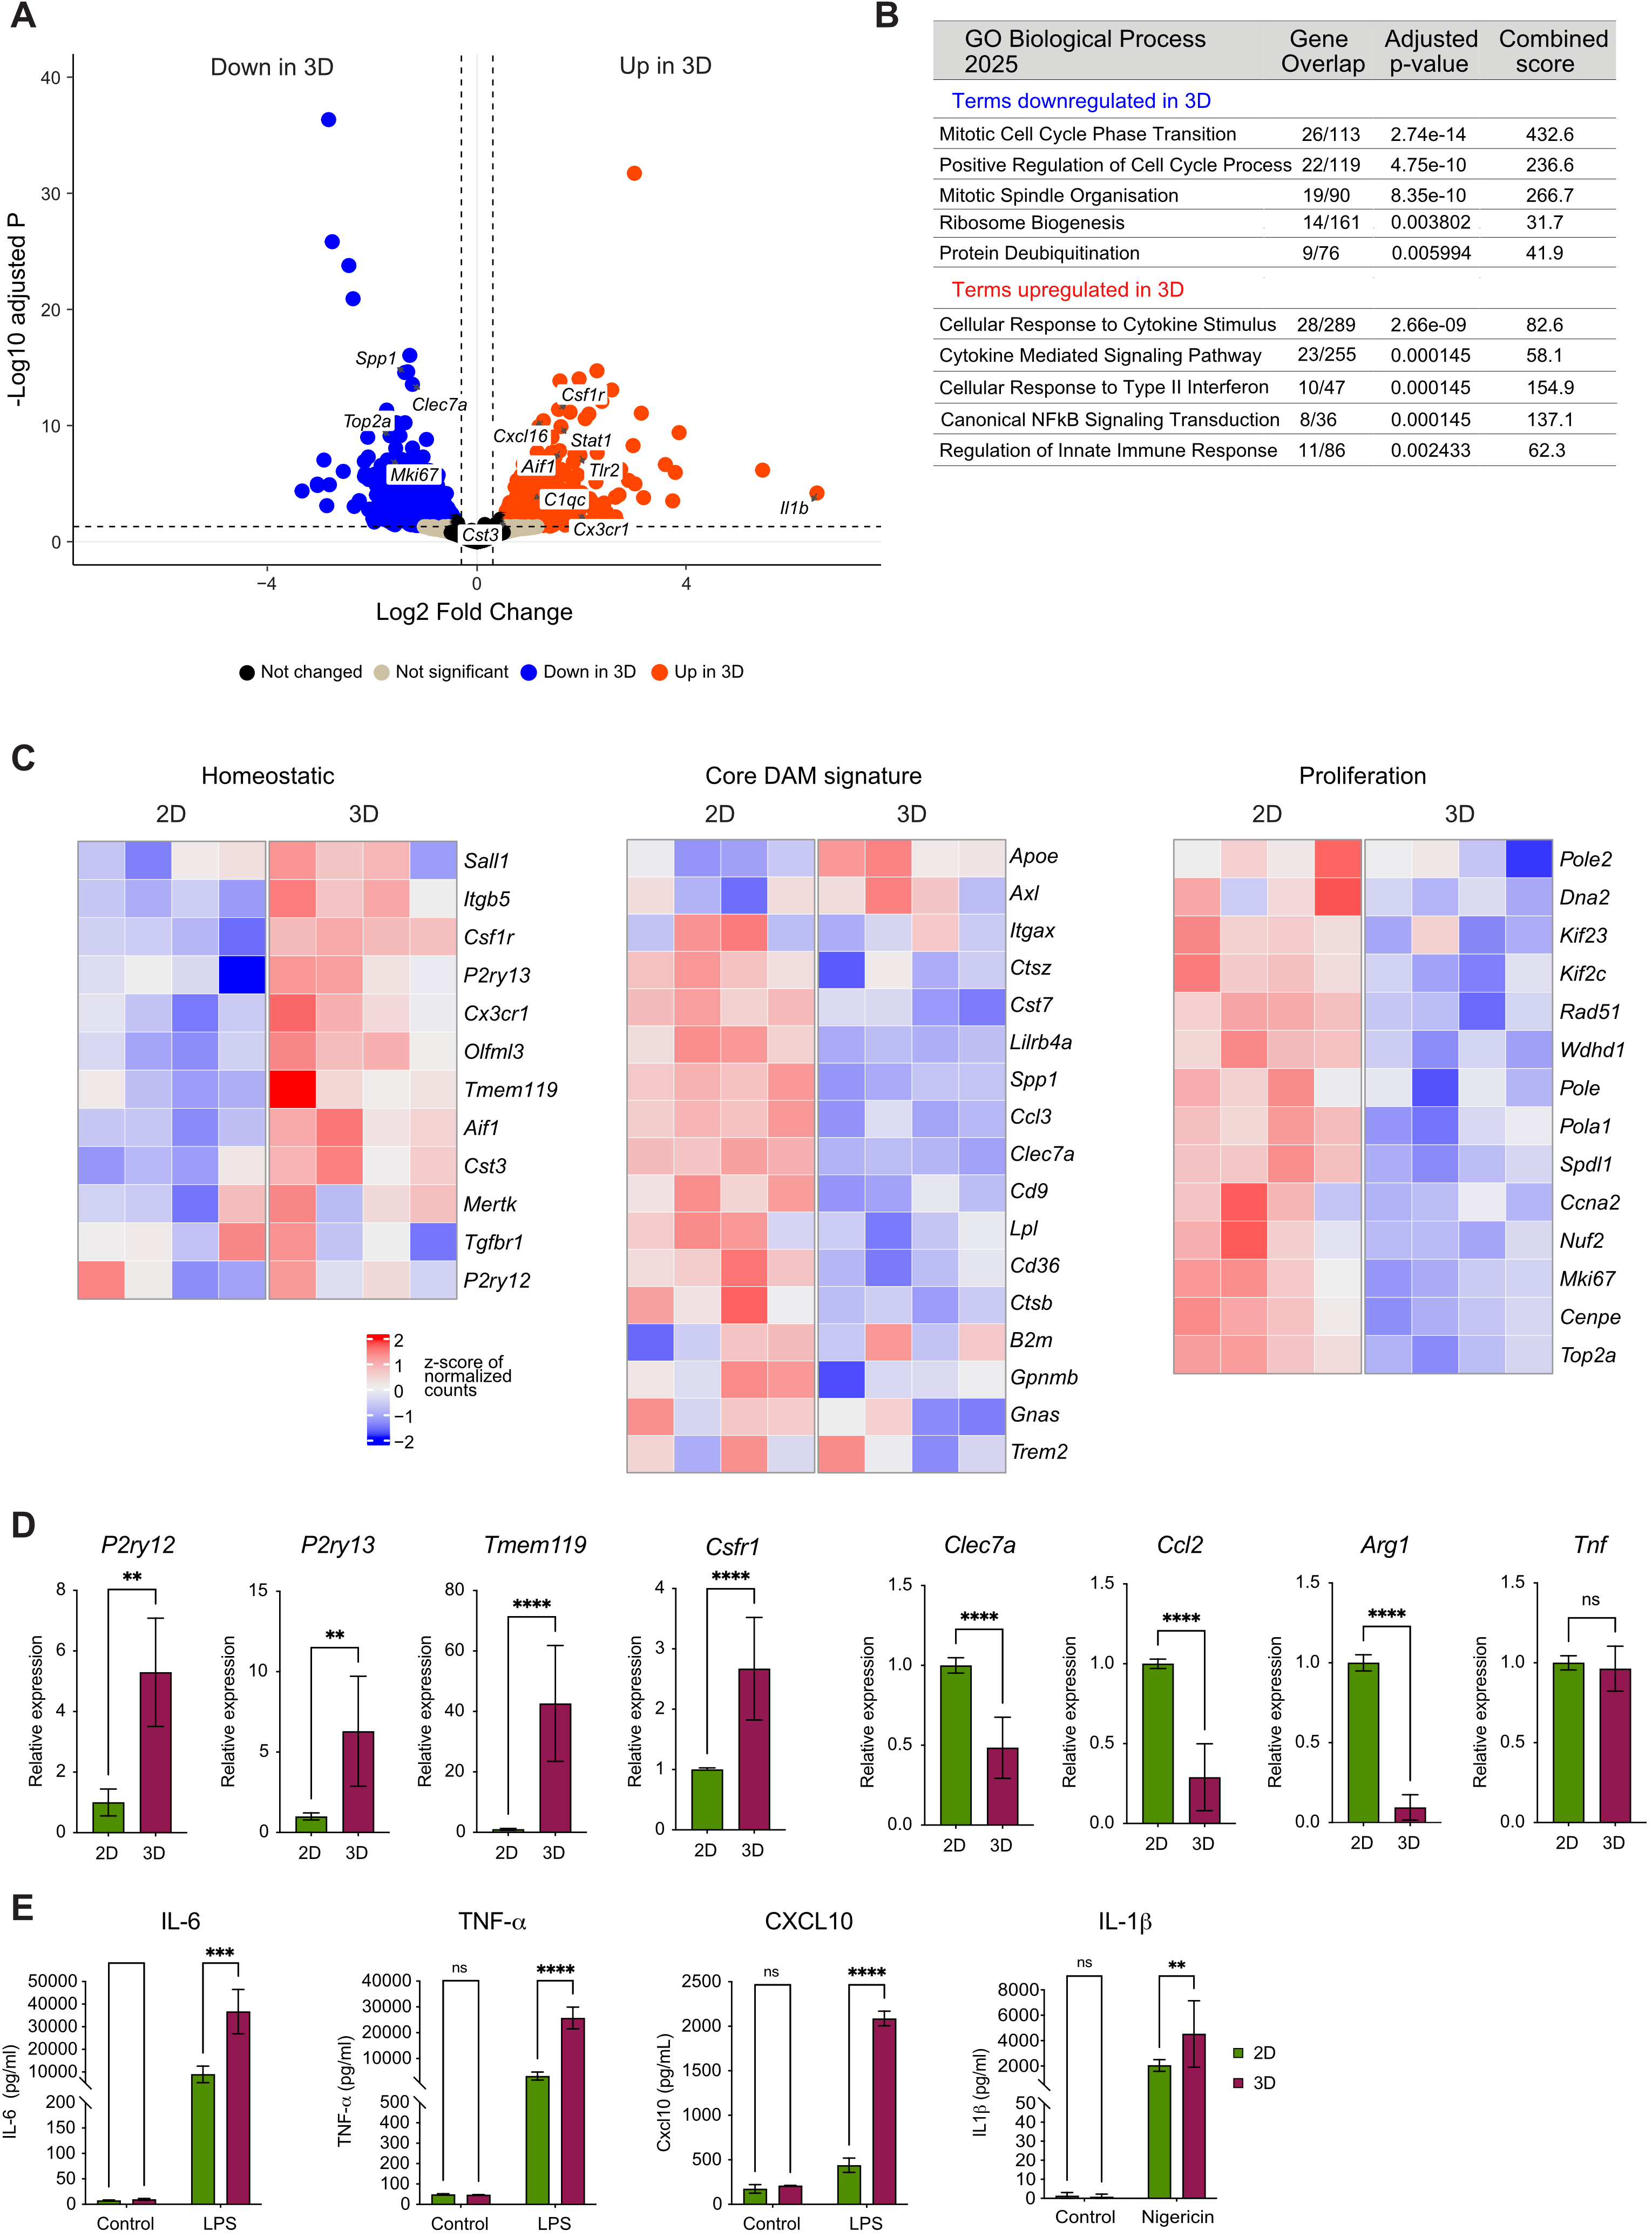
To assess whether the morphological and phenotypic changes observed in 3D-cultured microglia are accompanied by transcriptional reprogramming, we performed bulk RNA-sequencing on primary mouse microglia cultured either in 2D or embedded in the Matrigel-collagen 3D matrix. Differential gene expression analysis revealed a distinct shift in the microglial transcriptional phenotype depending on the culture condition (Figure 4A).
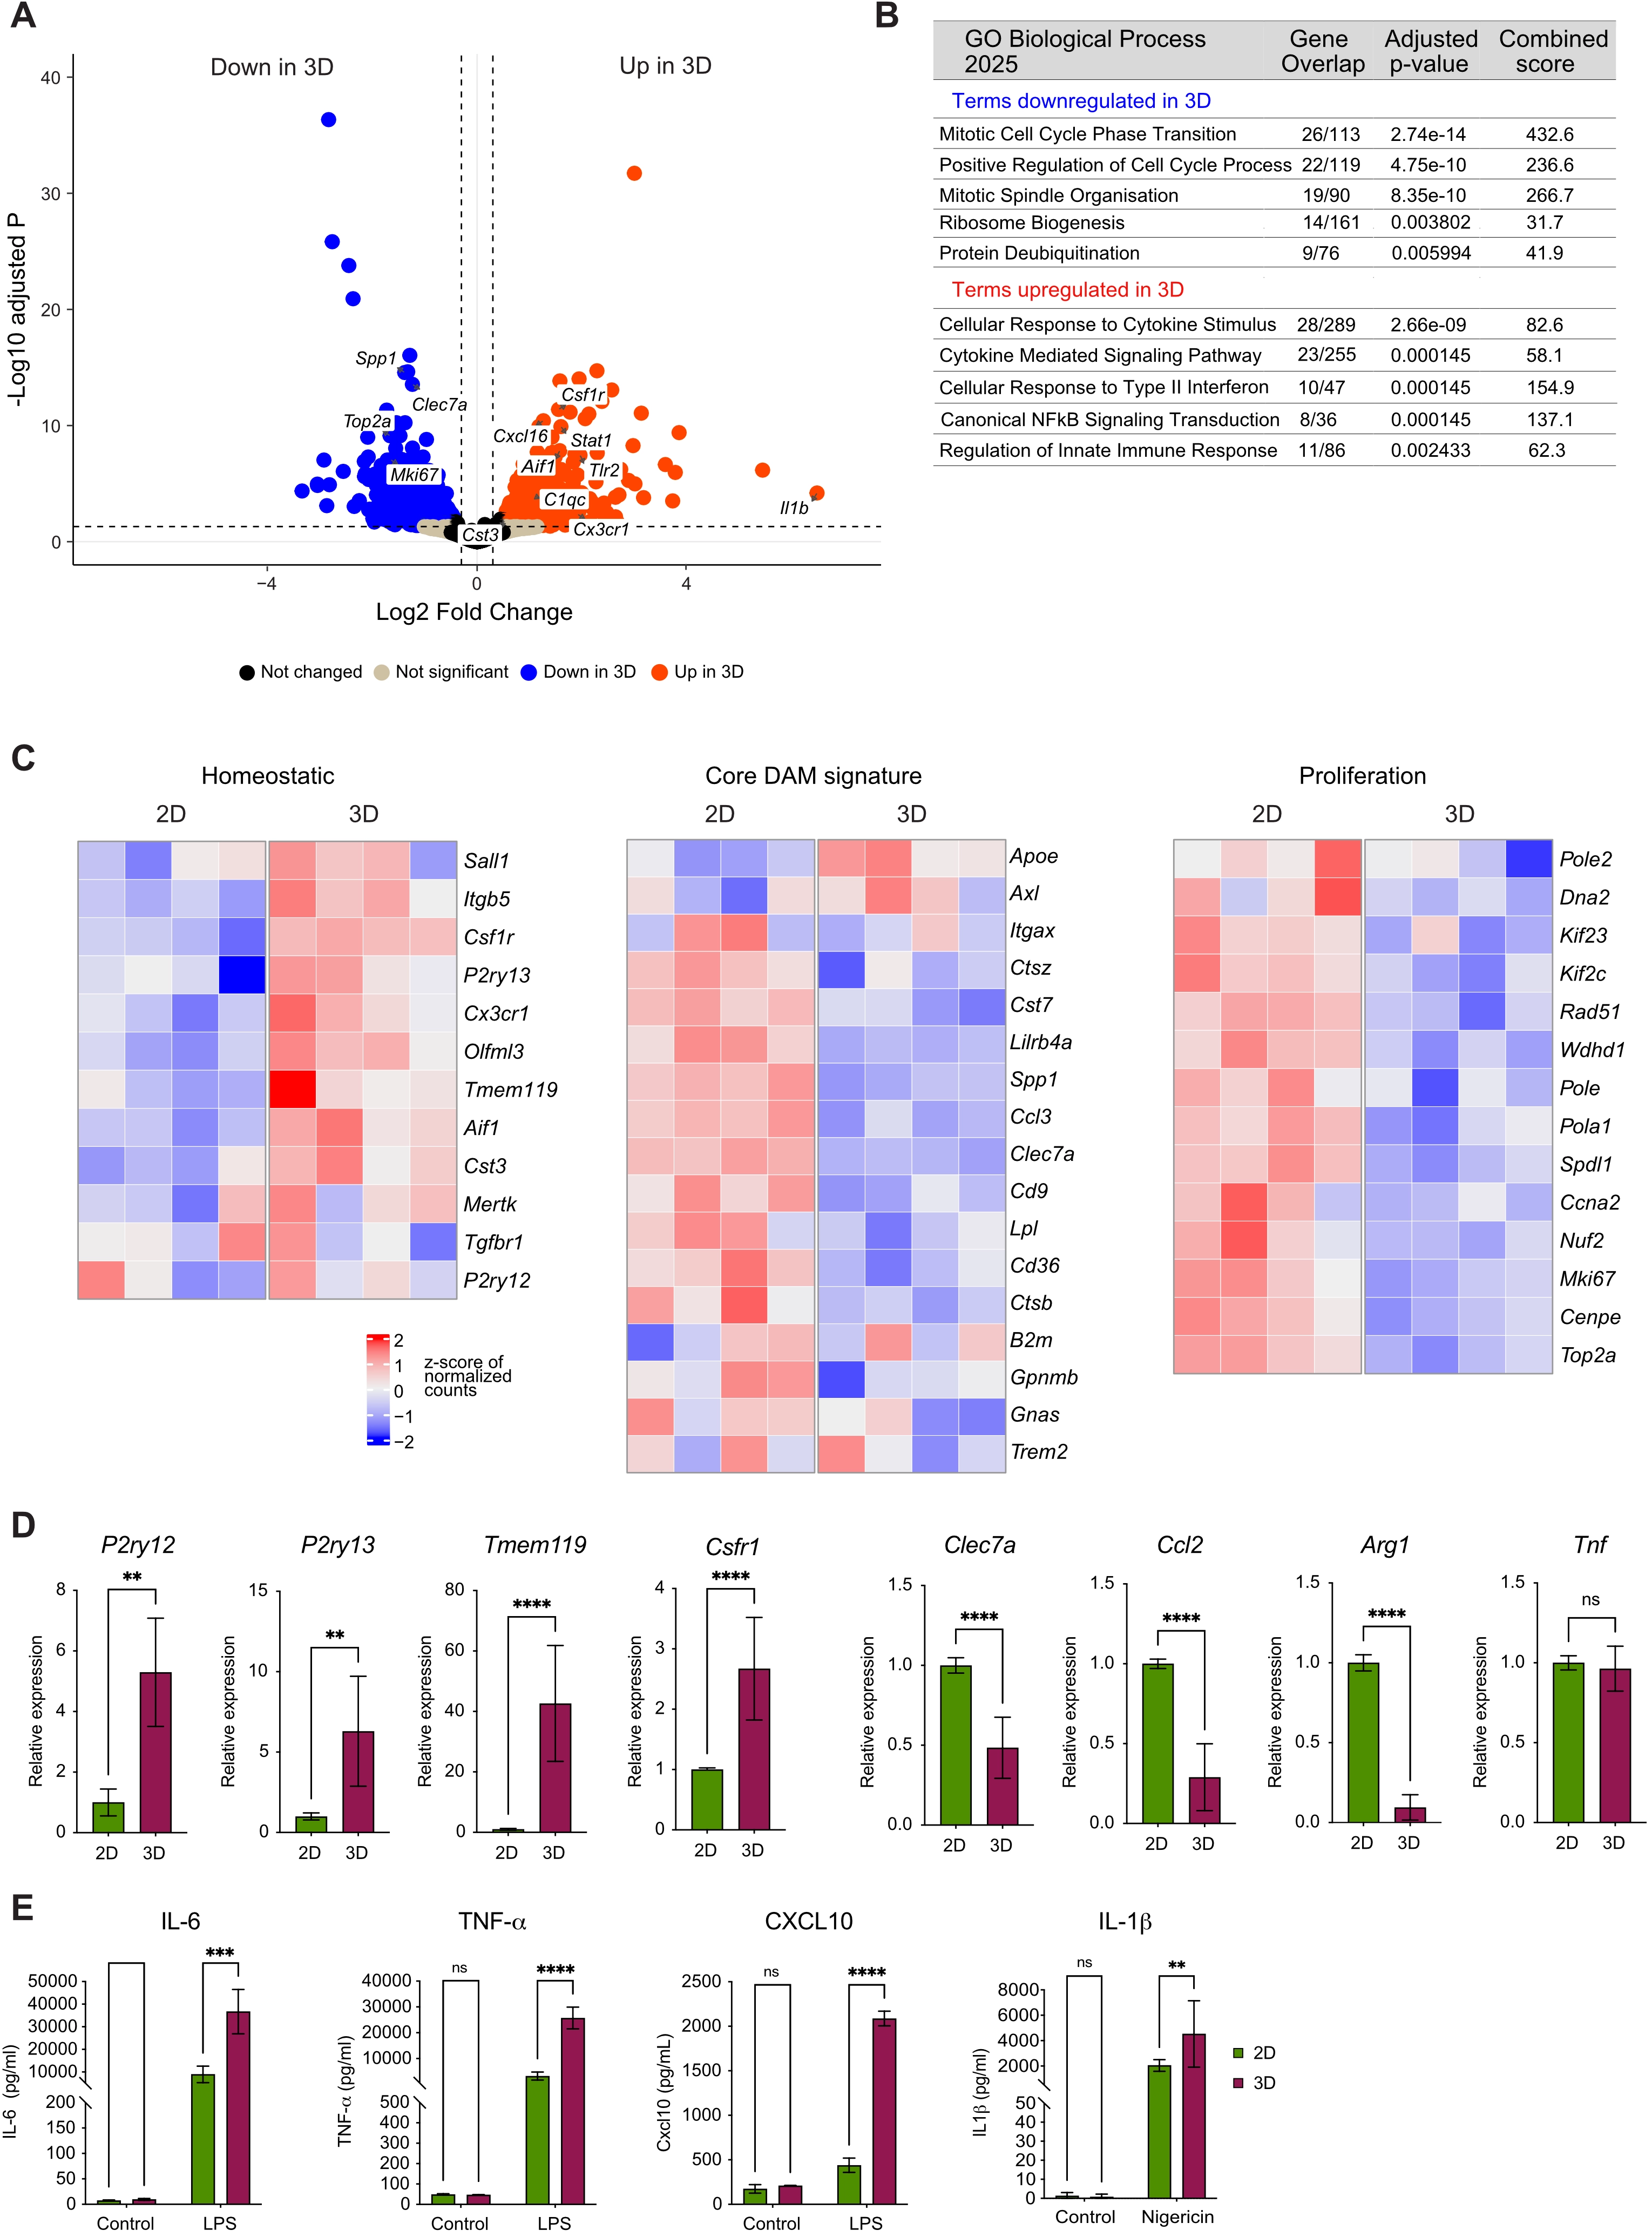
Figure 4. 3D culture drives transcriptional reprogramming in microglia. (A) Volcano plot of DEGs between microglia cultured in 2D and 3D. Each dot represents a transcript; horizontal dotted line = significance threshold (adjusted p < 0.05); x-axis = log2 fold change; y-axis = -log10 adjusted p. Red dots = upregulated in 3D compared to 2D; blue dots = downregulated in 3D compared to 2D; beige = not significant; (B) GO enrichment analysis of biological processes up- or downregulated in 3D cultures compared to 2D, showing gene overlap, adjusted p-value, and combined score; (C) Heatmaps showing row z-scores of homeostatic, core DAM signature, and proliferation genes in 2D vs. 3D cultures; (D) TaqMan qPCR analysis of microglial homeostatic genes (P2ry12, P2ry13, Tmem119, Csf1r) and proinflammatory genes (Clec7a, Ccl2, Arg1, Tnf) in 2D vs. 3D culture. Relative expression was calculated using the comparative Ct method. Two-way ANOVA followed by Tukey’s post-hoc test used for analysis. Data are mean ± SD, n = 9 from three independent experiments. ****p < 0.0001, **p < 0.01; (E) Microglial immune response to stimulation with LPS. Sandwich ELISA of cytokines (IL-6, TNF, CXCL10) after 24 h LPS (10 ng/ml) stimulation. Last panel: IL-1β secretion after priming with LPS (10 ng/ml, 3 h) followed by stimulation with nigericin (10 μM, 3 h). Two-way ANOVA followed by Tukey’s post-hoc test used for analysis. Data are mean ± SD, n = 9 from three independent experiments. ****p < 0.0001, ***p < 0.001, **p < 0.01. DEGs: differentially expressed genes; 2D: two-dimensional; 3D: three-dimensional; GO: gene ontology; DAM: disease-associated microglia; qPCR: quantitative polymerase chain reaction; ANOVA: analysis of variance; SD: standard deviation; LPS: lipopolysaccharide; ELISA: enzyme-linked immunosorbent assay; IL-6: interleukin-6; TNF: tumor necrosis factor; CXCL10: CXC motif chemokine ligand 10.
Microglia maintained in 3D culture exhibited pronounced downregulation of genes associated with proliferative activity, including Top2a, Mki67, Spdl1, and Cenpe, with corresponding biological processes significantly enriched in the gene ontology (GO) analysis (Figure 4B,C, Table S2,S3). In addition, 3D microglial cultures showed reduced expression of genes characteristic of the disease-associated microglia (DAM) signature[12,52,53], such as Spp1, Clec7a, Cd9, Gpnmb, Ctsb, Cd36, Lpl, Ccl3, Lilrb4a, and Cst7 (Figure 4A,C, Table S2). In contrast, 3D-cultured microglia displayed upregulation of homeostatic microglia signature genes[13,54,55], including Csf1r, Aif1, Cx3cr1, and Cst3 (Figure 4A, Table S2), with the full signature exhibiting a coherent pattern of increased expression (Figure 4C). These results were validated by qPCR, which confirmed elevated expression of canonical homeostatic markers (P2ry12, P2ry13, Tmem119, and Csf1r), alongside reduced expression of Clec7a, Ccl2, and Arg1 in 3D cultures (Figure 4D).
Notably, 3D-cultured microglia also exhibited increased expression of genes associated with immune regulation and cytokine signaling, including Il1b, Il10ra, Stat1, Nfkbia, Irf1, Tlr2, and Cxcl16 (Figure 4A,B,C, Table S2), alongside enrichment of related terms in the GO analysis (Figure 4B, Table S3), such as cytokine-mediated signaling, canonical NFkB signal transduction, and type-II interferon signaling. Consistent with this transcriptional profile, 3D-cultured microglia exhibited a significantly higher capacity to respond to inflammatory stimuli compared to 2D cultures. Following lLPS stimulation, 3D-cultured microglia displayed robust secretion of IL-6, TNF, and CXCL10, with elevated levels at 24 h post-stimulation, and significantly higher cytokine levels than in 2D cultures (Figure 4E). Additionally, nigericin stimulation resulted in IL-1 release that was significantly higher in 3D-cultured microglia (Figure 4E), mediated by NLRP3 inflammasome activation[56].
Collectively, these findings demonstrate that 3D culture promotes a transcriptional shift towards a homeostatic yet immune-responsive microglial phenotype. In contrast, 2D culture conditions are associated with elevated expression of core DAM signatures and proliferation-related genes.
4.4 Phenotypic and functional analysis of human 3D differentiated iMGLs culture
To evaluate if the 3D culture system, established for primary mouse microglia, is also suitable to study human iMGLs, we differentiated preMacs from human iPSCs lines into yolk-sac-like structures, which recapitulate the early developmental program of primitive hematopoiesis[14]. These preMacs were subsequently harvested and differentiated into iMGLs over 11 days, generated from four independent iPSC lines (iMGL1–4; see Methods), either in 2D culture or in 3D culture within a Matrigel–collagen matrix, similar to the 3D culture of primary microglia (Figure 5A). To confirm the suitability of this 3D culture system for studying iMGLs, we performed immunofluorescent staining for the pan macrophage marker IBA1. Differentiated cells (here shown for iMGL1) displayed robust IBA1 expression in both 2D and 3D culture conditions. In 3D-cultured iMGLs, the homeostatic microglial marker P2RY12 localized predominantly to the membrane, suggesting proper receptor trafficking, in contrast to its aberrant perinuclear accumulation in 2D cultures (Figure 5B). In addition, an increase in morphological complexity was observed in 3D cultures compared to 2D. 3D rendering of IBA1 and P2RY12 signals in both culture conditions further confirmed the transition of iMGLs from an amoeboid to a ramified morphology (Figure 5B). To quantify the morphological changes and assess the maturation status of the iMGLs, we performed morphometric analysis using MotiQ on IBA1-stained 2D- and 3D-cultured iMGL 2 and iMGL 3 (Figure 5C). The analysis revealed that 3D-cultured iMGLs displayed a markedly more complex cellular architecture than 2D-cultured iMGLs, characterized by a significantly higher ramification index, an increased spanned volume, a greater number of branches, and an increased total tree length (Figure 5D). These findings support the acquisition of a more mature, ramified morphology reminiscent of surveillance-competent microglia, which was further reflected in the actin organization (here shown for iMGL4). Particularly, when examining F-actin organization in iMGLs using phalloidin labeling, we observed pronounced morphological variability in 2D culture conditions. Similar to primary mouse microglia, 2D-cultured iMGLs displayed heterogeneous cell shapes accompanied by abundant and clearly defined podosomes (Figure 5E, top panel, filled arrows: podosomes), consistent with previous descriptions in macrophages and microglia[46,47]. In some cells, broad lamellipodial protrusions were also detectable (Figure 5E, top panel, arrowheads: lamellipodia), further highlighting the dynamic cytoskeletal organization in the planar environment. In contrast, iMGLs maintained in 3D culture exhibited enlarged podosome-like structures that were predominantly localized to the distal tips of cellular processes, where F-actin accumulated prominently (Figure 5E, bottom panel, empty arrows: podosome-like structures). This distinct spatial redistribution of F-actin suggests a 3D environment–driven reorganization of the actin cytoskeleton, potentially reflecting enhanced matrix interaction and surveillance-related functions[48].
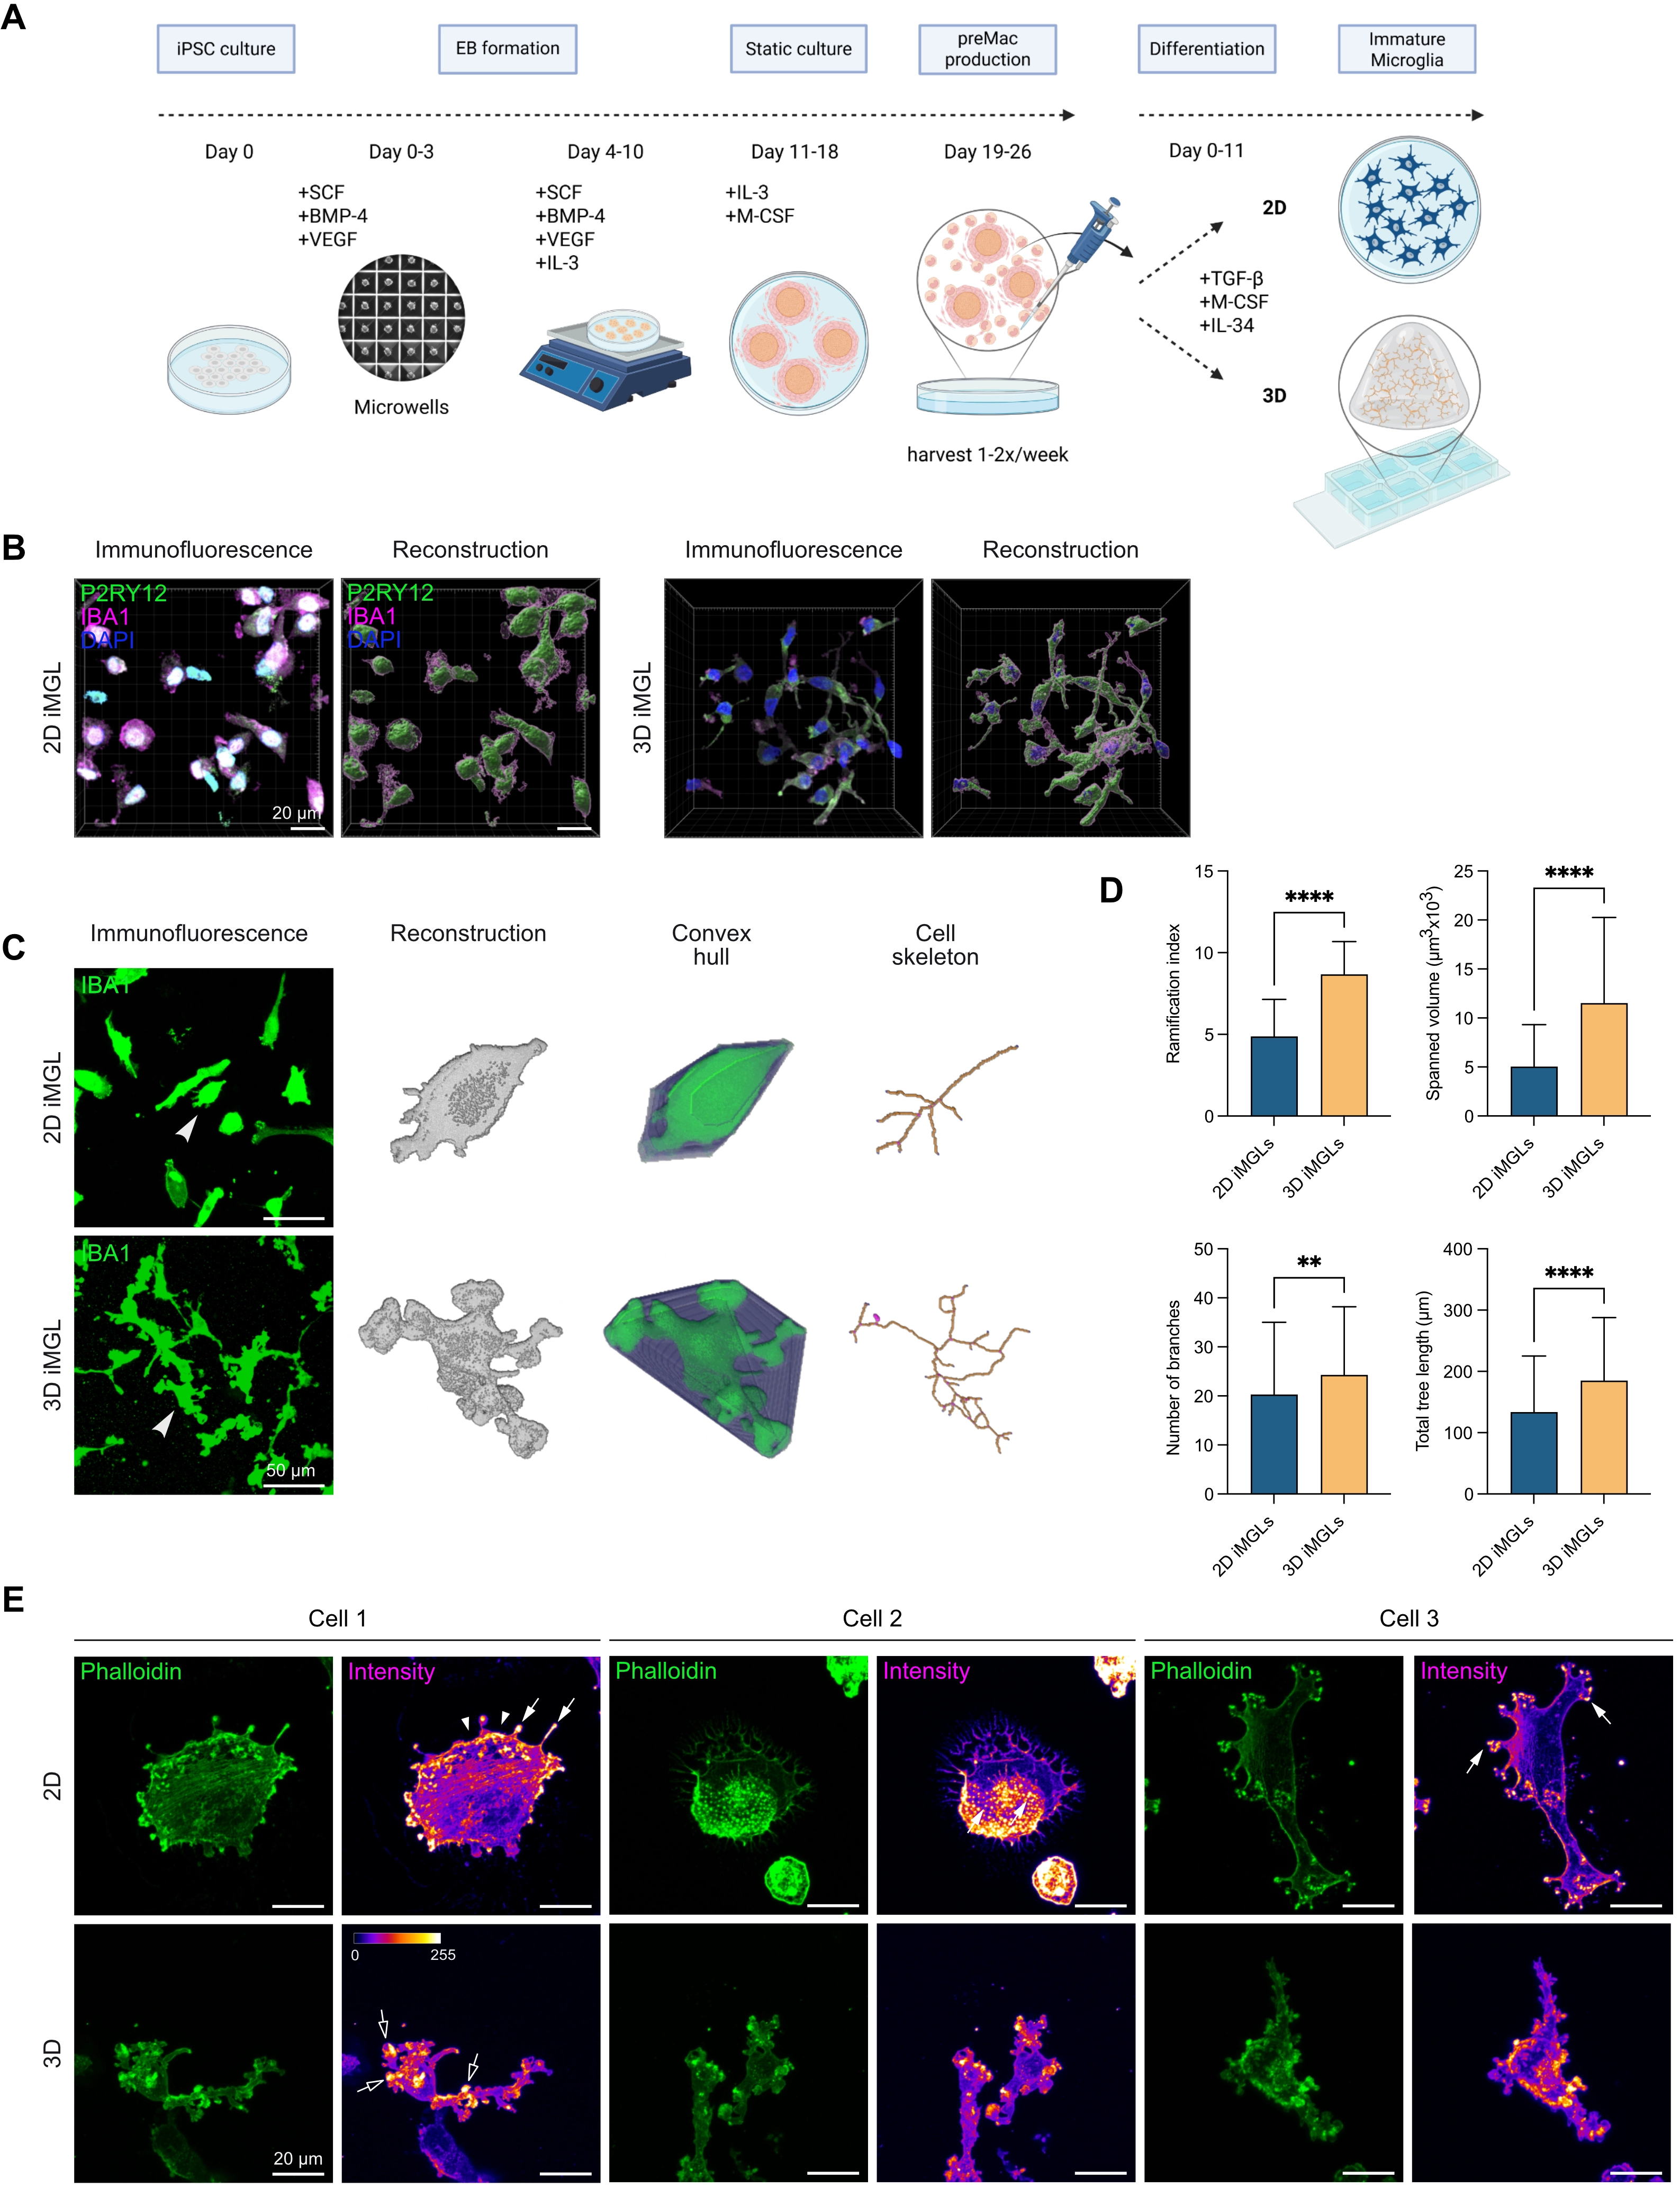
Figure 5. Higher microglial morphological complexity in iPSC-derived microglia cultured in 3D Matrigel–collagen matrix. (A) Workflow for iMGL differentiation from iPSCs via EBs to preMacs, followed by further differentiation into iMGLs in 2D or 3D culture; (B) Representative immunofluorescence image of iMGL 1 cultured in 2D or 3D with 3D reconstructions using Imaris. P2RY12 (green), IBA1 (magenta), nuclei (DAPI, blue). Scale bar = 20 µm; (C) Representative immunofluorescence images comparing iMGL 2 and iMGL 3 cultured in 2D vs. 3D for 11 days in iMGL medium stained with IBA1 (green). Arrowheads indicate cells shown on the right as 3D reconstructions, convex hulls, and skeletons analyzed using MotiQ. Scale bar = 50 µm; (D) Quantification of microglial morphological parameters in 2D vs. 3D iMGL cultures. Morphological features were quantified using MotiQ after 11 days cultured in 2D or 3D in iMGL medium. Parameters analyzed include ramification index, spanned volume, number of branches, and total tree length. Data represent mean ± SD from n = 2 independent experiments (108 cells for 2D-cultured iMGLs, and 166 cells for 3D-cultured iMGLs). Normality tested with Shapiro–Wilk; Mann-Whitney test used for analysis. ****p < 0.0001, **p < 0.01 (GraphPad Prism 10); (E) Fluorescence microscopy images of three cells stained with phalloidin to visualize the F-actin cytoskeleton (green) of iMGL 4. Signal intensity is shown using the Fire Look Up Table in Fiji. White arrowheads indicate lamellipodia; filled arrows indicate podosomes; empty arrows indicate podosome-like structures in 3D-cultured microglial cells. Scale bar = 20 µm. iPSC: human induced pluripotent stem cell; 3D: three-dimensional; iMGL: iPSC-derived microglial-like cells; EBs: embryoid bodies; preMacs: precursor macrophages; DAPI: 4′,6-diamidino-2-phenylindole; 2D: two-dimensional.
To better characterize the maturation and activation status of iMGLs under 2D vs. 3D culture conditions, we selected a flow cytometry panel of well-established myeloid and microglial surface markers for analysis. CD45, a pan-leukocyte marker, and CD11b, a myeloid adhesion receptor, were included, respectively, to confirm the immune identity of these cells[13]. MERTK, a receptor tyrosine kinase involved in efferocytosis and tissue homeostasis, served as an indicator of microglial phagocytic function[57]. HLA-DR represents a classical MHC class II molecule that reflects the antigen-presenting capacity and activation state of microglia[58]. CLEC7A was assessed as a pattern recognition receptor linked to immune sensing and phagocytic activity[59], while P2RY12, a purinergic receptor selectively expressed by homeostatic microglia, was included as a key marker of microglial identity and surveillance function[13,60]. We quantified surface protein expression by flow cytometry in iMGLs cultured in 2D and 3D, at baseline and after LPS stimulation, and compared these levels to preMacs to capture differentiation- and context-dependent regulation. To account for potential line-specific variability, we analyzed the expression of surface markers separately for iMGL 2 and iMGL 3. Despite variations in the culture conditions, all cell types displayed consistent expression levels of CD45 (Figure 6A,B). CD11b was generally reduced in differentiated iMGLs (Figure 6A,B). Notably, iMGL 2 showed a high baseline expression of CD11b in preMacs, whereas the other line did not exhibit such pronounced variations in CD11b expression across differentiation states. MERTK was downregulated upon LPS stimulation and was overall slightly reduced in unstimulated 3D cultures compared to 2D, indicating that matrix-dependent differences may influence baseline protein expression (Figure 6A,B). HLA-DR remained largely stable across conditions but was significantly upregulated in 3D + LPS-treated iMGL 3 compared to the corresponding 2D condition, indicating modest responsiveness under 3D differentiation. This subtle regulation is in line with previous reports showing that microglial HLA-DR (and related MHC class II molecules) is primarily induced by IFN-γ rather than by LPS stimulation, which typically exerts minimal effects on its expression[61,62]. CLEC7A was significantly reduced in both 3D and 3D + LPS cultures relative to the preMac stage, while remaining comparable to 2D cultures. P2RY12 characteristic of homeostatic microglia, was significantly increased in iMGL 2 in 3D compared to both preMacs and 2D conditions, and remained high and not significantly altered upon LPS stimulation, indicating a stable homeostatic-like expression under 3D conditions. In contrast, iMGL 3 showed a modest elevation of P2RY12 following LPS stimulation in 2D when compared to the preMac state. These results highlight a context- and cell line-dependent regulation of microglial surface markers under inflammatory challenge. To further characterize phenotypic differences, we investigated the expression of OPN (SPP1), a marker associated with DAM states[63], by immunolabeling and found it to be reduced in 3D-cultured iMGL 2 and iMGL 3 compared to 2D (Figure 6C, shown for iMGL 2), suggesting a shift to a less activated microglial state under 3D conditions.
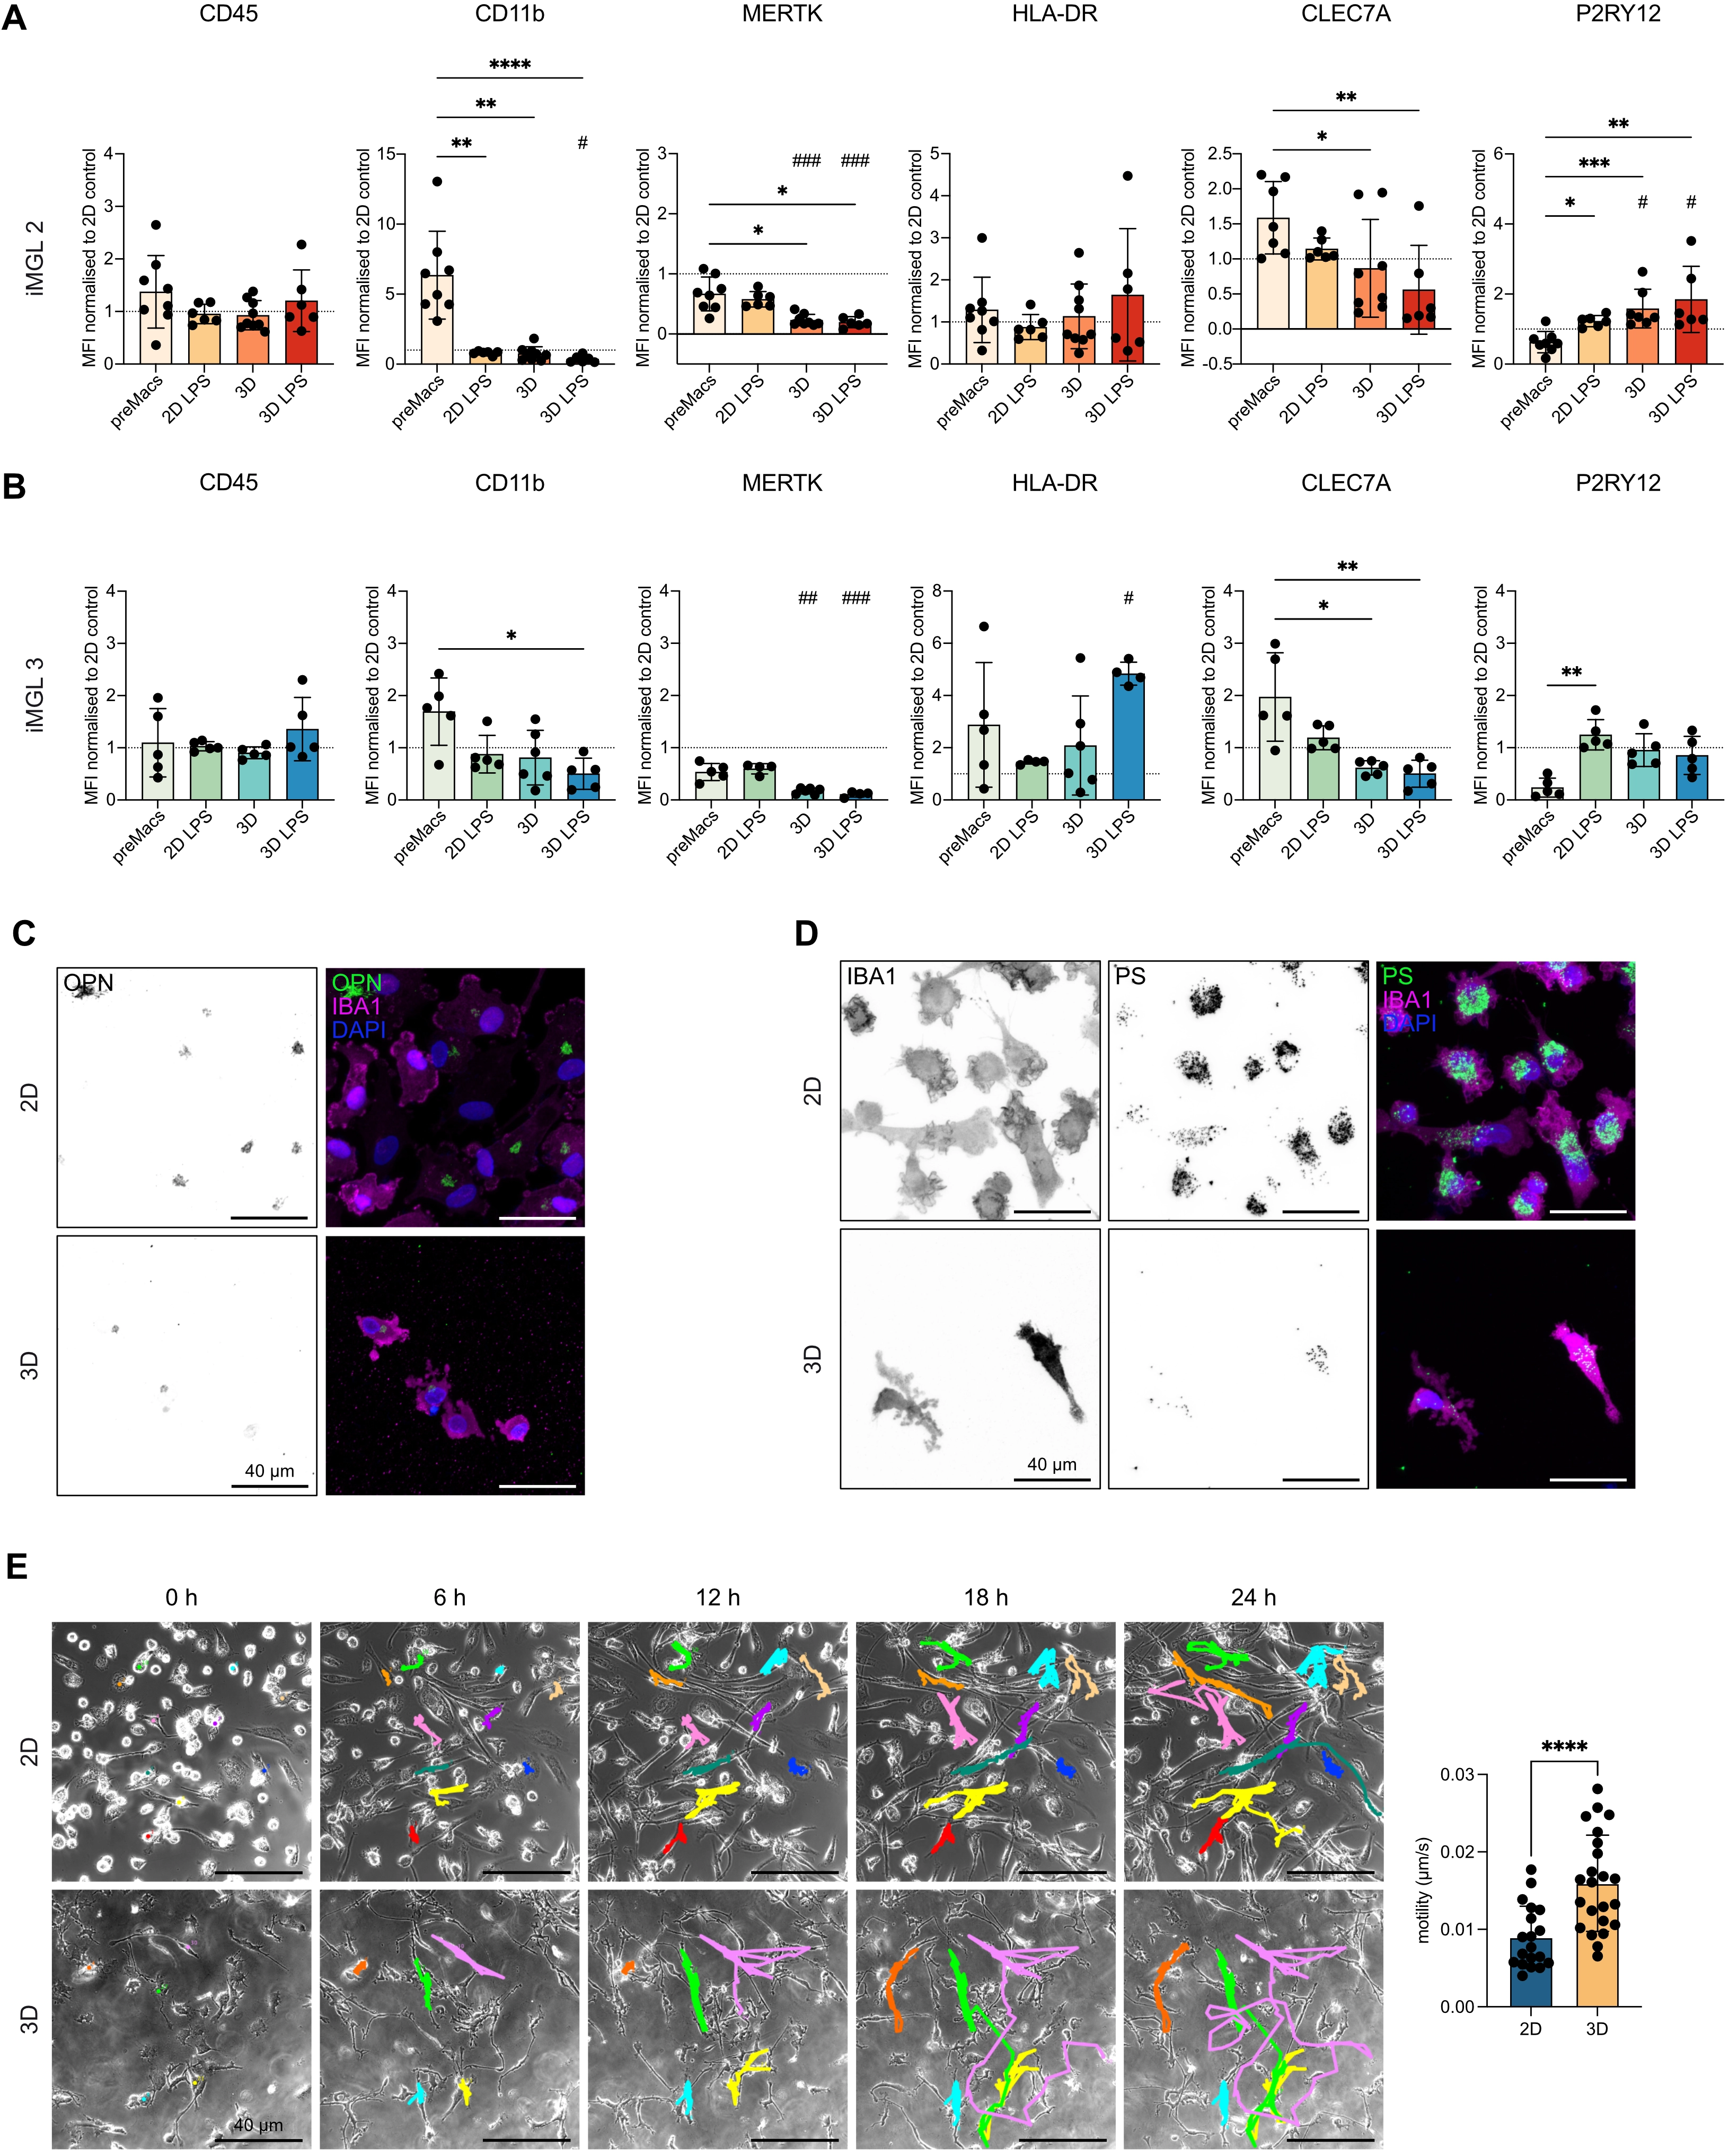
Figure 6. 3D culture modulates microglial surface marker expression and functional responses in a cell line-dependent manner. (A) Flow cytometry analysis of iMGL 2. PreMacs (before differentiation), iMGLs in 2D (11 days) with or without 24 h LPS (200 ng/ml), and iMGLs in 3D (11 days) with or without 24 h LPS. Surface markers: CD45, CD11b, MERTK, HLA-DR, CLEC7A, P2RY12. Median fluorescence intensity normalized to 2D iMGLs control. Data are mean ± SD. Outliers excluded by ROUT’s method. Normality tested with Shapiro–Wilk; Kruskal–Wallis used for analysis. ****p < 0.0001, ***p < 0.001, **p < 0.01, *p < 0.05. n = 6-9 independent experiments. Hashtags indicate significance vs. 2D control: ###p < 0.001, #p < 0.05; (B) Flow cytometry analysis of iMGL 3 under the same conditions as in (A). Data are mean ± SD, analyzed as above. **p < 0.01, *p < 0.05. n = 4-6 independent experiments. Hashtags indicate significance vs. 2D control: ###p < 0.001, ##p < 0.01, #p < 0.05; (C) Representative immunofluorescence image of iMGL 2 cultured in 2D or 3D. Left: OPN single channel (inverted), right: merged channels with labeled OPN (green), IBA1 (magenta), nuclei (DAPI, blue). Scale bar = 40 µm; (D) Representative immunofluorescence images of iMGL 2 cultured in 2D or 3D after phagocytosis of 500 nm fluorescent PS microspheres (green). Left: IBA1 single channel (inverted), middle: PS microspheres (inverted), right: merged channels with labeled IBA1 (magenta), PS microspheres (green), and nuclei with DAPI (blue). Scale bar = 40 µm; (E) Live-cell imaging of iMGL 1 and iMGL 3 migration in 2D vs. 3D. Left: Representative time series of iMGL 3 (0, 6, 12, 18, 24 h). Colored lines indicate cell tracks using MTrackJ. Right: quantification of motility (µm/s) in 2D vs. 3D. Data represent mean ± SD from n = 2 independent experiments (19 cells for 2D, 23 cells for 3D-cultured iMGLs). Normality tested with Shapiro–Wilk; Welch’s t tests used for analysis. ****p < 0.0001 (GraphPad Prism 10). 3D: three-dimensional; iMGL: iPSC-derived microglial-like cells; 2D: two-dimensional; LPS: lipopolysaccharide; SD: standard deviation; HLA: human leukocyte antigen; OPN: osteopontin; PS: polystyrene; DAPI: 4′,6-diamidino-2-phenylindole.
iMGLs maintained their phagocytic capacity across conditions, as shown by efficient particle uptake, although after 24 h, 3D-cultured iMGLs engulfed fewer microspheres (Figure 6D), most likely because the surrounding matrix limits microsphere diffusion and accessibility to embedded cells. Microsphere penetration into the gel was confirmed by confocal imaging. Live-cell imaging under unstimulated conditions revealed that while iMGLs in 2D exhibited limited movement, cells in 3D showed pronounced migration throughout the Matrigel-collagen matrix in x, y, and z, involving both processes and full cell body translocation (Figure 6E). Together, these data confirm that the 3D Matrigel-collagen matrix supports the differentiation and functional maturation of iMGLs in general but reveals cell line-specific immune responses. The enhanced morphological complexity, preserved phagocytic capacity, and distinct motility patterns in 3D, underscoring the utility of this model to study human microglial behavior in a tissue-like environment.
5. Discussion
Establishing in vitro systems that reflect in vivo properties of microglia is crucial for studying brain immune function and disease-associated perturbations[12,64]. Here, we describe a minimal and robust 3D culture approach that supports microglial morphological and phenotypic maturation in monoculture.
Within 24 h, primary mouse microglia cultured in a composite matrix of Matrigel and collagen, in contrast to cells cultured in 2D, adopt a ramified morphology that more closely resembles homeostatic cells in the brain parenchyma. This phenotype was superior to that observed in simplified matrices, consistent with earlier findings highlighting the role of matrix composition and mechanical cues in regulating microglial structure[65,66]. Our system also enables the successful differentiation of human iPSC-derived iMGLs in 3D, offering a versatile platform for translational studies[14,67]. Microglial morphology in 3D was accompanied by actin cytoskeletal reorganization. While 2D-cultured microglia displayed prominent podosomes, lamellipodia at the leading edge, and a heterogeneous morphology, features consistent with a migratory and activated state[46,48,69], cells cultured in 3D adopted a more uniform morphology and formed podosome-like structures exclusively at their terminal cell processes that were enriched in F-actin. Although direct evidence for this specific phenotypic transition in microglia is limited, analogous morphological shifts in other cell types have been associated with surveillance-like behavior[48,70]. In microglia, this structural reorganization may reflect an adaptation to the 3D matrix environment and potentially enhance their capacity for environmental monitoring. Given that the microglial cytoskeleton is altered during aging and in disease[71,72], and that these changes can influence microglial function, it will be important to conduct functional studies examining the role of the cytoskeleton in cultured microglia using 3D rather than 2D culture systems. Consistent with these differences in cytoskeletal organization, we observed strong differences in motility. Mouse microglia in 3D showed dynamic process extension and retraction but remained largely stationary in terms of soma translocation, mirroring their in vivo surveillance function[8,44]. This mode of movement enables microglia to monitor their surroundings without disrupting tissue architecture and is considered a hallmark of their physiological role[73].
The confinement of soma motility in 3D, alongside continuous process remodeling, underscores the relevance of our system for modeling parenchymal microglia[74]. In contrast to the largely stationary phenotype of primary mouse microglia, which primarily extend and retract processes without extensive soma translocation, human iMGLs exhibited pronounced whole-cell migration within the 3D matrix, actively translocating their somata in concert with process extension. This behavior was observed under unstimulated conditions and may be attributed, in part, to the markedly longer exposure of iMGLs to the matrix during their 11-day differentiation period, compared to the 24-hour culture of primary mouse microglia.
Extended residence within the matrix may permit progressive cell–matrix interactions through podosome formation and extracellular matrix remodeling, processes that have been linked to the expression of matrix metalloproteinases, including MMP-2, MMP-9, and MMP-14, which are known to degrade collagen and laminin and could facilitate increased tissue penetration and migration[75-77]. Additionally, species-specific differences in microglial responsiveness to matrix cues and purinergic signaling may contribute to the observed motility patterns[7,20,60,78-80]. However, these differences should be interpreted cautiously, as primary mouse microglia and iMGLs differ substantially in their developmental history. Whereas primary microglia undergo embryonic development and maturation within the brain before isolation, iMGLs acquire microglial identity through in vitro differentiation from preMacs[81]. Consequently, differences in motility may reflect not only species-specific biology and differences in matrix exposure duration but also differences in maturation state.
P2RY12 is a key marker of microglial identity and surveillance function under physiological conditions[13]. In rodent models, inflammatory activation is commonly associated with P2RY12 downregulation[60,82]. In line with this, we observed higher P2ry12 expression in primary mouse microglia cultured in 3D compared to 2D conditions. However, increasing evidence indicates that P2RY12 regulation is more context-dependent than previously assumed. In mouse models of neurodegeneration, P2RY12 downregulation is spatially restricted, with microglia distant from amyloid plaques retaining expression[52]. Importantly, studies in human brain tissue demonstrate that P2RY12 expression can be maintained in distinct microglial subpopulations even at advanced disease stages, challenging the assumption that microglial activation uniformly entails P2RY12 loss[83,84]. Beyond changes in expression levels, P2RY12 localization appears to be context-dependent. In addition, in human iMGLs cultured under 2D conditions, we observed a pronounced perinuclear accumulation of P2RY12 rather than the expected membrane-associated localization. A shift in P2RY12 subcellular distribution has previously been described in human gliomas, with predominantly cytoplasmic localization in low-grade tumors and nuclear localization in high-grade tumors, the latter being associated with CD163 expression[85]. Although described in a tumor context, these findings support the notion that P2RY12 localization is not static and may vary with cellular state. Electrophysiological and transcriptional analyses provided further evidence that microglia acquire a more homeostatic phenotype under 3D culture conditions. Electrophysiologically, primary mouse microglia cultured in 3D showed reduced inward and outward currents at hyperpolarized and depolarized potentials, a profile consistent with a less reactive, surveillant state[86-88]. Resting microglia are characterized by low membrane conductance and weak K+ currents, while activated states induce larger, often outward rectifying K+ or Cl- currents[89]. Consistent with this concept, microglia cultured in 3D exhibited significantly higher input resistance than microglia cultured in 2D, indicating lower overall membrane conductance and supporting a more homeostatic electrophysiological phenotype. This interpretation is consistent with previous electrophysiological studies showing that resting microglia in situ display relatively low membrane conductance and high input resistance, whereas activation is associated with the induction of voltage-dependent ion currents and a reduction in membrane resistance due to increased channel activity. Accordingly, the reduced inward and outward current densities together with the elevated input resistance observed in 3D-cultured microglia are consistent with an electrophysiological profile that is more homeostatic and less activated than that observed in conventional 2D cultures[51,86,89].
Mouse microglia cultured in 2D exhibited elevated expression of proliferation-associated genes as well as transcripts commonly linked to pathological activation[52,53]. In contrast, 3D culture promoted increased expression of homeostatic microglial signature genes, together with genes involved in cytokine production, cytokine responsiveness, and immune signaling pathways. Consistent with this transcriptional profile, 3D-cultured mouse microglia retained their capacity to respond to inflammatory stimuli, including LPS and nigericin. Significant differences in transcriptional profiles between 2D and 3D culture systems have previously been reported across multiple cell types, including cancer cell lines[90] and epithelial cells[91], highlighting the fundamental role of the 3D environment in shaping gene expression. Notably, several of these studies, consistent with our findings, demonstrated that transcriptomes of cells cultured in 3D more closely resemble their in vivo phenotypes[91,92]. Furthermore, studies on human monocyte-derived macrophages[93] corroborate the influence of 3D culture conditions on the expression of genes that modulate inflammatory pathways. Nevertheless, the present system represents a simplified model, as microglia were maintained in monoculture to study microglia-specific responses and therefore lack the complex interactions with neurons, astrocytes, oligodendrocytes, and vascular cells that are known to shape microglial identity in vivo[94]. The extent to which the observed transcriptional changes would be maintained in a multicellular environment remains to be determined.
In iMGLs, we observed a similar shift toward a homeostatic phenotype on the molecular level. Despite an overall shift toward a homeostatic profile in 3D, MERTK expression was reduced under 3D conditions, and this lower level was maintained after LPS stimulation, indicating that inflammatory activation did not further affect MERTK expression. A similar decrease was observed after LPS stimulation in 2D. However, this pattern resembles findings in primary rodent microglia, where LPS exposure typically downregulates Mertk while inducing Axl expression, reflecting altered Tyro3, Axl, and Mer receptor signaling under inflammatory conditions[95]. In contrast, the regulation of MERTK in human iPSC-derived microglia remains poorly characterized, and the functional relevance of reduced expression in 3D is not yet understood. Whether lower MERTK levels affect efferocytosis in 3D therefore remains unresolved[96]. Nevertheless, we showed that microglia retained robust phagocytic activity in 3D, indicating that alternative uptake mechanisms are active.
Finally, our system enabled the study of human iMGLs under tissue-like conditions. The morphological complexity, dynamic motility, and preserved marker expression observed in 3D-cultured iMGLs support their functional maturation. At the same time, iMGLs still represent a comparatively immature microglial state, and achieving full maturation would likely require additional maturation factors and extended culture, which we deliberately omitted to preserve the simplicity and accessibility of the system[97]. Interestingly, the response of iMGLs to LPS varied between cell lines, underscoring the importance of donor-specific variability in iPSC-based models[22,98]. Notably, the increased expression of microglial identity markers such as P2RY12 in 3D, alongside reduced CLEC7A and stable HLA-DR expression, indicates that the 3D environment favors a physiologically relevant, surveillance-competent state.
Our findings demonstrate that embedding microglia in a defined 3D matrix environment promotes key morphological and functional features associated with homeostatic microglia, including enhanced ramification, stable expression of core identity markers such as P2RY12, and preserved phagocytic capacity. Accordingly, our 3D culture system offers a simple yet robust platform to investigate microglial biology across species in a defined environment. Beyond its immediate application as an in vitro model, future studies could explore whether microglia differentiated within the 3D matrix can be recovered and utilized for downstream applications, including patient-specific disease modeling[99-101] and high-throughput drug screening[102,103], as well as transplantation-based or in vivo approaches. Taken together, by more closely mimicking in vivo-like microglial states, this system holds substantial promise for advancing both fundamental research and translational applications.
6. Limitations
Despite these strengths, several limitations of the present system should be acknowledged. The presented 3D culture system offers broad applicability for experimental manipulation, including genetic and pharmacological approaches; nevertheless, certain technical constraints should be acknowledged. The Matrigel–collagen matrix provides a biologically supportive environment but contains complex and partially undefined components[104,105], making it difficult to identify the specific matrix-derived signals responsible for the observed phenotypes. In primary mouse microglia, microspheres did not penetrate the matrix within the 24 h culture period, likely because the matrix was still too dense to allow their entry, precluding assessment of phagocytic uptake in 3D. In iMGLs, the longer culture period allowed microspheres to enter the matrix, and confocal imaging confirmed their uptake; however, because penetration into the matrix cannot be controlled and equal exposure of all cells cannot be ensured, these data are inherently qualitative and were not used for quantitative comparison. In addition, primary mouse microglia were maintained in the matrix for only 24 h, whereas iMGLs were differentiated directly within the matrix over 11 days. This difference in experimental design not only limits conclusions regarding long-term adaptation, as the observed changes reflect a relatively acute phase of adaptation to the 3D environment, but also restricts direct comparability between the two species. A further consideration is that no 2D versus 3D transcriptomic comparison was performed for iMGLs, leaving the molecular adaptation of the human model in 3D less fully characterized than that of mouse microglia. Finally, recovery of cells from the matrix required dissociation with collagenase followed by cold buffer washes to dissolve residual Matrigel. Collagenase is considered a mild dissociation agent that largely preserves surface protein expression, in contrast to more aggressive proteases such as trypsin[106], suggesting that the impact on the surface markers analyzed here was likely minimal. Taken together, these constraints largely reflect the technical demands inherent to working with a 3D matrix rather than fundamental shortcomings of the model, and the system reliably and reproducibly promoted homeostatic microglial features across both species.
7. Conclusion
Our study demonstrates that the physical microenvironment critically shapes microglial phenotype and behavior. Embedding microglia in a 3D culture matrix promotes key features of homeostatic cells, including increased morphological complexity, more in vivo-like motility, stable expression of core identity markers, and preserved functional responses. By providing structural cues that more closely resemble the brain parenchyma, this simple and robust culture system bridges the gap between conventional 2D cultures and more complex in vivo models, offering a versatile platform to study microglial biology and enabling applications such as patient-specific disease modeling and drug screening.
Supplementary materials
The supplementary material for this article is available at: Supplementary materials.
Acknowledgements
We thank Eduard Schmidt for his excellent technical assistance and Caghan Kizil for kindly providing StarPEG. We would also like to thank the Animal Research Facility and the Light Microscopy Facility of the DZNE Bonn and the Flow Cytometry Core Facility of the Mathematical and Natural Sciences Faculty for providing support and instrumentation funded by the Deutsche Forschungsgemeinschaft (DFG, German Research Foundation) - project number 341039622.
The authors used ChatGPT (OpenAI) and DeepL for language correction and proofreading. Thereafter, the authors take full responsibility for the integrity, originality, and accuracy of the work.
Authors contribution
Husch A: Investigation, formal analysis, writing-review & editing.
Tambe BA, Mayer ML, Kozlov S: Investigation, formal analysis, writing-original draft, writing-review & editing.
Blank-Stein N: Conceptualization, investigation, formal analysis, writing-original draft, writing-review & editing.
Händler K: Investigation, writing-review & editing.
Beyer MD: Investigation, funding acquisition, supervision, writing-review & editing.
Halle A: Conceptualization, formal analysis, funding acquisition, supervision, writing-original draft, writing-review & editing.
Bradke F: Funding acquisition, supervision, writing-review & editing.
Mass E: Conceptualization, funding acquisition, supervision, writing-review & editing.
Conflicts of interest
The authors declare no conflicts of interest.
Ethical approval
Mouse breeding was carried out in accordance with European Union guidelines and approved by the Veterinary Office of the City of Bonn, Germany (Approval No. 56-2 and 67-5-2022/23). Ethical approval for the use of the human iPSC lines was granted by the Ethics Committee of the Medical Faculty of the Rheinische-Friedrichs-Wilhelms-Universität Bonn (Reference: 2024-140). The CRTDi004-A iPSC line, used in this study, was generated at the Center for Regenerative Therapies at TU Dresden, Germany. The material is fully anonymized. All iPSC lines are registered in the Human Pluripotent Stem Cell Registry (hPSCreg), with the following registration codes: CRTDi004-A (iMGL 1), SCTi003-A (iMGL 2), USCFi001-A (iMGL 3) and SCVi028-A (iMGL 4).
Consent to participate
Informed consent was obtained from all participants.
Consent for publication
Not applicable.
Availability of data and materials
Data supporting the findings of this study are available from the supplementary materials and corresponding authors upon reasonable request.
Funding
This study was supported by Germany’s Excellence Strategy-EXC2151-390873048 (to Frank Bradke, Marc D. Beyer, Elvira Mass), FOR5775 (Grant No. 533863915 to Elvira Mass). The work in A. Halle’s group has been supported by the German Center for Neurodegenerative Diseases (DZNE) and the German Research Foundation (DFG) under Priority Program SPP2395 (Grant Nos. HA 6727/2-1 and HA 6727/2-2 to Andreas Husch). The work in Elvira Mass’s group has been supported by the European Research Council (ERC) under the European Union’s Horizon 2020 research and innovation program (ERC-StG NanoGlia Grant No. 851257 to Elvira Mass). Frank Bradke is supported by the German Center for Neurodegenerative Diseases (DZNE), the International Foundation for Research in Paraplegia, Wings for Life, ERANET AXON REPAIR, ERANET RATER SCI and Chan-Zuckerberg Initiative (CZI) (These programs do not have grant numbers). Frank Bradke is also funded by the Deutsche Forschungsgemeinschaft (DFG, German Research Foundation)–Project-ID 227953431–SFB 1089, SFB 1690 as well as SFB 1158 and SPP 2395. Frank Bradke is a member of the iBehave NRW network and a recipient of the Roger de Spoelberch Prize. Marc D. Beyer is supported by the Helmholtz Association and the German Research Foundation (DFG) (SFB1454 Grant No. 432325352, IGK2168/2 Grant No. 272482170). Marc D. Beyer, Elvira Mass, Frank Bradke and Annett Halle are members of the Excellence cluster ImmunoSensation2 (EXC2151 Grant No. 390873048).
Copyright
© The Author(s) 2026.
References
-
1. Prinz M, Jung S, Priller J. Microglia biology: One century of evolving concepts. Cell. 2019;179(2):292-311.[DOI]
-
2. Prinz M, Priller J. Microglia and brain macrophages in the molecular age: From origin to neuropsychiatric disease. Nat Rev Neurosci. 2014;15(5):300-312.[DOI]
-
4. Mass E, Ballesteros I, Farlik M, Halbritter F, Günther P, Crozet L, et al. Specification of tissue-resident macrophages during organogenesis. Science. 2016;353(6304):aaf4238.[DOI]
-
5. Ginhoux F, Greter M, Leboeuf M, Nandi S, See P, Gokhan S, et al. Fate mapping analysis reveals that adult microglia derive from primitive macrophages. Science. 2010;330(6005):841-845.[DOI]
-
6. Hammond TR, Dufort C, Dissing-Olesen L, Giera S, Young A, Wysoker A, et al. Single-cell RNA sequencing of microglia throughout the mouse lifespan and in the injured brain reveals complex cell-state changes. Immunity. 2019;50(1):253-271.[DOI]
-
7. Masuda T, Sankowski R, Staszewski O, Böttcher C, Amann L, Sagar , et al. Spatial and temporal heterogeneity of mouse and human microglia at single-cell resolution. Nature. 2019;566(7744):388-392.[DOI]
-
8. Nimmerjahn A, Kirchhoff F, Helmchen F. Resting microglial cells are highly dynamic surveillants of brain parenchyma in vivo. Science. 2005;308(5726):1314-1318.[DOI]
-
9. Salter MW, Stevens B. Microglia emerge as central players in brain disease. Nat Med. 2017;23(9):1018-1027.[DOI]
-
10. Colonna M, Butovsky O. Microglia function in the central nervous system during health and neurodegeneration. Annu Rev Immunol. 2017;35:441-468.[DOI]
-
11. Stratoulias V, Venero JL, Tremblay MÈ, Joseph B. Microglial subtypes: Diversity within the microglial community. EMBO J. 2019;38(17):EMBJ2019101997.[DOI]
-
12. Bohlen CJ, Bennett FC, Tucker AF, Collins HY, Mulinyawe SB, Barres BA. Diverse requirements for microglial survival, specification, and function revealed by defined-medium cultures. Neuron. 2017;94(4):759-773.[DOI]
-
14. Haenseler W, Sansom SN, Buchrieser J, Newey SE, Moore CS, Nicholls FJ, et al. A highly efficient human pluripotent stem cell microglia model displays a neuronal-co-culture-specific expression profile and inflammatory response. Stem Cell Rep. 2017;8(6):1727-1742.[DOI]
-
15. Banerjee P, Paza E, Perkins EM, James OG, Kenkhuis B, Lloyd AF, et al. Generation of pure monocultures of human microglia-like cells from induced pluripotent stem cells. Stem Cell Res. 2020;49:102046.[DOI]
-
16. Brownjohn PW, Smith J, Solanki R, Lohmann E, Houlden H, Hardy J, et al. Functional studies of missense TREM2 mutations in human stem cell-derived microglia. Stem Cell Rep. 2018;10(4):1294-1307.[DOI]
-
17. Schafer ST, Mansour AA, Schlachetzki JCM, Pena M, Ghassemzadeh S, Mitchell L, et al. An in vivo neuroimmune organoid model to study human microglia phenotypes. Cell. 2023;186(10):2111-2126.[DOI]
-
18. Xu R, Li X, Boreland AJ, Posyton A, Kwan K, Hart RP, et al. Human iPSC-derived mature microglia retain their identity and functionally integrate in the chimeric mouse brain. Nat Commun. 2020;11:1577.[DOI]
-
19. Fattorelli N, Martinez-Muriana A, Wolfs L, Geric I, De Strooper B, Mancuso R. Stem-cell-derived human microglia transplanted into mouse brain to study human disease. Nat Protoc. 2021;16(2):1013-1033.[DOI]
-
20. Abud EM, Ramirez RN, Martinez ES, Healy LM, Nguyen CHH, Newman SA, et al. iPSC-derived human microglia-like cells to study neurological diseases. Neuron. 2017;94(2):278-293.[DOI]
-
21. Santos TE, Schaffran B, Broguière N, Meyn L, Zenobi-Wong M, Bradke F. Axon growth of CNS neurons in three dimensions is amoeboid and independent of adhesions. Cell Rep. 2020;32(3):107907.[DOI]
-
22. Rouhani F, Kumasaka N, de Brito MC, Bradley A, Vallier L, Gaffney D. Genetic background drives transcriptional variation in human induced pluripotent stem cells. PLoS Genet. 2014;10(6):e1004432.[DOI]
-
23. Kajiwara M, Aoi T, Okita K, Takahashi R, Inoue H, Takayama N, et al. Donor-dependent variations in hepatic differentiation from human-induced pluripotent stem cells. Proc Natl Acad Sci U S A. 2012;109(31):12538-12543.[DOI]
-
24. Kilpinen H, Goncalves A, Leha A, Afzal V, Alasoo K, Ashford S, et al. Common genetic variation drives molecular heterogeneity in human iPSCs. Nature. 2017;546(7658):370-375.[DOI]
-
25. Yamanaka S. Pluripotent stem cell-based cell therapy: Promise and challenges. Cell Stem Cell. 2020;27(4):523-531.[DOI]
-
26. Carcamo-Orive I, Hoffman GE, Cundiff P, Beckmann ND, D’Souza SL, Knowles JW, et al. Analysis of transcriptional variability in a large human iPSC library reveals genetic and non-genetic determinants of heterogeneity. Cell Stem Cell. 2022;29(10):1505.[DOI]
-
27. Kim K, Rui Z, Doi A, Ng K, Unternaehrer J, Cahan P, et al. Donor cell type can influence the epigenome and differentiation potential of human induced pluripotent stem cells. Nat Biotechnol. 2011;29(12):1117-1119.[DOI]
-
28. Jung S, Aliberti J, Graemmel P, Sunshine MJ, Kreutzberg GW, Sher A, et al. Analysis of fractalkine receptor CX3CR1 function by targeted deletion and green fluorescent protein reporter gene insertion. Mol Cell Biol. 2000;20(11):4106-4114.[DOI]
-
29. Riedl J, Flynn KC, Raducanu A, Gärtner F, Beck G, Bösl M, et al. Lifeact mice for studying F-actin dynamics. Nat Methods. 2010;7(3):168-169.[DOI]
-
30. Halle A, Hornung V, Petzold GC, Stewart CR, Monks BG, Reinheckel T, et al. The NALP3 inflammasome is involved in the innate immune response to amyloid-β. Nat Immunol. 2008;9(8):857-865.[DOI]
-
31. Collier TO, Anderson JM, Kikuchi A, Okano T. Adhesion behavior of monocytes, macrophages, and foreign body giant cells on poly (N-isopropylacrylamide) temperature-responsive surfaces. J Biomed Mater Res. 2002;59(1):136-143.[DOI]
-
32. Nakajima K, Honda S, Nakamura Y, López-Redondo F, Kohsaka S, Yamato M, et al. Intact microglia are cultured and non-invasively harvested without pathological activation using a novel cultured cell recovery method. Biomaterials. 2001;22(11):1213-1223.[DOI]
-
34. Hansen JN, Brückner M, Pietrowski MJ, Jikeli JF, Plescher M, Beckert H, et al. MotiQ: An open-source toolbox to quantify the cell motility and morphology of microglia. Mol Biol Cell. 2022;33(11):ar99.[DOI]
-
35. Otsu N. A threshold selection method from gray-level histograms. Automatica. 1975;11:285-296. Available from: https://www.scirp.org/reference/referencespapers?referenceid=2755004
-
36. Hamill OP, Marty A, Neher E, Sakmann B, Sigworth FJ. Improved patch-clamp techniques for high-resolution current recording from cells and cell-free membrane patches. Pflugers Arch. 1981;391(2):85-100.[DOI]
-
37. Picelli S, Faridani OR, Björklund ÅK, Winberg G, Sagasser S, Sandberg R. Full-length RNA-seq from single cells using Smart-seq2. Nat Protoc. 2014;9(1):171-181.[DOI]
-
38. Soneson C, Love MI, Robinson MD. Differential analyses for RNA-seq: Transcript-level estimates improve gene-level inferences. F1000Res. 2016;4:1521.[DOI]
-
39. Love MI, Huber W, Anders S. Moderated estimation of fold change and dispersion for RNA-seq data with DESeq2. Genome Biol. 2014;15(12):550.[DOI]
-
41. Gu Z. Complex heatmap visualization. iMeta. 2022;1(3):e43.[DOI]
-
42. Siddiqui T, Celikkaya H, Atasavum ZT, Popova S, Freudenberg U, Werner C, et al. Three-dimensional biohybrid StarPEG–heparin hydrogel cultures for modeling human neuronal development and Alzheimer’s disease pathology. Methods Mol Biol. 2023;2561:159-170.[DOI]
-
43. Soles A, Selimovic A, Sbrocco K, Ghannoum F, Hamel K, Moncada EL, et al. Extracellular matrix regulation in physiology and in brain disease. Int J Mol Sci. 2023;24(8):7049.[DOI]
-
44. Davalos D, Grutzendler J, Yang G, Kim JV, Zuo Y, Jung S, et al. ATP mediates rapid microglial response to local brain injury in vivo. Nat Neurosci. 2005;8(6):752-758.[DOI]
-
45. Joseph A, Power D, Schallek J. Imaging the dynamics of individual processes of microglia in the living retina in vivo. Biomed Opt Express. 2021;12(10):6157.[DOI]
-
46. Siddiqui TA, Lively S, Vincent C, Schlichter LC. Regulation of podosome formation, microglial migration and invasion by Ca2+-signaling molecules expressed in podosomes. J Neuroinflammation. 2012;9:250.[DOI]
-
47. Chinnathambi S, Das R. Microglia degrade Tau oligomers deposit via purinergic P2Y12-associated podosome and filopodia formation and induce chemotaxis. Cell Biosci. 2023;13:95.[DOI]
-
48. Wiesner C, Le-Cabec V, El Azzouzi K, Maridonneau-Parini I, Linder S. Podosomes in space: Macrophage migration and matrix degradation in 2D and 3D settings. Cell Adh Migr. 2014;8(3):179-191.[DOI]
-
49. Etebar F, White AR, Quek H. Microglial heterogeneity: Influence of human 2D, 3D, and co-culture models on gene expression and immune function. Front Cell Neurosci. 2026;20:1770518.[DOI]
-
50. Plescher M, Seifert G, Hansen JN, Bedner P, Steinhäuser C, Halle A. Plaque-dependent morphological and electrophysiological heterogeneity of microglia in an Alzheimer’s disease mouse model. Glia. 2018;66(7):1464-1480.[DOI]
-
51. Kikhia M, Schilling S, Herzog ML, Livne M, Semtner M, Tay TL, et al. Multicolor fate mapping of microglia reveals polyclonal proliferation, heterogeneity, and cell-cell interactions after ischemic stroke in mice. Nat Commun. 2025;16:8294.[DOI]
-
53. Krasemann S, Madore C, Cialic R, Baufeld C, Calcagno N, El Fatimy R, et al. The TREM2-APOE pathway drives the transcriptional phenotype of dysfunctional microglia in neurodegenerative diseases. Immunity. 2017;47(3):566-581.[DOI]
-
54. Bennett ML, Bennett FC, Liddelow SA, Ajami B, Zamanian JL, Fernhoff NB, et al. New tools for studying microglia in the mouse and human CNS. Proc Natl Acad Sci U S A. 2016;113(12):E1738-E1746.[DOI]
-
55. Cheng YH, Ho MS. Disease-associated microglia in neurodegenerative diseases: Friend or foe? PLoS Biol. 2025;23(10):e3003426.[DOI]
-
56. Gustin A, Kirchmeyer M, Koncina E, Felten P, Losciuto S, Heurtaux T, et al. NLRP3 inflammasome is expressed and functional in mouse brain microglia but not in astrocytes. PLoS One. 2015;10(6):e0130624.[DOI]
-
57. Healy LM, Perron G, Won SY, Michell-Robinson MA, Rezk A, Ludwin SK, et al. MerTK is a functional regulator of myelin phagocytosis by human myeloid cells. J Immunol. 2016;196(8):3375-3384.[DOI]
-
58. Gao C, Jiang J, Tan Y, Chen S. Microglia in neurodegenerative diseases: Mechanism and potential therapeutic targets. Sig Transduct Target Ther. 2023;8:359.[DOI]
-
59. Deerhake ME, Shinohara ML. Emerging roles of Dectin-1 in noninfectious settings and in the CNS. Trends Immunol. 2021;42(10):891-903.[DOI]
-
60. Haynes SE, Hollopeter G, Yang G, Kurpius D, Dailey ME, Gan WB, et al. The P2Y12 receptor regulates microglial activation by extracellular nucleotides. Nat Neurosci. 2006;9(12):1512-1519.[DOI]
-
61. Rustenhoven J, Park TI, Schweder P, Scotter J, Correia J, Smith AM, et al. Isolation of highly enriched primary human microglia for functional studies. Sci Rep. 2016;6:19371.[DOI]
-
62. Walker DG, Lue LF. Immune phenotypes of microglia in human neurodegenerative disease: Challenges to detecting microglial polarization in human brains. Alzheimers Res Ther. 2015;7:56.[DOI]
-
63. Lan Y, Zhang X, Liu S, Guo C, Jin Y, Li H, et al. Fate mapping of Spp1 expression reveals age-dependent plasticity of disease-associated microglia-like cells after brain injury. Immunity. 2024;57(2):349-363.[DOI]
-
64. Timmerman R, Burm SM, Bajramovic JJ. An overview of in vitro methods to study microglia. Front Cell Neurosci. 2018;12:242.[DOI]
-
65. Wareham LK, Baratta RO, Del Buono BJ, Schlumpf E, Calkins DJ. Collagen in the central nervous system: Contributions to neurodegeneration and promise as a therapeutic target. Mol Neurodegener. 2024;19:11.[DOI]
-
66. Meizlish ML, Kimura Y, Pope SD, Matta R, Kim C, Philip NH, et al. Mechanosensing regulates tissue repair program in macrophages. Sci Adv. 2024;10(11):eadk6906.[DOI]
-
67. Muffat J, Li Y, Yuan B, Mitalipova M, Omer A, Corcoran S, et al. Efficient derivation of microglia-like cells from human pluripotent stem cells. Nat Med. 2016;22(11):1358-1367.[DOI]
-
68. Evans JG, Matsudaira P. Structure and dynamics of macrophage podosomes. Eur J Cell Biol. 2006;85:145-149.[DOI]
-
69. Vincent C, Siddiqui TA, Schlichter LC. Podosomes in migrating microglia: Components and matrix degradation. J Neuroinflammation. 2012;9:190.[DOI]
-
70. Bernier LP, Bohlen CJ, York EM, Choi HB, Kamyabi A, Dissing-Olesen L, et al. Nanoscale surveillance of the brain by microglia via cAMP-regulated filopodia. Cell Rep. 2019;27(10):2895-2908.[DOI]
-
71. Kessels S, Trippaers C, Mertens M, Hamad I, Rombaut B, Janssen A, et al. Cytoskeletal control in adult microglia is essential to restore neurodevelopmental synaptic and cognitive deficits. Sci Adv. 2025;11(35):eadw0128.[DOI]
-
72. Socodato R, Relvas JB. A cytoskeleton symphony: Actin and microtubules in microglia dynamics and aging. Prog Neurobiol. 2024;234:102586.[DOI]
-
73. Tremblay MÈ, Lowery RL, Majewska AK. Microglial interactions with synapses are modulated by visual experience. PLoS Biol. 2010;8(11):e1000527.[DOI]
-
74. Li Y, Du XF, Liu CS, Wen ZL, Du JL. Reciprocal regulation between resting microglial dynamics and neuronal activity in vivo. Dev Cell. 2012;23(6):1189-1202.[DOI]
-
75. Yong VW, Power C, Forsyth P, Edwards DR. Metalloproteinases in biology and pathology of the nervous system. Nat Rev Neurosci. 2001;2(7):502-511.[DOI]
-
76. Lively S, Schlichter LC. The microglial activation state regulates migration and roles of matrix-dissolving enzymes for invasion. J Neuroinflammation. 2013;10:843.[DOI]
-
77. Nuttall RK, Silva C, Hader W, Bar-Or A, Patel KD, Edwards DR, et al. Metalloproteinases are enriched in microglia compared with leukocytes and they regulate cytokine levels in activated microglia. Glia. 2007;55(5):516-526.[DOI]
-
78. Svoboda DS, Barrasa MI, Shu J, Rietjens R, Zhang S, Mitalipova M, et al. Human iPSC-derived microglia assume a primary microglia-like state after transplantation into the neonatal mouse brain. Proc Natl Acad Sci U S A. 2019;116(50):25293-25303.[DOI]
-
79. Pannell M, Szulzewsky F, Matyash V, Wolf SA, Kettenmann H. The subpopulation of microglia sensitive to neurotransmitters/neurohormones is modulated by stimulation with LPS, interferon-γ, and IL-4. Glia. 2014;62(5):667-679.[DOI]
-
80. Paolicelli RC, Sierra A, Stevens B, Tremblay ME, Aguzzi A, Ajami B, et al. Microglia states and nomenclature: A field at its crossroads. Neuron. 2022;110(21):3458-3483.[DOI]
-
81. Mayer M, Taveras EF, Mass E. Ontogeny and function of microglia and nerve-associated macrophages. Adv Immunol. 2025;167:91-122.[DOI]
-
82. Blank N, Mayer M, Mass E. The development and physiological and pathophysiological functions of resident macrophages and glial cells. Adv Immunol. 2021;151:1-47.[DOI]
-
84. Walker DG, Tang TM, Mendsaikhan A, Tooyama I, Serrano GE, Sue LI, et al. Patterns of expression of purinergic receptor P2RY12, a putative marker for non-activated microglia, in aged and Alzheimer’s disease brains. Int J Mol Sci. 2020;21(2):678.[DOI]
-
85. Zhu C, Kros JM, van der Weiden M, Zheng P, Cheng C, Mustafa DAM. Expression site of P2RY12 in residential microglial cells in astrocytomas correlates with M1 and M2 marker expression and tumor grade. Acta Neuropathol Commun. 2017;5:4.[DOI]
-
86. Eder C. Regulation of microglial behavior by ion channel activity. J Neurosci Res. 2005;81(3):314-321.[DOI]
-
87. Nevelchuk S, Brawek B, Schwarz N, Valiente-Gabioud A, Wuttke TV, Kovalchuk Y, et al. Morphotype-specific calcium signaling in human microglia. J Neuroinflammation. 2024;21:175.[DOI]
-
88. Laprell L, Schulze C, Brehme ML, Oertner TG. The role of microglia membrane potential in chemotaxis. J Neuroinflammation. 2021;18(1):21.[DOI]
-
89. Boucsein C, Kettenmann H, Nolte C. Electrophysiological properties of microglial cells in normal and pathologic rat brain slices. Eur J Neurosci. 2000;12(6):2049-2058.[DOI]
-
90. Abbas ZN, Al-Saffar AZ, Jasim SM, Sulaiman GM. Comparative analysis between 2D and 3D colorectal cancer culture models for insights into cellular morphological and transcriptomic variations. Sci Rep. 2023;13:18380.[DOI]
-
92. Chen H, Seaman L, Liu S, Ried T, Rajapakse I. Chromosome conformation and gene expression patterns differ profoundly in human fibroblasts grown in spheroids versus monolayers. Nucleus. 2017;8(4):383-391.[DOI]
-
93. Cuní-López C, Stewart R, Oikari LE, Nguyen TH, Roberts TL, Sun Y, et al. Advanced patient-specific microglia cell models for pre-clinical studies in Alzheimer’s disease. J Neuroinflammation. 2024;21:50.[DOI]
-
94. Li Q, Barres BA. Microglia and macrophages in brain homeostasis and disease. Nat Rev Immunol. 2018;18(4):225-242.[DOI]
-
96. Wanke F, Gutbier S, Rümmelin A, Steinberg M, Hughes LD, Koenen M, et al. Ligand-dependent kinase activity of MERTK drives efferocytosis in human iPSC-derived macrophages. Cell Death Dis. 2021;12(6):538.[DOI]
-
97. Hasselmann J, Blurton-Jones M. Human iPSC-derived microglia: A growing toolset to study the brain’s innate immune cells. Glia. 2020;68(4):721-739.[DOI]
-
98. Cerneckis J, Cai H, Shi Y. Induced pluripotent stem cells (iPSCs): Molecular mechanisms of induction and applications. Sig Transduct Target Ther. 2024;9:112.[DOI]
-
99. Rao Y, Peng B. Allogenic microglia replacement: A novel therapeutic strategy for neurological disorders. Fundam Res. 2024;4(2):237-245.[DOI]
-
100. Luo EY, Sugimura RR. Taming microglia: The promise of engineered microglia in treating neurological diseases. J Neuroinflammation. 2024;21:19.[DOI]
-
101. Douvaras P, Buenaventura DF, Sun B, Lepack A, Baker E, Simpson E, et al. Ready-to-use iPSC-derived microglia progenitors for the treatment of CNS disease in mouse models of neuropathic mucopolysaccharidoses. Nat Commun. 2024;15:8132.[DOI]
-
102. Dolan MJ, Therrien M, Jereb S, Kamath T, Gazestani V, Atkeson T, et al. Exposure of iPSC-derived human microglia to brain substrates enables the generation and manipulation of diverse transcriptional states in vitro. Nat Immunol. 2023;24(8):1382-1390.[DOI]
-
103. Badanjak K, Mulica P, Smajic S, Delcambre S, Tranchevent LC, Diederich N, et al. iPSC-derived microglia as a model to study inflammation in idiopathic Parkinson’s disease. Front Cell Dev Biol. 2021;9:740758.[DOI]
-
104. Wolff L, Hendrix S. Rethinking matrigel: The complex journey to matrix alternatives in organoid culture. Adv Sci. 2025;12(47):e08734.[DOI]
Copyright
© The Author(s) 2026. This is an Open Access article licensed under a Creative Commons Attribution 4.0 International License (https://creativecommons.org/licenses/by/4.0/), which permits unrestricted use, sharing, adaptation, distribution and reproduction in any medium or format, for any purpose, even commercially, as long as you give appropriate credit to the original author(s) and the source, provide a link to the Creative Commons license, and indicate if changes were made.
Publisher’s Note
Science Exploration remains a neutral stance on jurisdictional claims in published
maps
and institutional affiliations. The views expressed in this article are solely those
of
the author(s) and do not reflect the opinions of the Editors or the publisher.
Share And Cite


Science Exploration Style
Tambe BA, Mayer ML, Kozlov S, Husch A, Bradke F, Händler K, et al. 3D culture systems as a tool for recapitulating in vivo-like phenotypes in murine and human microglia. Myeloid Cells. 2026;1:202602. https://doi.org/10.70401/mc.2026.0006
Tips
Copy completed.
Submit a Manuscript
Author Instructions
Cite this Article
Article Metrics
0
View
0
Download
Cited
Article Updates

- Abstract
- Keywords
- 1. Introduction
- 2. Materials and Methods
- 3. Human Models and Experimental Procedures
- 4. Results
- 5. Discussion
- 6. Limitations
- 7. Conclusion
- Supplementary materials
- Acknowledgements
- Authors contribution
- Conflicts of interest
- Ethical approval
- Consent to participate
- Consent for publication
- Availability of data and materials
- Funding
- References
- Copyright
Science Exploration Style
Tambe BA, Mayer ML, Kozlov S, Husch A, Bradke F, Händler K, et al. 3D culture systems as a tool for recapitulating in vivo-like phenotypes in murine and human microglia. Myeloid Cells. 2026;1:202602. https://doi.org/10.70401/mc.2026.0006
copy
Share Link
copy